


 , Lijun Zhang 2,*
1 Institute of Fundamental and Frontier Sciences, University of Electronic Science and Technology of China, 610054 Chengdu, Sichuan, China
2 School of Applied Chemistry and Biological Technology, Shenzhen Polytechnic, 518055 Shenzhen, Guangdong, China
3 Yangtze Delta Region Institute (Quzhou), University of Electronic Science and Technology of China, 324022 Quzhou, Zhejiang, China
4 Genetics Department, Faculty of Agriculture, Beni-Suef University, 62511 Beni-Suef, Egypt
5 School of Electronic and Communication Engineering, Shenzhen Polytechnic, 518055 Shenzhen, Guangdong, China
6 Department of Dentistry, Beidahuang Industry Group General Hospital, 150088 Harbin, Heilongjiang, China
†These authors contributed equally.
Academic Editor: Graham Pawelec
Abstract
Background: Channel proteins are proteins that can transport molecules past the plasma membrane through free diffusion movement. Due to the cost of labor and experimental methods, developing a tool to identify channel proteins is necessary for biological research on channel proteins. Methods: 17 feature coding methods and four machine learning classifiers to generate 68-dimensional data probability features. Then, the two-step feature selection strategy was used to optimize the features, and the final prediction Model M16-LGBM (light gradient boosting machine) was obtained on the 16-dimensional optimal feature vector. Results: A new predictor, CAPs-LGBM, was proposed to identify the channel proteins effectively. Conclusions: CAPs-LGBM is the first channel protein machine learning predictor was used to construct the final prediction model based on protein primary sequences. The classifier performed well in the training and test sets.
Keywords
- channel protein
- computational prediction
- light gradient boosting machine
- PPI network
- feature selection
Channel proteins are a type of cross plasma membrane that can transport molecules of appropriate size and charged molecules from one side of the plasma membrane to the other through free diffusion motion. Channel proteins can be monomer proteins or proteins composed of multiple subunits. They are rearranged through hydrophobic amino acid chains to form aqueous channels. They do not directly interact with small charged molecules, which can diffuse freely through the aqueous channels formed by the charged hydrophilic regions of membrane proteins in lipid bilayers. The transport of channel proteins possesses a selective function, so there are various channel proteins in the cell membrane.
With high mortality, cancer is one of the most catastrophic diseases causing
millions of deaths worldwide every year [1, 2, 3]. Therefore, research on the
mechanism of cancer occurrence and development is still a research hotspot.
However, although significant progress has been made in cancer research, there
are still no good treatment strategies for cancer because the mechanism of cancer
occurrence and development is too complex. Previous studies have suggested that
abnormalities in channel proteins in some signaling pathways can promote the
occurrence and development of cancer. For instance, chloride intracellular
channel 1 (CLIC1) is a chloride channel protein. The upregulated expression of
CLIC1 is positively related to cell proliferation, invasion, migration, and
angiogenesis. Chloride intracellular channel 1 promotes the progression of oral
squamous cell carcinoma, and its potential mechanism may be correlated with
ITG
Recent studies have shown that machine learning-based methods have been well developed, especially those related to effective feature representation algorithms [8, 9, 10]. At present, various sequences based on feature descriptors are obtained from many studies [11, 12, 13]. Taking various types of features to train classifiers is a simple method to build predictive models. A high feature dimension of integration will lead to dimension disaster, and simple integration will lead to information redundancy. One efficient way to reduce the dimension is feature selection [14]. These problems will affect the prediction performance of the model. A more effective method is necessary to use feature information. In addition, most existing feature descriptors only use sequence information to build prediction models. This may not be enough to provide enough information to accurately distinguish between real CAPs and no-CAPs. Efficient computational identification tools are good choices; however, current research efforts in this area are lacking. Due to their efficiency and convenience, machine learning-based methods have been widely used in protein function prediction [12, 15, 16, 17, 18, 19, 20, 21]. Therefore, it is desirable to research reliable and effective machine learning tools for CAP identification.
In this research, Metascape was applied for the enrichment and network analysis of the biological functions of channel proteins. CAPs-LGBM is the first software model that can classify proteins as CAPs or no-CAPs. We establish the first benchmark dataset composed of 914 CAPs and 914 non-CAPs, which is publicly available to ensure the reproducibility of the proposed predictor. On this basis, we studied the feature representation learning strategy that integrates the prediction probability information into the newly derived features. To improve the prediction performance, a two-step feature optimization protocol was adopted to manually select the optimal feature subset containing 16 information features. Based on the optimal 16-dimensional probability feature, a sequence-based CAP predictor CAPs-LGBM was constructed. The results suggest that the proposed prediction model has good recognition performance. The overall framework of CAPs-LGBM is shown in Fig. 1. The prediction of channel proteins is a novel work, and there is no previous research on it. The prediction accuracy of the model has a high accuracy in our research. Meanwhile, we also optimized the prediction algorithm and developed a user-friendly online server. The model is a quick and effective way to predict whether a protein is a channel protein or not. The website is http://lab.malab.cn/~acy/CAPs-LGBM. It has the potential to promote future computing work in this field.
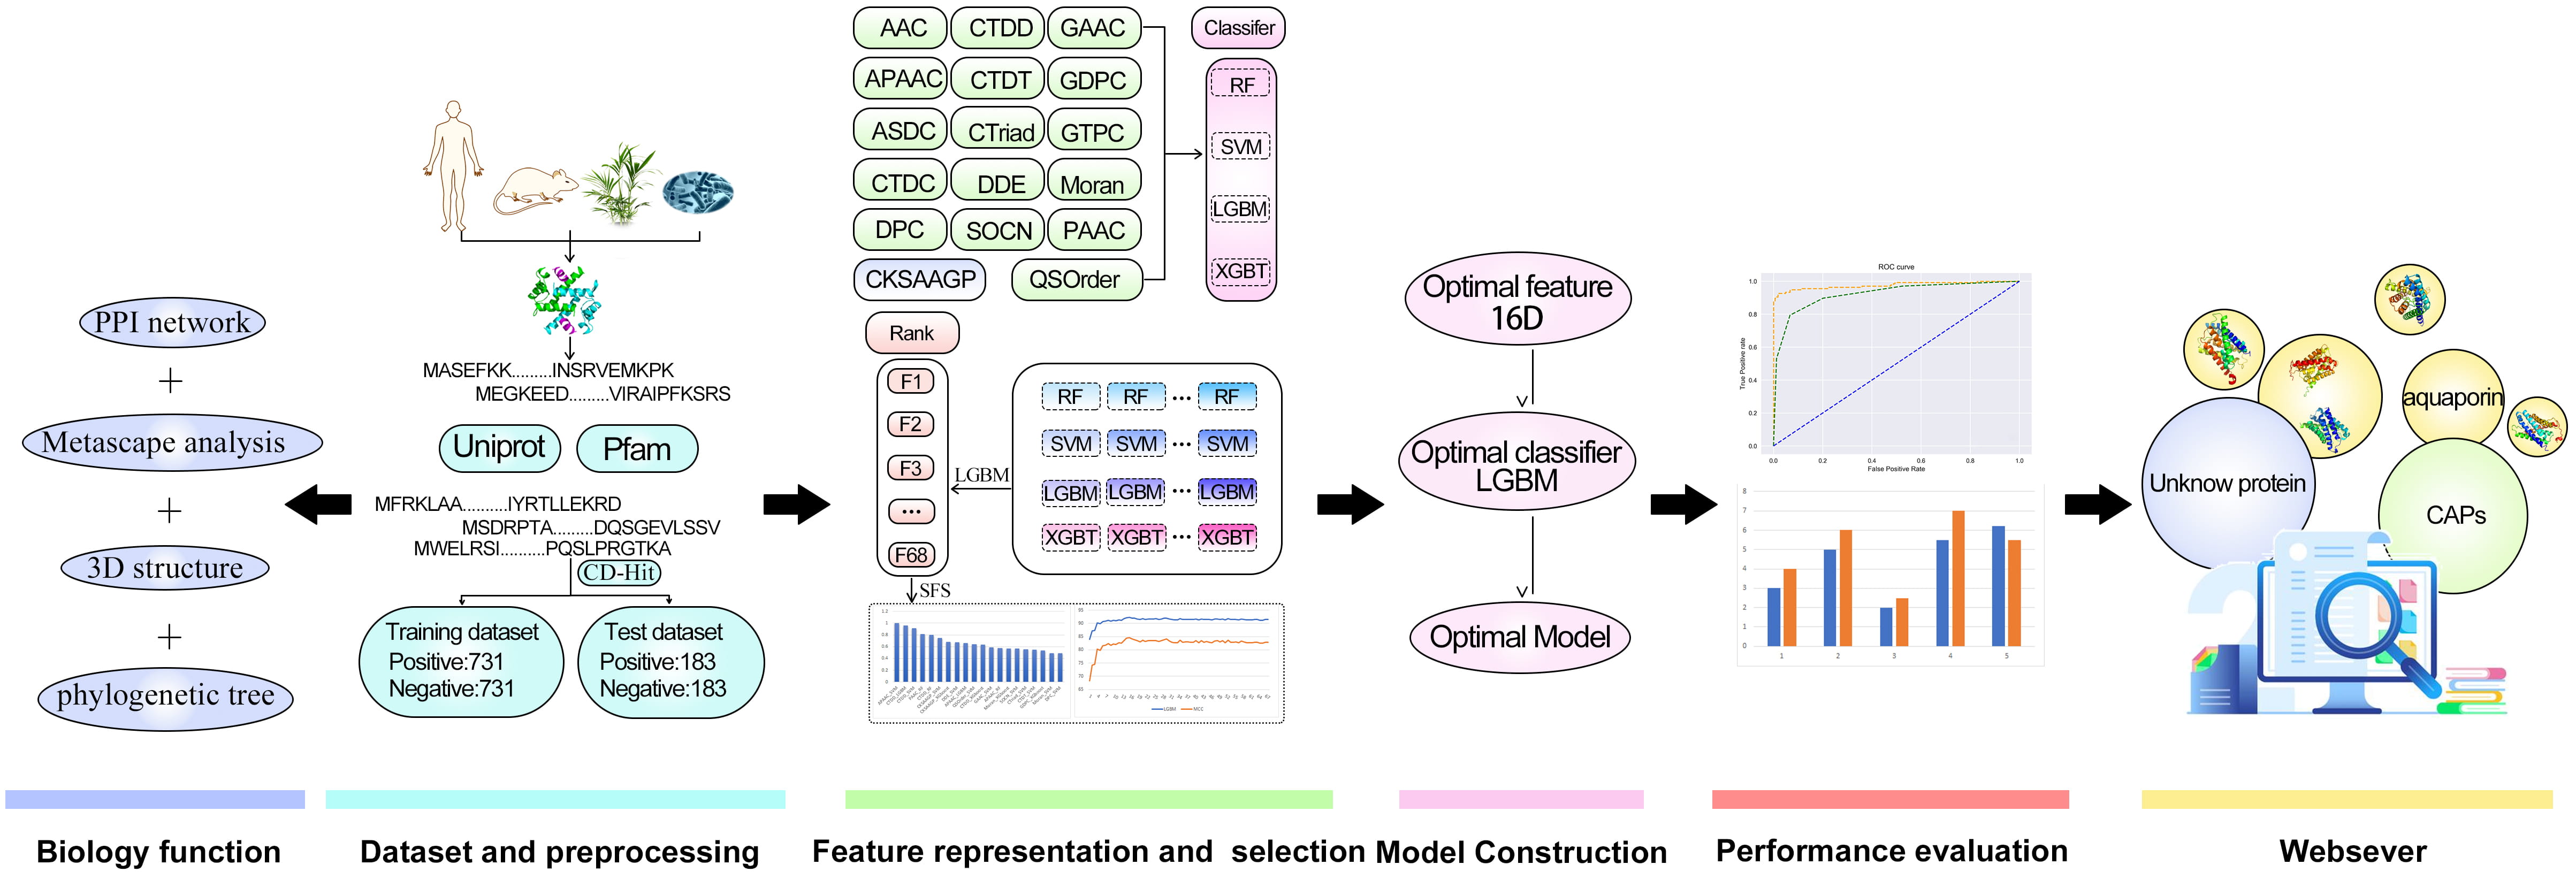 Fig. 1.
The framework of CAPs-LGBM for channel protein identification.
To establish a reliable and robust CAP-LGBM predictor, a well-prepared dataset is essential. CAP and non-CAP protein sequences are composed of a positive and negative dataset for binary prediction model construction. CAP sequences were downloaded from the UniProt database (UniProtKB version 2021_03, https://www.UniProt.org/) [22]. “channel protein and reviews: Yes” was applied as the keyword to search the protein sequences. A total of 18,375 protein sequences were obtained from the UniProt database, and 2105 channel proteins were selected according to the functional annotation as the selection criteria for positive samples. Negative samples were selected from the protein family database (Pfam, version 35.0, http://pfam.xfam.org/) [23]. There are two principles for negative dataset selection: (Ⅰ) each negative sample is the longest sequence from different protein families; (II) samples from positive families will be removed. Finally, a negative dataset containing CAP protein sequences was established. CD-Hit (V4.8.1) [24] was applied to remove the sequence redundancy for the positive and negative samples to avoid protein homology deviation with the threshold set to 0.8 [25]. Then, 914 CAP protein sequences were selected for machine learning. There is enough protein sequence information for the machine learning algorithm to construct an optimal model for channel proteins. Then, CAP-positive and -negative samples were retained as the channel protein dataset. The original dataset is randomly divided into two subsets at a ratio of 8:2 (Table 1), of which 80% are training sets and the rest are test sets to verify the performance of CAP. The datasets described above are freely available at http://lab.malab.cn/~acy/CAPs-LGBM.
| Dataset | Training | Testing |
| Positive | 731 | 183 |
| Negative | 731 | 183 |
Sufficient feature information from the channel protein sequences is essential
for accurate and reliable bioinformatics model construction [10, 26, 27, 28, 29, 30, 31, 32].
Following previous research [9, 11, 33, 34, 35, 36, 37, 38], we used a feature representation
learning protocol to predict and identify the CAPs. First, 17 feature coding
algorithms were used to construct the initial feature pool to represent the
protein sequence. There were three categories divided by the coding methods: (1)
amino acid composition characteristics features, (2) based on the characteristics
of physical and chemical properties, and (3) features based on sequence order.
All of the above feature descriptors are defined by ilearn tools [39]. In the
second step, four common classifiers, namely, random forest (RF), XGBoost (XGBT)
and SVM, were employed to train on the 17 descriptors to build the baseline
prediction models. Each prediction model will provide both class information
(predicted label) and probabilistic information (predicted confidence). In this
work, we utilized the probabilistic information predicted by each model as a
“feature”. Probability information will be used as the “feature” of each
model in our study, and a 68-dimensional probability feature vector will generate
the prediction models (68 feature descriptors
Classifier choice plays an essential role in machine learning [40, 41, 42]. Various machine-learning algorithms have been applied in machine learning methods [8, 43, 44, 45]. Seventeen descriptors were trained by four common classifiers: random forest (RF), XGBoost (XGBT), and SVM to construct the model. As described in previous research [46, 47, 48], all four classifiers were derived from the scikit-learn package (version 0.24). Finally, a grid search was used to adjust hyperparameters for the classifiers, and the search range is provided in Supplementary Table 1.
In this study, a two-step feature selection method was used to improve the feature representation ability and prediction performance of the models [49]. First, the original feature set was ranked according to the classification importance score. Second, the SFS (sequential forward search) strategy was used to search the optimal feature subset from the feature list in the first step. Generally, feature selection methods are divided into packaging, filtering, and embedding methods [50, 51]. The light gradient boosting machine (LGBM) is a packaging method, and the LGBM model is obtained by inputting the training data, which are sorted according to the importance score of the features. In the SFS step, additional features are obtained in the first step according to the lower to higher rank, and reconstruct the prediction model with various features. The subset with the highest accuracy of the prediction model was determined as the optimal feature set.
The validation strategies of 10-fold cross validation (CV) and testing were used to evaluate the performance of the involved models [13, 52, 53, 54, 55]. The training dataset was randomly divided into 10 subsets of approximately the same size for 10-fold CV validation. The ratio of the training data and the validation dataset was 9:1. The performance of 10 test subsets was averaged, and the result is the overall performance of the 10-fold CV test. Thus, the proposed model is verified more strictly and compared fairly with other methods.
Furthermore, accuracy (Acc), sensitivity (SE), specificity (SP), and Matthew correlation coefficient (MCC) [8, 56, 57] are four common metrics in binary classification tasks. Receiver operating characteristic (ROC) curves were also used to provide intuitive performance comparisons. The area under the ROC curve (AUC) was calculated and used as the main quantitative index of overall performance.
Acc, accuracy; SE, sensitivity; SP, specificity; MCC, Matthew’s correlation; TP, true positive; TN, true negative; FP, false-positive; FN, false negative.
A phylogenetic tree of CAPs was constructed to analyze the evolutionary diversity of the proteins. CAP sequence alignment results were analyzed by muscle software (V3.8.1551) and used to construct a phylogenetic tree using IQ-TREE software (multicore version 1.6.12). The best fitting model for the phylogenetic tree was VT+R6 [58]. The ultrafast bootstrap method was used for phylogenetic assessment, and 1000 replicates per method were chosen in this work [59, 60, 61]. Tree file was visualized by the iTOL website (version 6, https://itol.embl.de/). Phyre2 software (version 2.0, http://www.sbg.bio.ic.ac.uk/phyre2/html/page.cgi?id=index) was applied for the 3D structure prediction of CAPs. The prediction results were visualized by PyMOL (version 2.5.1, DeLano Scientific LLC) software (https://pymol.org/2/).
Metascape (version 3.5, https://metascape.org/gp/index.html#/main/step1), as an
effective tool, can analyze multiple groups of data on multiple platforms [62].
In our research, Metascape was used for enrichment analysis of CAPs. CAPs were
carried out based on pathway enrichment and analysis of molecular function (MF),
biological process (BP) and cell composition (CC) by the Metascape tool based on
the two databases of Kyoto Encyclopedia of Genes and Genomes (KEGG, version
100.0) and Gene Ontology (GO). A network plot was constructed by a subset of
enriched terms to capture the relationships between the terms. Similarity
The results of the phylogenetic tree (Fig. 2) showed that 134 CAP genes were divided into five groups, and the length of branches indicated the genetic relationship of CAP sequences. Among the five groups, Groups I, III, and IV contained two subfamilies. The function of AQPs is as a water molecule transport protein, which belongs to the branch of the fifth family. Calcium channel protein belongs to group IVa, potassium voltage gated channel protein belongs to groups I and III, calcium activated potassium channel subunit belongs to IVa and IIIa, sodium channel protein belongs to Ia and IVa, chloride intracellular channel protein belongs to groups Ia and IIIa, potassium/sodium channel protein belongs to IIIb and IVa. Fig. 3C also indicted the potassium/sodium channel protein involved the transportation of potassium and sodium ions. The volume-regulated anion channel subunit (leucine rich repeat containing protein) belongs to the IIa group.
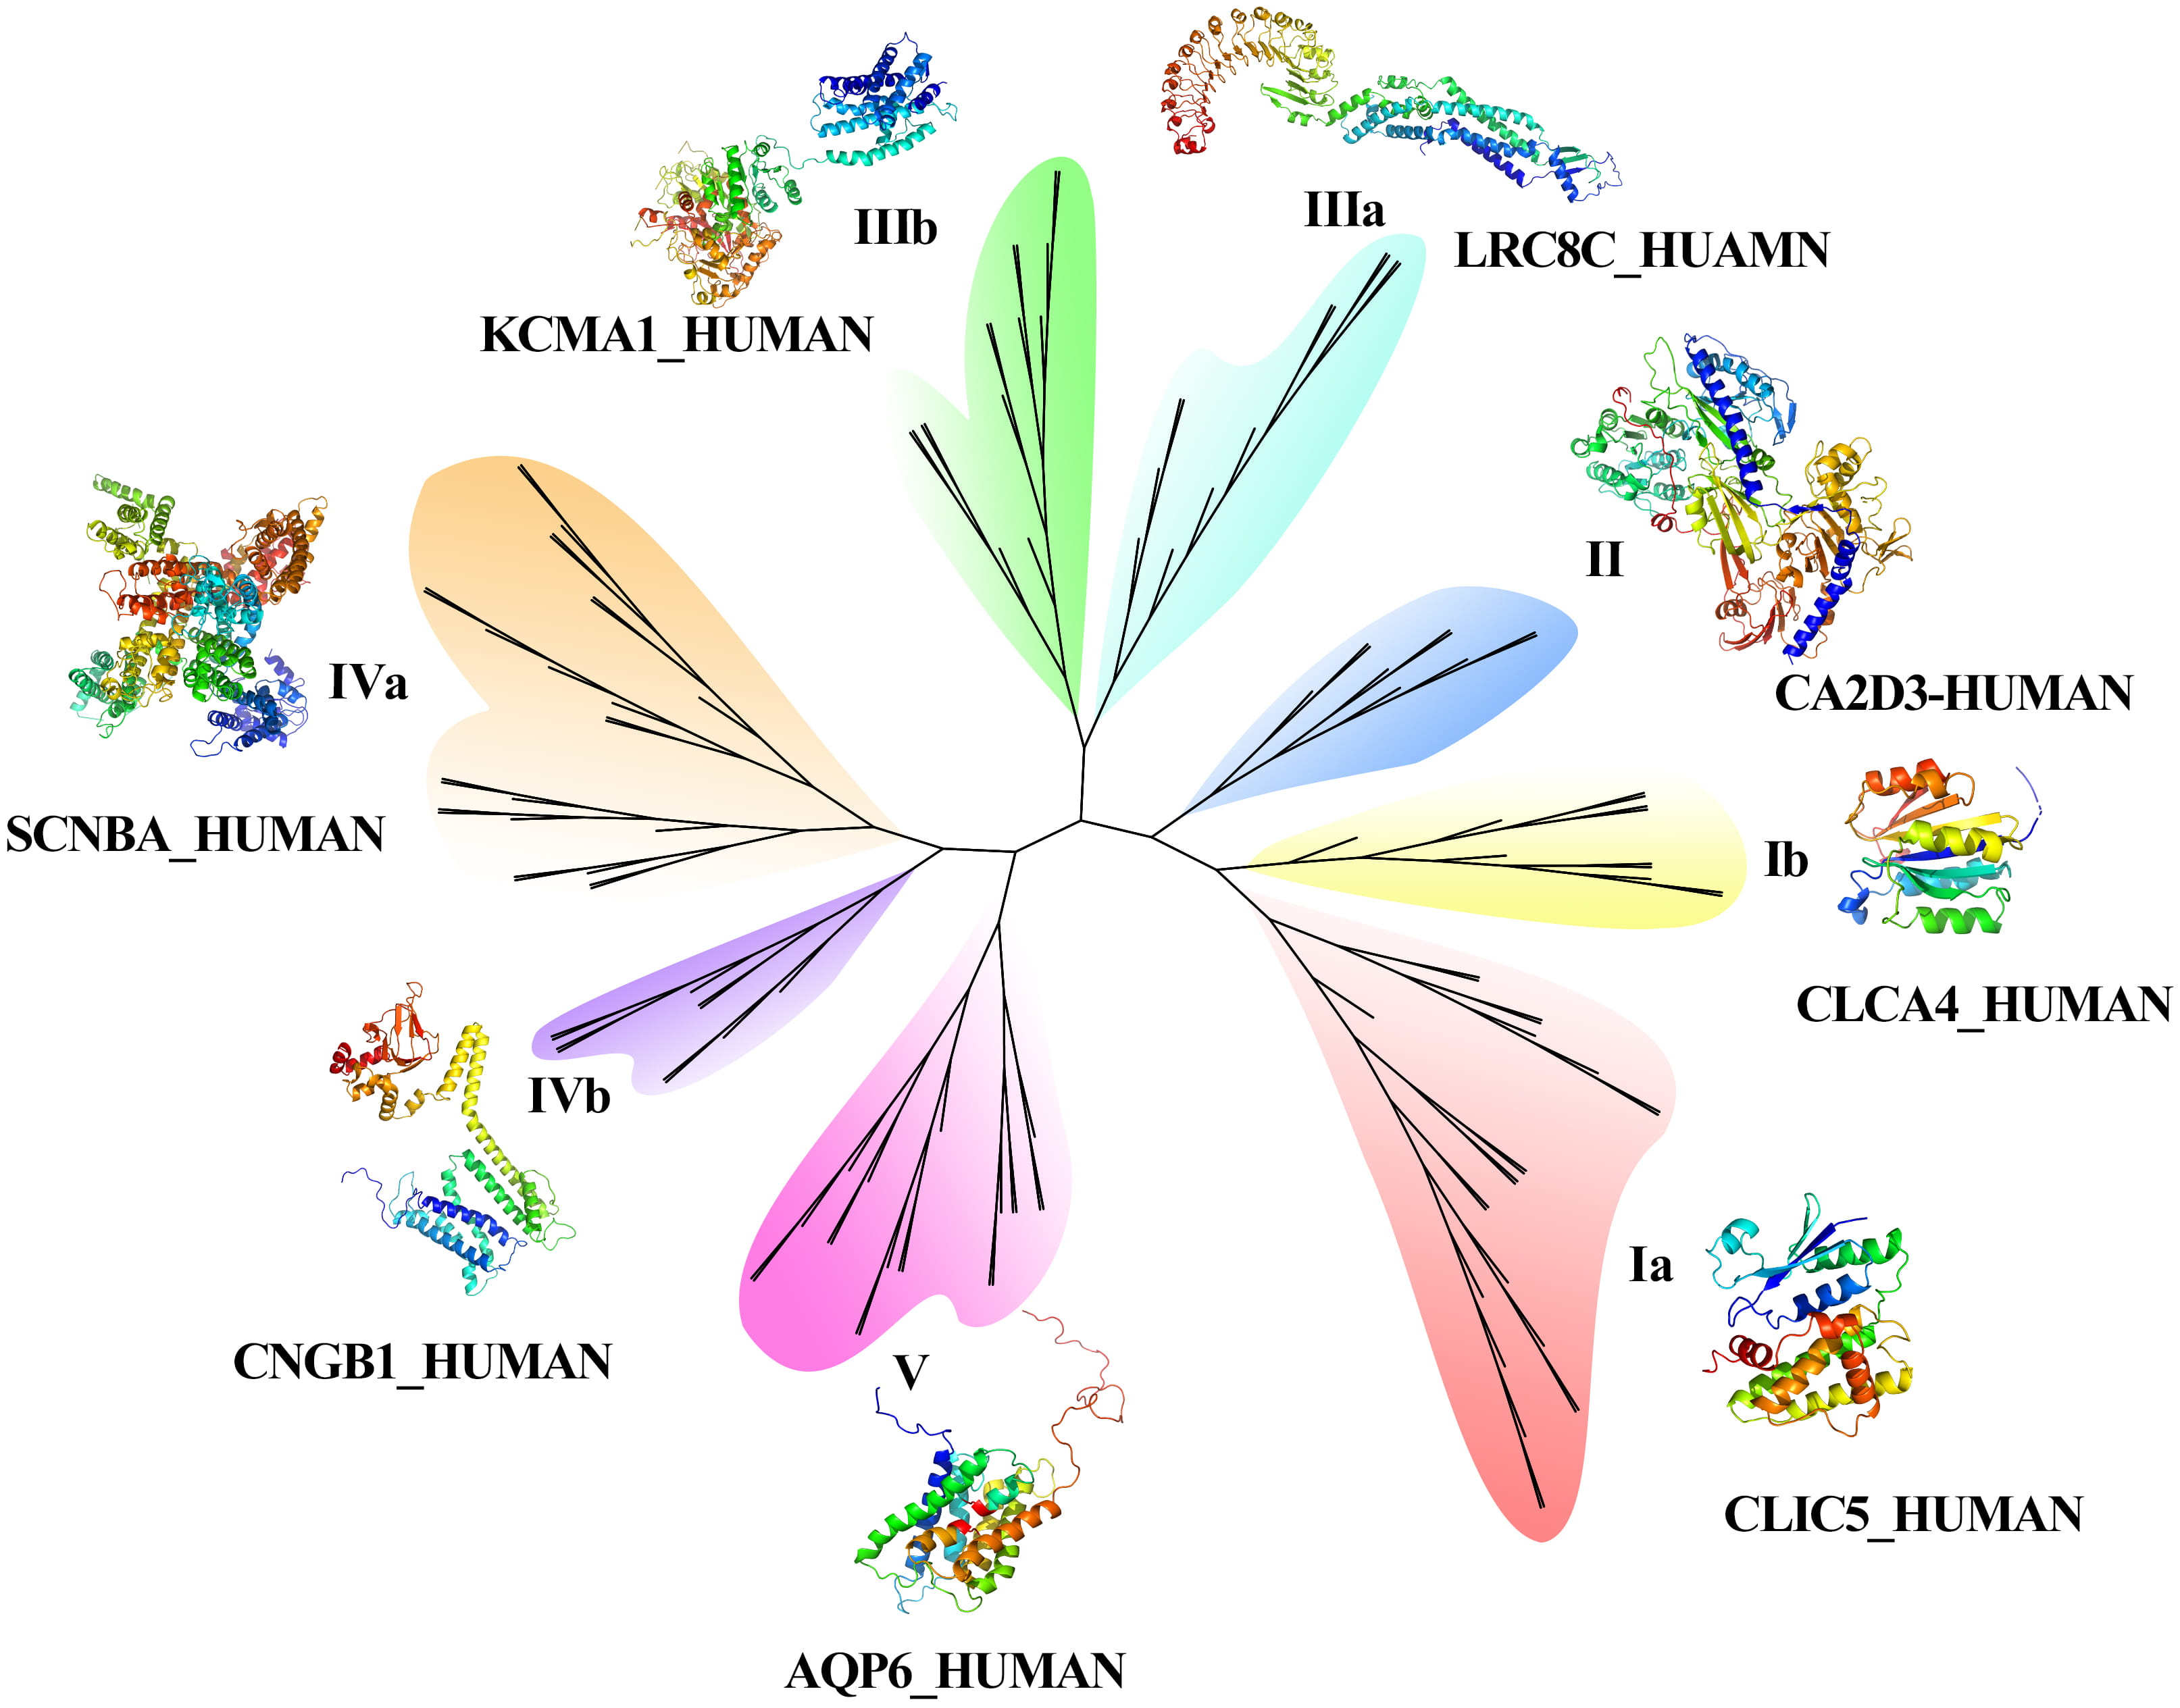 Fig. 2.
Phylogenetic tree and 3D construction of CAPs.
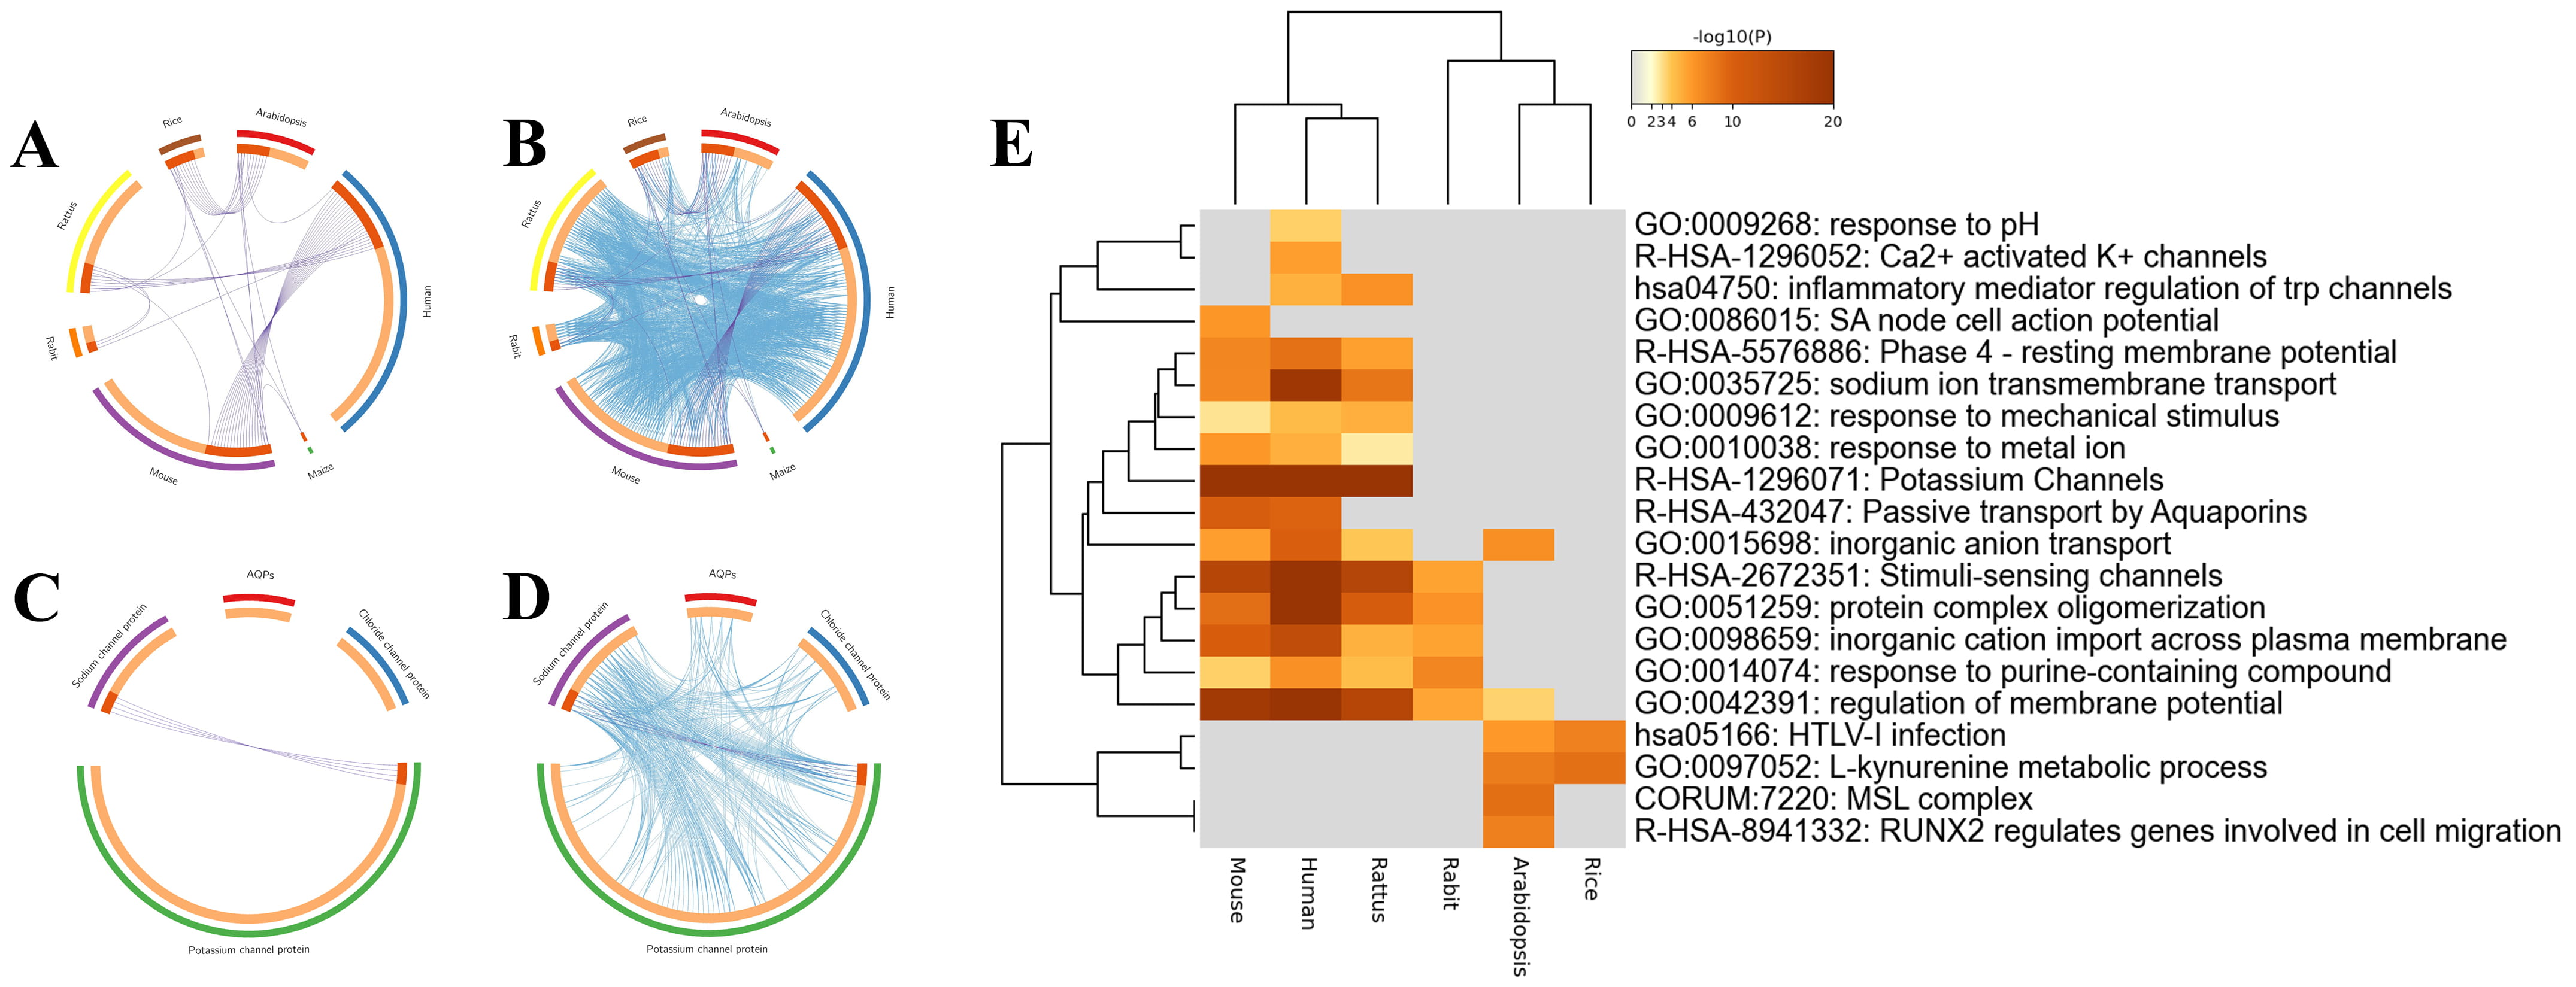 Fig. 3.
Overlaps and heatmap enrichment analysis of CAPs and their coexpressed genes. (A,B) Overlap circus plot among CAPs of different species. (C,D) Overlap circus plot among CAPs of different functions. (E) Heatmap of enriched terms among CAPs.
The secondary structure of CAPs includes
To identify the interaction and internal mechanism of CAP coexpressed genes, Metascape was applied to analyze the overlapping genes, enrichment, PPI network, and MCODE of CAPs and their coexpressed genes. First, the overlap analysis of coexpressed genes was divided into two methods. Specific overlapping genes were found in the coexpressed genes of CAPs of different species (Fig. 3A,B). According to the classification of channel proteins, only potassium channels and sodium channels have overlapping genes. Aquaporins and chloride channel proteins are specific molecules and ion channels, and there were no overlapping genes (Fig. 3C,D).
A total of 134 human channel proteins were screened from the positive case set for Metascape analysis. These genes were enriched based on the David database and Gene Ontology (GO). As shown in Fig. 3E, CAPs and their coexpressed genes were primarily enriched in potassium channels (R-HSA-1296071), stimuli-sensing channels (R-HSA-2672351), and regulation of membrane potential (GO:0042391).
To better understand the relationships between the terms, a network plot of enriched terms was constructed. As shown in Fig. 4A, there were 111 GO BP, 13 KEGG pathways, and 27 reaction gene sets. The data show that CAPs are enriched in potassium channels, regulation of membrane potential, stimuli sensing channels, protein complex oligomerization, and sodium ion transport.
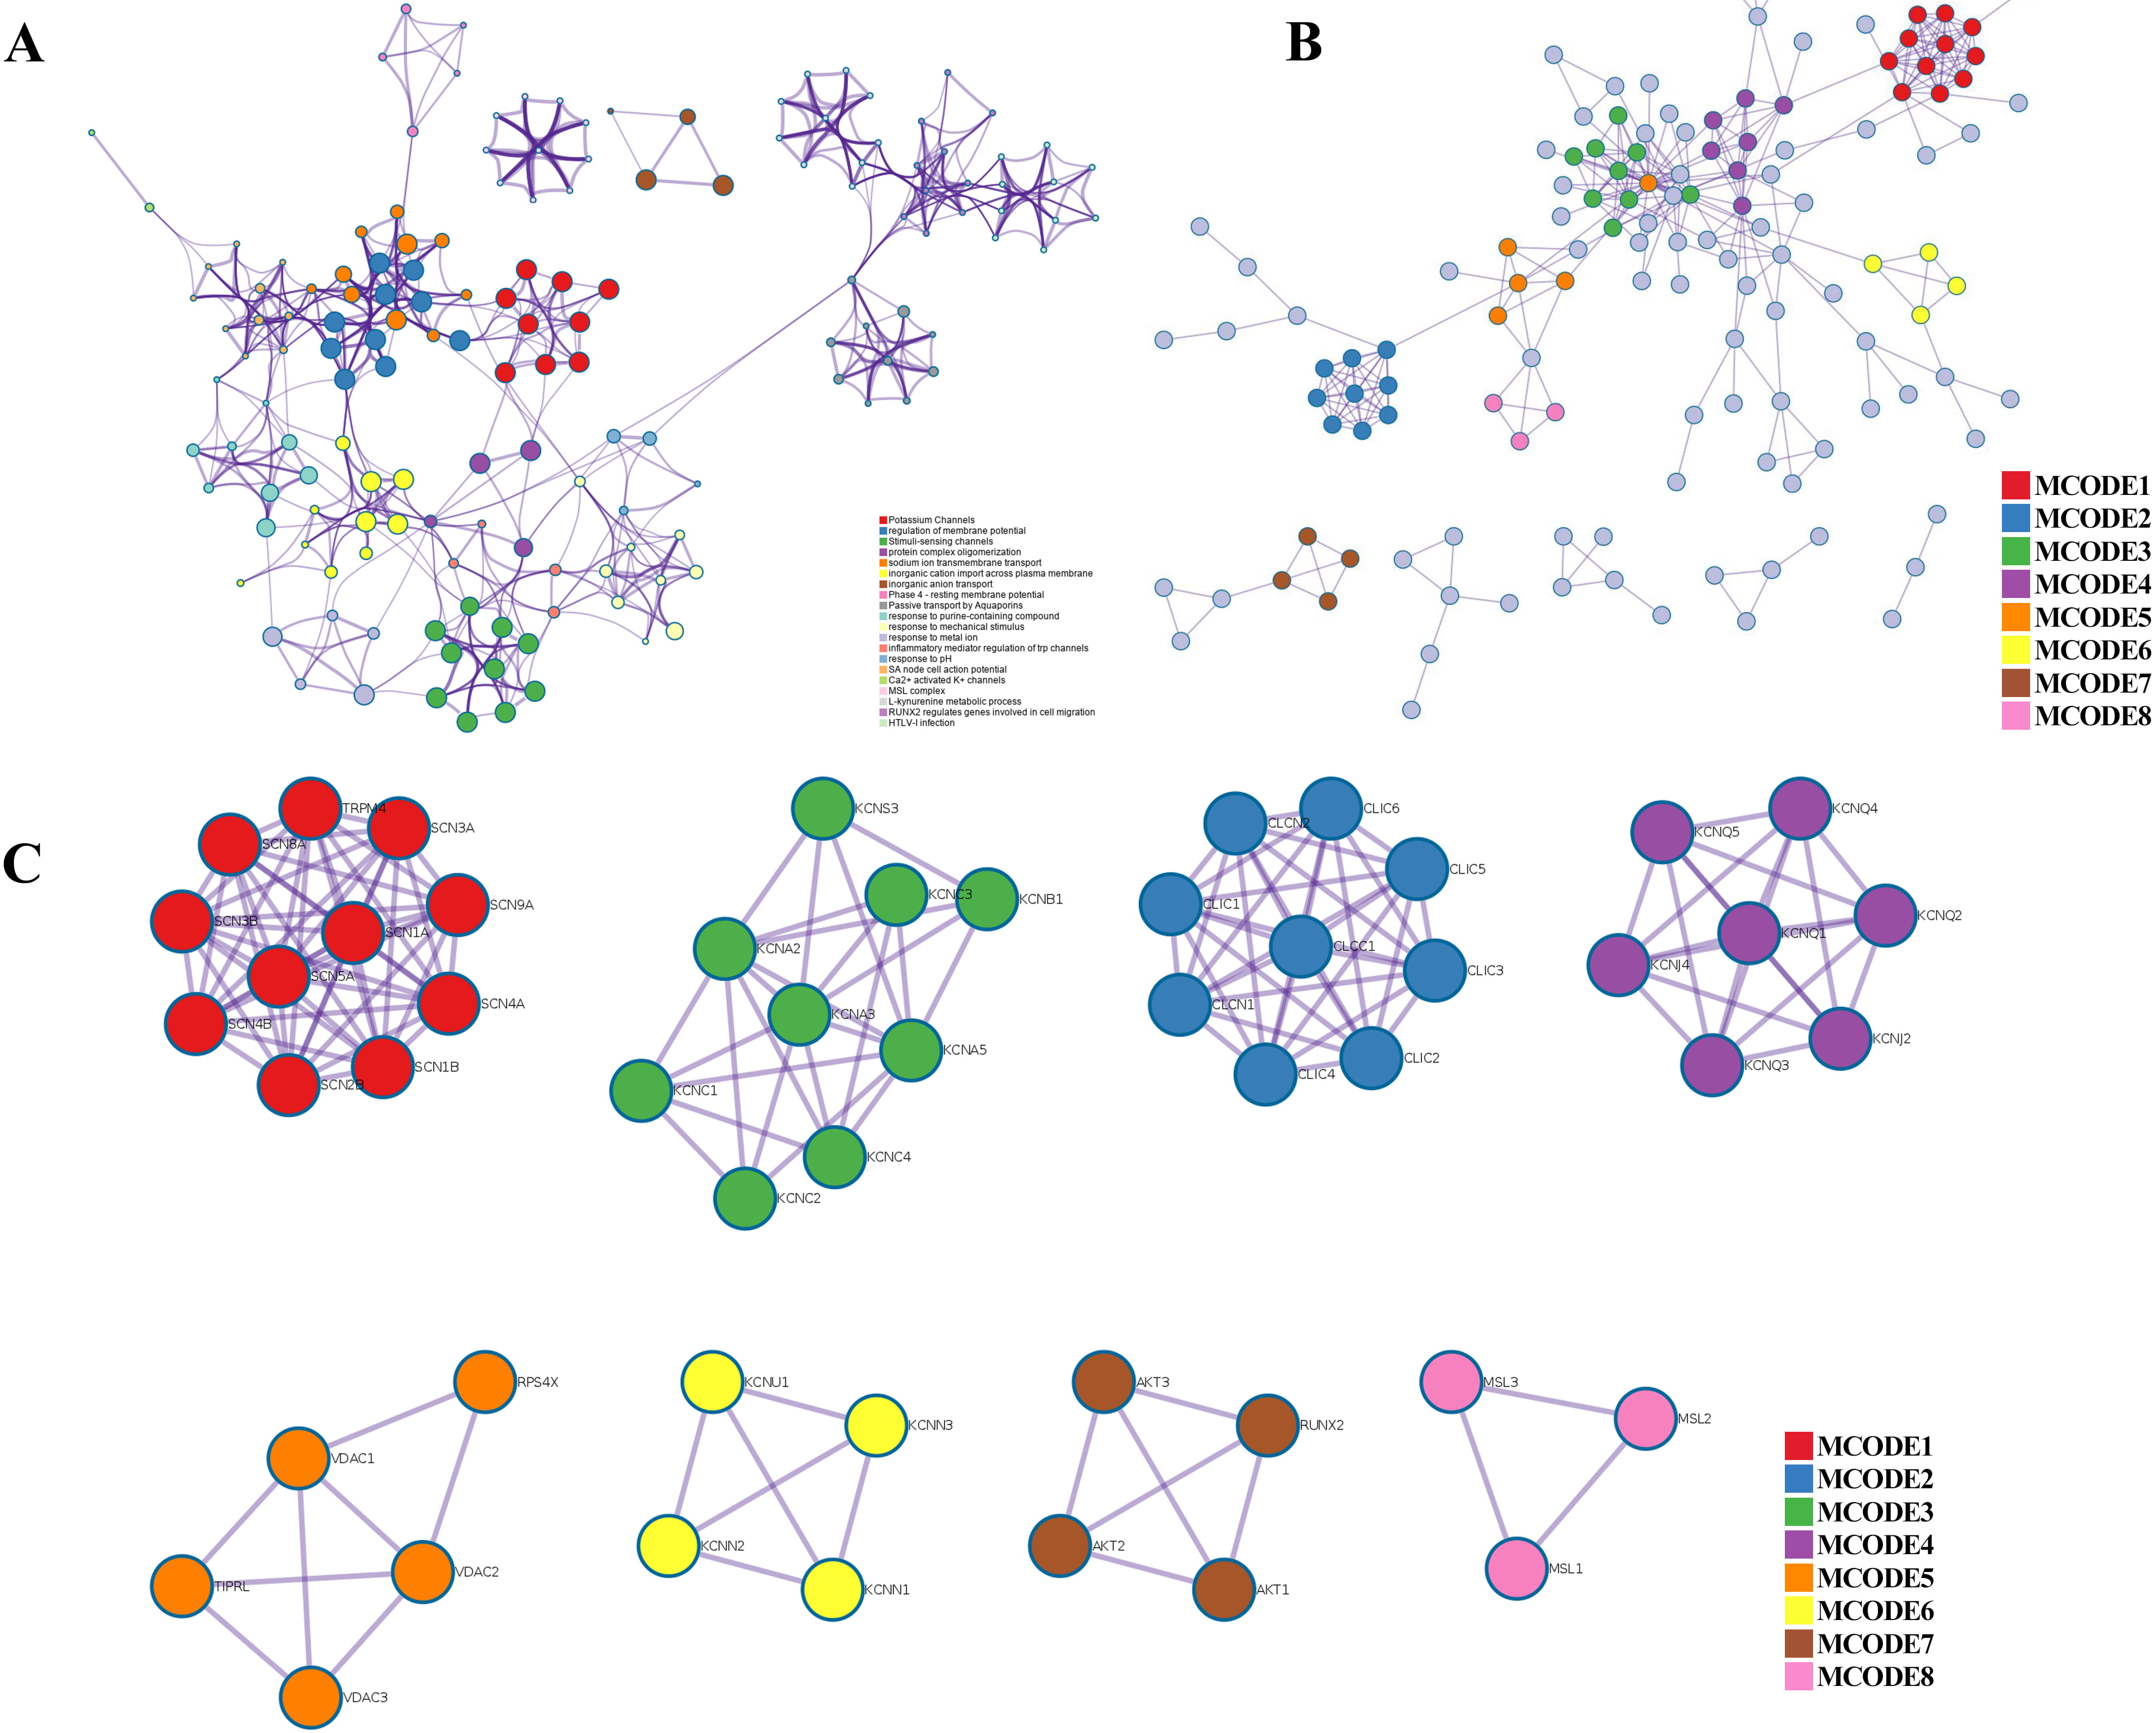 Fig. 4.
PPI network, enriched terms network, and MCODE analysis of CAPs. (A) Network of the enriched terms colored by cluster ID. (B) The protein–protein interaction (PPI) network for enrichment analysis of functions and pathways. (C) MCODE components identified from the PPI network among CAPs.
Metascape was applied to construct the PPI network (Fig. 4B) and found important MCODE components according to the cluster score (Fig. 4C). As shown in Fig. 4C, a PPI network was successfully constructed. Eight molecular MCODE components were identified from the PPI network. MCODE 1 (SCN 1/4/5/8/9A, SCN 1/2/3/4B, TRPM4) plays an important role in the voltage-dependent sodium ion permeability of excitable membranes. MCODE 2 (CLIC 1/2/3/4/5/6, CLCN 1/2 and CLCC 1) are chloride intracellular channel proteins. MCODE 3, MCODE 4, MCODE 6, and MCODE 7 are potassium channel proteins. MCODE 5 (VDAC 1/2/3) are voltage-dependent anion-selective channel proteins. MCODE 8 (MSL 1/2/3) are mechanosensitive ion channel proteins. Importantly, these analyses applied to each MCODE component showed that the biological function was related to a series of ion transport pathways.
To establish an effective prediction model, the probability characteristics of possible redundant information need to be processed to avoid the waste of computing resources and affect the final classification effect. In this study, a two-step feature selection method was used to identify the optimal feature representation from the original feature set. Sixty-eight features were sorted by LGBM according to classification importance. Fig. 5A shows the ranking of the top 20 features, in which the importance decreases along the x-axis. The results show that the most important feature is APAAC-SVM, indicating that it is the most effective classification among all features, followed by CTDD_LGBM and CTDD-SVM. APAAC-SVM represents the probability features derived from the APAAC descriptor on the SVM classifier. To evaluate the prediction performance of the four classifiers (SVM, RF, LGBM, and XGBoost) used in the feature representation learning scheme, 10 CV experiments and 68-dimensional classification probability features were implemented, and 68 prediction models were obtained. See Supplementary Tables 2–5 for the results. The overall ACC performance is shown in Fig. 5B. In fact, the ACC curves of the four classifiers seem to have similar patterns. To clarify the discussion of the SFS method on the LGBM classifier, we also refer to the ACC results of the SVM, SFS, and LGBM classifiers in Fig. 5B. The results show that the SVM and LGBM classifiers are generally better than the SFS classifier. The ACC curves of the LGBM classifier increased steadily with the increase of the number of features, until the number of features was close to 16 with the Acc value of 92.34, and gradually tended towards a fluctuating plateau, this model was named M16-LGBM (Fig. 5B). The Acc curve of the SVM classifier increased steadily until it reached the maximum value of 92.34 when the feature number was 34, and the model was named M34-SVM (Fig. 5B). Considering other indicators and all the above findings, we choose the LGBM classifier to construct the predictor. We believe that only the subset of the first 16 features is optimal. To better understand the selected features, we further analyzed their composition. In fact, these 16 features are: APAAC_SVM, CTDD_LGBM, CTDD_SVM, PAAC_RF, CTDD_RF, CKSAAGP_SVM, CKSAAGP_XGboost, DDE_SVM, APAAC_LGBM, QSOrder_SVM, CTDD_XGboost, GAAC_SVM, APAAC_RF, Moran_XGboost, SOCN_SVM, and CTriad_SVM. CTDD and APAAC generate four and three features, respectively. The physicochemical information and amino acid composition information of CAPs have the strongest feature representation ability.
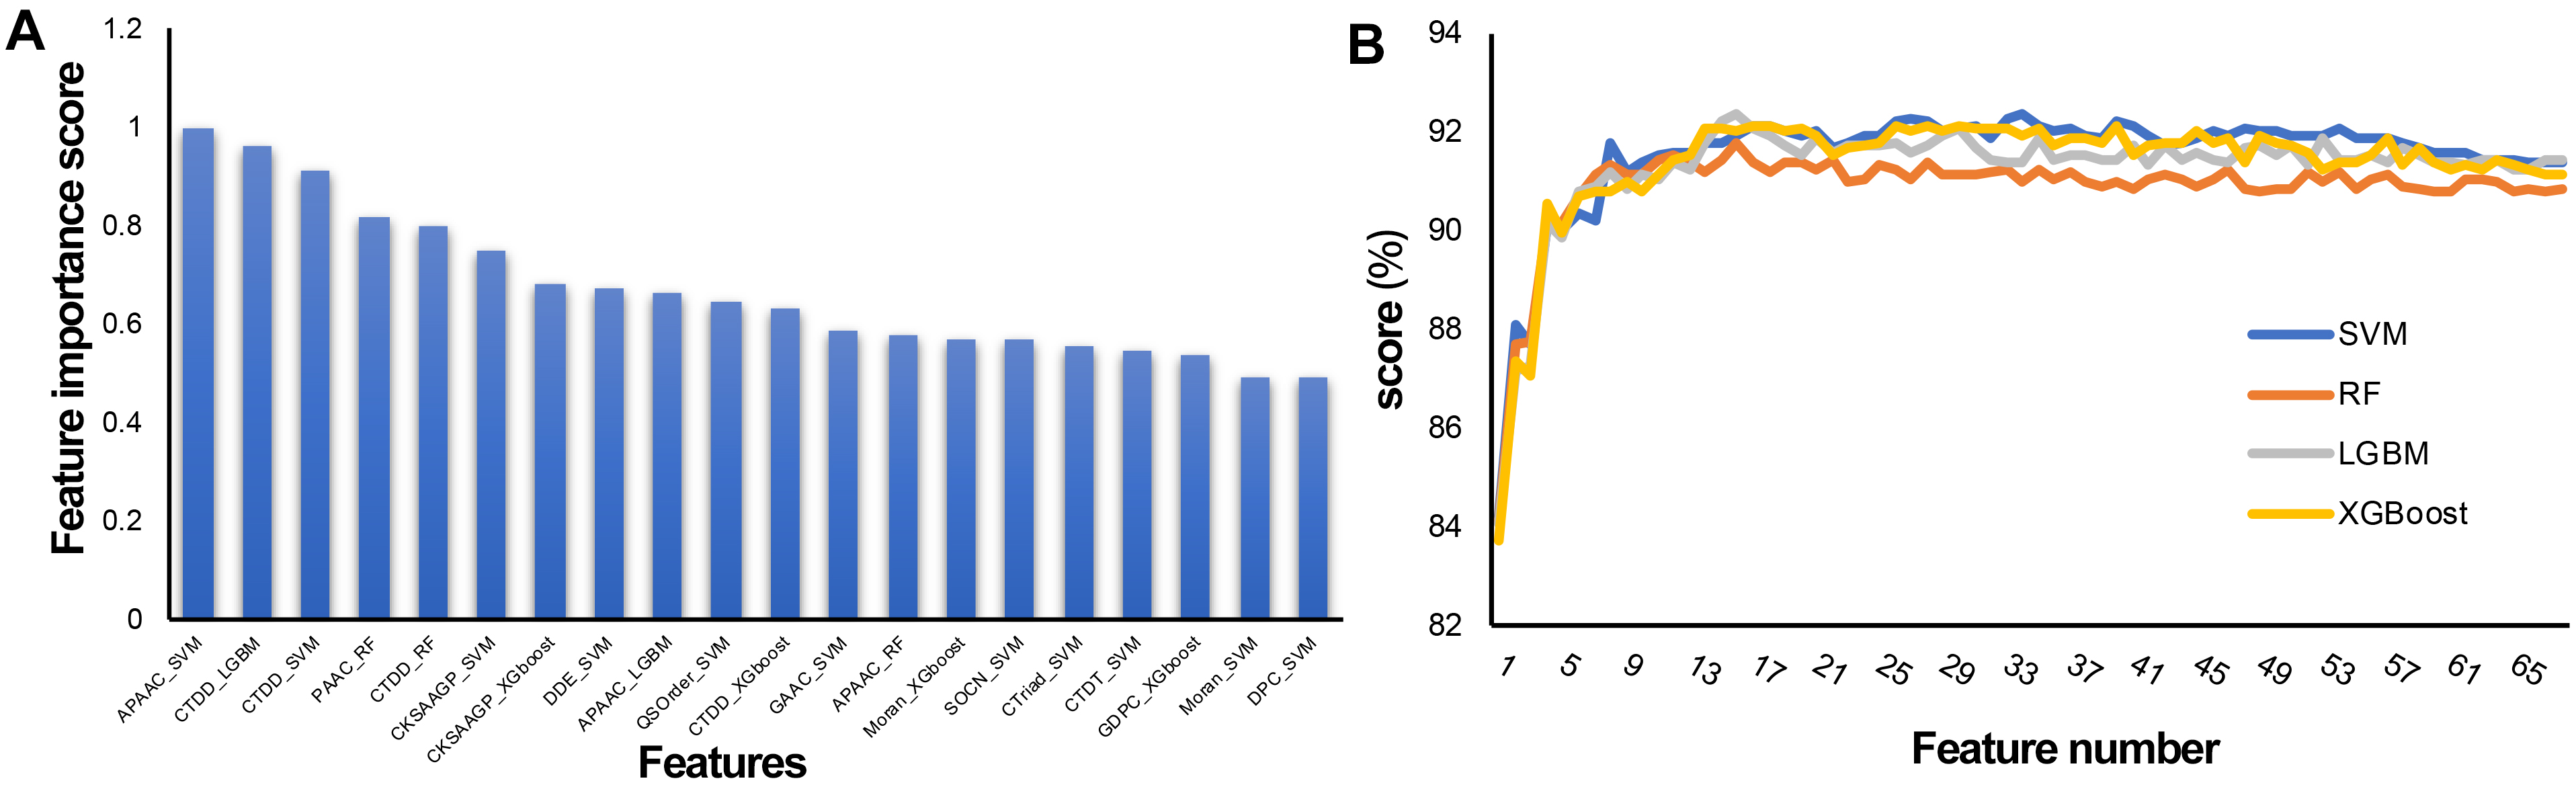 Fig. 5.
Feature selection of the 68-dimensional probability feature. (A) Classification importance score of the top 20 features. (B) Tenfold cross validation accuracy on the SVM, RF, XGBoost, and LGBM classifiers with feature numbers.
To verify the effective representation ability of the probability features generated by the feature representation learning scheme, we compared the probability features M16-LGBM with class features M34-SVM and the sequence-based feature descriptors related to M16-LGBM. The 10-fold CV results of 10 sequence-based feature descriptors are summarized in Supplementary Table 6. We selected the M16-LGBM subset and compared them with the first three feature descriptors with the best performance, namely, DDE, QSOrder, and APAAC. Table 2 shows the results of all training sets with comparative characteristics. The overall performance of probability features was significantly improved compared with original individual features. For example, the ACC values of DDE, QSOrder, and APAAC were 88.09%, 87.34% and 88.30%, respectively, while the probability features M16-LGBM and M34-SVM had the same ACC values of 92.33%. In addition, the AUC, Sn, Sp, and MCC values of the probability features were all higher than those of the three feature descriptors. This shows that the probability information generated by the model can improve the prediction model performance. The ROC curve of comparative features is shown in Fig. 6F. We can clearly see that the AUC of probability features is the highest of all features. In conclusion, the observation results showed that the probability feature with a small dimension is more suitable for constructing our final predictor.
| Feature | ACC (%) | AUC | Sn (%) | Sp (%) | MCC |
| APAAC | 88.30 | 0.94 | 90.15 | 86.46 | 0.77 |
| DDE | 88.10 | 0.94 | 90.01 | 86.18 | 0.76 |
| QSOrder | 87.35 | 0.94 | 89.33 | 85.36 | 0.75 |
| M16-LGBM | 92.34 | 0.98 | 91.93 | 92.75 | 0.85 |
| M34-SVM | 92.34 | 0.97 | 92.20 | 92.48 | 0.85 |
| The best performance value is highlighted in bold for clarification. | |||||
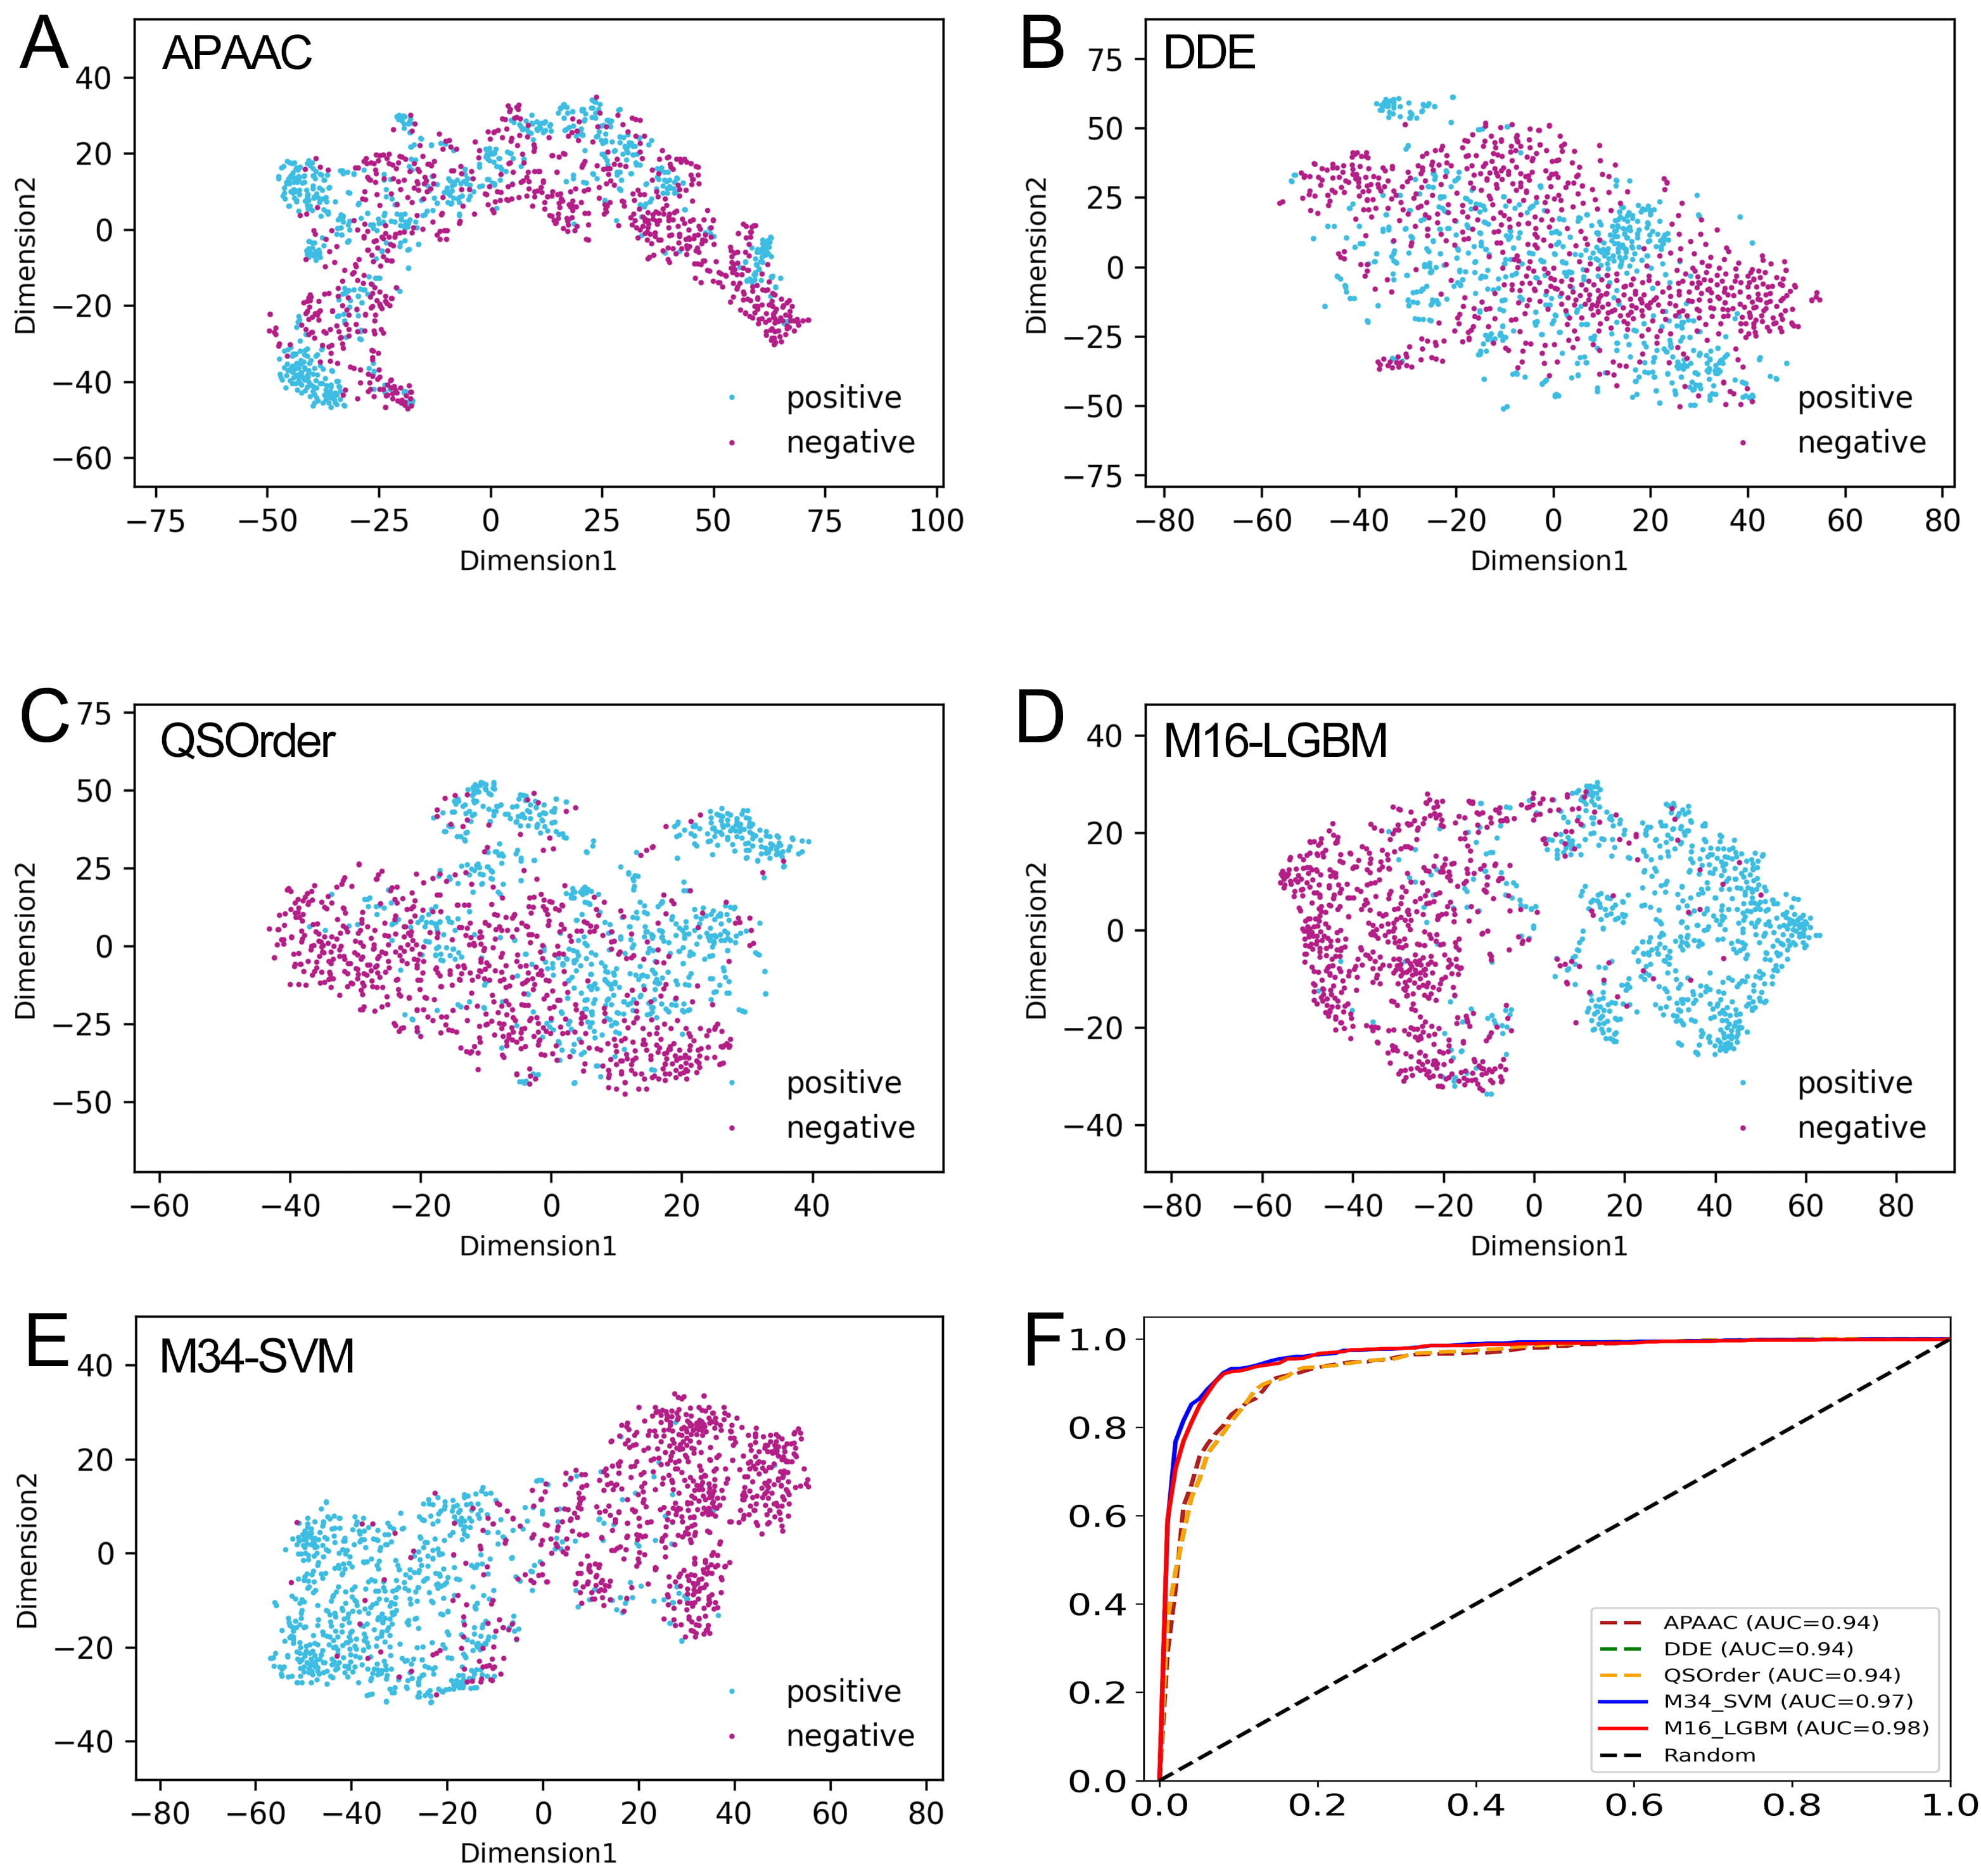 Fig. 6.
Comparison of our optimal feature with the class feature and individual feature descriptors. (A–E) The t-SNE distribution of APAAC, DDE, QSOrder, M16-LGBM, and M34-SVM features. (F) The ROC curves of the APAAC, DDE, QSOrder, M16-LGBM, and M34-SVM features on the training set.
The t-distributed stochastic neighborhood embedding (t-SNE) algorithm [63] was applied to explain why our model-based probability features can effectively improve the prediction performance. As shown in Fig. 6A–C, in the feature space of APAAC, DDE, and QSOrder descriptors, many positive and negative samples are mixed together, indicating that their expression ability may not be enough to fully distinguish between real CAP and non-CAP samples. In contrast, in the two model-based feature spaces, most positive and negative samples are distributed in two significantly different clusters (Fig. 6D,E). This shows that compared with the descriptor based on individual sequences, CAPs and non-CAPs are easy to distinguish in the vector space of the probability feature model. Using our probability feature, most of the positive and negative samples are clearly separated, and only a few samples overlap in the middle region. This once again confirms that the probability feature is more effective and can reveal the potential difference pattern between CAPs and non-CAPs to improve the prediction performance.
To verify the effectiveness of the feature representation learning method used in this paper, we explored different integrated learning schemes, including hard voting, soft voting, and stacking. We compared our CAPs-LGBM model building method with three traditional ensemble methods and evaluated their performance with 10-fold CV. Table 3 summarizes the performance results. Our CAPs-LGBM model building method was optimal in the training dataset, and similar results were found in the test dataset except for the Sn parameter. We observed that the proposed feature representation learning method CAPs-LGBM was significantly better than the traditional ensemble method. The results in Table 3 indicate that the prediction performance is significantly improved compared with other models (Supplementary Table 6). The feature representation learning method has the best overall performance among all comparison strategies. The ACC value on our CAP training set was 92.34%, which is 2.32%, 2.25%, and 3.69% higher than that of hard voting, soft voting, and stacking, respectively (Fig. 7A). To verify the robustness and practical applicability of CAPs-LGBM, we further compared these methods through independent testing. Similar to the training dataset, performance improvement was also observed on the test dataset. Compared with the other three ensemble predictors, the average performance of CAPs-LGBM on ACC and MCC is improved by 1.55% and 3.02%, respectively (Fig. 7B). In conclusion, our method provides satisfactory prediction results. This result shows that compared with other ensemble learning methods, feature representation learning in CAPs can make more effective use of the output of a single baseline model and help to distinguish CAPs from non-CAPs.
| Tools | Training dataset | Testing dataset | ||||||
| Acc (%) | Sn (%) | SP (%) | MCC | Acc (%) | Sn (%) | SP (%) | MCC | |
| Hard voting | 90.01 | 88.51 | 91.52 | 0.80 | 91.26 | 90.71 | 91.80 | 0.83 |
| Soft voting | 90.08 | 90.15 | 90.01 | 0.80 | 91.53 | 92.90 | 90.16 | 0.83 |
| Stacking | 88.65 | 88.92 | 88.37 | 0.77 | 91.26 | 95.08 | 87.43 | 0.83 |
| CAPs-LGBM | 92.34 | 91.93 | 92.75 | 0.85 | 92.90 | 93.99 | 91.80 | 0.86 |
| The best performance value is highlighted in bold for clarification. | ||||||||
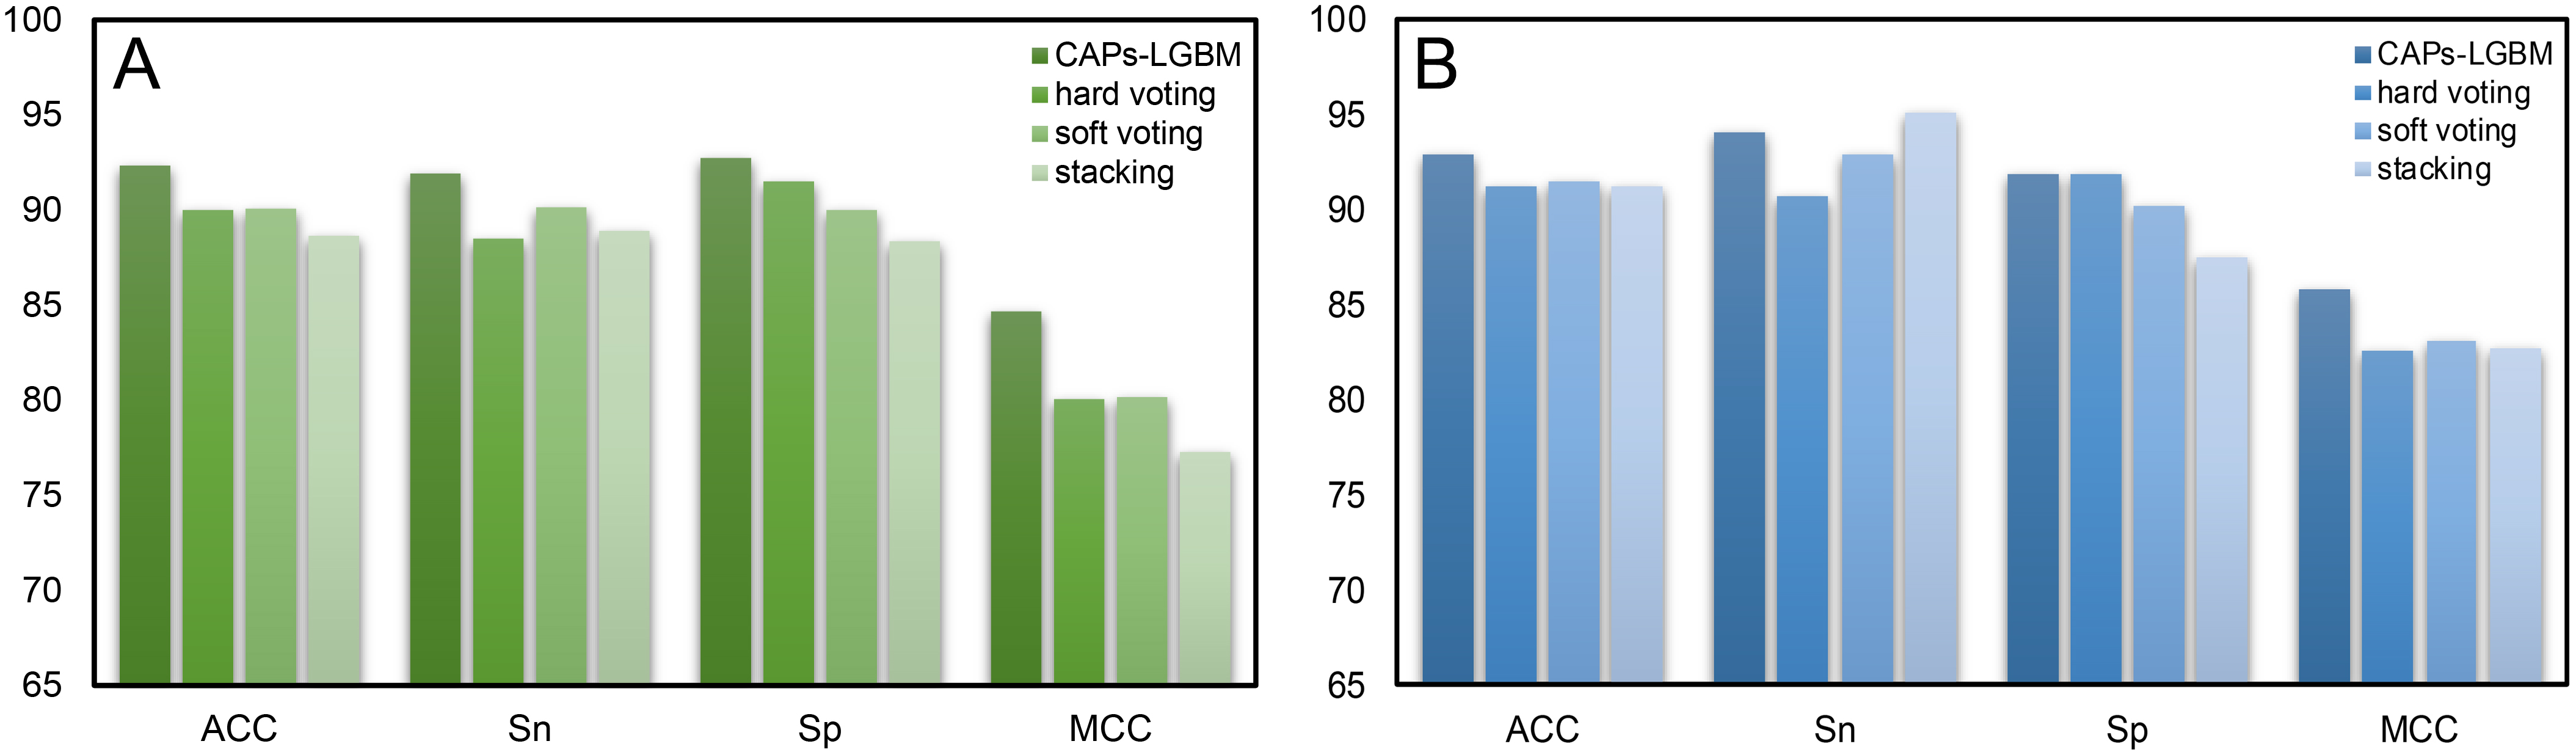 Fig. 7.
Comparison results of CAPs-LGBM with three traditional ensemble methods. (A) Training dataset. (B) Test dataset.
In order to test whether our CAPs-LGBM toolkit can predict the protein sequence with unknown function in practical scenarios, two common proteins from UniProt database are downloaded and are using our CAPs-LGBM method for practical application prediction. The two common proteins are ubiquitin and actin, none of which are channel proteins. The sequences of these two proteins are input into our prediction toolkit CAPs-LGBM. The results showed that there are 7668 sequences of actin protein, and 701 sequences were predicted incorrectly, with an error rate of 9.1%, while among 19,757 ubiquitin sequences, 2005 sequences were predicted incorrectly, with a prediction error rate of 10.1%. Therefore, our prediction toolkit CAPs-LGBM can obtain accurate results relatively in channel protein prediction. The results of these sequences are particularly meaningful for further experimental validation.
To facilitate the identification of CAPs by researchers, we built a user-friendly online web server named CAPs-LGBM, which is freely available at http://lab.malab.cn/~acy/CAPs-LGBM. To validate our findings, the benchmark dataset has been applied on the online server. A simple guideline was obtained to provide researchers on the use method for the CAPs-LGBM webserver. First, users need to put the query sequence in fasta format in the left input box and click the submit button. Finally, the results are displayed on the right result box. To restart a new task, a clear button or the resubmit button should be selected to clear the sequences in the input box. Finally, new query protein sequences were allowed to enter the input box. In addition, detailed instructions and example sequences in fasta format can be found on the web server interface. The home page provides links of the contact information of authors and relevant data to download.
Channel proteins are proteins that can transport molecules past the plasma
membrane through free diffusion movement. They can be divided into ion channel
proteins and aquaporins. Because it is generally located in the membrane system,
the protein structure usually contains an
We screened reliable and experimentally verified channel protein sequences as the dataset and established an effective prediction classifier on this basis. First, we selected 17 feature coding methods and four machine learning classifiers to generate 68-dimensional data probability features. Then, the two-step feature selection strategy was used to optimize the features, and the final prediction Model M16-LGBM was obtained on the 16-dimensional optimal feature vector. We made a comprehensive comparison between the proposed probability feature and the existing sequence-based feature description. The results showed that the probability features generated by the feature representation learning method had strong resolution and that the CAPs and non-CAPs were easier to separate. In addition, the proposed CAPs-LGBM was compared with three common ensemble learning strategies to verify the feature representation learning scheme. The 10-fold CV and the independent test showed that CAPs-LGBM was superior to other methods in CAP prediction. Finally, we also established a user-friendly online predictor to promote the use of relevant research communities. We expect that CAP-LGBM will contribute to the identification of CAPs, reveal their biological function mechanism, and accelerate pathological research related to CAPs.
CAPs, channel proteins; non-CAPs, non-channel proteins; RF, random forest; XGBT,
XGBoost; LGBM, light gradient boosting machine; SVM, support vector machines; PPI
network, protein-protein interaction network; CLIC1, chloride intracellular
channel 1; ITG
LX, QZ and LZ designed the research; ZC, AELH and SJ performed the research; ZC, MS and DZ analyzed the data; ZC wrote the manuscript. All authors read and approved the manuscript. The funders had no role in study design, data collection and analysis, decision to publish, or preparation of the manuscript.
Not applicable.
Not applicable.
The work was supported by the National Natural Science Foundation of China (No.62002244), Research foundation of Shenzhen Polytechnic (6021310016K) and the Post-doctoral Foundation Project of Shenzhen Polytechnic China (No. 6020330002K, 6022310029K, 6020330001K, 6021330003K).
The authors declare no conflict of interest. QZ is serving as the guest editor and the editorial board member of this journal. We declare that QZ had no involvement in the peer review of this article and has no access to information regarding its peer review. Full responsibility for the editorial process for this article was delegated to GP.
Supplementary material associated with this article can be found, in the online version, at https://doi.org/10.31083/j.fbl2706177.