


1 Department of Bioinformatic Engineering, Graduate School of Information Science and Technology, Osaka University, 565-0871 Suita, Japan
Academic Editors: Tatsuya Akutsu and TSUI Kwok Wing Stephen
Abstract
Background: Epithelial-mesenchymal transition (EMT) has been recognized as playing a crucial role in cancer progression. Among the studies on EMT, biomarker detection has been one of the important topics to understand the biology and mechanism of EMT related to tumor progression and treatment resistance. The existing methods often identified differentially-expressed genes as potential markers by ranking all genes by their variances. This paper proposes a novel method to detect markers for respective lineages in the EMT process. Methods and Results: Our method consists of three steps: first, perform trajectory inference to identify the lineage of transitional processes in EMT progression, and secondly, identify the lineage for EMT reversion in addition to EMT progression, and thirdly detect biomarkers for both of the EMT progression and reversion lineages with differential expression analysis. Furthermore, to elucidate the heterogeneity of the EMT process, we performed a clustering analysis of the cells in the EMT progression and reversion conditions. We then explored branching trajectories that order clusters using time information of the time-course samples. Using this method, we successfully detected two potential biomarkers related to EMT, phospholipid phosphatase 4 (PLPP4) and lymphotoxin-beta (LTB), which have not been detected by the existing method. Conclusions: In this study, we propose a method for the detection of biomarkers of EMT based on trajectory inference with single-cell RNA-seq data. The performance of the method is demonstrated by the detection of potential biomarkers related to EMT.
Keywords
- pseudotime analysis
- trajectory inference
- single-cell RNA-seq
- epithelial-mesenchymal transition
In cancer research, it is very important to identify cell characteristics and their changes associated with the evolution of cancer for considering the next therapeutic strategy. Epithelial-mesenchymal transition (EMT) is a well-known and important factor in the transition in tumor progression due to the evolution of cancer and is also recognized as one of the causes of drug resistance [1]. Single-cell RNA-seq analysis has been used for identifying the characteristics of individual cells from their gene expression profiles at the single-cell level. Since single-cell RNA-seq analysis requires handling enormous amounts of gene expression data from respective single cells, tools for more effective analysis have been studied to date.
These studies have used clustering methods for classifying cells into functional groups or cell types such as Seurat [2] and then have inferred the trajectory with pseudotime constructed from similarities in gene expression between cells (for example Monocle [3] and slingshot [4]) for estimating gene expression over time in response to cell development and stimulus reactions [5], etc.
In the studies on EMT, single-cell approaches have been recently applied to elucidate the mechanism of EMT. For example, for identifying the EMT-related biomarkers, clustering and pseudotime analysis are conducted by Monocle as a semi-supervised approach [6]. Also, an unsupervised learning method (QuanTC) is proposed to infer and quantify the transitional property of individual cells in scRNA-seq data [7]. By applying the method to the analysis of the transition trajectories from EMT single-cell datasets, they analyze transition cells and dynamics of EMT that highlight the transition trajectories mediated by intermediate cell states. In our previous study [8], we identify biomarkers that are differentially expressed along specific lineages progressing toward drug resistance by combining clustering, trajectory inference, and gene expression analysis of each lineage.
Another single-cell-based approach to using mass cytometry time-course analysis
resolves lung cancer EMT states through TGF
We used single-cell RNA-seq data from prostate cancer cell line DU145 studied by Cook et al. [10]. They analyze single-cell RNA-seq data from four different cancer cell lines capable of undergoing an EMT (A549, lung; DU145, prostate; MCF7, breast; and OVCA420, ovarian). These cell lines were exposed each to known EMT-inducing factors TGFB1, EGF, and TNF over 12 distinct EMT time-course experiments. For each of the 12 conditions, samples were collected at five distinct time points from 8 hours to 1 week (“0 d”, “8 h”, “1 d”, “3 d”, and “7 d”) after treatment, and three additional time points from 8 hours to 3 days (“7 d + 8 h off”, “7 d + 1 d off”, and “7 d + 3 d off”) after the EMT-inducing stimulus had been removed [10]. These data have been deposited in the NCBI Gene Expression Omnibus under the accession GSE147405. They assessed the temporal progression of each above time course by using the R package Seurat 4.1 [2] and evaluated gene expression dynamics throughout the pseudotime by using the R package psupertime v0.2.1 [11].
While the cells were arranged along with the physical time points of the obtained cell samples and they pseudotemporally ordered the cells from each condition, their study did not fully perform trajectory inference but computed pseudotime along the paths connecting the centroids of the successive time-course experiment data [10]. In addition, since they omitted the treatment withdrawal samples, only EMT progression data were used to assess changes in gene expression along with a pseudotime series.
In this paper, we propose a novel method for analyzing EMT processes. The objective of our study is to identify biomarkers expressed along the transition process through EMT. Our method consists of three steps: (1) perform trajectory inference to identify the lineage of transitional processes in EMT progression by minimum spanning tree (MST), (2) identify the lineage for EMT reversion in addition to EMT progression, and (3) detect biomarkers for both of the EMT progression and reversion lineages with differential expression analysis. By taking advantage of this method, we can identify biomarkers that exhibit differentially expressed along the specific lineages of EMT.
Furthermore, to elucidate the heterogeneity of the EMT process, we performed a clustering analysis of the cells in the EMT progression and reversion conditions. We then explored branching trajectories that order clusters using time information of the time-course samples. For the clustering analysis and the temporal trajectory inference of the resulting clusters, we adopted Seurat 4.1 and Tempora 0.1.0 [12], respectively. The method takes as input a gene expression matrix from a time-series scRNA-seq experiment and cluster labels for all cells and then calculates the average gene expression profiles of all clusters [12]. Using the temporal trajectories of the EMT progression and reversion processes, we detect markers that are differentially expressed along the trajectories of the clusters. This analysis can detect a variety set of markers reflecting the diversity of the cell population in the EMT progression and reversion.
We conducted the proposed method to analyze the scRNA-seq data on the EMT process. We used slingshot 2.2 [4] at Steps (1) and (2) of the method. In the inference with slingshot, we set “0 d” as a start cluster (green circle) and “7 d” as an end cluster (red circle) in the EMT progression as shown in Fig. 1. In addition, we set “7 d + 8 h off” as a start cluster (green circle) and “7 d + 3 d off” as an end cluster (red circle) in the EMT reversion. We detected respective lineages by the inference in the case of DU145 prostate cells stimulated by TNF as shown in Figs. 1,2. The UMAP embeddings of those cells were provided by Cook et al. [10]. These lineages denote the temporal changes from epithelial to mesenchymal in the EMT progression and from mesenchymal to epithelial in the EMT reversion, respectively through the comparison of temporal dynamics of the EMT, pseudotemporally ordered the cells for each condition.
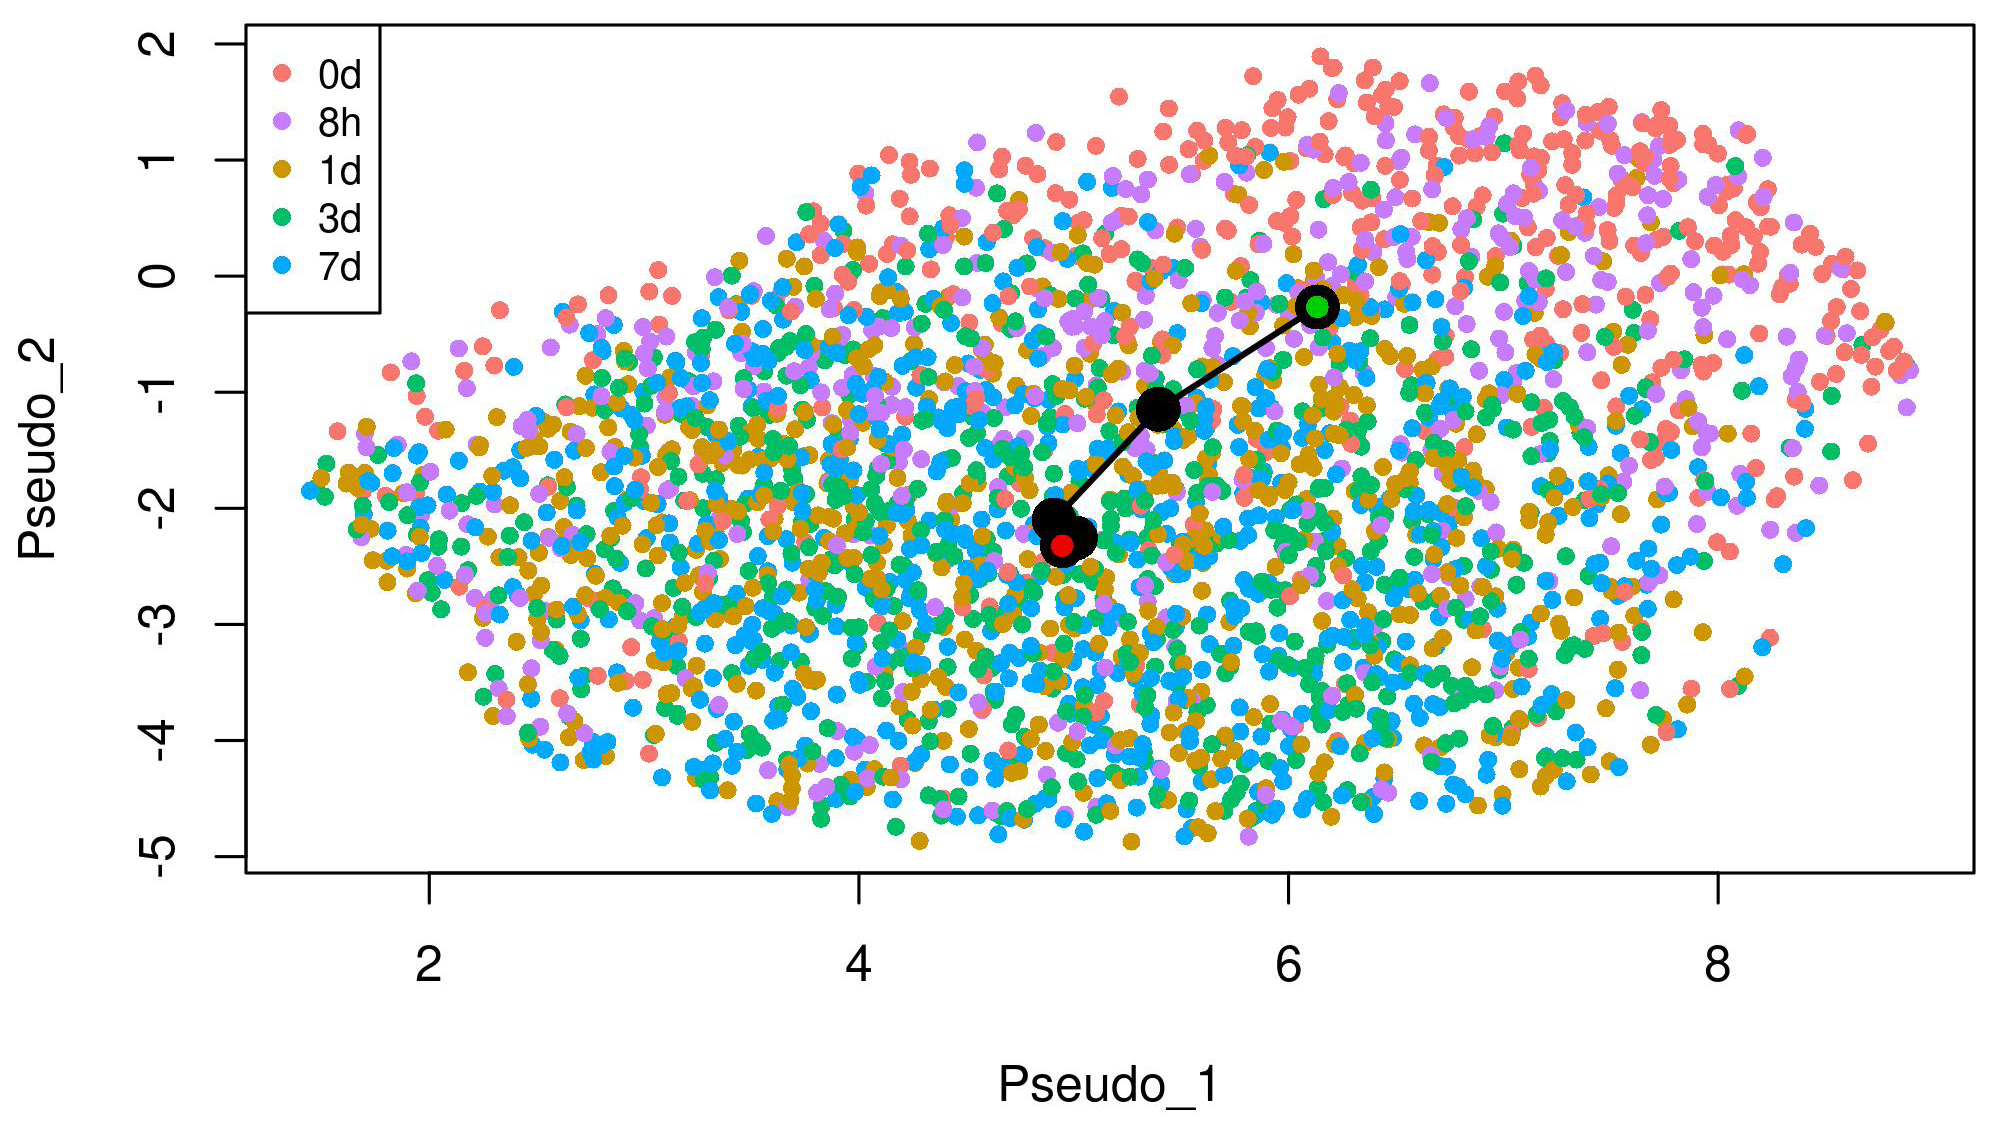 Fig. 1.
The lineage of the EMT progression detected by trajectory inference on UMAP embeddings of DU145 cells treated with TNF. “0 d” as a start cluster (green circle) and “7 d” as an end cluster (red circle) in the lineage.
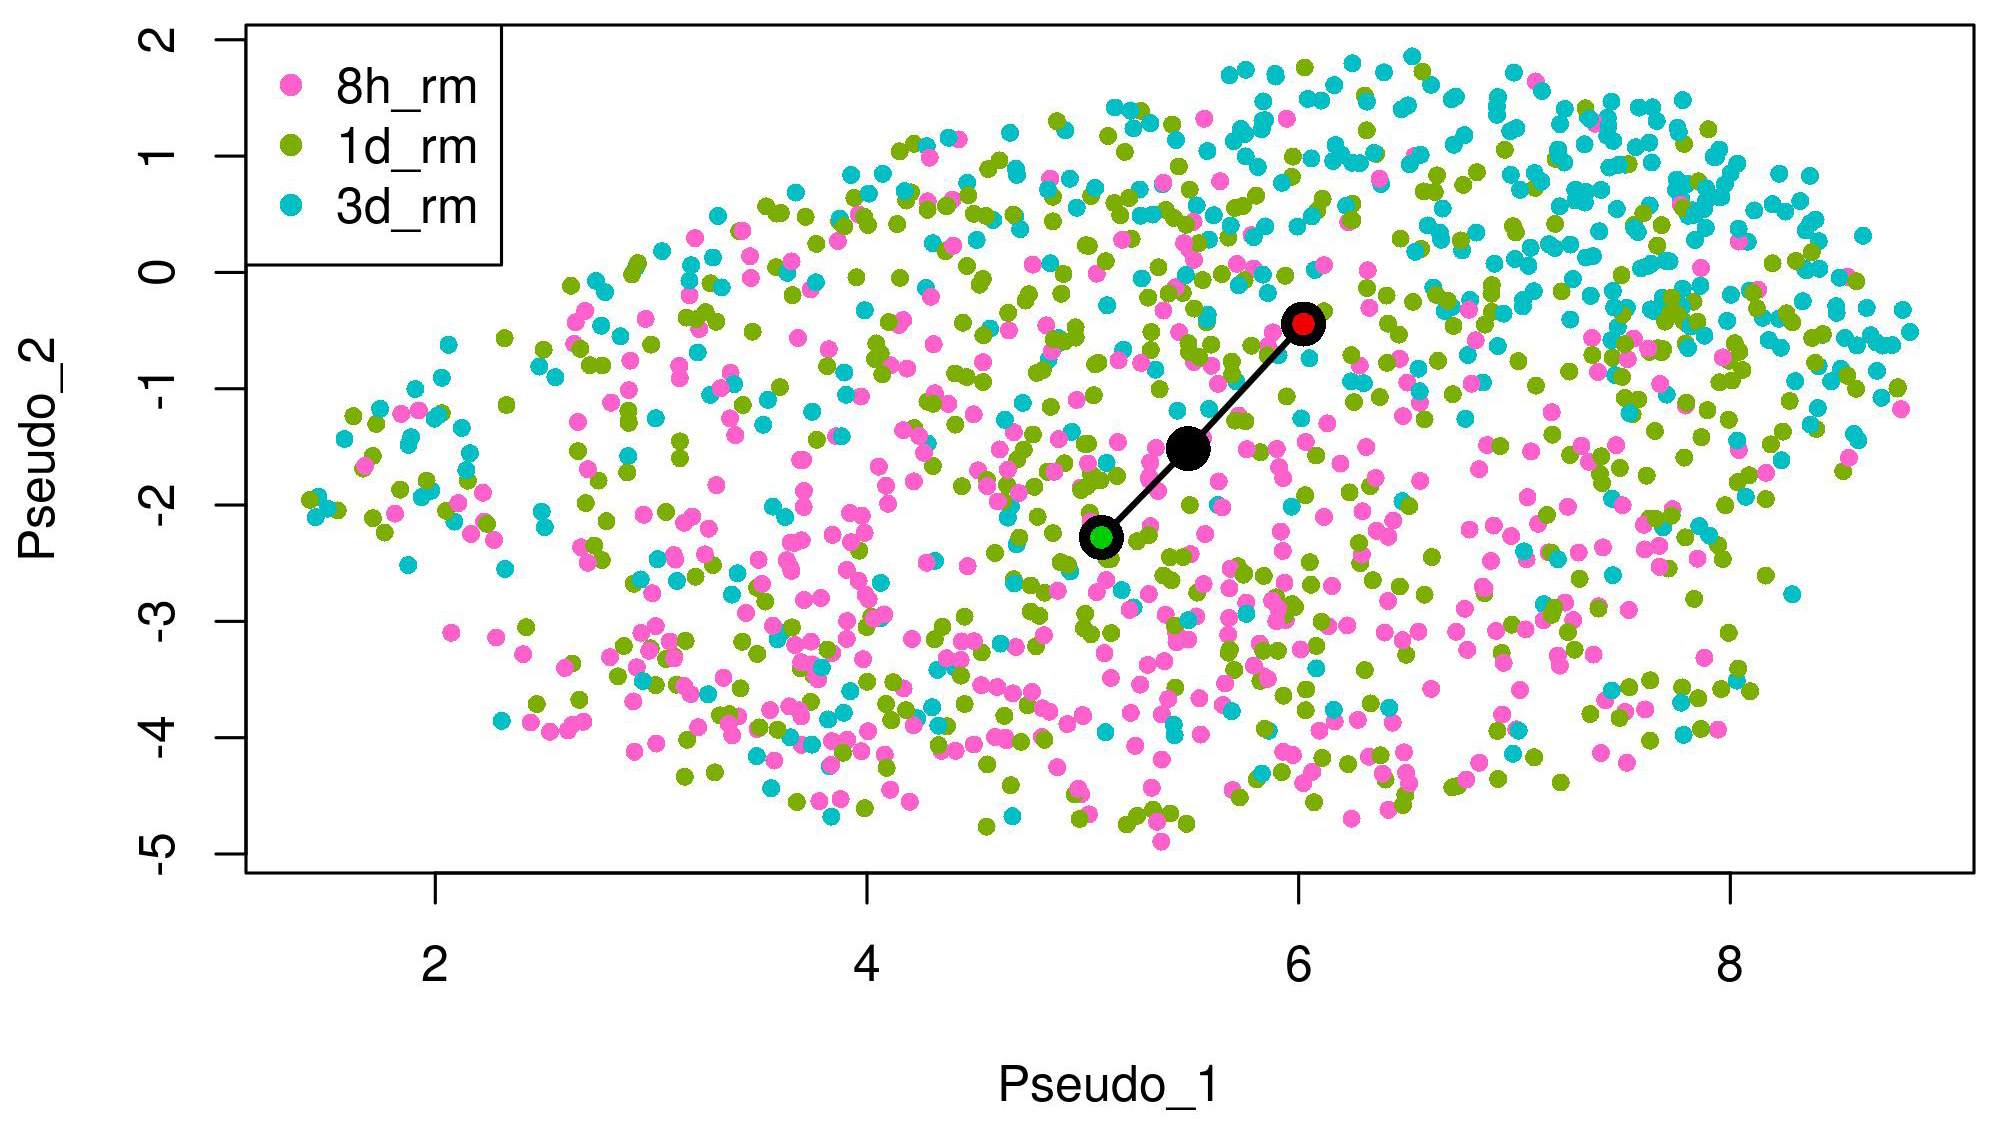 Fig. 2.
The lineage of the EMT reversion detected by trajectory inference on UMAP embeddings of DU145 cells treated with TNF. “7 d + 8 h off” (8 h_rm) as a start cluster (green circle) and “7 d + 3 d off” (3 d_rm) as an end cluster (red circle) in the lineage.
Given the lineages identified in Sect. 3.1, we performed statistical tests on gene expression along the lineages by using tradeSeq 1.8.0 [13]. To extract markers for the EMT, we assessed differential expression between the starting and ending points along the lineages of the EMT progression and reversion. We used the startVsEndTest function in tradeSeq [13] as a Wald test to assess the null hypothesis that the average expression at the starting point is equal to the average expression at the endpoints.
We detected statistically significant markers in both the EMT progression and reversion lineages. Tables 1,2 show the top five markers of the EMT progression and reversion lineages for TNF stimulated DU145 cells detected by the test. Interestingly, Interleukin (IL)-32 and phospholipid phosphatase 4 (PLPP4) were detected as the statistically important markers in both two lineages. Figs. 3,4 show the change of gene expression of IL32 and PLPP4, respectively. Furthermore, TGFB1 stimulated OVCA420 cells showed a similar trend about IL32 in both the lineages of the EMT progression and regression (data not shown). These results may reflect that IL32 and PLPP4 have a significant role in the EMT in these conditions.
| Gene | waldStat_lineage | logFClineage |
| IL32 | 84.83 | 1.84 |
| PLPP4 | 48.54 | 2.53 |
| FHL2 | 44.66 | 1.42 |
| LTB | 39.97 | 2.29 |
| SFTA1P | 38.68 | 1.28 |
| Gene | waldStat_lineage | logFClineage |
| IL32 | 37.30 | –1.87 |
| ISG15 | 33.18 | –1.68 |
| PLPP4 | 27.43 | –2.70 |
| WFDC2 | 20.48 | –1.99 |
| CSF2 | 15.69 | –2.35 |
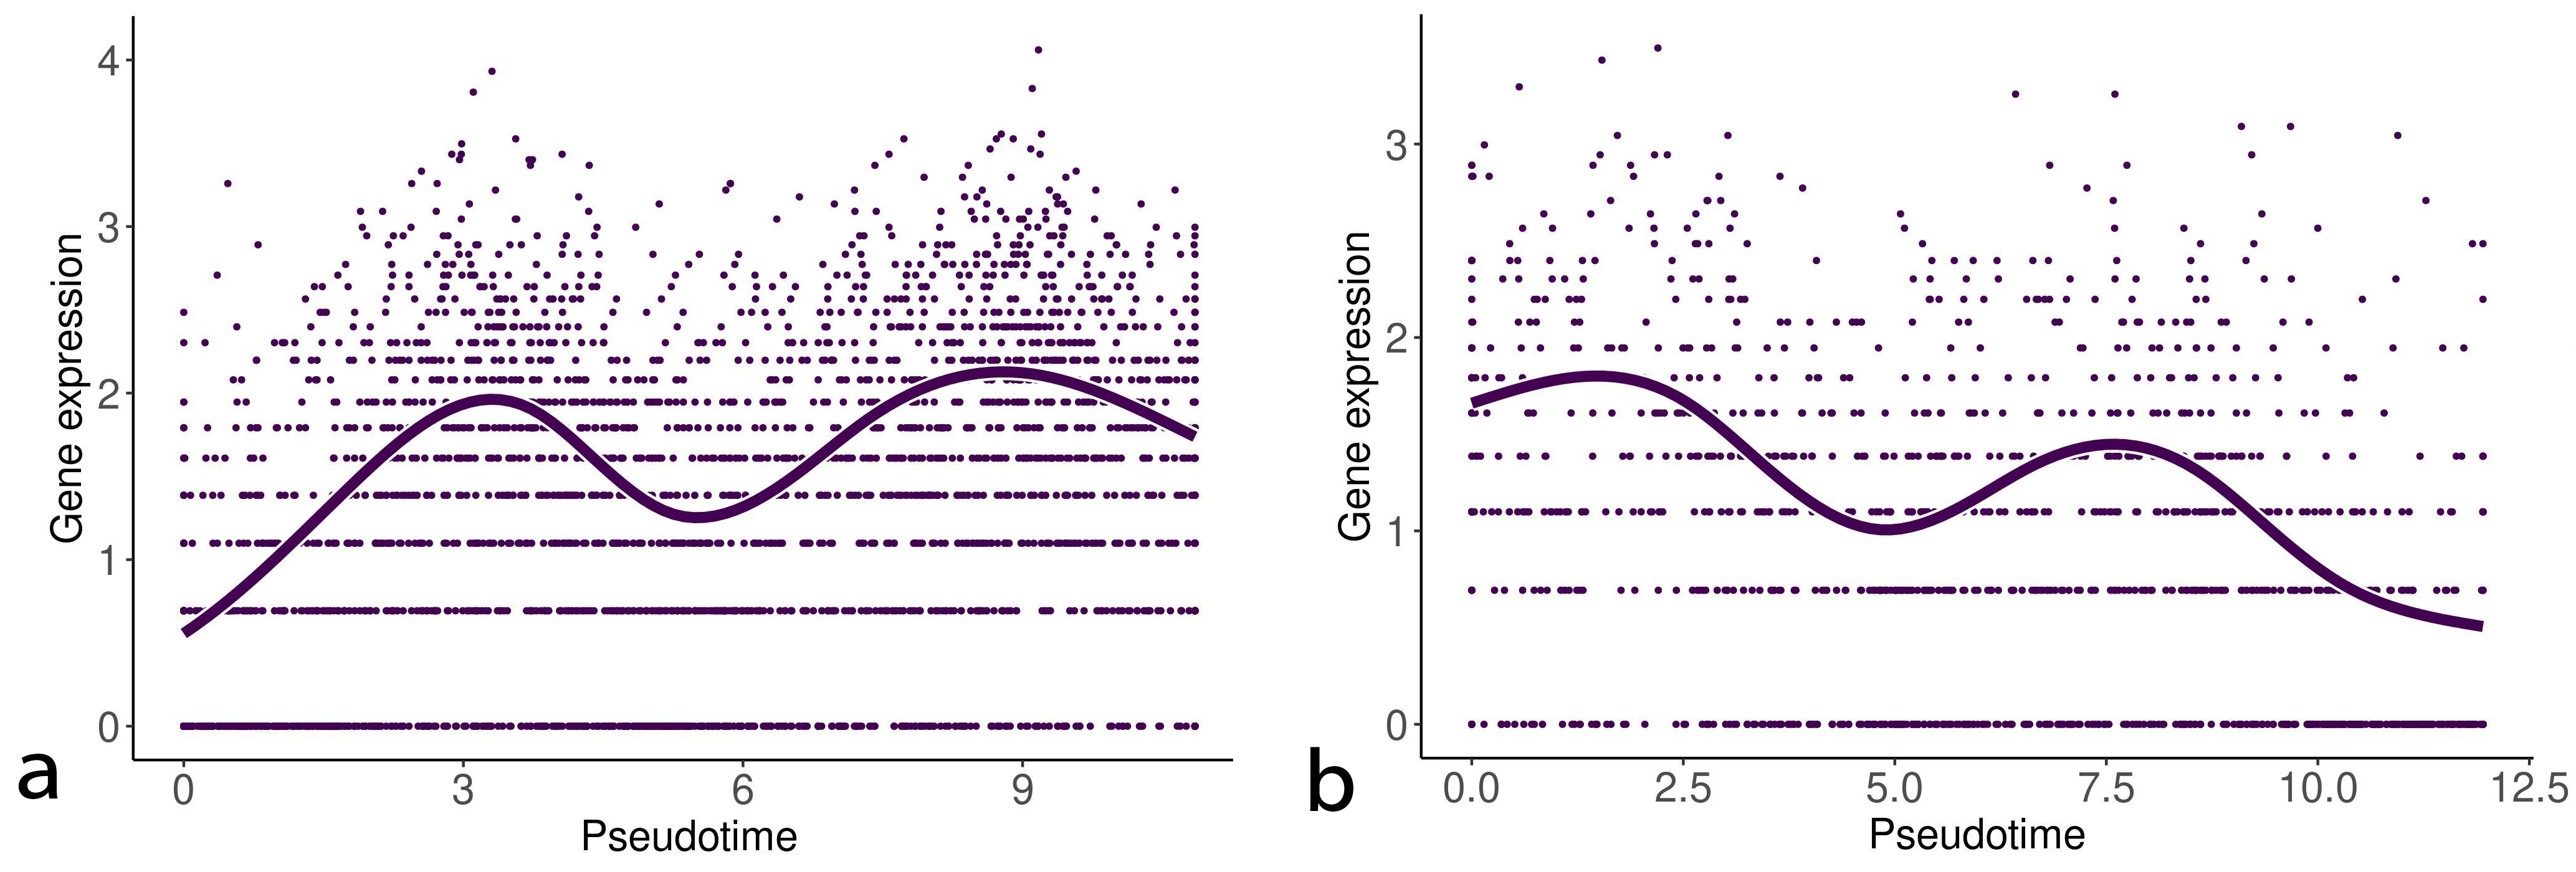 Fig. 3.
Gene expression of interleukin (IL)-32 along with the EMT progression and reversion lineages. The left and right curves denote the change of gene expression of IL32 along with the EMT progression and reversion lineages, respectively.
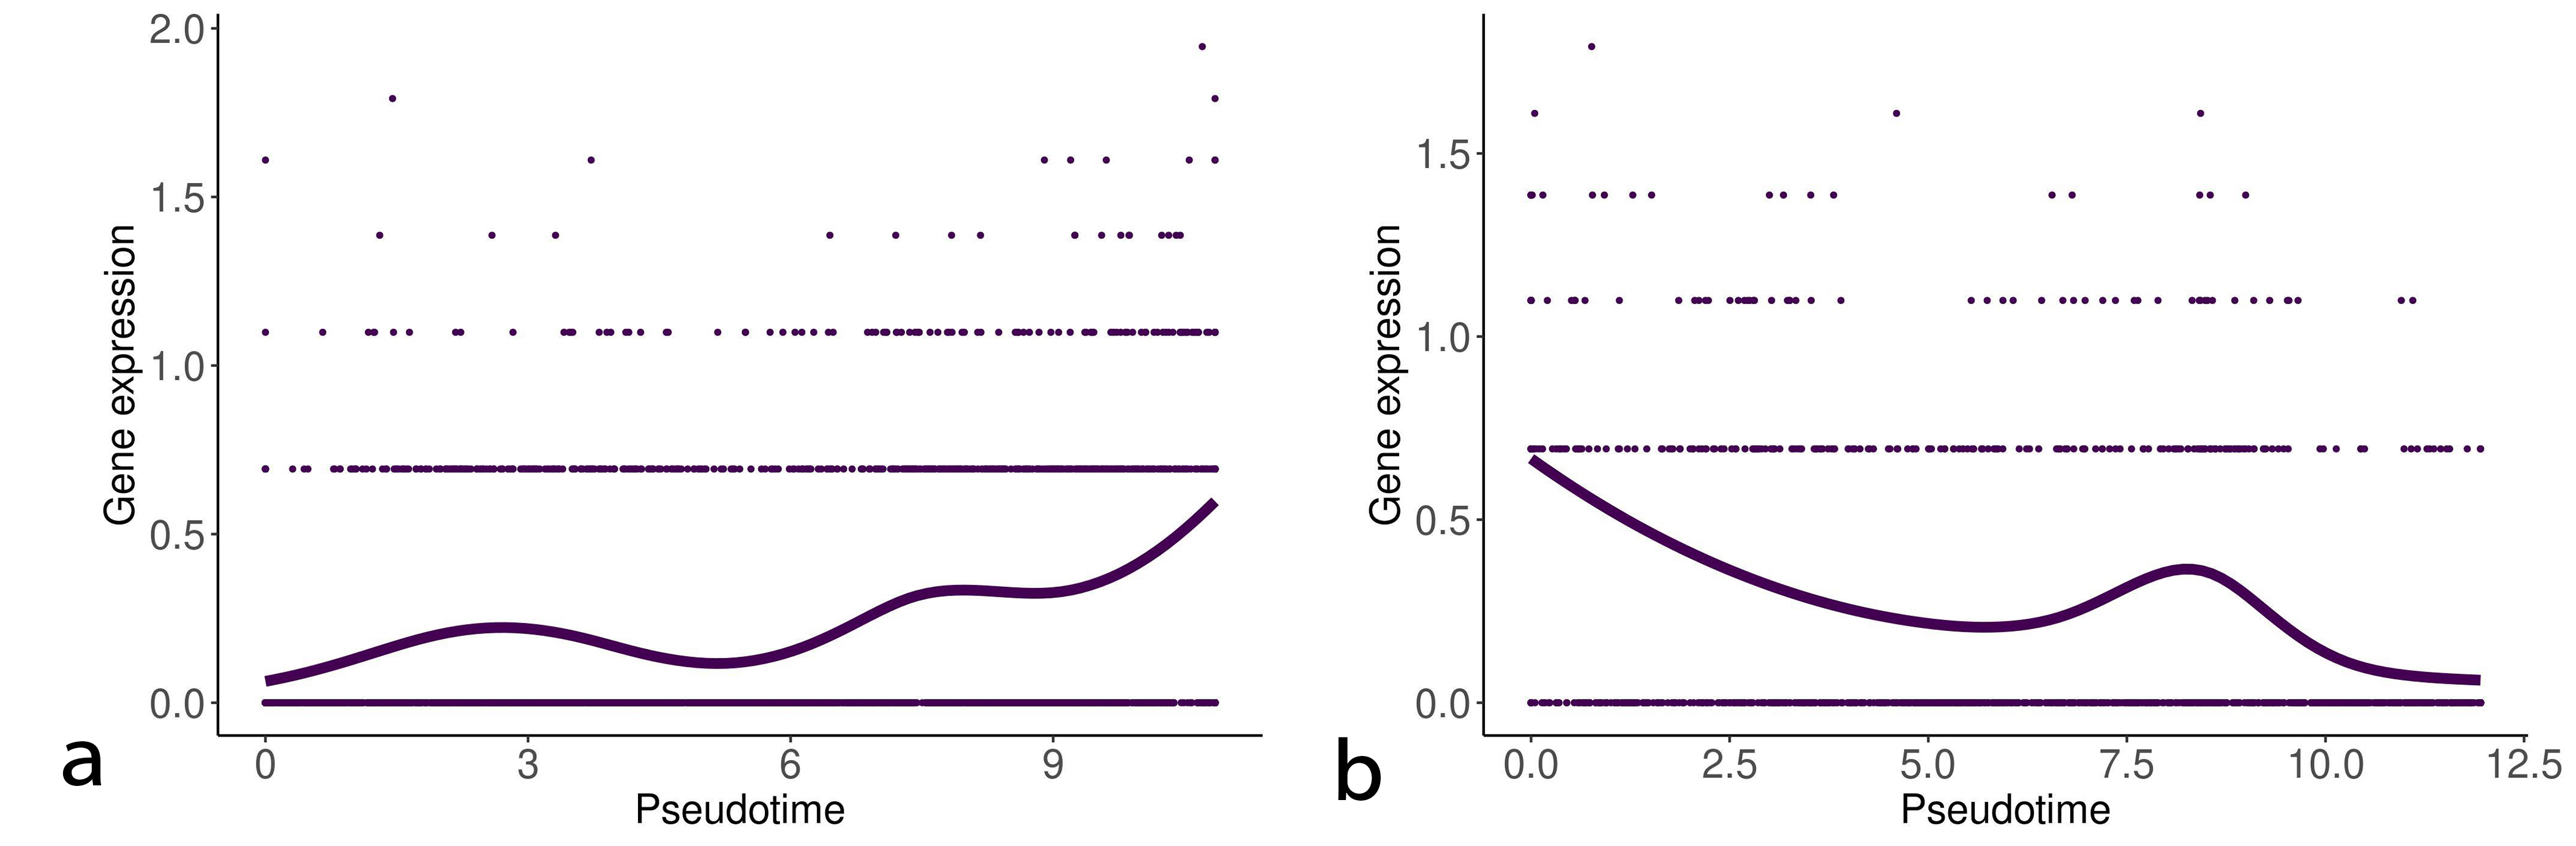 Fig. 4.
Gene expression of phospholipid phosphatase 4 (PLPP4) along with the EMT progression and reversion lineages. The left and right curves denote the change of gene expression of PLPP4 along with the EMT progression and reversion lineages, respectively.
Moreover, we evaluated the association of markers between the EMT progression
and reversion for TNF stimulated DU145 cells. Fig. 5 (Ref. [14]) shows a Venn diagram with
the number of statistically significant markers for both EMT progression and
reversion in TNF stimulated DU145 cells based on the results with startVsEndTest
(p
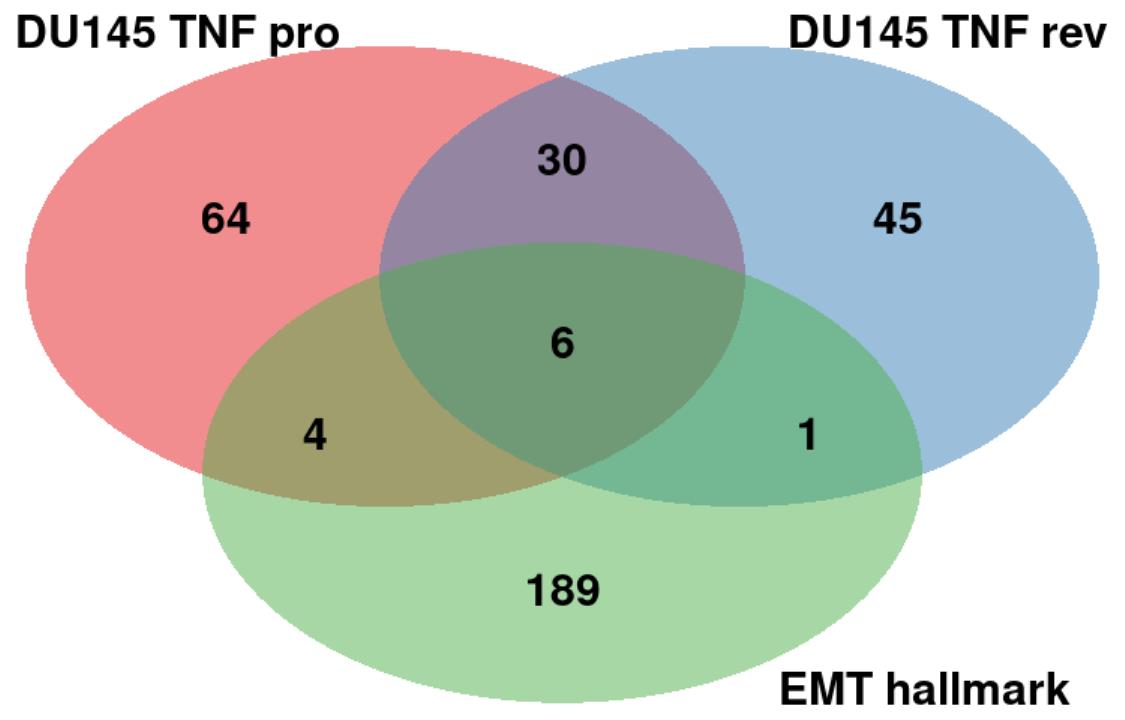 Fig. 5.
Comparison of the top markers between the EMT progression/reversion lineages in TNF stimulated DU145 cells and the EMT hallmark genes. The “DU145 TNF pro” (red) and “DU145 TNF rev” (blue) denote the EMT progression and reversion markers, respectively. “EMT hallmark” (green) was obtained from the MSigDB database [14].
If we would extend to apply our analysis to the other conditions, we could detect more different markers that would be additionally shared with the EMT hallmark genes. Another reason is that we used the startVsEndTest function to analyze the differential expression between the start and end points of a lineage. For this reason, we cannot detect potential markers that exhibit significant changes within a lineage, e.g., early driver genes that affect the EMT process only at its early stage of the process. We will extend our method to the detection of such markers in the EMT process.
To elucidate the diversity of the cell population in the EMT processes, we performed clustering analysis followed by temporal trajectory inference of the obtained clusters in the EMT progression and reversion datasets. Figs. 6,7 show the clustering results of those datasets and the temporal trajectories of the clusters inferred by Tempora 0.1.0 [12], respectively. The obtained trajectories suggest the diversity of cell populations in the EMT processes.
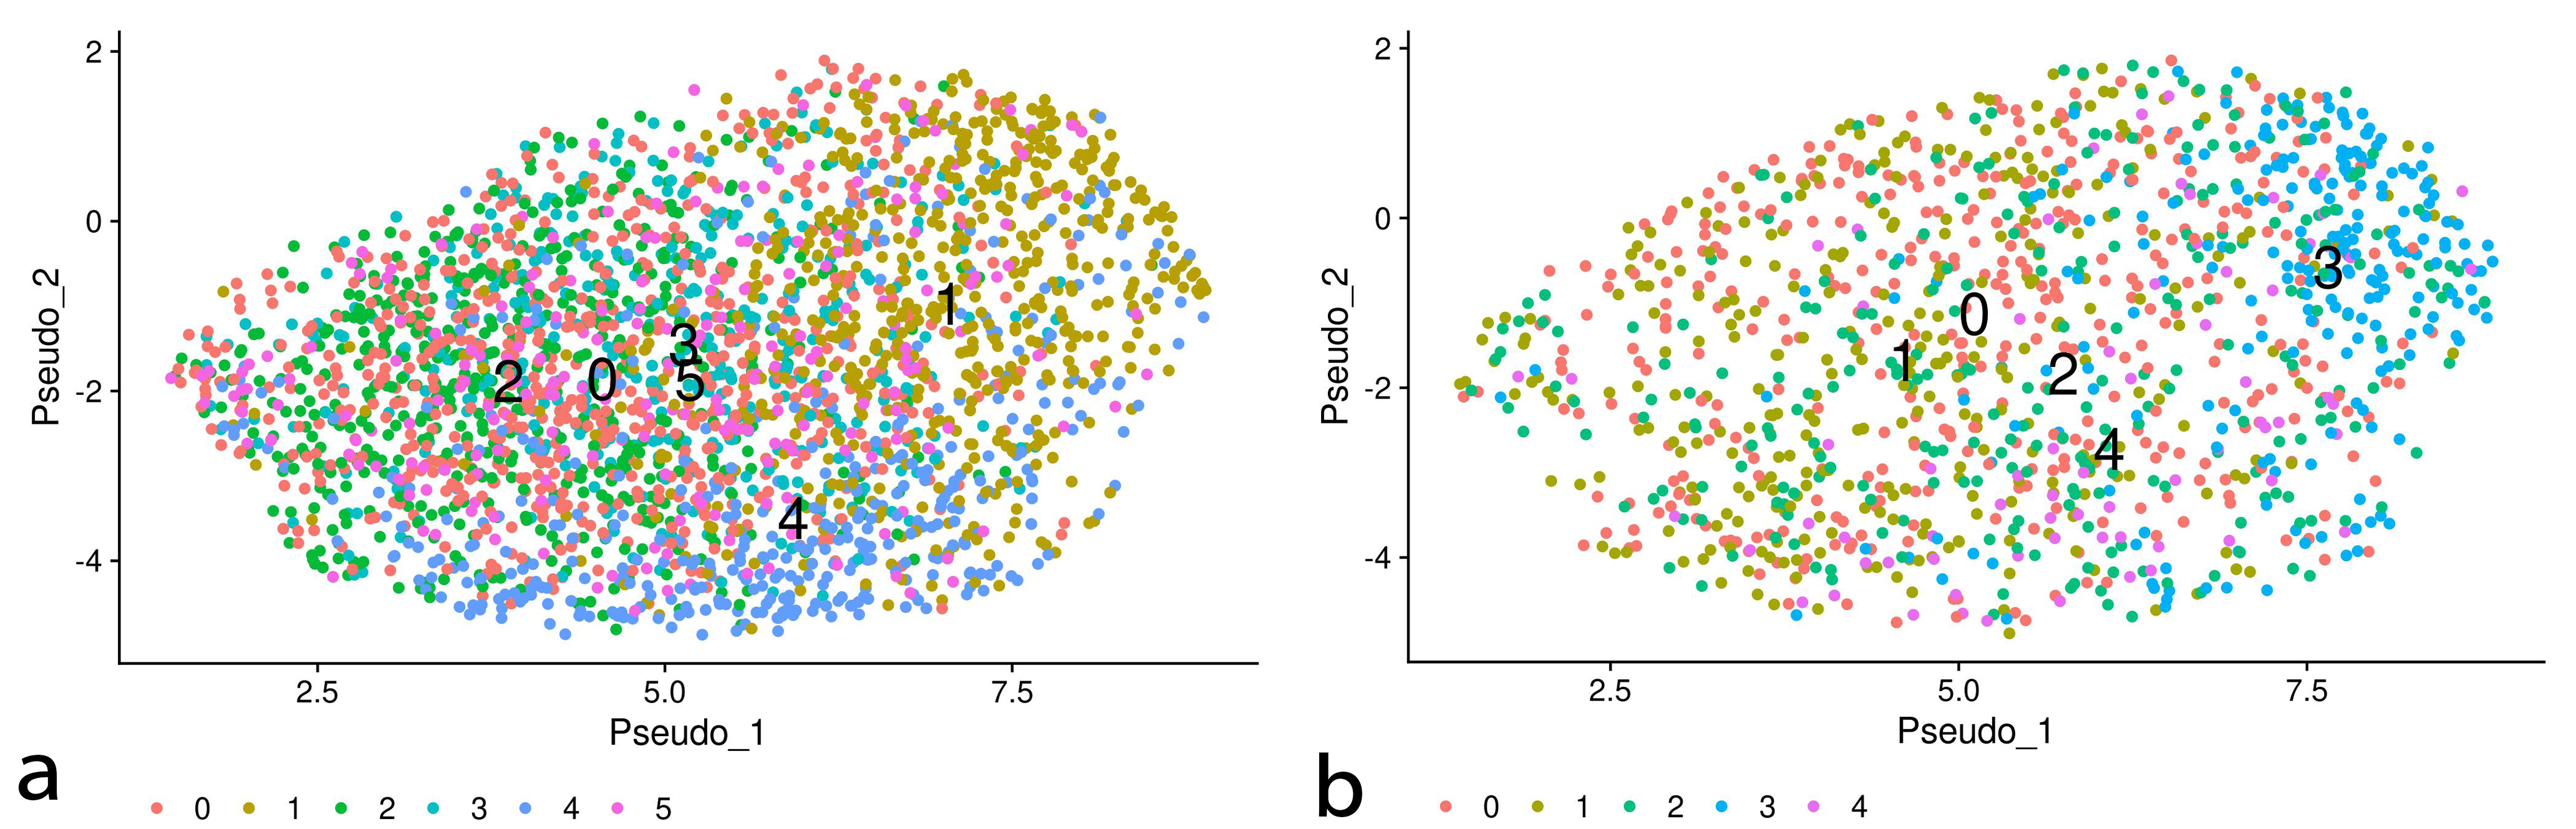 Fig. 6.
Clusters of the EMT progression/reversion samples on UMAP embeddings of DU145 cells treated with TNF. The left and right plots denote the clustering results of the EMT progression and reversion samples, respectively.
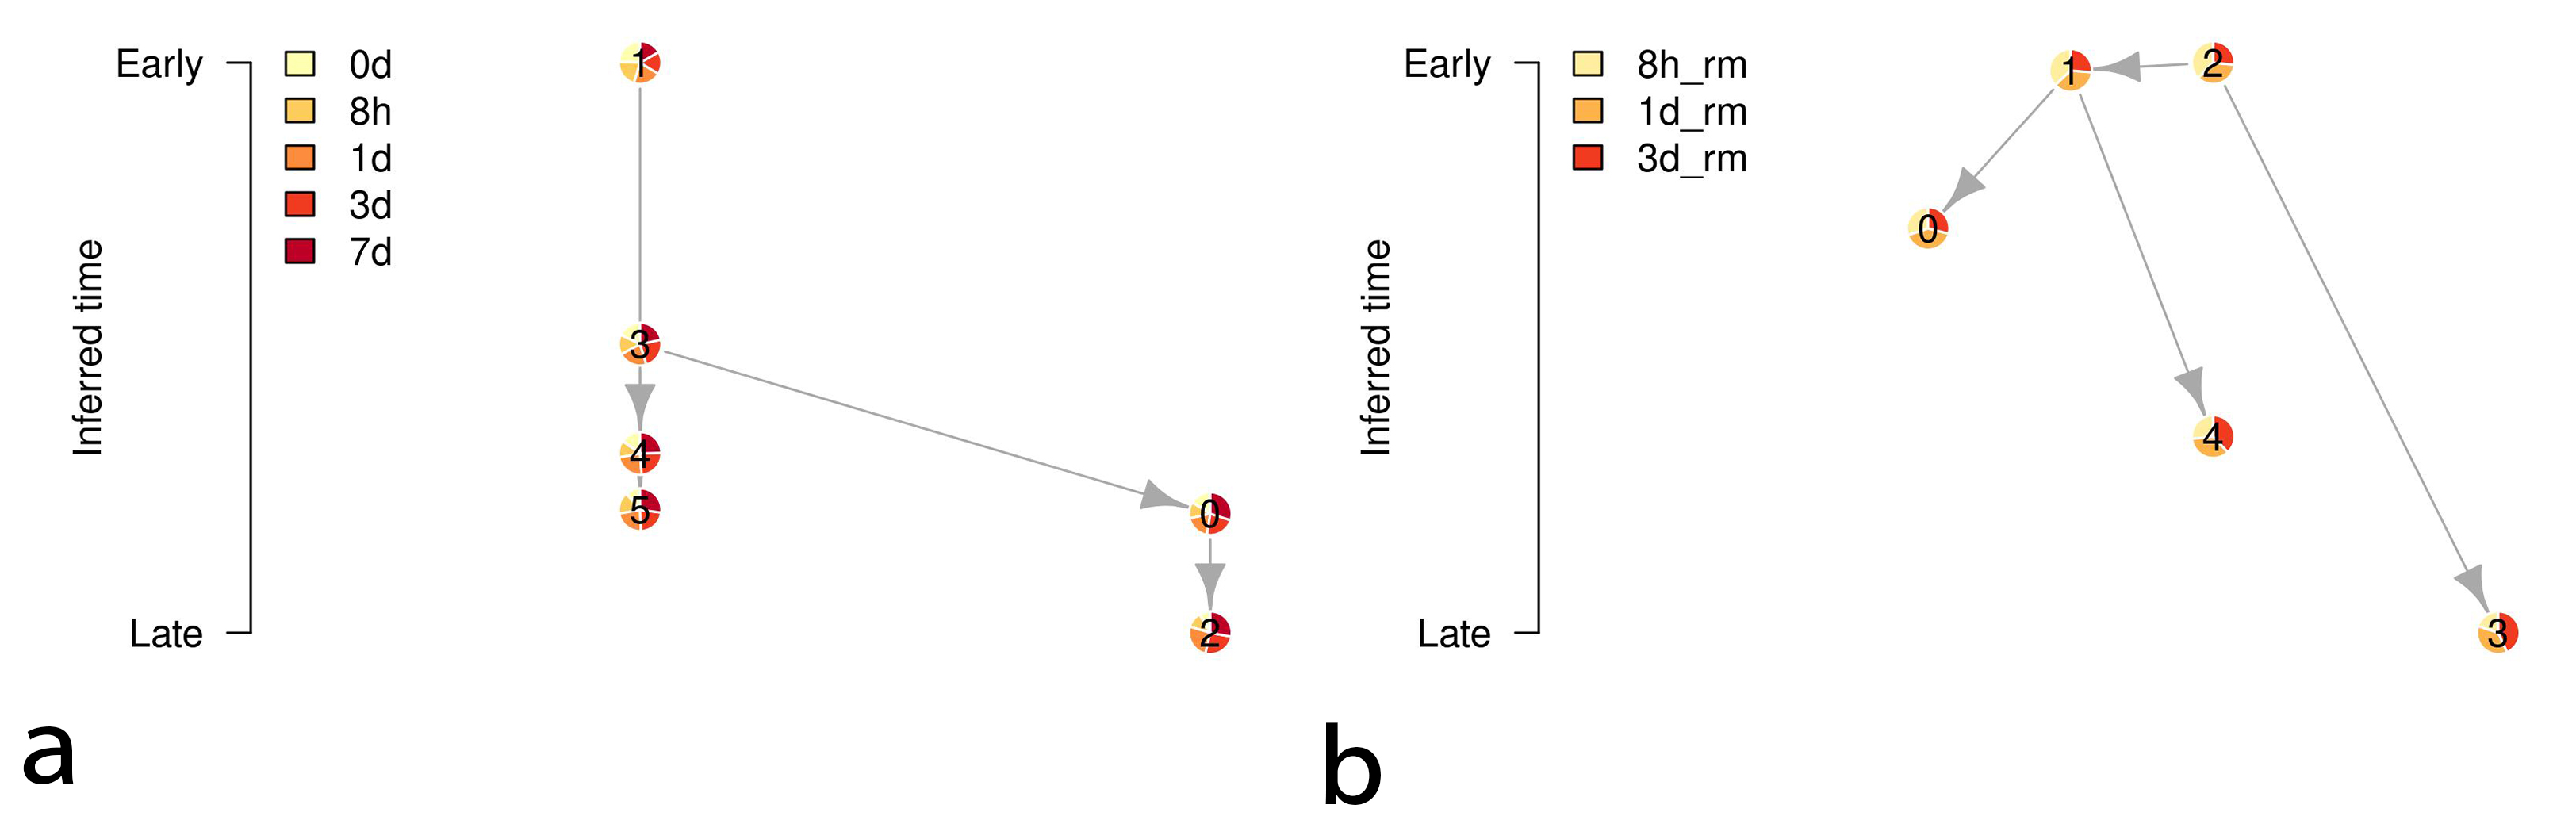 Fig. 7.
Temporal trajectories of the clusters in Fig. 6. The left and right diagrams denote the inferred trajectories of the EMT progression and reversion samples, respectively. The vertical axes denote time information of the clusters by calculating the average gene expression over all cells in each cluster. The nodes of the diagrams denote the clusters, and the proportion of the pie charts of the nodes represents the ratios of the samples with time information.
We then detected biomarkers along the branching trajectories in the EMT progression and reversion samples by using the startVsEndTest function to analyze the differential expression between the start and end points of each trajectory (two trajectories in the EMT progression and three trajectories in the EMT reversion). Tables 3,4 show the top five genes detected by this analysis. As shown in Tables 3,4, differentially expressed genes along the different trajectories do not overlap each other. This may suggest that significant diversity exists in the EMT process. However, IL32, PLPP4, and lymphotoxin-beta (LTB) were detected in both EMT progression/reversion trajectories. Fig. 8 shows the change of gene expression of LTB along the EMT progression/reversion trajectories. The gene expression of LTB exhibits similarity to that of IL32 (Fig. 3).
| 1 |
1 |
| STC1 | IL32 |
| ITGA2 | LTB |
| MMP14 | CDA |
| PRSS3 | SERPINA1 |
| RP11-221N13.3 | PLPP4 |
| The first row in the table denotes the order of the clusters along the trajectories. The other rows indicate the differentially expressed genes in descending order of the Wald statistical score (their scores are not shown). Only the top five genes are shown. | |
| 2 |
2 |
2 |
| TKTL1 | TNNC1 | IL32 |
| CTA-212A2.3 | RP11-495P10.1 | LTB |
| LMF1 | DTX4 | PLPP4 |
| TERT | GPRC5B | BCL2A1 |
| ZNF547 | LRAT | IL11 |
| The first row in the table denotes the order of the clusters along the trajectories. The other rows indicate the differentially expressed genes in descending order of the Wald statistical score (their scores are not shown). Only the top five genes are shown. | ||
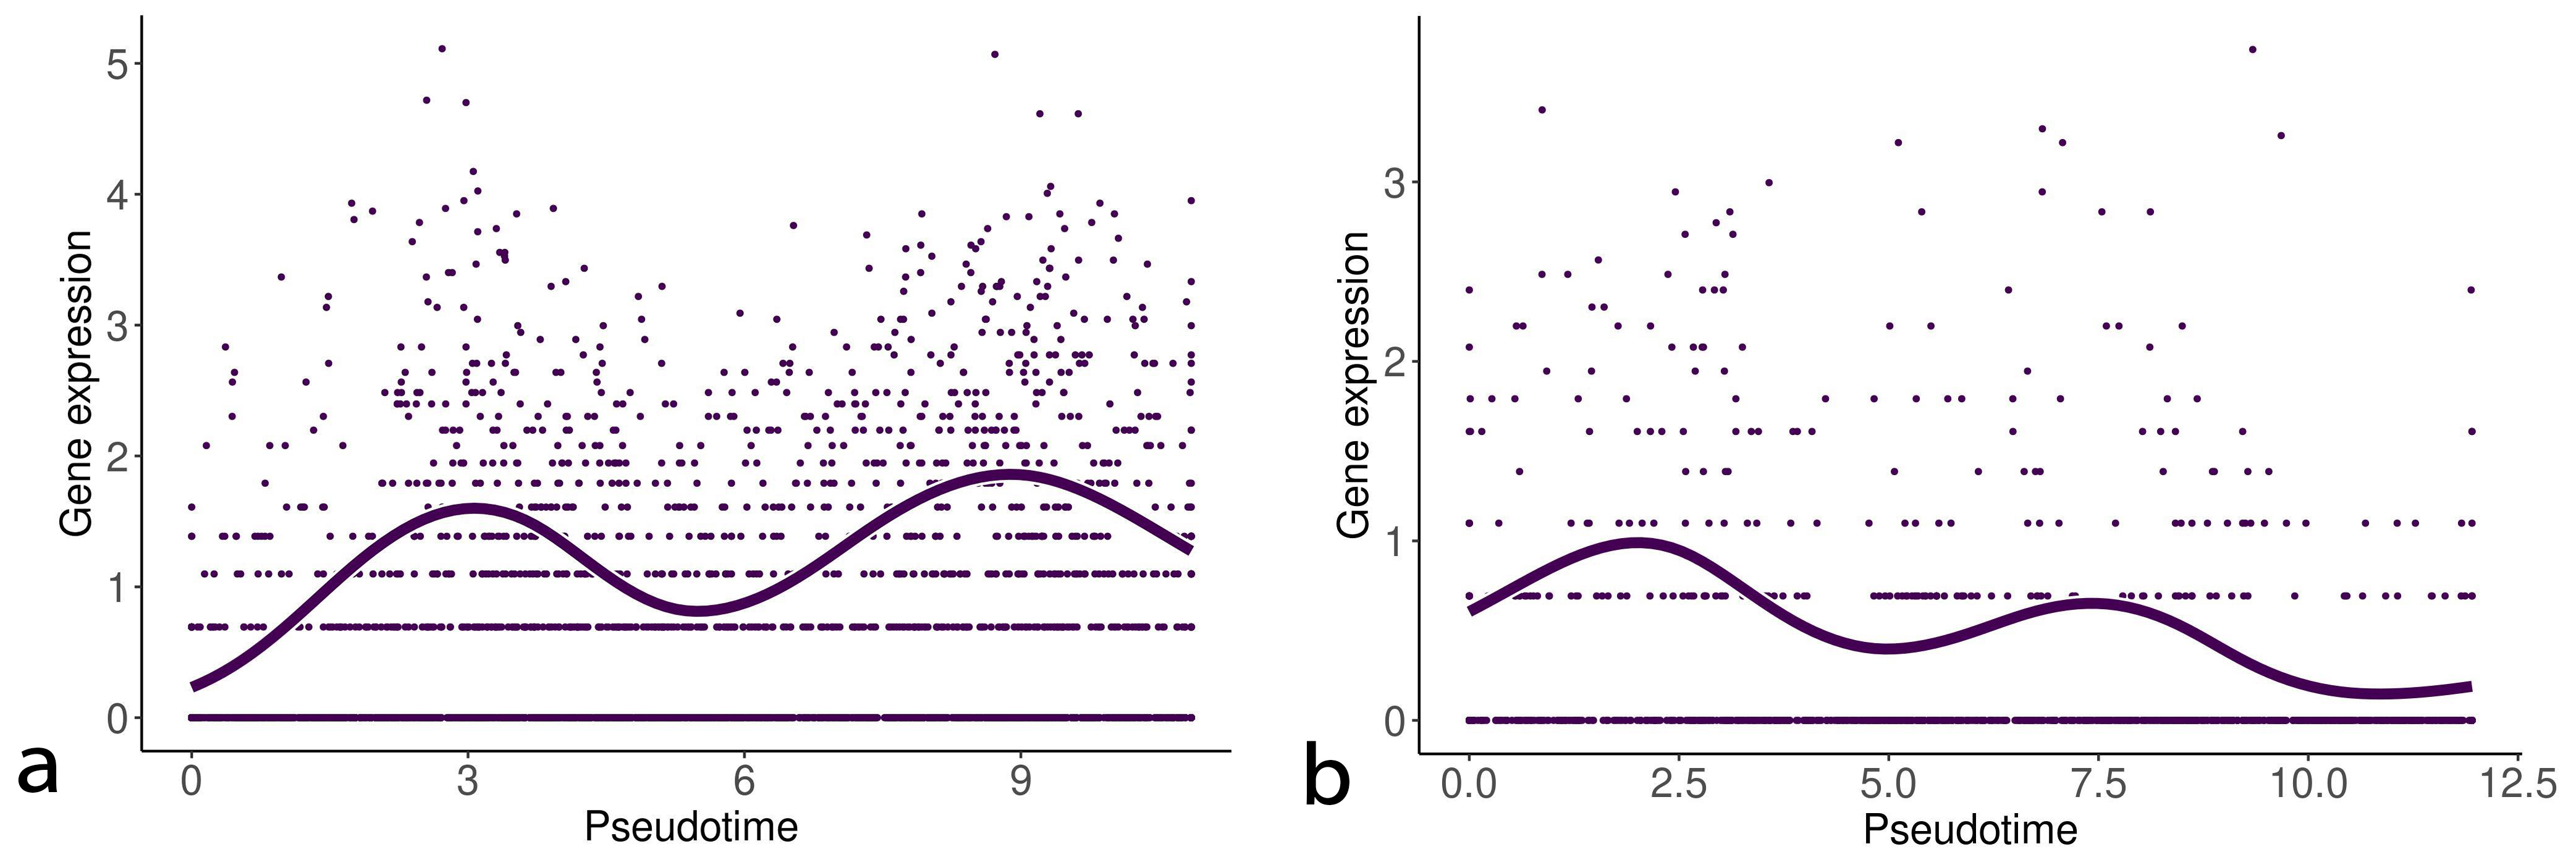 Fig. 8.
Gene expression of lymphotoxin-beta (LTB) along with the EMT progression and reversion lineages. The left and right curves denote the change of gene expression of LTB along with the EMT progression and reversion lineages, respectively.
We compared the markers described in Sect. 3.2 to the differentially-expressed markers in the previous study [10]. It has been reported that the cells in EMT progression morphologically transitioned throughout the full 7 days of EMT induction [10]. By comparison of the cells stimulated for 7 days with the unstimulated ones at a 0 time point, our method detected the genes including IL32, ITGA2, KLF6, OCIAD2, PLAU, and KRT19 as EMT-relevant genes, which were also detected in the previous study [10] as upregulated genes. Although the duration, 7 days, seems to be very long, it may be suggested to be meaningful to compare the cells of those time points. IL32 and ITGA2 were included in the EMT hallmark genes set. When we confirmed the individual pseudotime of the genes that were not detected by our approach among the genes listed in the previous studies, the expression level was constant and no change was observed (data not shown). Interestingly, PLPP4 and LTB were not included in the resulting list of the previous study (data not shown). This suggests that our detection of markers along lineage can provide a different means for understanding EMT.
To elucidate the biology of EMT is one of the key research fields for considering the next cancer treatment. Currently, lots of researchers have been trying to develop a more effective approach to identify gene expression markers by the huge amount of data from bulk RNA-seq and single-cell RNA-seq to identify the key factor of EMT. In this paper, we conducted a lineage-based differential expression analysis to identify markers that exhibit differential expression as specific lineages in EMT.
As a result of the markers detected in EMT, IL32 was identified as both the EMT progression and reversion in the conditions of TNF stimulated DU145 cells and TGFB1 stimulated OVCA420 cells. IL32 is a well-known cytokine associated with inflammation, autoimmune disease, virus infections, and cancer [15]. In particular, it has been reported that cancer-associated fibroblasts (CAF) secreted IL32 promote breast cancer cells invasion and metastasis through the enhancement of the EMT markers expression [16].
Moreover, PLPP4 was identified as both the EMT progression and reversion in the conditions of TNF stimulated DU145 cells. PLPP4 has the potential for the proliferation and tumorigenesis of lung carcinoma by promoting cell cycle progression [17]. High expression of PLPP4 is positively associated with advanced clinicopathological features and correlates with poor survival in lung carcinoma patients [17]. Furthermore, PLPP4 was identified as one of the key genes to promote bowel metastases among patients with ovarian cancer [18].
The marker detection method with clustering and temporal trajectory inference identifies LTB as well as IL32 and PLPP4 in both the EMT progression and reversion samples. LTB binds to lymphotoxin-alpha (LTA) to form membrane-bound heterodimers, and the heterodimer binds and signals through the unique partner lymphotoxin-beta receptor (LTBR) [19]. The LTBR signaling initiates inflammation-induced carcinogenesis and is related to liver and prostate cancer development [20].
While PLPP4 and LTB have not been reported as EMT-related genes so far, these reports suggest that PLPP4 and LTB might contribute to EMT in the conditions of TNF stimulated DU145 cells.
In this paper, we propose a novel method for the detection of markers related to EMT. The previous study [10] did not fully perform trajectory inference but computed pseudotime along the paths connecting the centroids of the successive time-course experiment data. Our method was able to evaluate continuous state transitions after the administration of EMT stimulating and inducing factors based on single-cell transcriptomic data, and it successfully detected potential markers, PLPP4 and LTB, which were not detected by the previous study [10]. This lineage-specific marker analysis will provide an efficient strategy to further understand the processes of changes in cell state during the EMT through the combination of the existing methods. In addition, the study [10] reported that the cells in EMT progression morphologically transitioned throughout the full 7 days of EMT induction. We might be able to analyze them over time according to their morphological changes. The study also suggested that the cells could have continued to transition following day 7. It would be important for future studies to assess the temporal limits of the EMT response.
Several studies have identified the context specificity between cancer cell lines in EMT induction. For example, it has been reported that down- and up-regulated genes in A549 (lung), ACHN (renal carcinoma), and MCF10A (breast) cell lines through microarray experiments after TGFB1/TNF treatment to induce EMT [21]. Only a small fraction of genes were common between those cell lines. McFaline-Figueroa et al. [22] propose a pseudospatial trajectory analysis of spontaneous EMT induction with single-cell RNA sequencing of MCF10A cells treated with TGFB1. They have revealed that inner and outer colony cells exhibited different stages of EMT. They ordered the cells along a linear pseudospatial trajectory to analyze the progress of cells through EMT.
Compared with those studies of EMT, our method has identified the lineages for EMT progression and reversion with individual contexts (cell lines and treatments) and has detected biomarkers for both of their lineages. If we could integrate the biomarkers of the individual contexts into a single dataset, such as a hierarchical structure from common biomarkers shared between all the contexts to context-specific ones, we could identify context-independent and/or context-specific stages of EMT. The development of the tools for such an integrated study and the diagnosis analysis of EMT remain our future works.
We applied our method to the publicly available single-cell RNA-seq data from cancer cell lines deposited in the NCBI Gene Expression Omnibus under the accession GSE147405.
EMT, epithelial-mesenchymal transition; IL32, interleukin 32; LTB, lymphotoxin-beta; MET, mesenchymal-epithelial transition; PLPP4, phospholipid phosphatase 4; TNF, tumor necrosis factor.
KM and HM designed the research study. KM and HM performed the research. KM and HM analyzed the data. KM and HM wrote the manuscript. All authors contributed to editorial changes in the manuscript. All authors read and approved the final manuscript.
Not applicable.
We thank Shigeto Seno of the Graduate School of Information Science and Technology at Osaka University for valuable advice in this study.
This work was supported in part by JSPS KAKENHI Grant Numbers JP18H04124, JP19K22894, JP20H04947, and JP21K19827 Japan.
The authors declare no conflict of interest.