


1 Department of Orthopaedics, Zhengzhou University People’s Hospital, 450003 Zhengzhou, Henan, China
2 Department of Orthopaedics, Henan Provincial People’s Hospital, 450003 Zhengzhou, Henan, China
3 Department of Orthopaedics, The First Affiliated Hospital of Zhengzhou University, 450052 Zhengzhou, Henan, China
4 Department of Pain Department, Henan Provincial People’s Hospital, 450003 Zhengzhou, Henan, China
5 Department of Radiological Department, Henan Provincial People’s Hospital, 450003 Zhengzhou, Henan, China
†These authors contributed equally.
Academic Editor: Mateusz Maciejczyk
Abstract
Background: The mutual activation between nucleus pulposus (NP) cells
death and inflammation is an important pathogenic factor of intervertebral disc
degeneration. Whether inflammation mediates NP cells necroptosis, and its
relationship with mitochondrial dysfunction and oxidative stress remains unclear.
Methods: In this study, 50 ng/mL of TNF-
Keywords
- inflammation
- nucleus pulposus cells
- necroptosis
- mitochondrial dysfunction
- oxidative stress
- intervertebral disc degeneration
Low back pain (LBP), which has become a serious public health problem, ranking sixth in the global burden of disease, is a very common clinical symptom, and more than 80% of people have experienced LBP torture during their lifetime [1, 2, 3]. Intervertebral disc (IVD) degeneration is the main pathogenic factor of LBP [4]. IVD is a fibrocartilage disc located between two adjacent vertebral bodies. It is composed of three parts: the gel-like nucleus pulposus (NP), the inner and outer fibrous annulus (AF), and the upper and lower cartilage endplates (CEP). The NP degeneration is the primary factor of IVD degeneration and plays a central role in the degeneration process [5, 6], which is closely related to NP cells death [7, 8]. Among them, apoptosis and autophagic death are often reported in previous researches. However, no ideal regulatory target has been found to efficiently prevent NP cells death during multiple stages of disc degeneration.
Necroptosis is a type of death with necrosis-like morphological characteristics. Unlike apoptosis, necroptosis exhibits caspase-independent characteristics; unlike traditional necrosis, it is a precisely regulated form of death. Due to that it breaks the traditional view that necrosis cannot be controlled, it has been listed as a newest type of programmed death following apoptosis and autophagic cell death [9, 10]. It has made important breakthroughs in tumors, brain injury, inflammatory diseases, etc., and is expected to become a new target for the treatment of many clinical diseases [11, 12, 13]. In most cases, the receptor-interacting protein kinase 1 (RIPK1)/receptor-interacting protein kinase 3 (RIPK3)/mixed series protein kinase-like domain (MLKL) axis is the classic signaling pathway to initiate and mediate necroptosis [14, 15]. However, literature has reported that activating the RIPK3/MLKL signal axis can also effectively mediate necroptosis, which does not depend on RIPK1 activation [16]; in addition, study has even confirmed that RIPK1 can inhibit RIPK3/MLKL-mediated necroptosis [17]. In other words, the regulatory mechanism of necroptosis is a complex process involving the expression and regulation of a series of molecules. Chen et al. [18] reported for the first time that necroptosis mediated by the RIPK1/RIPK3/MLKL pathway is closely involved in compression-induced NP cells death. Then, in Jun 2018 they once again reported that RIPK1-mediated mitochondrial dysfunction is closely related to compression-induced NP cells necroptosis and apoptosis [19], which provides a new direction for the study of related mechanisms of IVD degeneration.
The IVD degeneration is accompanied by inflammation, and the inflammation further intensifies the degeneration, forming a cascade amplification effect similar to the “inflammation waterfall” [20, 21]. The infiltration of the IVD mediated by inflammation is also an important pathological basis for the occurrence and development of disc degeneration and discogenic LBP [22, 23]. Thus far, there is no report about inflammation-mediated necroptosis of NP cells. In view of the fact that inflammation plays a key role in the occurrence of necroptosis, necroptosis also closely regulate the occurrence and development of inflammation; therefore, further study whether inflammatory conditions can mediate necroptosis of NP cells and clarify the precise molecular regulation mechanism, is expected to open up a new idea for effectively inhibition of NP cells death.
Regarding the underlying mechanism of necroptosis, the mitochondrial signaling pathway is a hot research topic [24]. Mitochondrial division and fusion are not only pivotal for the maintenance of mitochondrial inheritance and its own functions, but also for energy metabolism, aging and cell death [25, 26]. Mitochondrial is the regulatory center of apoptosis, autophagy and necroptosis. Literature reported that mitochondrial dysfunction caused by excessive mitochondrial division, such as increased opening of mitochondrial membrane pores (MPTP), decreased mitochondrial membrane potential (MMP), increased mitochondrial ROS production, and ATP depletion, are closely involved in necroptosis [27, 28]. However, there is still study implying that necroptosis does not depend on mitochondrial function damage such as increased opening of MPTP and decreased MMP [29]. Mitochondrial signaling pathways and necroptosis are intricate, and more researches are needed to clarify.
In the present study, we systematically addressed whether inflammation-induced NP cells necroptosis. This study is also aimed at exploring the precise mechanism of its occurrence, such as mitochondrial dysfunction and oxidative stress, and ultimately providing a brand new and more efficient strategy to prevent NP cells death.
All experimental procedures were approved by the Animal Care and Ethics
Committee of Zhengzhou University. The primary NP cells were were isolated and
cultured as previously described [18, 19]. The male
Sprague-Dawley rats (3 months, 250–300 g) were purchased from Experimental
Animal Center of Zhengzhou University.
Briefly, the NP tissue of each IVD was obtained with ophthalmic forceps and
cutted into 1 mm
TNF-
To evaluate NP cells viability, the cell counting kit-8 (CCK-8, Dojindo, Japan)
was employed. NP cells were seeded at a density of 5
The PI positive ratio (indicating necrotic cells) of NP cells were determined using PI single-staining (Nanjing Keygen Biotech, China). At each time point, the cells were harvested, stained according to the manufacturer’s instructions, and then analyzed by flow cytometry. The PI staining positive ratio allowed us to quantify the necrotic cells (PI positive).
According to the manufacturer’s (Beyotime, China) instructions, the release of LDH in culture medium was utilized to detect NP cells cytotoxicity under inflammatory condition. In brief, the LDH release activity is presented as the release of LDH in the culture medium relative to the total cellular LDH.
The NP cells were exposed to TNF-
NP cells were seeded in 24-well culture plates and treated as described above.
Following 48 hours treatment, the NP cells were washed twice with PBS, and then
incubated with Calcein-AM (2
To analyze the MMP changes in NP cells under inflammatory conditions, JC-1 fluorescent probes (Beyotime, China) was introduced into this study. Briefly, the NP cells were incubated with the JC-1 solution in the dark for 20 minutes, and then the MMP in NP cells was evaluated under flow cytometry. Finally, the evaluation of MMP is expressed as the ratio of red relative to green fluorescence intensity.
The MPTP of NP cells was measured by MPTP Fluorescence Assay Kit (Genmed,
China). At each time point, cells were collected, then 500
ROS levels in the NP cells were analyzed using the ROS-specific fluorescent
probe 2′,7′-dichlorofluorescin diacetate (H
The Rat SiRNA-RIPK1, SiRNA-RIPK3 and SiRNA-MLKL were designed and manufactured
by Biomics (Biomics Biotechnologies Co. Ltd, China) according to current
guidelines. The effective siRNA sequences for SiRNA-RIPK1, SiRNA-RIPK3 and
SiRNA-MLKL were used as follows. SiRNA-RIPK1: 5′-GUCUUCGCUAACACCACUAdTdT-3′,
5′-UAGUGGUGUUAGCGAAGACdTdT-3′; SiRNA-RIPK3: 5′-CAUGUCAGUACAACCGAGAdTdT-3′,
5′-TCTCGGTTGTACTGACATGdTdT-3′; SiRNA-MLKL: 5′-CUGGAGGCUACCAAGUAAATTdTdT-3′,
5′-UUUACUUGGUAGCCUCCAGTTdTdT-3′. The NP cells were transfected with above
effective sequence at a concentration of 100 pmol/10
Following 0, 24, 48, 72 hours TNF-
At each time point of inflammation treatment, the total RNA of NP cells was
extracted using Trizol reagent (Invitrogen, USA) according to the manufacturer’s
instructions and then transcribed into complementary DNA (cDNA). Quantitative
RT-PCR was performed using a standard PCR kit and SYBR Green/Fluorescein qPCR
Master Mix (2X) (Fermentas, Canada) on an ABI Prism 7900HT sequence detection
system (Applied Biosystems, USA). The GAPDH was used as house-keeping gene
(control), and relative mRNA expression levels of target genes were subjected to
analysis of amplification curve, and the data were calculated using the
2
Following 0, 24, 48, 72 hours treatment, the NP cells sample were lysed in a
RIPA lysis buffer (Beyotime, China) containing protease inhibitor
phenylmethanesulfonyl fluoride (PMSF, Beyotime, China) at 4
The data are expressed as the mean values
To investigate whether necroptosis was involved in inflammation-induced NP cells
death, we first examined the expression of necroptosis-associated target
molecules. The Western blot results demonstrated that the expression level of
RIPK1, p-RIPK1, RIPK3, p-RIPK3, MLKL and p-MLKL, especially p-RIPK1, p-RIPK3 and
p-MLKL, were all increased following 50 ng/mL TNF-
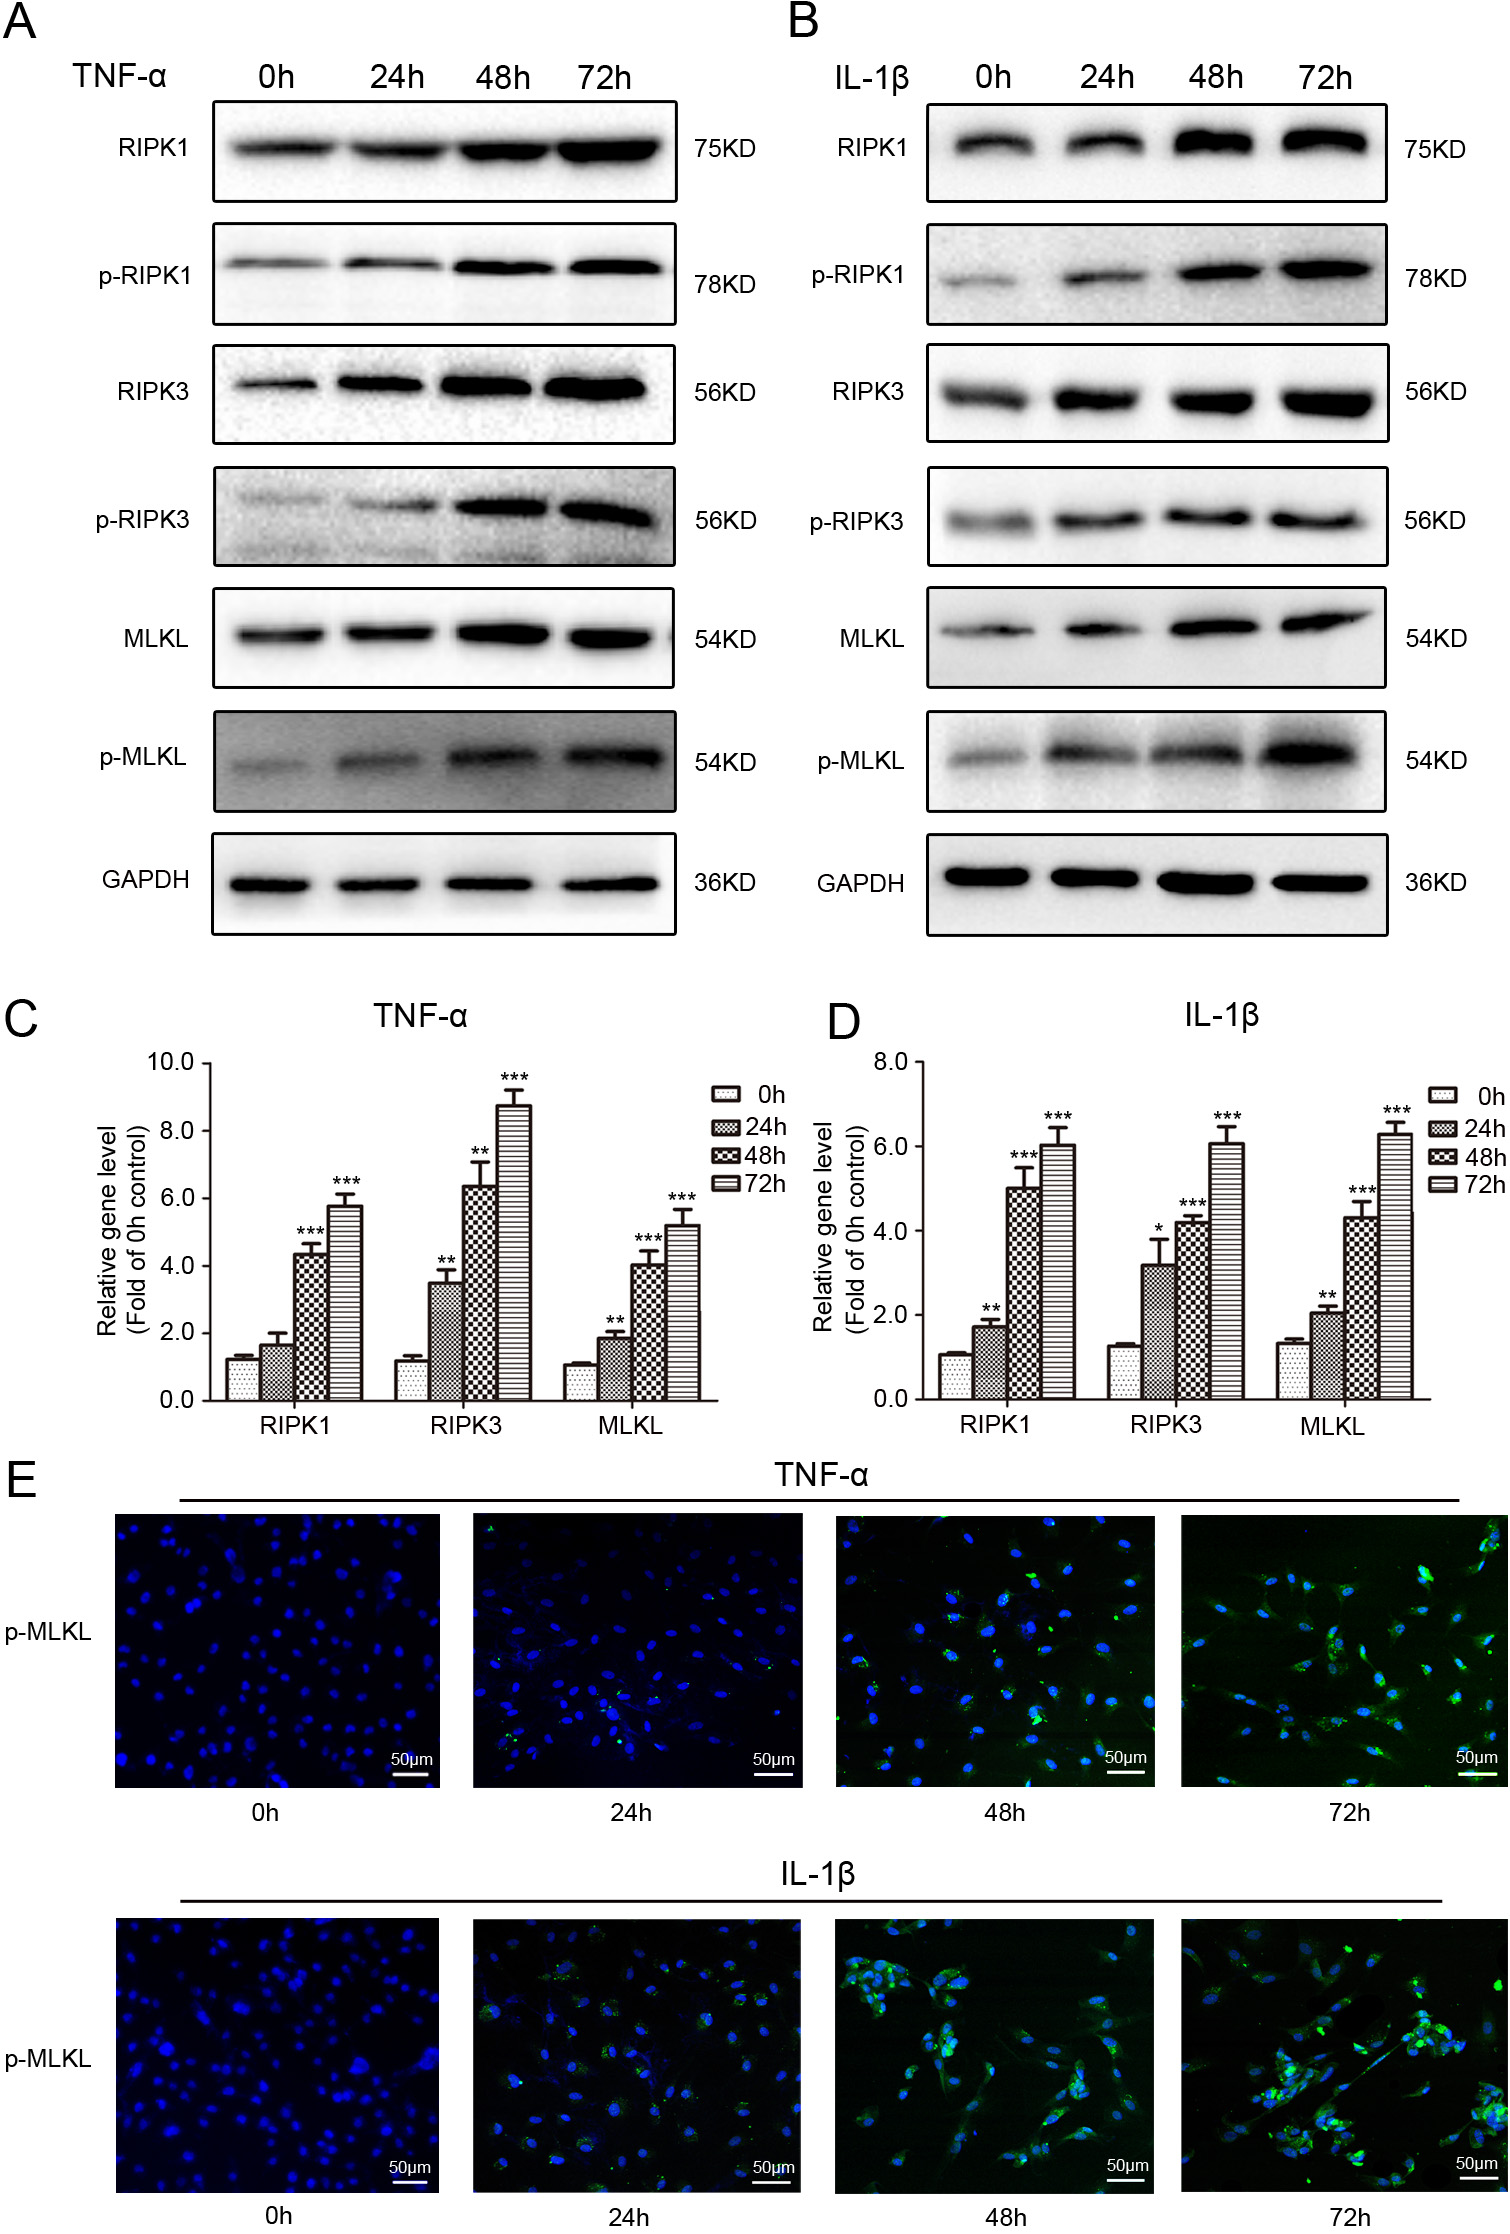 Fig. 1.
Effects of inflammatory factor on protein and gene
expression of necroptosis-associated target molecules in rat NP cells. (A,B)
Representative western-blot graphs of RIPK1, p-RIPK1, RIPK3, p-RIPK3, MLKL,
p-MLKL and GAPDH in NP cells subjected to 50 ng/mL TNF-
To further confirm the involvement of necroptosis in inflammation-induced NP
cells death, we used necroptosis specific inhibitor Nec-1 to treat NP cells under
inflammatory conditions. The results of CCK-8 assays showed that Nec-1 markedly
improved the decreased activity of NP cells caused by
50 ng/mL TNF-
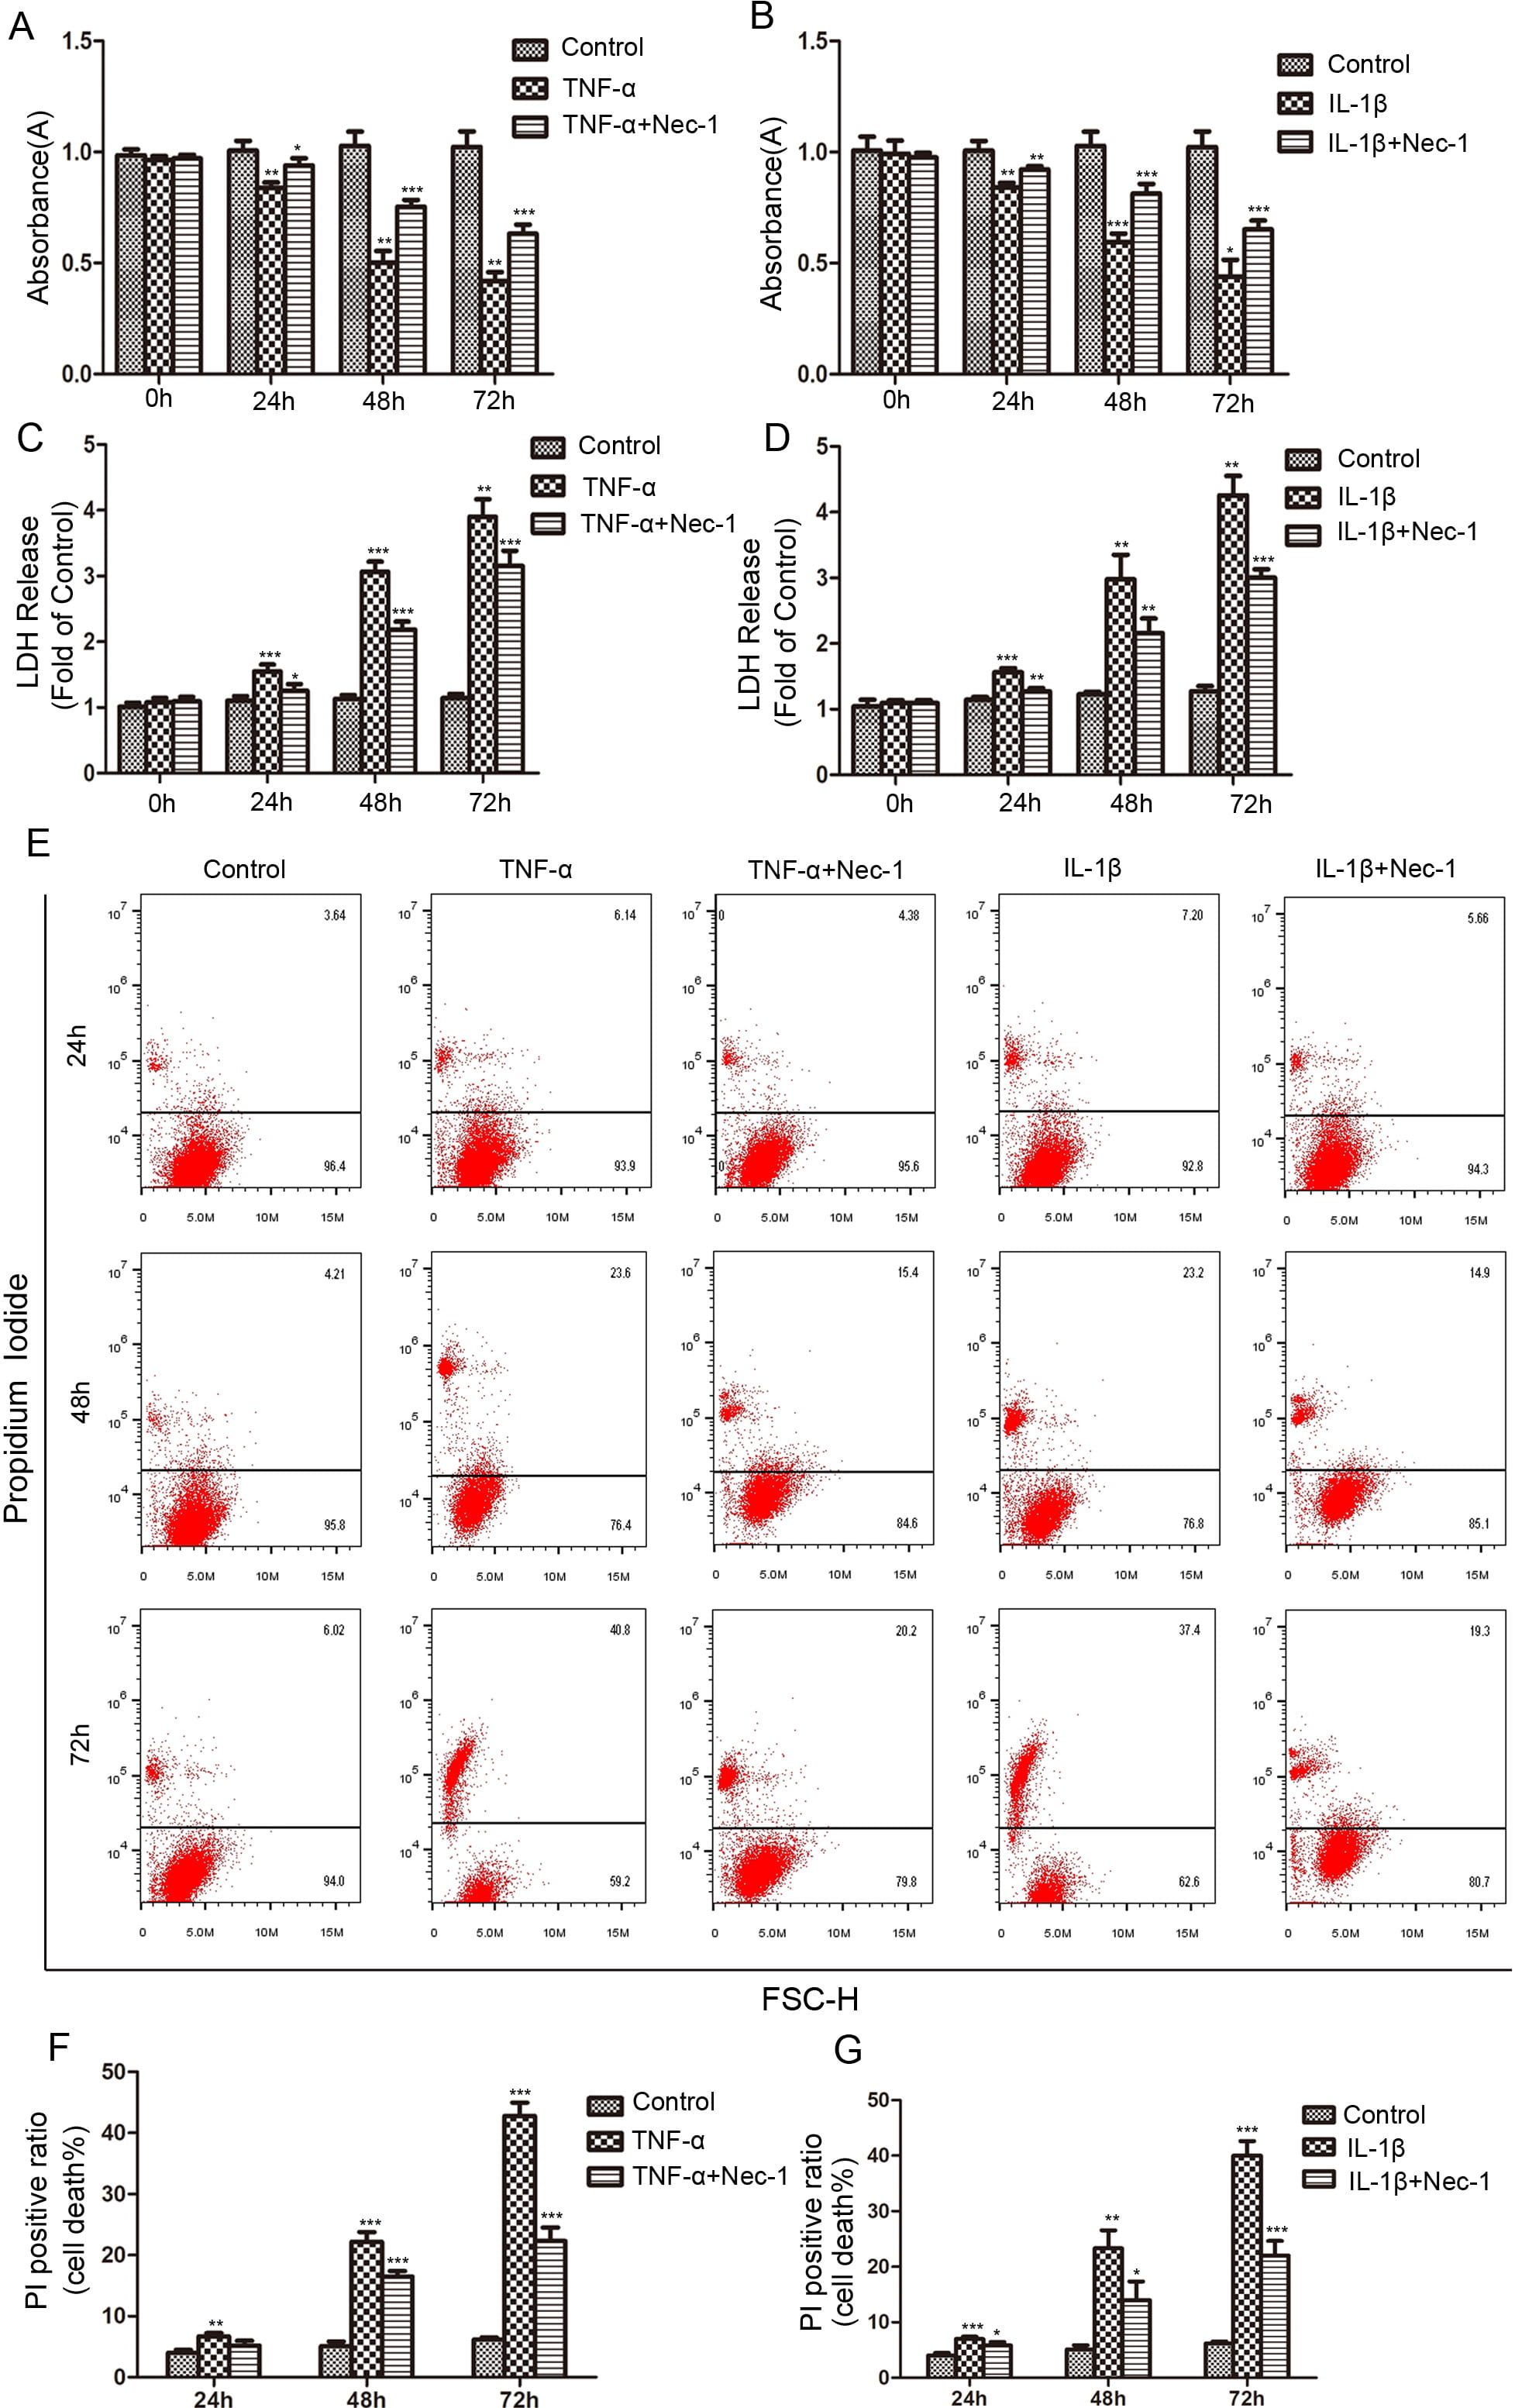 Fig. 2.
The protective effects of Nec-1 (20
In order to further systematically verify that necroptosis is involved in NP
cells death induced by inflammatory factors, we also introduced RIPK3 specific
inhibitor GSK872 (5
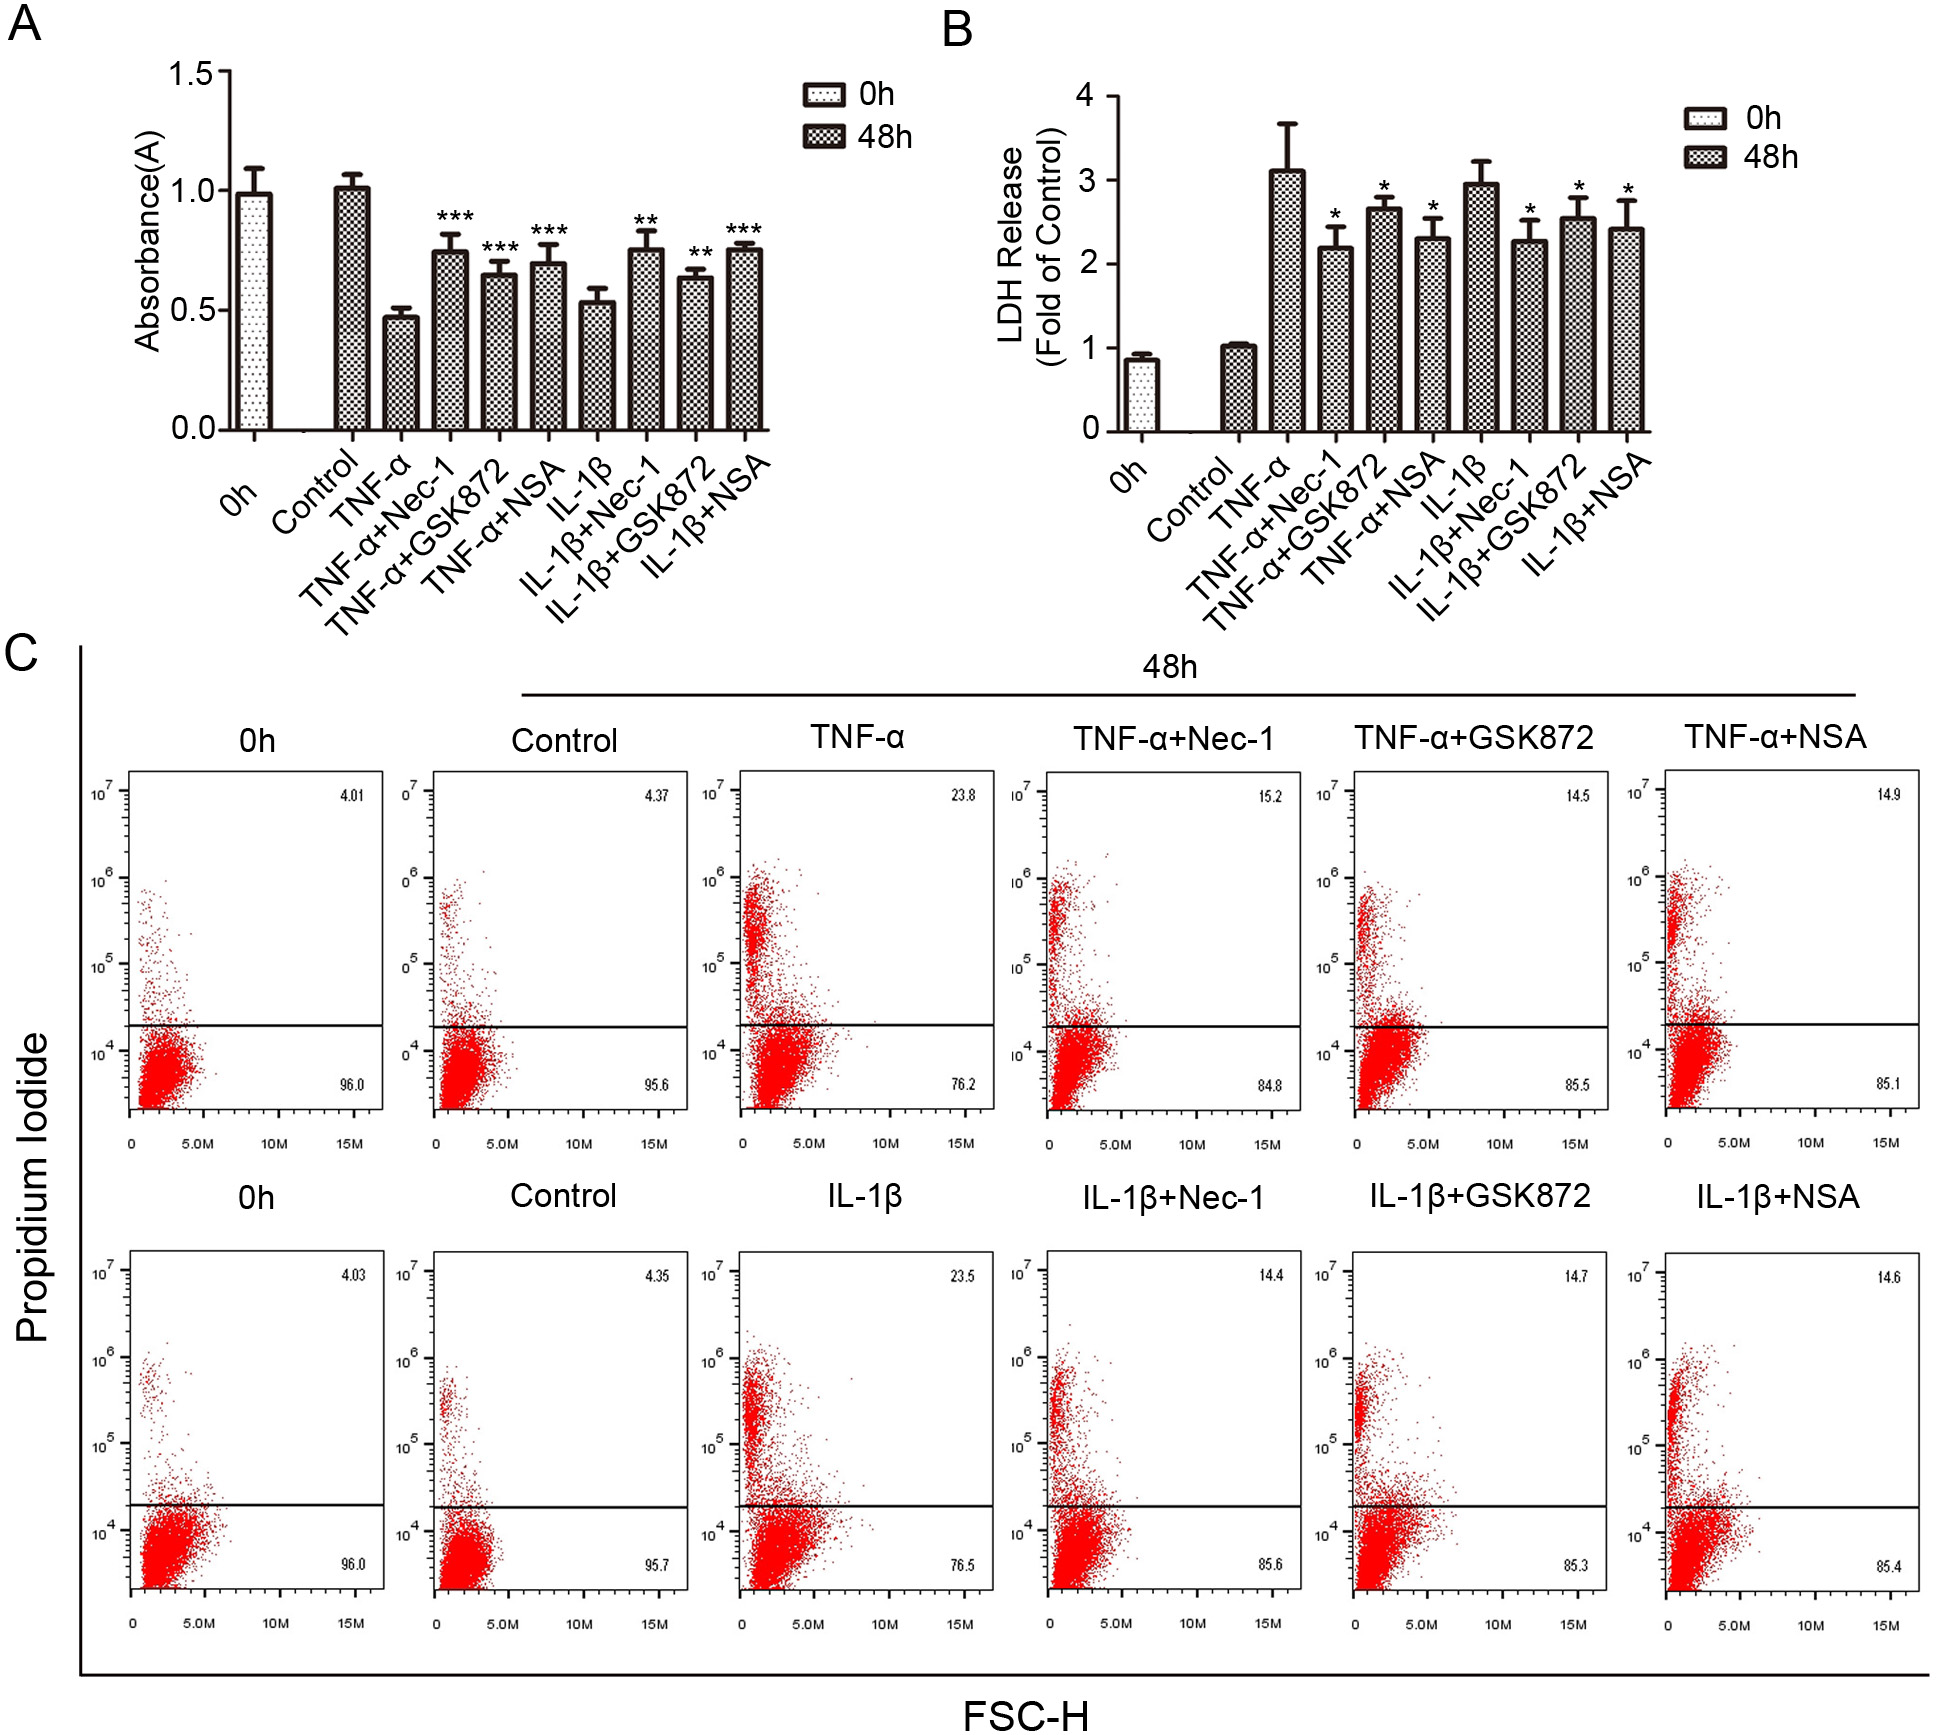 Fig. 3.
The viability and death changes of rat NP cells treated with
necroptosis specific inhibitors. (A) Following co-treatment with necroptosis
specific inhibitor Nec-1 (20
After 48 hours exposure of NP cells to TNF-
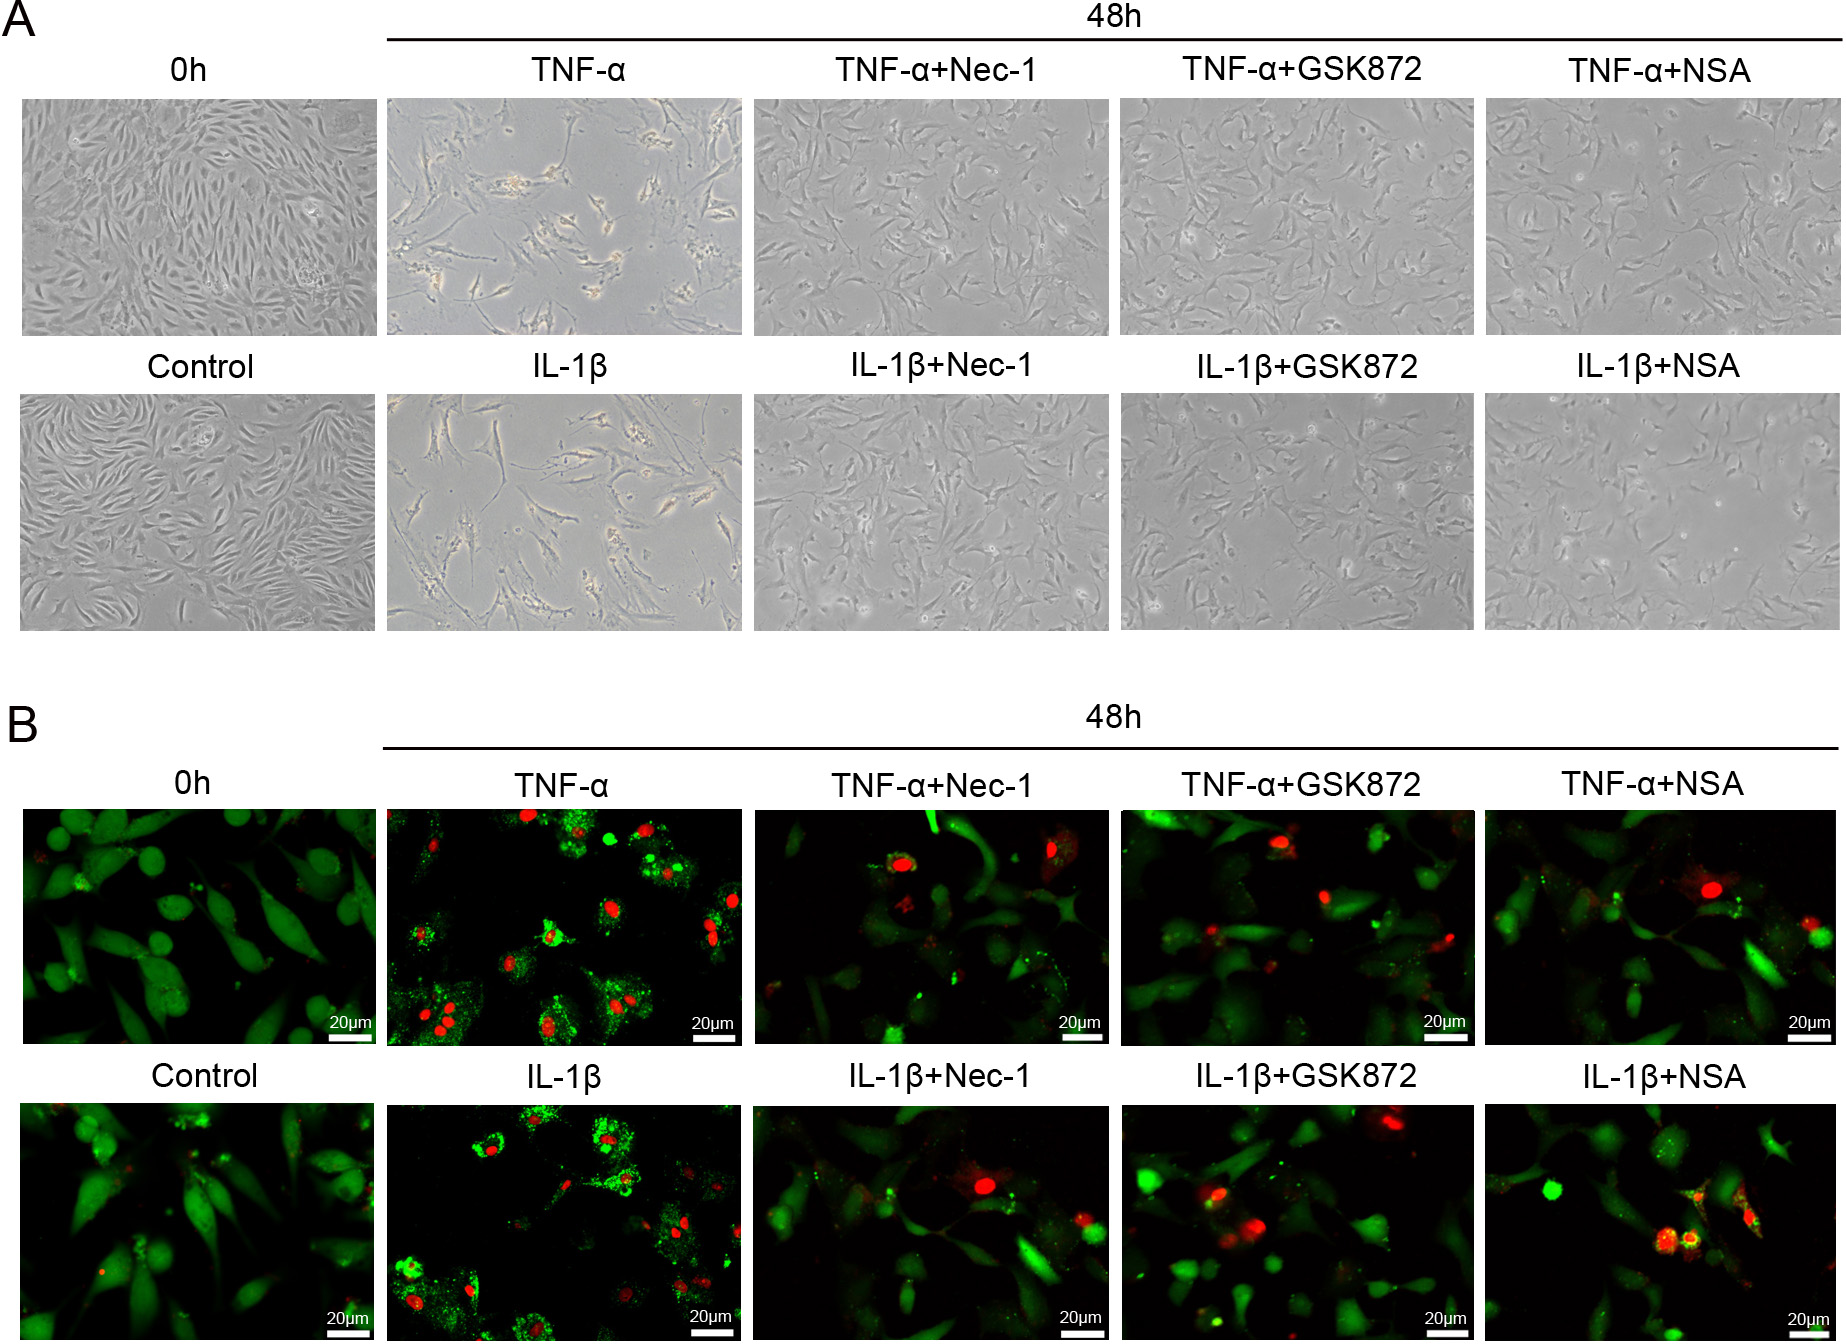 Fig. 4.
The morphological changes of rat NP cells treated with
necroptosis specific inhibitors. (A) The
morphological changes of NP cells exposed to 50 ng/mL TNF-
To investigate the role of SiRIPK1, SiRIPK3 and SiMLKL in inflammation-induced
NP cells death, NP cells were treated with effective SiRIPK1, SiRIPK3 and SiMLKL
sequences respectively according to our previous researches. The Western blot and
RT-PCR results displayed that the transfected SiRNA sequences resulted in a
marked decrease in protein and gene expression levels of constitutive RIPK1,
RIPK3 and MLKL respectively (Fig. 5A,B,D,E,G,H). The NP cells were treated with
these SiRNAs for 48 hours, prior to exposure to TNF-
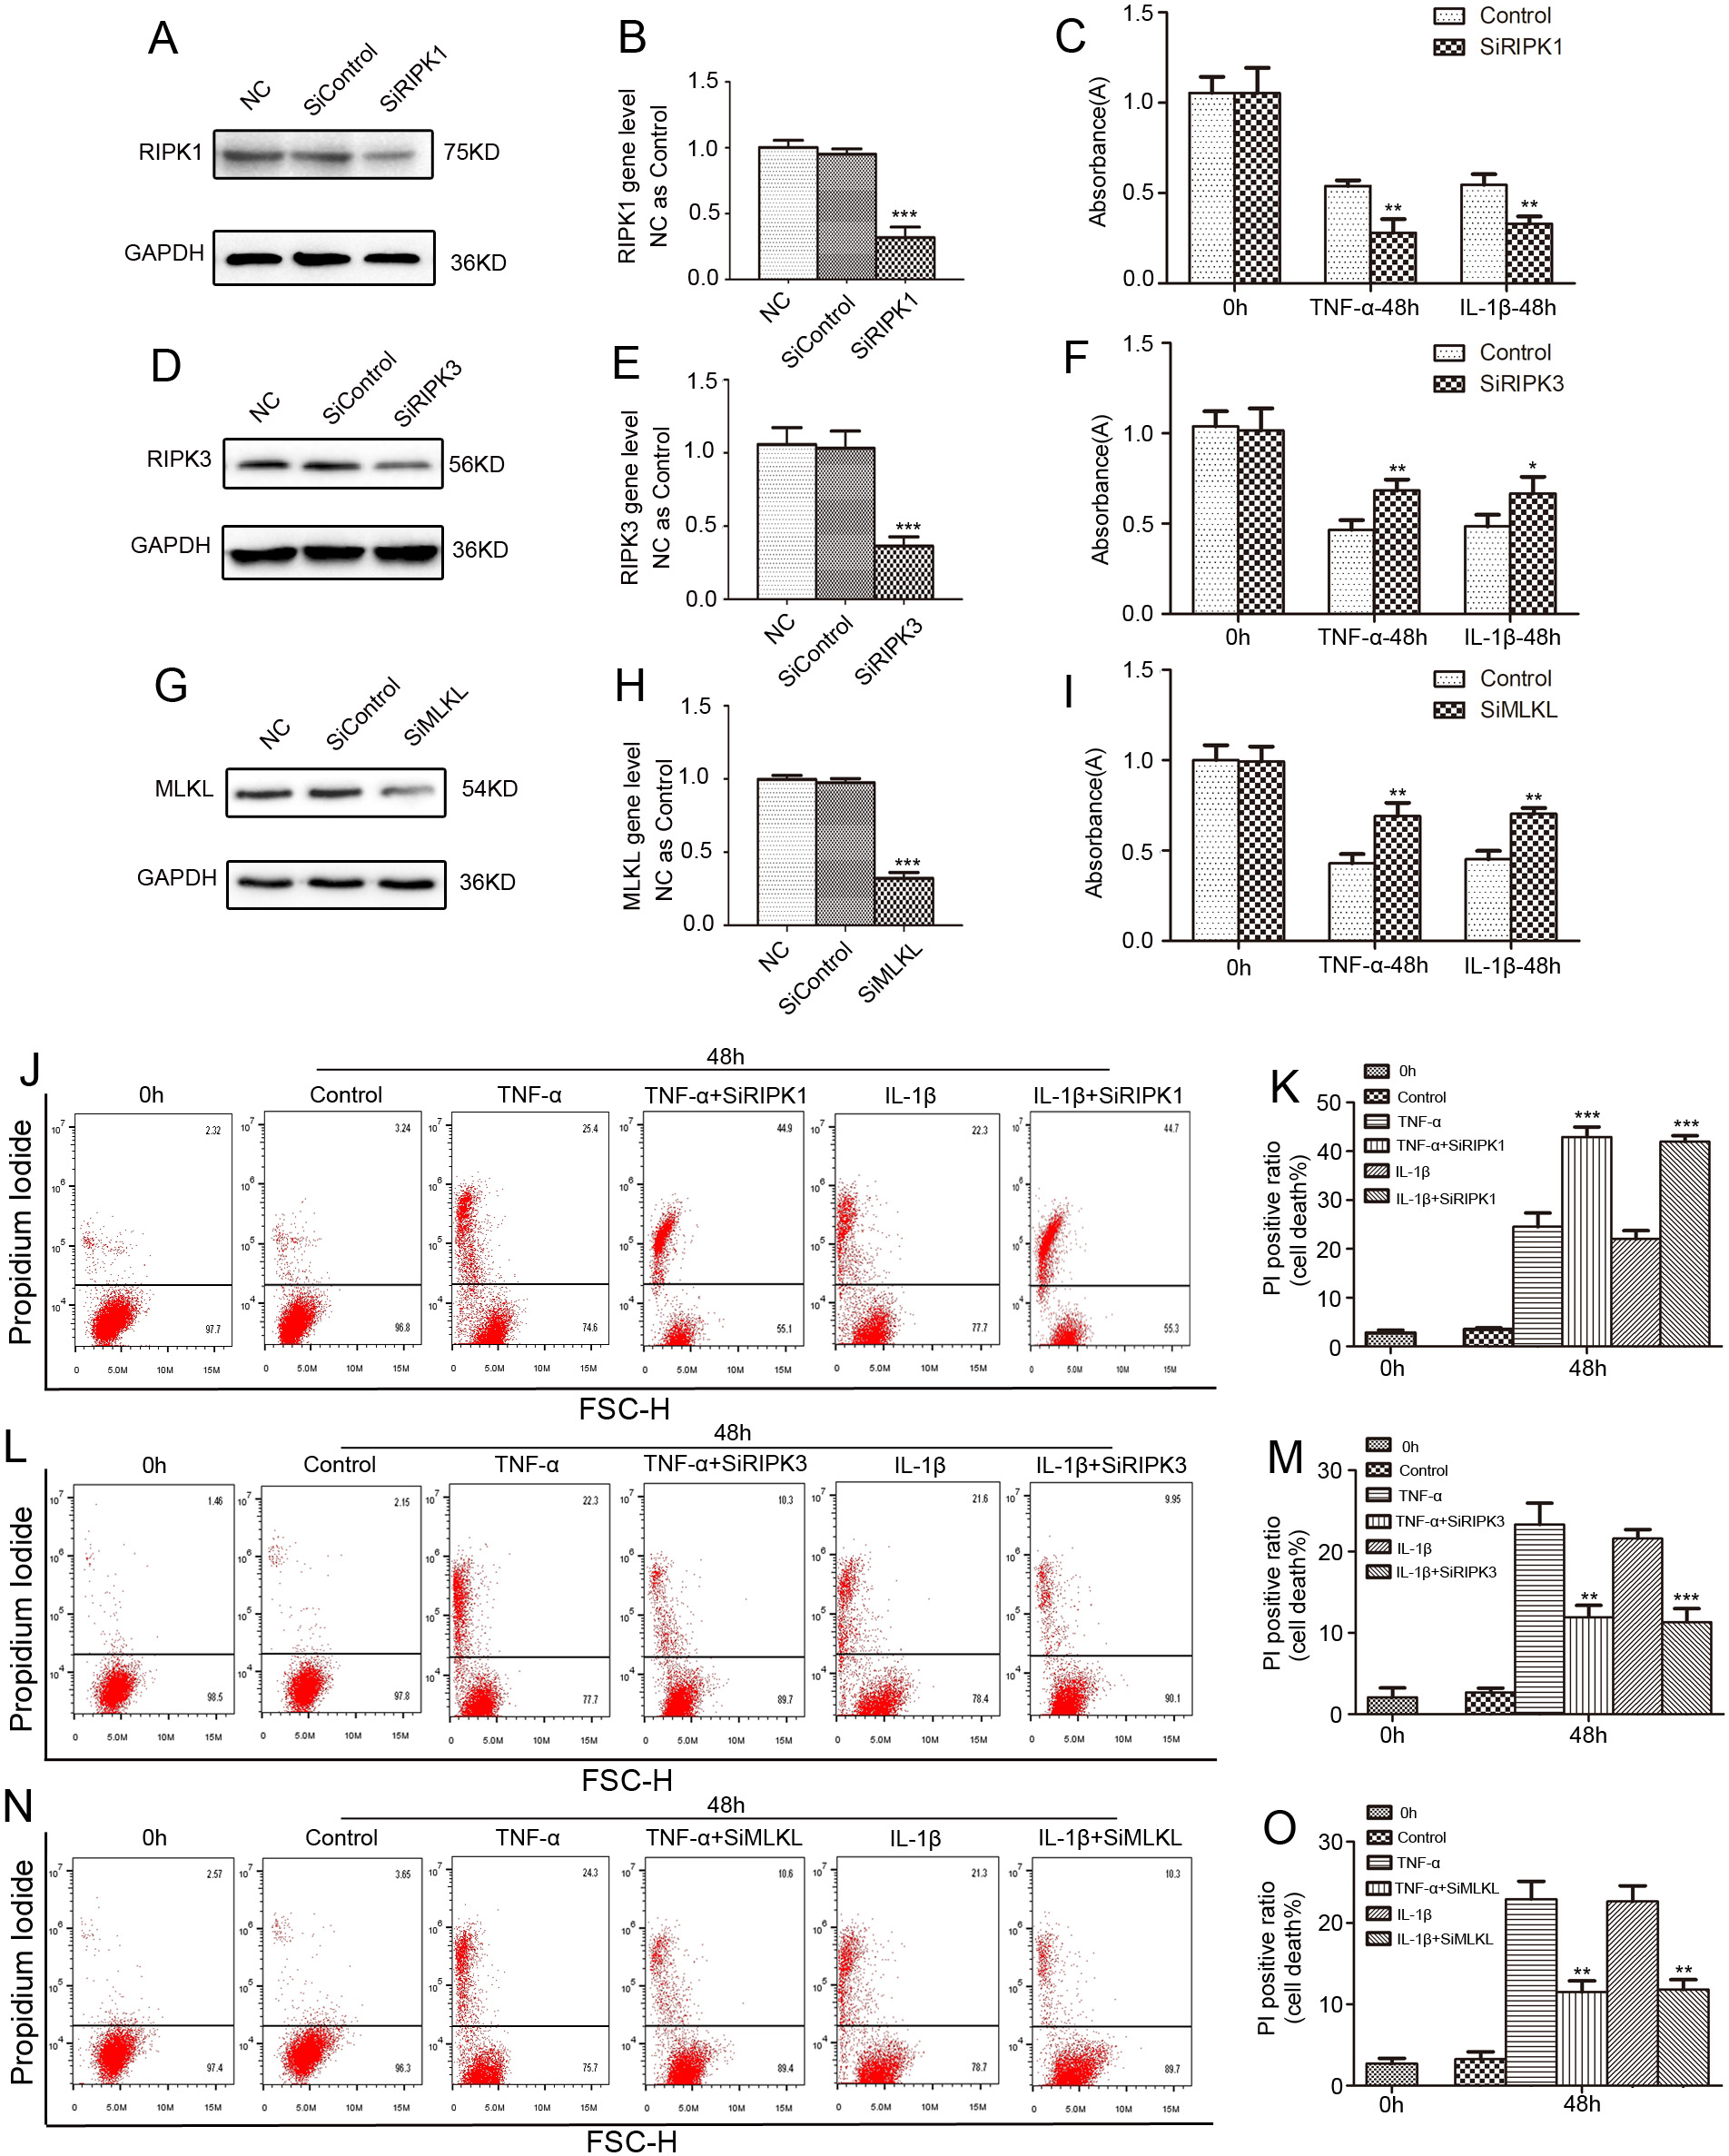 Fig. 5.
The inflammation-induced rat NP cells death is inhibited by
SiRIPK3 and SiMLKL, but aggravated by SiRIPK1. (A,B) The NP cells were treated
with SiRIPK1 or nonspecific RNA (negative control, NC) for 48 hours, and total
protein and gene expression levels were measured. (D,E) The NP cells were treated
with SiRIPK3 or NC for 48 hours, and total protein and gene expression levels
were measured. (G,H) The NP cells were treated with SiMLKL or NC for 48 hours,
and total protein and gene expression levels were measured. The NP cells were
pretreated with the selected siRNA sequence for 48 hours and then exposed to 50
ng/mL TNF-
The normal cells stained with JC-1 exhibited abundant red along with little
green fluorescence. The JC-1 aggregates were dispersed to green fluorescence when
the cells suffered from damages. Following 48 hours exposure of NP cells to
TNF-
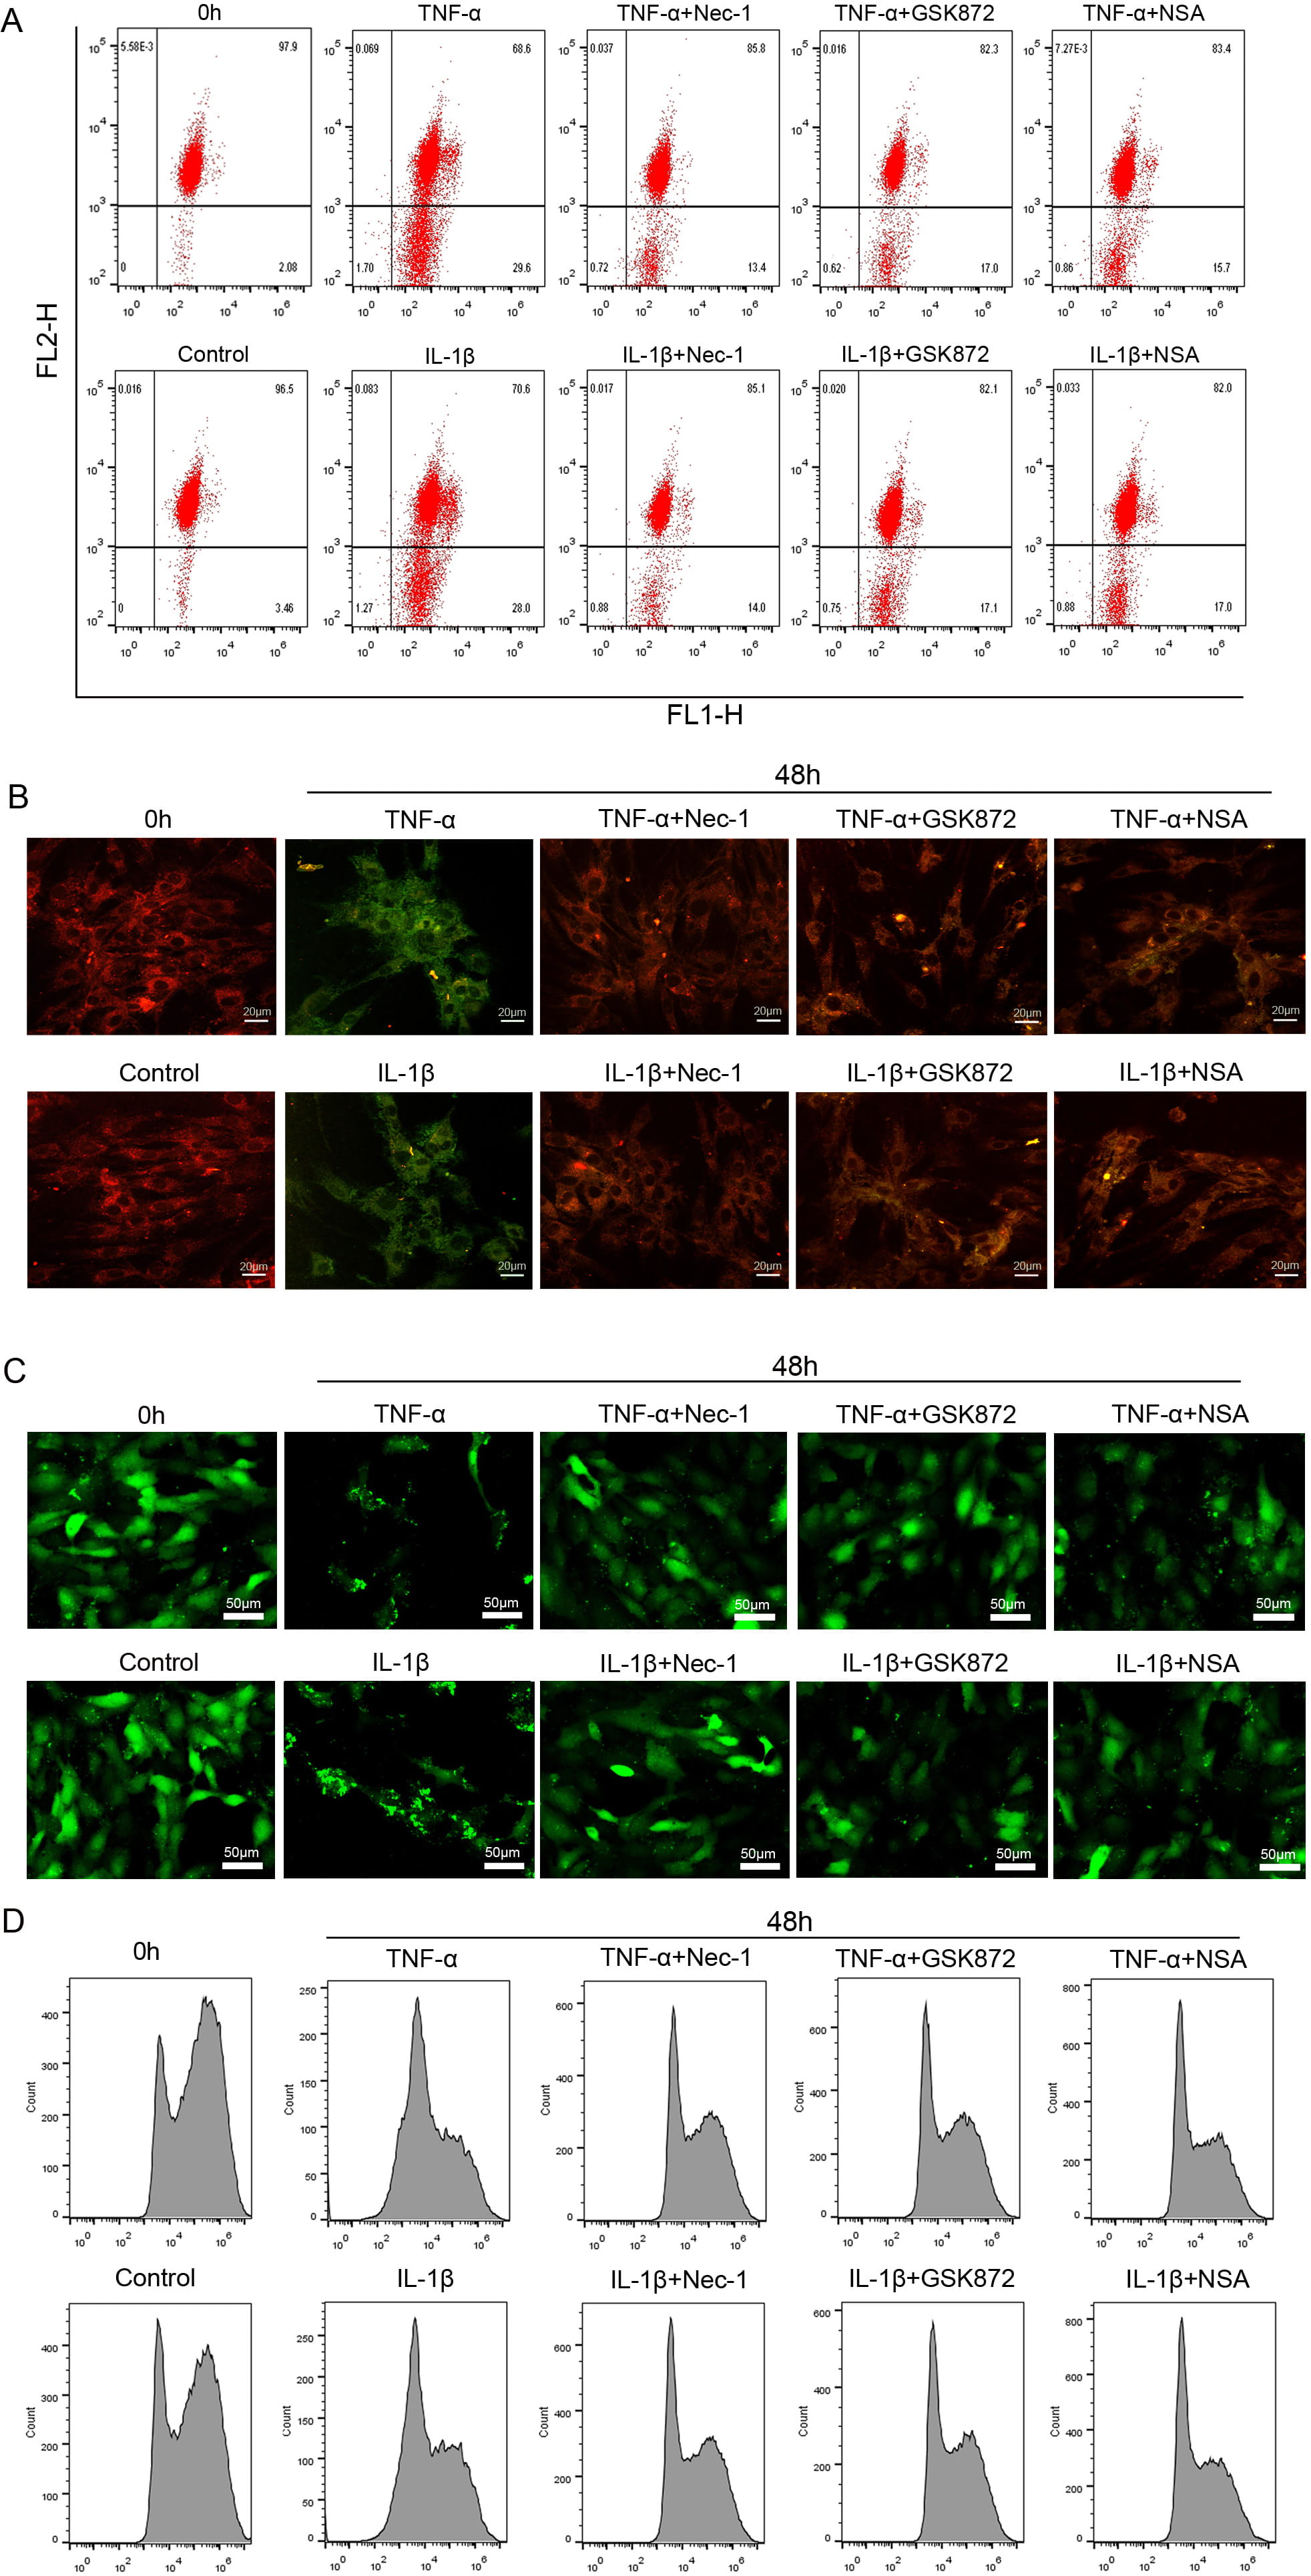 Fig. 6.
The inflammation-induced MMP loss and mPTP opening in
rat NP cells were largely reversed by necroptosis specific inhibitors.
(A) Representative dot plot of MMP in NP cells exposed to 50
ng/mL TNF-
To investigate ROS in inflammation-mediated NP cells necroptosis, ROS generation
was measured after DCFH-DA staining. Compared with 0 hour, the
DCF positive ratio was increased after 48 hours TNF-
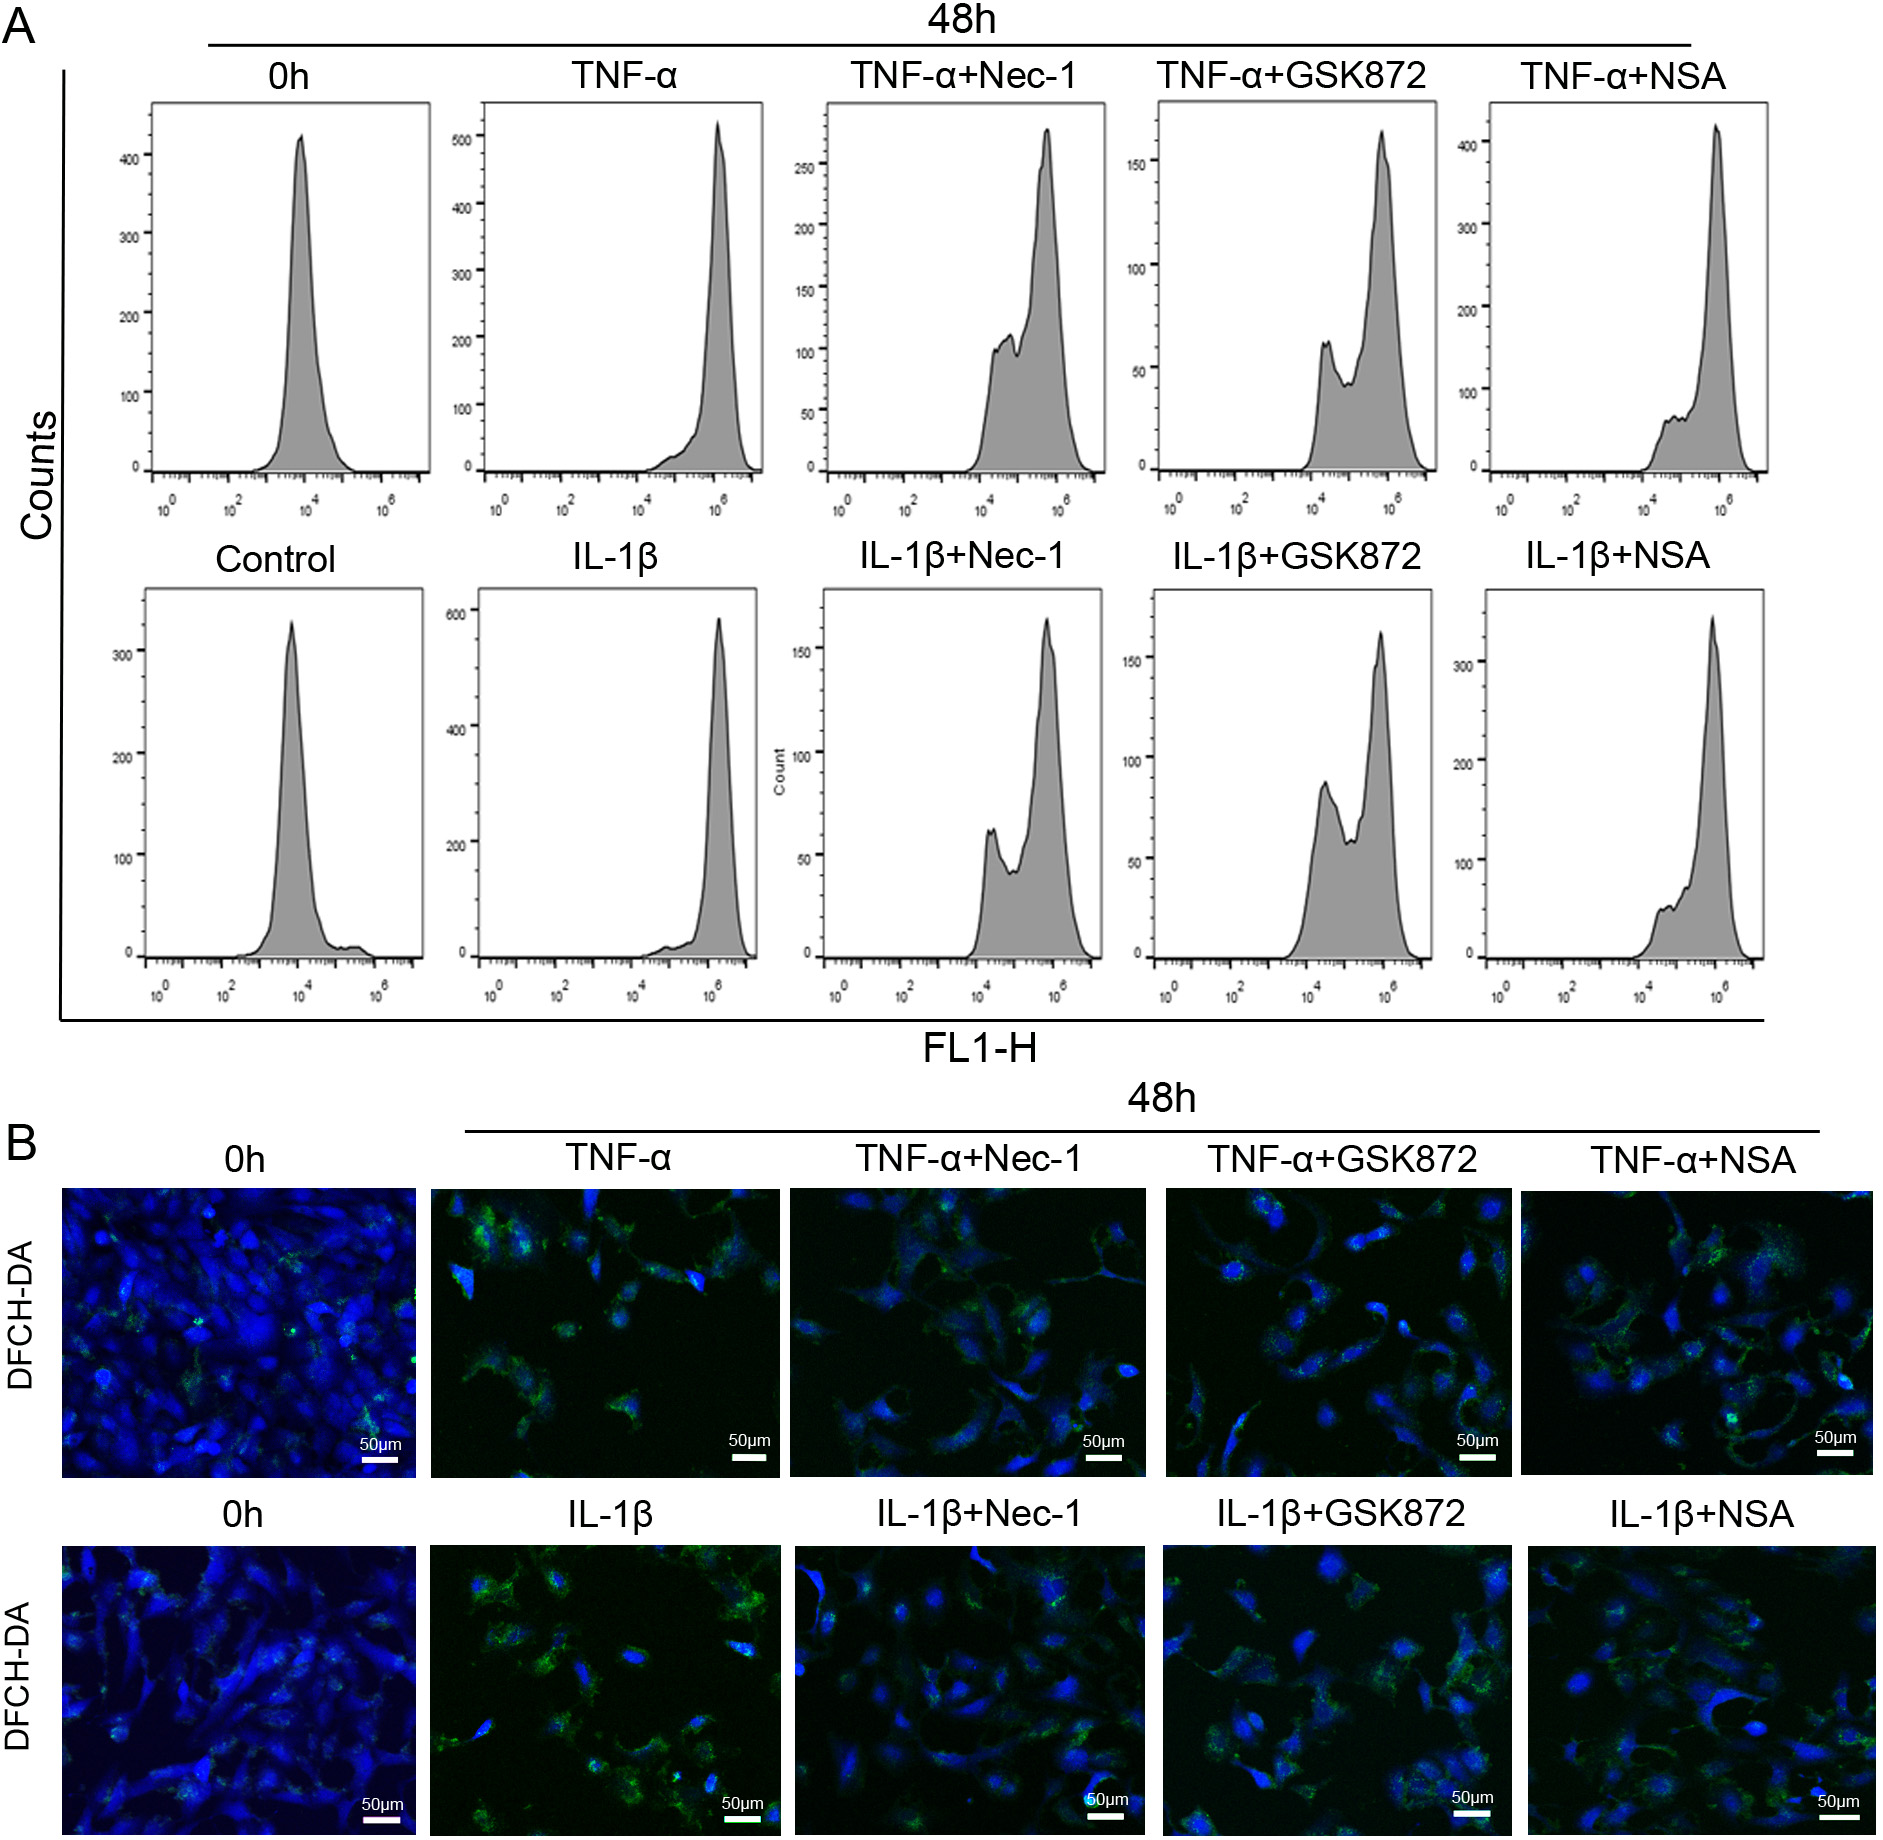 Fig. 7.
The inflammation-induced oxidative stress in rat NP cells were
largely reversed by necroptosis specific inhibitors. (A) Representative plots of
ROS in NP cells exposed to 50 ng/mL TNF-
The IVD degeneration not only involve a large population of middle-aged and elderly people, but also show a rising trend among young people [34, 35]. The conservative therapy and surgical therapy are currently used in clinical practice. Conservative therapy can alleviate clinical symptoms to a certain extent, but cannot reverse the biological function of the degenerated IVD; while the surgical therapy represented by discectomy and fusion have problems such as the inability to restore the normal height and weight-bearing capacity of IVD, and even aggravate problems such as degeneration of adjacent segments [36, 37]. Therefore, in-depth research on the precise molecular mechanism of IVD degeneration and exploring new ways to prevent and treat IVD degeneration is a major demand in the health field.
The interaction between NP cells death and inflammation plays a key role in the
occurrence and development of IVD degeneration [38, 39]. Necroptosis is generally
considered to be a death mode that aggravates the development of inflammation.
For example, in a study of TNF-
In current study, following 50 ng/mL TNF-
In order to further clarify the role of RIPK1/RIPK3/MLKL pathway in the process
of inflammation-induced NP cells necroptosis, NP cells were treated with
effective SiRIPK1, SiRIPK3 and SiMLKL sequences respectively. Contrary to Nec-1,
SiRIPK1 treatment reduced the activity of NP cells and exacerbated NP cells death
under inflammatory conditions. As expected, both SiRIPK3 and SiMLKL notably
restrained TNF-
Classically, necroptosis signaling was thought to involve mitochondrial
dysfunction and increased oxidative stress level mainly originated from the
mitochondria in the execution of cell death [44, 45]. The close association
between necroptosis and mitochondrial dysfunction is illustrated in many studies.
For example, the latest literature report that SIRT3 deficiency aggravate
hyperglycemia-induced mitochondrial damage, increased ROS accumulation, promote
necroptosis, possibly activate the NLRP3 inflammasome, and ultimately exacerbate
diabetic cardiomyopathy in the mice [46]. Mitochondrial dysfunction can greatly
promote the occurrence of necroptosis involving a variety of mechanisms,
including production of mitochondrial ROS [47], activation of mitochondrial
phosphatase phosphoglycerate mutase family member 5 [48], or promotion the
opening of MPTP [49]. However, there is still study showing that the occurrence
of necroptosis does not depend on mitochondrial function damage such as increased
opening of MPTP and decreased MMP [29]. The current study demonstrates that,
under inflammation treatment conditions, Nec-1, GSK872, or NSA may via inhibition
mPTP opening and MMP loss to alleviate NP cells necroptosis; meanwhile, the
results suggest that the TNF-
At present, the efficacy of these inhibitors are mainly reflected by cell experiments, and there are few studies focus on in vivo animal experiments to verify the effects of these drugs. In animal model studies and clinical studies related to IVD degeneration, there is no report about that necroptosis inhibitors can directly improve IVD degeneration. This is the key content that our research group is currently working on. In our study, several limitations need to be pointed out. First, no in vivo experiments were conducted. The drug concentrations of related inhibitors screened by cell experiments are difficult to apply to animal models. Hence, we intend to investigate whether inflammatory stimulation mediates NP cells necroptosis through mitochondrial function disfunction and oxidative stress pathway in vivo in subsequent studies. Only in this way can we better translate to animal models and clinical research. Second, the disc microenvironment is intricate in nature. In addition to biomechanical loading, low nutrient levels, hypoxia, high aciditye, high osmolarity, etc., also play crucial role in NP cells death and IVD degeneration. We are currently considering a composite model to better model the actual microenvironment of IVD degeneration. Therefore, in vivo animal experiments need to be strengthened in future research.
In conclusion, this study confirmed that mitochondrial dysfunction and oxidative stress act as a crucial role in NP cells necroptosis under inflammation condition. This finding introduces a new perspective to inhibition NP cells death, and it is extremely expected to offer a more efficient strategy of delaying or even retarding IVD degeneration.
CC, ZMS and JZ designed the research. CC, ZMS, ZDL and SFC performed the experiments. CC, MZ and ZYM acquired and analyzed the data. CC, YHG and SLC contributed to writing of the manuscript. Finally, all authors have reviewed and approved the final submitted manuscript. The integrity of this work is guaranteed by CC and JZ.
All experimental procedures were approved by the Animal Care and Ethics Committee of Zhengzhou University (Ethic approval code is AF/SC-08/04.0).
Not applicable.
This study was supported by the Ministry of Science and Technology National Key Research and Development Program (122300411149), the Natural Science Foundation of Henan Province (182300410349), and the Joint Construction Project of Henan Provincial Health Committee and Ministry of Health (201701017).
The authors declare no conflict of interest.
Supplementary material associated with this article can be found, in the online version, at https://doi.org/10.31083/j.fbl2704111.