


 , Yongli Situ 1,*
1 Department of Parasitology, Guangdong Medical University, 524023 Zhanjiang, Guangdong, China
2 Department of Pharmacy, Affiliated Hospital of Guangdong Medical University, 524001 Zhanjiang, Guangdong, China
Academic Editor: Alfonso Urbanucci
Abstract
Background: Pyrroline-5-carboxylate reductase (PYCR) includes three human genes encoding three isozymes, PYCR1, PYCR2, and PYCR3 (or PYCRL), which facilitate the final step in the conversion of glutamine to proline. These genes play important roles in regulating the cell cycle and redox homeostasis as well as promoting growth signaling pathways. Proline is abnormally upregulated in a variety of cancers, and as the last key enzyme in proline production, PYCR plays an integral role in promoting tumorigenesis and cancer progression. However, its role in patients with kidney renal papillary cell carcinoma (KIRP) has not been fully elucidated. In this study, we aimed to systematically analyze the expression, gene regulatory network, prognostic value, and target prediction of PYCR in patients with KIRP, elucidate the association between PYCR expression and KIRP, and identify potential new targets for the clinical treatment of KIRP. Methods: We systematically analyzed the expression, prognosis, gene regulatory network, and regulatory targets of PYCR1, PYCR2, and PYCRL in KIRP using multiple online databases including cBioPortal, STRING, MethSurv, GeneMANIA, Gene Expression Profiling Interactive Analysis (GEPIA), Metascape, UALCAN, LinkedOmics, and TIMER. Results: The expression levels of PYCR1, PYCR2, and PYCRL were considerably upregulated in patients with KIRP based on sample type, sex, age, and individual cancer stage. PYCR1 and PYCR2 transcript levels were markedly upregulated in females than in males, and patients aged 21–40 years had higher PYCR1 and PYCR2 transcript levels than those in other age groups. Interestingly, PYCR2 transcript levels gradually decreased with age. In addition, the expressions of PYCR1 and PYCR2 were notably correlated with the pathological stage of KIRP. Patients with KIRP with low PYCR1 and PYCR2 expression had longer survival than those with high PYCR1 and PYCR2 expression. PYCR1, PYCR2, and PYCRL were altered by 4%, 7%, and 6%, respectively, in 280 patients with KIRP. The methylation levels of cytosine-phosphate-guanine (CpG) sites in PYCR were markedly correlated with the prognosis of patients with KIRP. PYCR1, PYCR2, PYCRL, and their neighboring genes form a complex network of interactions. The molecular functions of the genes, as demonstrated by their corresponding Kyoto Encyclopedia of Genes and Genomes (KEGG) pathway analyses, included calcium channel activity, phospholipid binding, RNA polymerase II-specificity, and kinase and GTPase-regulatory activities. PYCR1, PYCR2, and PYCRL targeted miR-21, miR-221, and miR-222, resulting in a better prognosis of KIRP. We analyzed mRNA sequencing data from 290 patients with KIRP and found that ADA, NPM3, and TKT were positively associated with PYCR1 expression; PFDN2, JTB, and HAX1 were positively correlated with PYCR2 expression; SHARPIN, YDJC, and NUBP2 were positively correlated with PYCRL expression; PYCR1 was positively correlated with B cell and CD8+ T-cell infiltration levels; macrophage infiltration was negatively correlated with PYCR2 expression; and PYCRL expression was negatively correlated with B-cell, CD8+ T cell, and dendritic cell infiltration levels. Conclusions: PYCR1, PYCR2, and PYCRL may be potential therapeutic and prognostic biomarkers for patients with KIRP. The regulation of microRNAs (miRNAs), including miR-21, miR-221, and miR-222, may prove an important strategy for KIRP treatment.
Keywords
- PYCR1
- PYCR2
- PYCRL
- kidney renal papillary cell carcinoma
- target prediction
- gene regulation network
Cancer is the leading cause of human death and a major public health problem in most countries [1, 2]. Kidney renal papillary cell carcinoma (KIRP) accounts for 10–20% of renal cell carcinomas (RCC) and is the second most common type of RCC [3]. Currently, the efficacy of therapeutic drugs remains unsatisfactory in clinical practice [4]. The etiology of KIRP remains unclear. Some studies have reported that the loss or mutation of various oncogenes in patients with KIRP, which leads to the excitation or inhibition of their functions, is one of the inevitable initial steps in the occurrence and development of KIRP [5]. Therefore, mining new biomarkers and potential regulatory targets is crucial to improve the morbidity and survival of patients with KIRP.
Pyrroline-5-carboxylate reductase (PYCR) includes three human genes encoding three isozymes, PYCR1, PYCR2, and PYCR3 (or PYCRL), which facilitate the final step in the conversion of glutamine to proline. PYCR is upregulated in various cancer tissues [6]. High expression of PYCR is positively correlated with poor cancer prognosis. Increased expression of PYCR leads to elevated proline concentrations, which are thought to be metabolic addictions in cancer cells, making proline a trusted therapeutic target [7]. Numerous studies have shown that PYCR plays a crucial role in tumor growth and progression [8, 9, 10]. In addition, proline has been shown to act as a potent anti-oxidative stress agent capable of protecting tumor cells from various reactive oxygen species inducers. Taken together, downregulating the expression level of PYCR may be an effective cancer treatment strategy and is expected to be a target for blocking tumor progression and improving survival.
The role of PYCR in KIRP is not well understood. Therefore, this study systematically analyzed the expression, gene regulatory network, prognostic value, and target prediction of PYCR in patients with KIRP, elucidated the association between PYCR and KIRP, and identified new potential targets for KIRP therapy.
UALCAN (http://ualcan.path.uab.edu/analysis.html) is an online professional database for analyzing tumor gene expression and methylation levels [11, 12, 13]. We used UALCAN to analyze the expression and methylation levels of PYCR1, PYCR2, and PYCRL in healthy subjects and patients with KIRP. We used the student’s t-test for comparative analysis, and the difference was considered significant at a p-value less than 0.05.
Gene Expression Profiling (GEPIA) (http://gepia.cancer-pku.cn/index.html) is a free online platform for analyzing the correlation of gene expression levels with tumor pathological stage and prognostic value [13]. We used GEPIA to analyze the pathological staging correlation and prognostic value of the expression level of PYCR1, PYCR2, and PYCRL in patients with KIRP. Student’s t-test was used for comparative analysis, and differences were considered significant at a p-value less than 0.05.
cBioPortal (http://cbioportal.org) is
an online professional database used to analyze genetic alterations in tumors
[11, 12, 13]. We used the cBioPortal database to analyze genetic alterations in
PYCR1, PYCR2, PYCRL, and their neighboring genes. A
total of 280 KIRP samples were analyzed, and mRNA expression z-scores were
obtained relative to all samples (log RNA Seq V2 RSEM) using a z-score threshold
of
STRING (https://string-db.org/cgi/input.pl) is an online professional database that analyzes protein-protein interactions (PPI) [13]. We used STRING to build a low-confidence level (0.150) PPI network and screening criteria for species defined as “humans”. Finally, K-means cluster analysis was performed on PYCR1, PYCR2, PYCRL, and their neighboring genes.
GeneMANIA (http://www.genemania.org) is a free professional tool used to analyze gene functions [13]. We used GeneMANIA to explore the functions of PYCR1, PYCR2, PYCRL, and their altered neighboring genes.
Metascape (https://metascape.org) is a professional-free tool that analyzes Gene Ontology (GO) functions and the Kyoto Encyclopedia of Genes and Genomes (KEGG) pathway enrichment [13]. We used Metascape to analyze the GO function and KEGG pathway enrichment of PYCR1, PYCR2, PYCRL, and their altered neighboring genes in KIRP.
LinkedOmics (http://www.linkedomics.org/) is a free online platform used to analyze miRNA target enrichment and differentially expressed genes associated with tumor genes [13]. The LinkedOmics database was used to analyze miRNA target enrichment and differentially expressed genes associated with PYCR1, PYCR2, and PYCRL.
TIMER (https://cistrome.shinyapps.io/timer/) is a specialized database that systematically analyzes tumor genes associated with infiltrating immune cells [11, 12, 13]. We used TIMER to analyze the correlation between PYCR1, PYCR2, and PYCRL expression and immune cell infiltration.
MethSurv (https://biit.cs.ut.ee/methsurv/) is a free online platform that provides survival analyses based on DNA methylation. We used MethSurv to analyze DNA methylation and prognosis at PYCR sites in patients with KIRP.
We first compared the expression levels of PYCR1, PYCR2, and
PYCRL in patients with KIRP according to sample type, sex, age, and
individual cancer stage. Our results showed that PYCR1, PYCR2,
and PYCRL transcript levels were significantly upregulated in patients
with KIRP (p
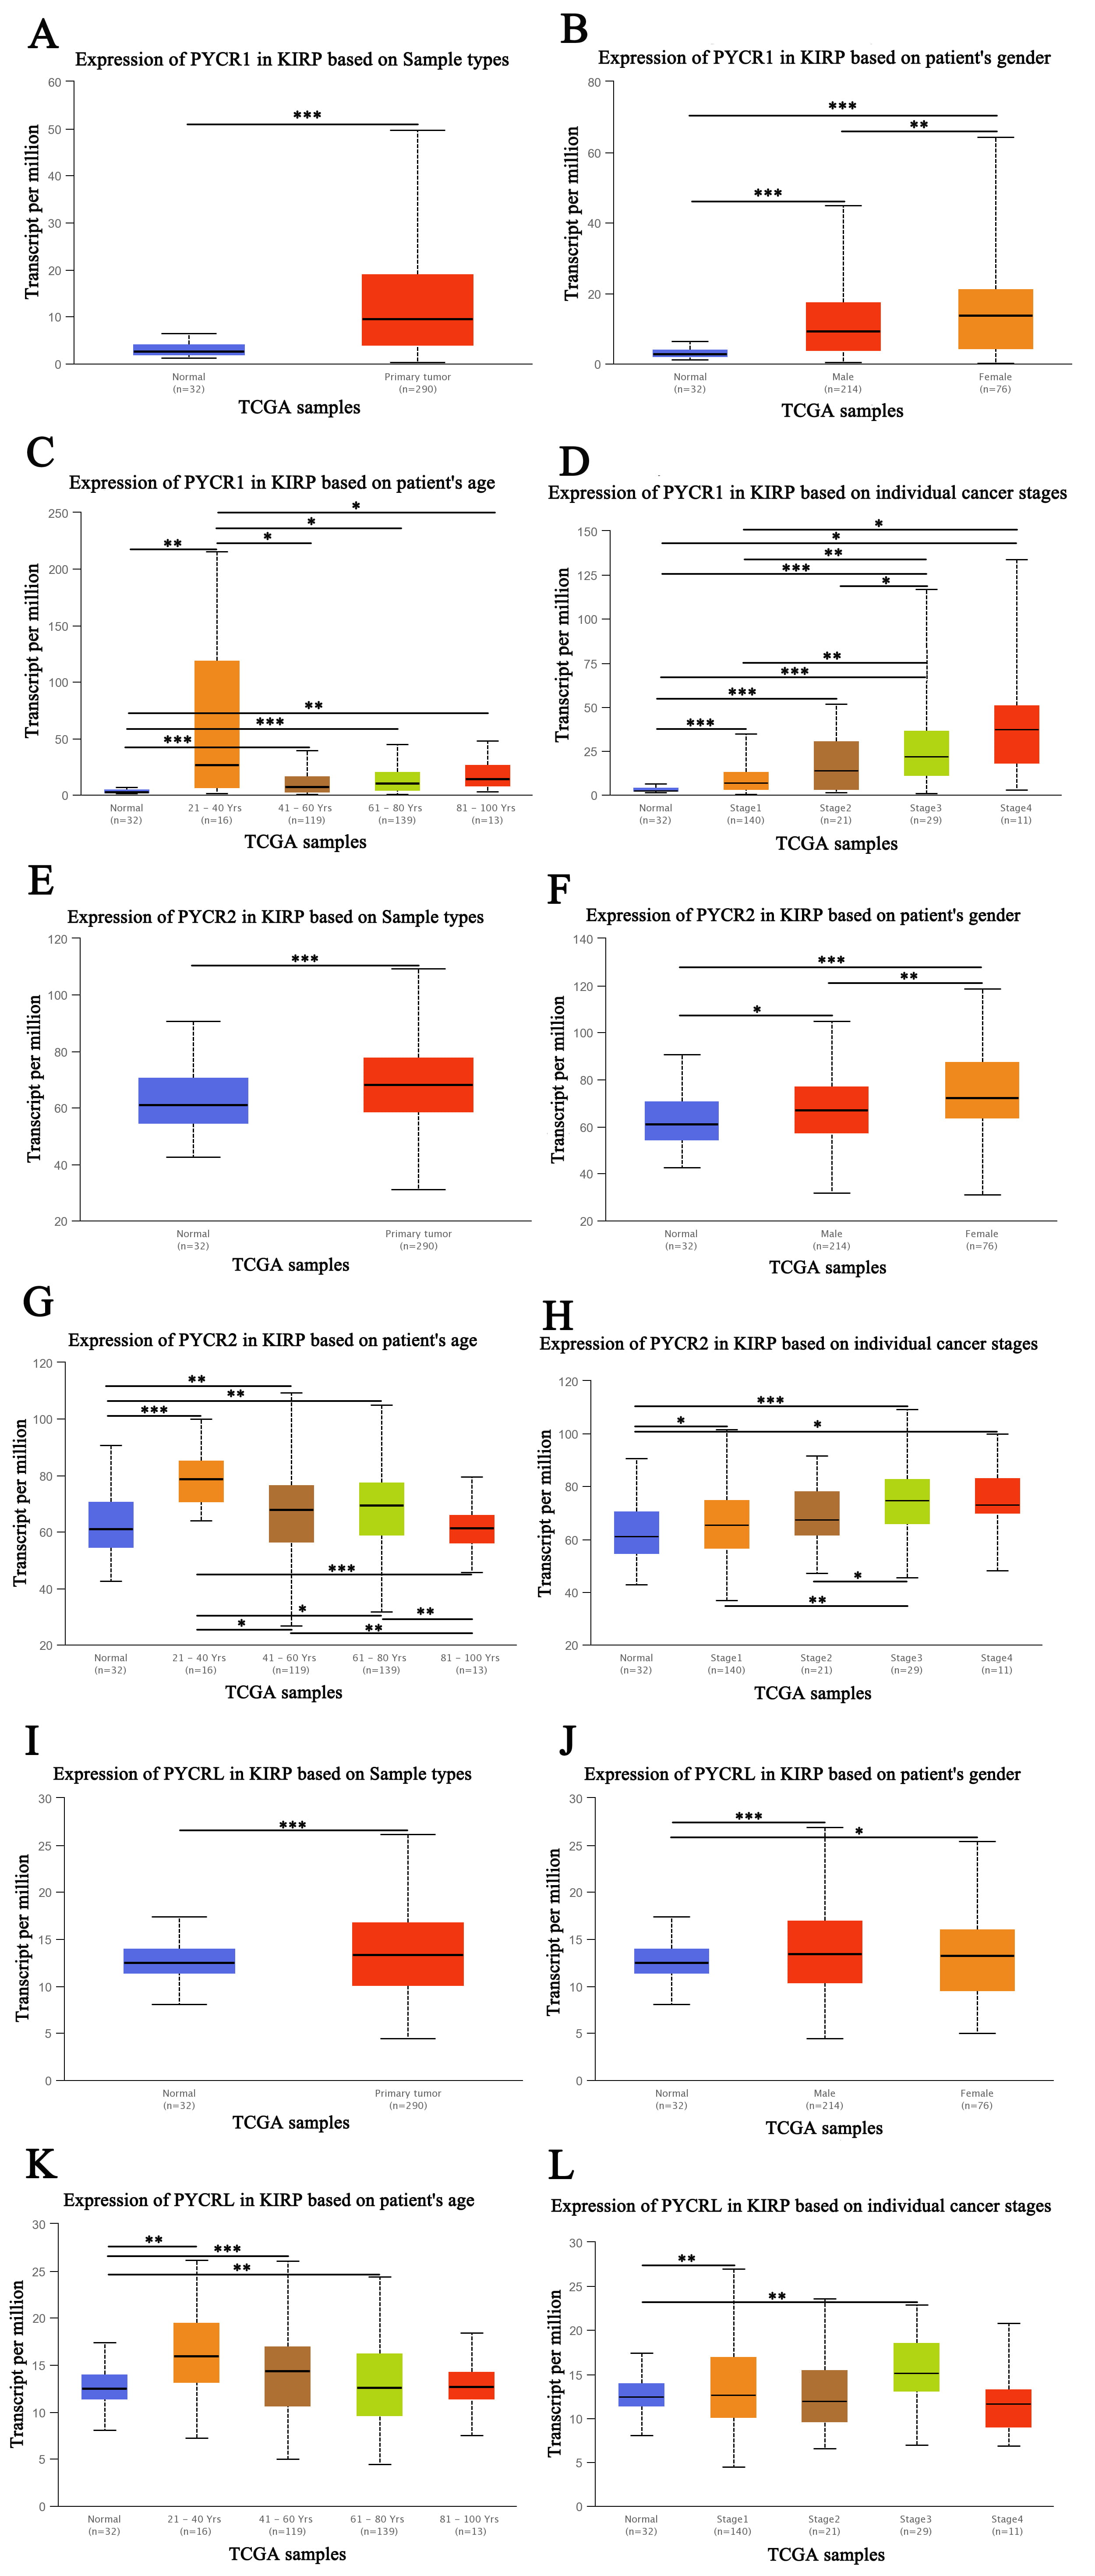 Fig. 1.
The expression of PYCR in patients with KIRP (UALCAN). (A) The
transcription expression of PYCR1 based on sample types. (B) The transcription
expression of PYCR1 based on the sex of the patient. (C) The transcription
expression of PYCR1 based on the age of the patient. (D) The transcription
expression of PYCR1 based on individual cancer stage. (E) The transcription
expression of PYCR2 based on sample types. (F) The transcription expression of
PYCR2 based on the sex of the patient. (G) The transcription expression of PYCR2
based on the age of the patient. (H) The transcription expression of PYCR2 based
on individual cancer stage. (I) The transcription expression of PYCRL based on
sample types. (J) The transcription expression of PYCRL based on the sex of the
patient. (K) The transcription expression of PYCRL based on the age of the
patient. (L) The transcription expression of PYCRL based on individual cancer
stage. *p
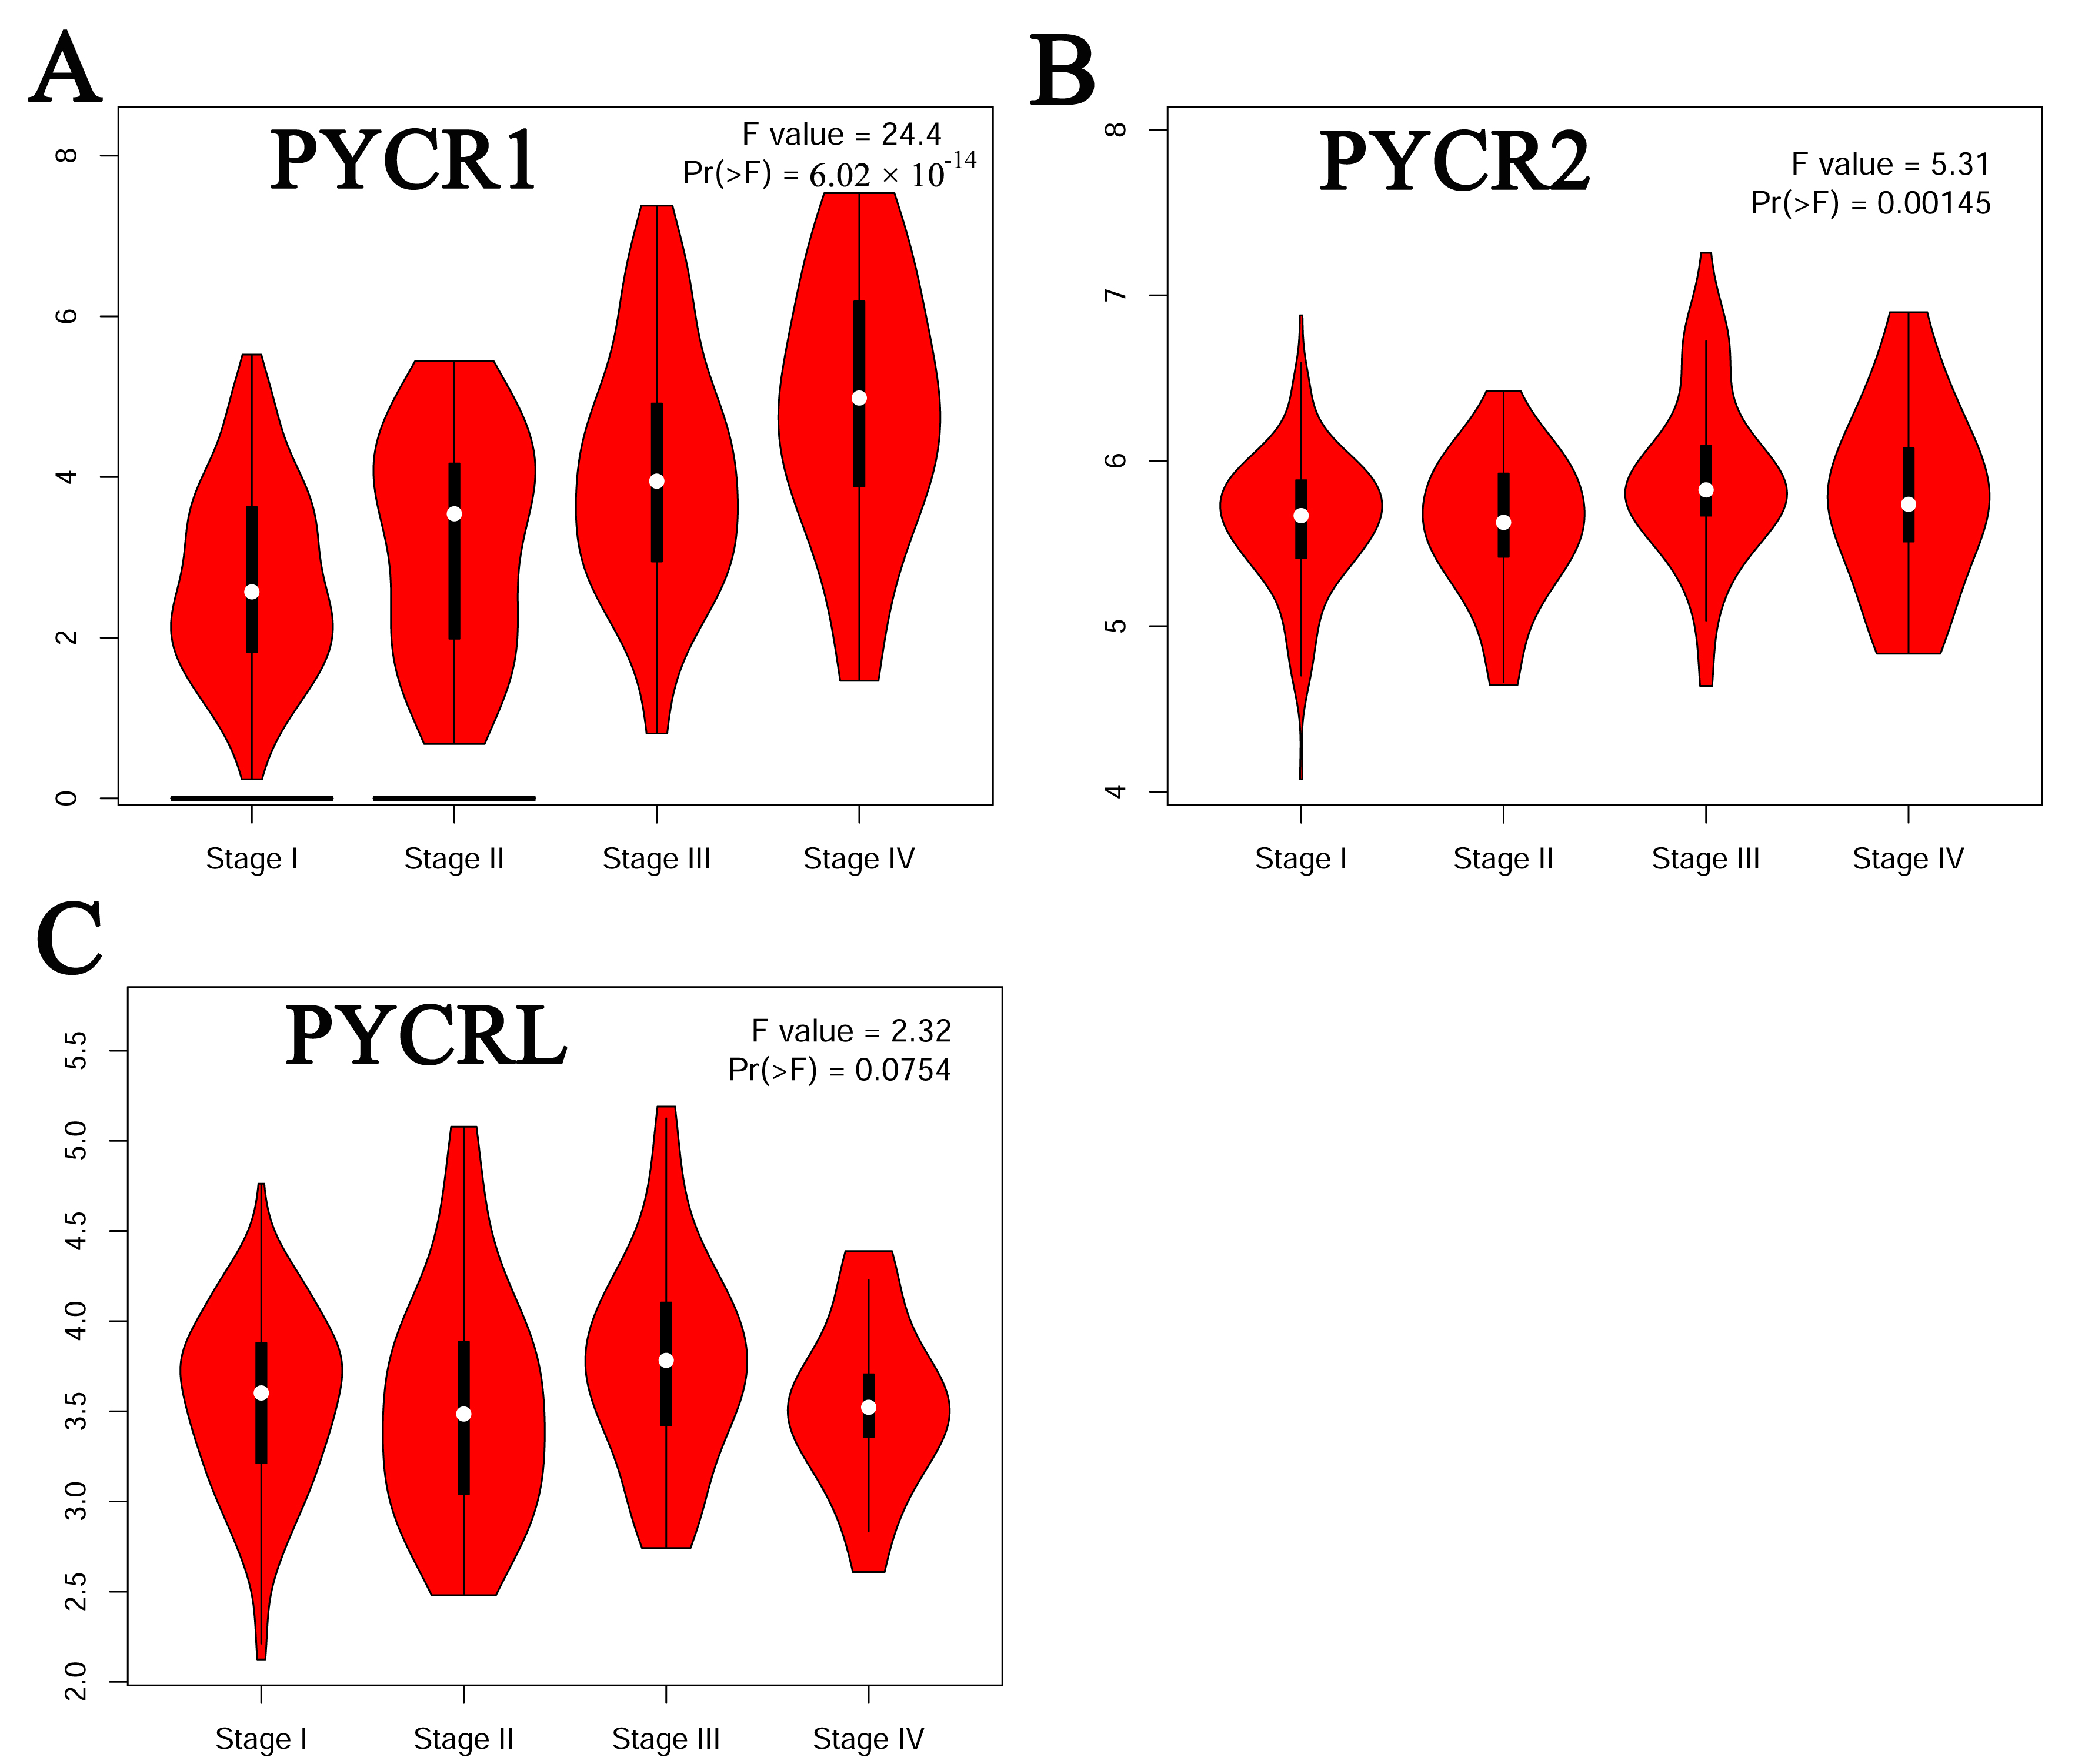 Fig. 2.
Correlation between the pathological stage and different expressed PYCR of patients with KIRP (GEPIA). (A) PYCR1. (B) PYCR2. (C) PYCRL.
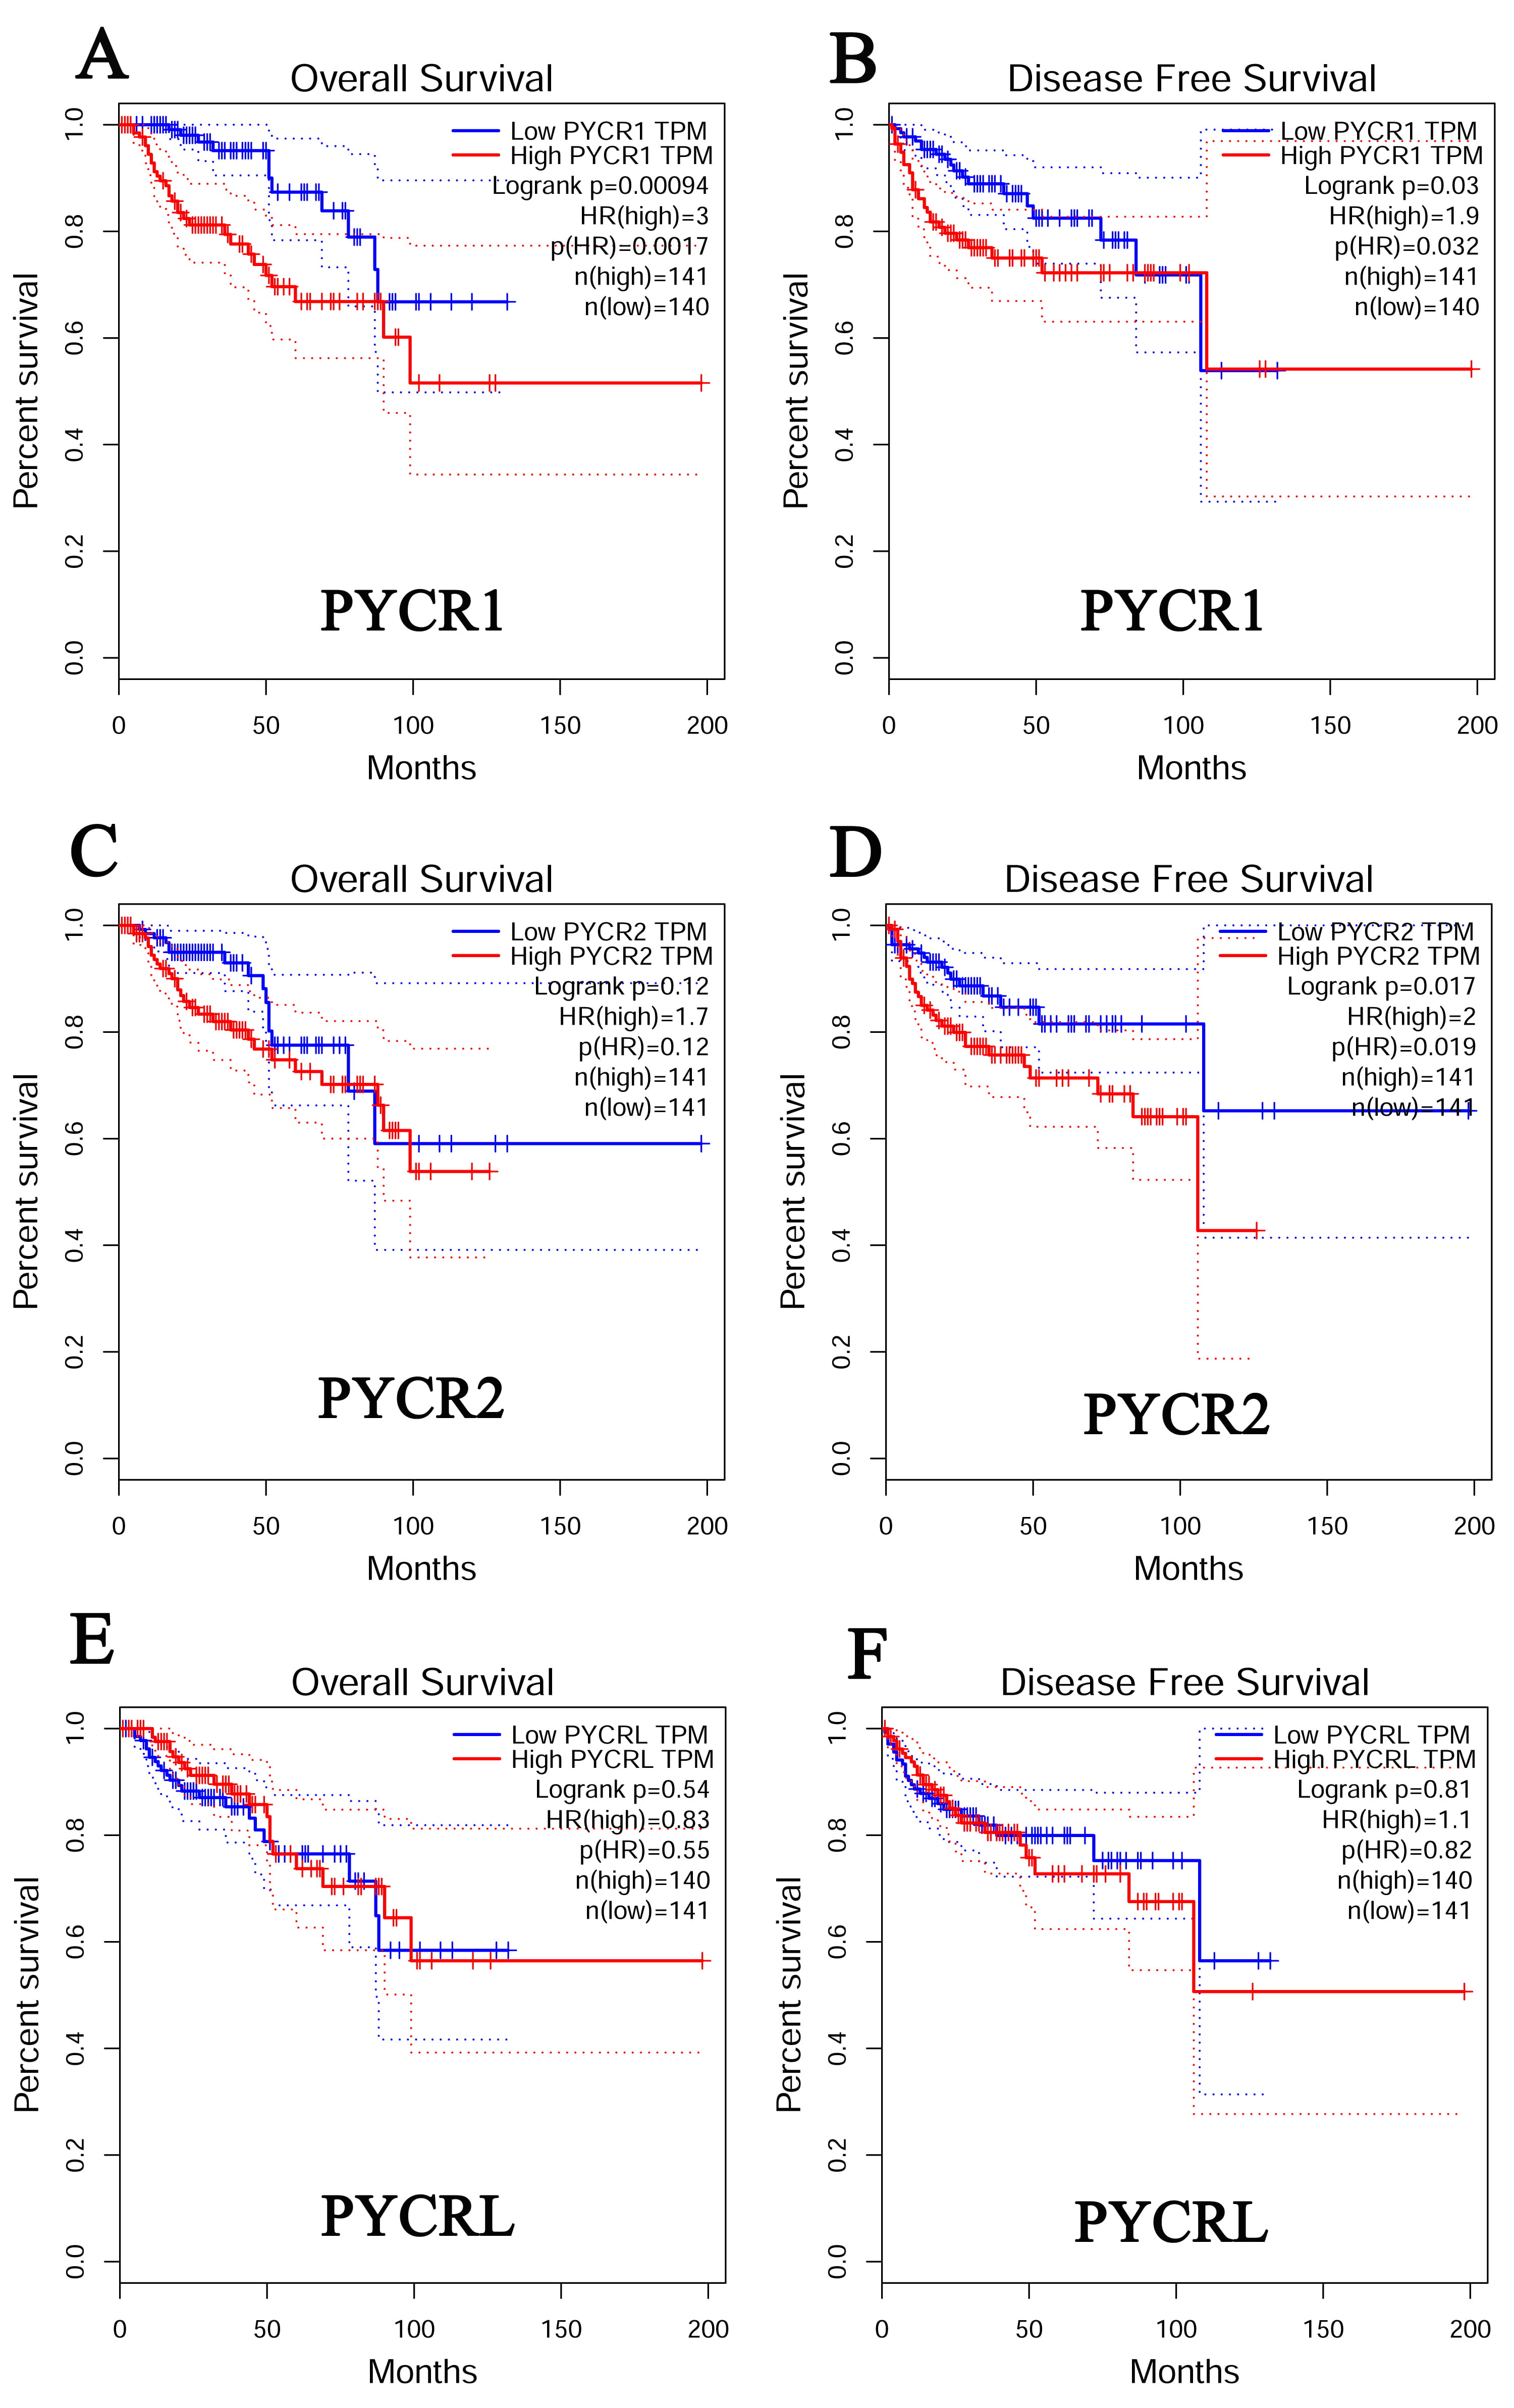 Fig. 3.
The prognostic value of PYCR in KIRP (GEPIA). (A) The overall survival curve of PYCR1 in patients with KIRP. (B) The disease-free survival cure of PYCR1 in patients with KIRP. (C) The overall survival curve of PYCR2 in patients with KIRP. (D) The disease-free survival cure of PYCR2 in patients with KIRP. (E) The overall survival curve of PYCRL. (F) The disease-free survival cure of PYCRL in patients with KIRP.
We further assessed the genetic alterations in PYCR1, PYCR2,
and PYCRL in 280 patients with KIRP using TCGA. We found that
PYCR1 was altered by 4% in patients with KIRP, with the type of genetic
alteration mainly including amplification, high RNA levels, and low RNA levels
(Fig. 4A). However, PYCR2 was altered by 7% in patients with KIRP, with
the type of genetic alteration mainly including missense mutations, high RNA
levels, and low RNA levels (Fig. 4B). PYCRL was altered by 6% in
patients with KIRP, with the type of genetic alteration mainly including missense
mutations, truncating mutations, deep deletions, high RNA levels, and low RNA
levels (Fig. 4C). Next, we assessed the promoter methylation levels of
PYCR1, PYCR2, and PYCRL in patients with KIRP using
UALCAN. We found that PYCR1 and PYCRL promoter methylation
levels were significantly downregulated in patients with KIRP (p
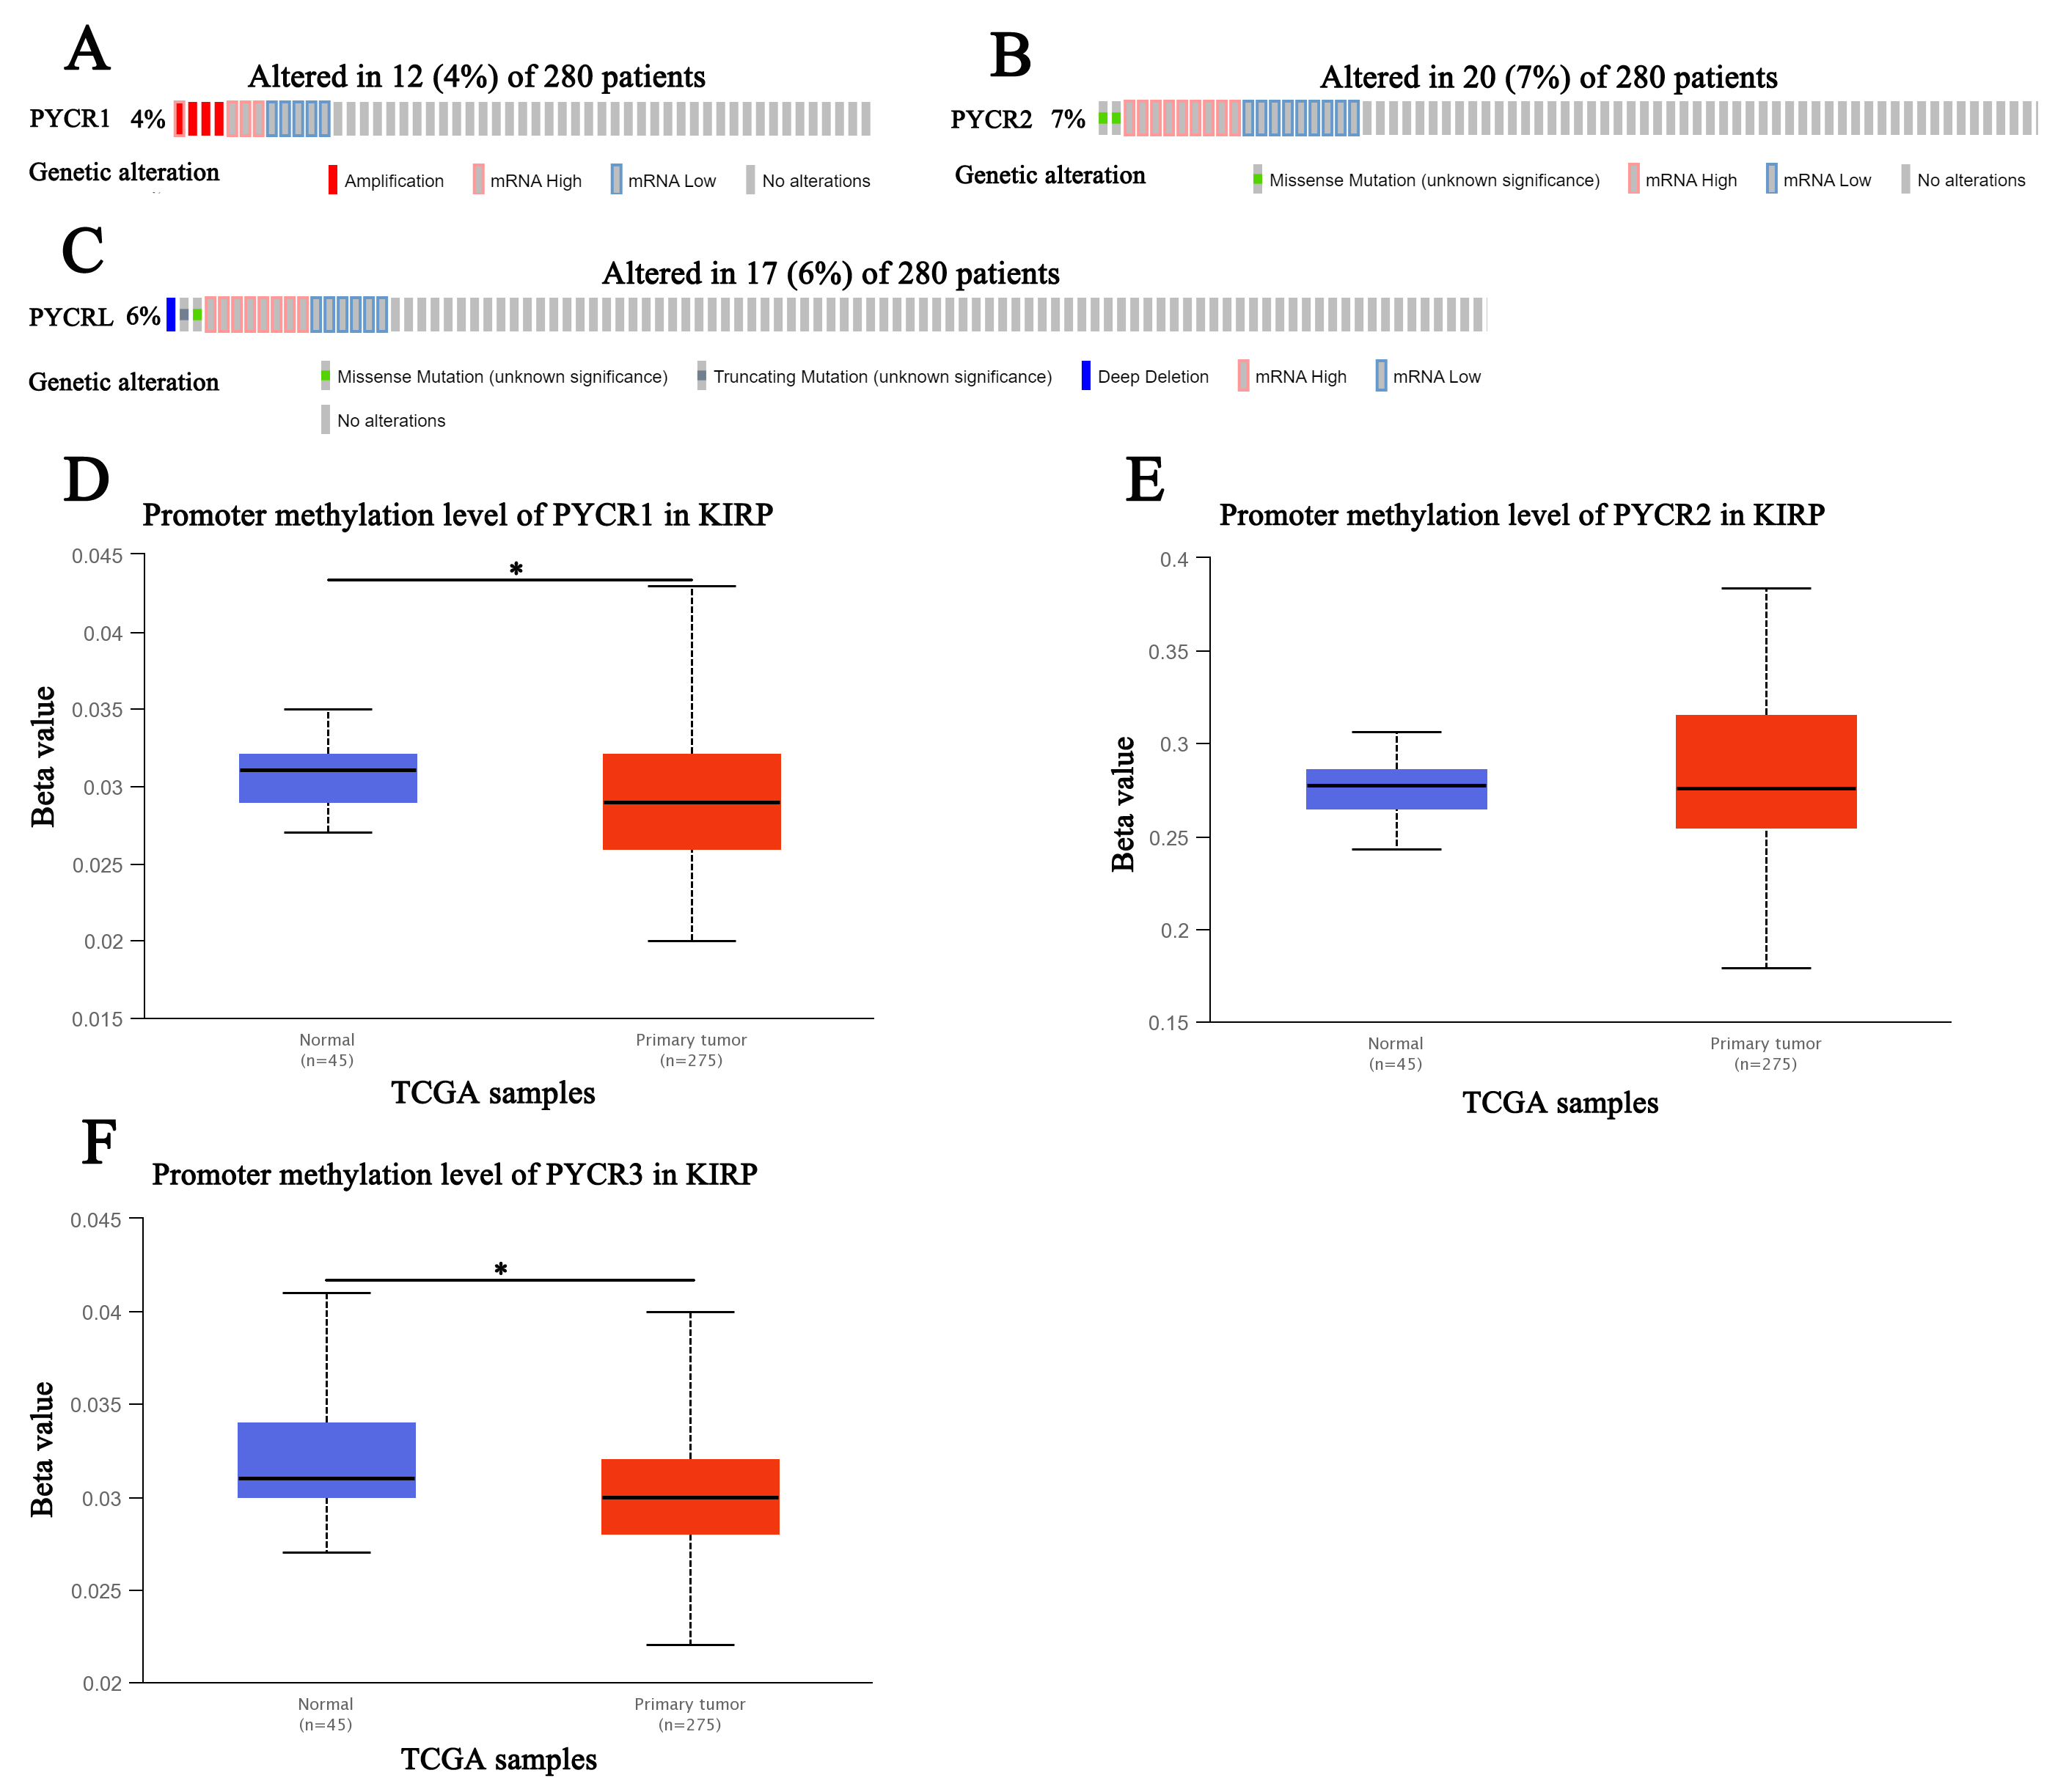 Fig. 4.
Genetic alteration and promoter methylation of PYCR in KIRP (UALCAN). (A) Genetic alteration of PYCR1in patients with KIRP. (B) Genetic alteration of PYCR2 in patients with KIRP. (C) Genetic alteration of PYCRL in patients with KIRP. (D) Promoter methylation of PYCR1in healthy individuals and patients with KIRP. (E) Promoter methylation of PYCR2 in healthy individuals and patients with KIRP. (F) Promoter methylation of PYCRL in healthy individuals and patients with KIRP.
 Fig. 5.
DNA methylation at CpG sites and prognostic value of PYCR in KIRP (MethSurv). (A) Heatmap showing the PYCR1 DNA methylation at CpG sites. (B) Patients with KIRP with higher PYCR1 methylation of cg25759517 CpG sites had a better overall survival than those with lower PYCR1 methylation (HR = 0.512, p = 0.038). (C) Patients with KIRP with higher PYCR1 methylation of cg19202384 CpG sites had a better overall survival than those with lower PYCR1 methylation (HR = 0.452, p = 0.015). (D) Heatmap showing the PYCR2 DNA methylation at CpG sites. (E) Patients with KIRP with higher PYCR2 methylation of cg07049680 CpG sites had a worse overall survival than those with lower PYCR2 methylation (HR = 1.907, p = 0.045). (F) Patients with KIRP with higher PYCR2 methylation of cg23091741 CpG sites had a worse overall survival than those with lower PYCR2 methylation (HR = 2.265, p = 0.014). (G) Patients with KIRP with higher PYCR2 methylation of cg23091741 CpG sites had a better overall survival than those with lower PYCR1 methylation (HR = 0.422, p = 0.011). (H) Heatmap showing the PYCRL DNA methylation at CpG sites. (I) Patients with KIRP with higher PYCRL methylation of cg26507094 CpG sites had a worse overall survival than those with lower PYCRL methylation (HR = 2.611, p = 0.0033).
| Gene symbol | CpG name | Hazard Ratio | Confidence interval (CI) | Likelihood ratio (LR) test p value | University of California Santa Cruz (UCSC) Ref gene group | Relation to UCSC CpG Island |
|---|---|---|---|---|---|---|
| PYCR1 | cg25759517 | 0.512 | (0.27; 0.971) | 0.038 | TSS200 | Island |
| cg19202384 | 0.452 | (0.235; 0.871) | 0.015 | Body | N_Shore | |
| PYCR2 | cg07049680 | 1.907 | (1.003; 3.626) | 0.045 | TSS1500 | Island |
| cg23091741 | 2.265 | (1.151; 4.458) | 0.014 | Body | Island | |
| cg06086141 | 0.422 | (0.21; 0.847) | 0.011 | TSS1500 | S_Shore | |
| PYCRL | cg26507094 | 2.611 | (1.342; 5.079) | 0.0033 | Body | Island |
We evaluated alterations in the neighboring
genes of PYCR1, PYCR2, and PYCRL in patients
with KIRP using cBioPortal. We found a gene alteration frequency of
| Gene | Altered group | Unaltered group | p-value |
|---|---|---|---|
| ALYREF | 4 (33.33%) | 0 (0.00%) | 1.98 × 10 |
| ANAPC11 | 4 (33.33%) | 0 (0.00%) | 1.98 × 10 |
| ARHGDIA | 4 (33.33%) | 0 (0.00%) | 1.98 × 10 |
| ARL16 | 4 (33.33%) | 0 (0.00%) | 1.98 × 10 |
| CCDC137 | 4 (33.33%) | 0 (0.00%) | 1.98 × 10 |
| GCGR | 4 (33.33%) | 0 (0.00%) | 1.98 × 10 |
| MAFG | 4 (33.33%) | 0 (0.00%) | 1.98 × 10 |
| MCRIP1 | 4 (33.33%) | 0 (0.00%) | 1.98 × 10 |
| MRPL12 | 4 (33.33%) | 0 (0.00%) | 1.98 × 10 |
| MYADML2 | 4 (33.33%) | 0 (0.00%) | 1.98 × 10 |
| NPB | 4 (33.33%) | 0 (0.00%) | 1.98 × 10 |
| P4HB | 4 (33.33%) | 0 (0.00%) | 1.98 × 10 |
| PPP1R27 | 4 (33.33%) | 0 (0.00%) | 1.98 × 10 |
| SLC25A10 | 4 (33.33%) | 0 (0.00%) | 1.98 × 10 |
| SLC26A11 | 4 (33.33%) | 0 (0.00%) | 1.98 × 10 |
| WDR45B | 4 (33.33%) | 0 (0.00%) | 1.98 × 10 |
| AXIN2 | 4 (33.33%) | 1 (0.37%) | 9.65 × 10 |
| HGS | 4 (33.33%) | 1 (0.37%) | 9.65 × 10 |
| RNF43 | 4 (33.33%) | 1 (0.37%) | 9.65 × 10 |
| TMC6 | 4 (33.33%) | 1 (0.37%) | 9.65 × 10 |
| PCYT2 | 4 (33.33%) | 2 (0.75%) | 2.83 × 10 |
| TBC1D16 | 4 (33.33%) | 2 (0.75%) | 2.83 × 10 |
| TRIM37 | 4 (33.33%) | 2 (0.75%) | 2.83 × 10 |
| AANAT | 3 (25.00%) | 0 (0.00%) | 6.08 × 10 |
| ABCA9 | 3 (25.00%) | 0 (0.00%) | 6.08 × 10 |
| ACTG1 | 3 (25.00%) | 0 (0.00%) | 6.08 × 10 |
| AFMID | 3 (25.00%) | 0 (0.00%) | 6.08 × 10 |
| AMZ2P1 | 3 (25.00%) | 0 (0.00%) | 6.08 × 10 |
| APOH | 3 (25.00%) | 0 (0.00%) | 6.08 × 10 |
| ARMC7 | 3 (25.00%) | 0 (0.00%) | 6.08 × 10 |
| ARSG | 3 (25.00%) | 0 (0.00%) | 6.08 × 10 |
| ASPSCR1 | 3 (25.00%) | 0 (0.00%) | 6.08 × 10 |
| B3GNTL1 | 3 (25.00%) | 0 (0.00%) | 6.08 × 10 |
| BTBD17 | 3 (25.00%) | 0 (0.00%) | 6.08 × 10 |
| C17ORF58 | 3 (25.00%) | 0 (0.00%) | 6.08 × 10 |
| C17ORF99 | 3 (25.00%) | 0 (0.00%) | 6.08 × 10 |
| C1QTNF1 | 3 (25.00%) | 0 (0.00%) | 6.08 × 10 |
| CACNG1 | 3 (25.00%) | 0 (0.00%) | 6.08 × 10 |
| CACNG4 | 3 (25.00%) | 0 (0.00%) | 6.08 × 10 |
| CACNG5 | 3 (25.00%) | 0 (0.00%) | 6.08 × 10 |
| CANT1 | 3 (25.00%) | 0 (0.00%) | 6.08 × 10 |
| CASKIN2 | 3 (25.00%) | 0 (0.00%) | 6.08 × 10 |
| CBX2 | 3 (25.00%) | 0 (0.00%) | 6.08 × 10 |
| CBX8 | 3 (25.00%) | 0 (0.00%) | 6.08 × 10 |
| CD300A | 3 (25.00%) | 0 (0.00%) | 6.08 × 10 |
| CD300C | 3 (25.00%) | 0 (0.00%) | 6.08 × 10 |
| CD300E | 3 (25.00%) | 0 (0.00%) | 6.08 × 10 |
| CD300LB | 3 (25.00%) | 0 (0.00%) | 6.08 × 10 |
| CD300LD | 3 (25.00%) | 0 (0.00%) | 6.08 × 10 |
| CD300LF | 3 (25.00%) | 0 (0.00%) | 6.08 × 10 |
| Gene | Altered group | Unaltered group | p-value |
|---|---|---|---|
| CBLL2 | 2 (10.00%) | 0 (0.00%) | 4.86 × 10 |
| DCAF1 | 2 (10.00%) | 0 (0.00%) | 4.86 × 10 |
| GK | 2 (10.00%) | 0 (0.00%) | 4.86 × 10 |
| GPD1 | 2 (10.00%) | 0 (0.00%) | 4.86 × 10 |
| HIF1A | 2 (10.00%) | 0 (0.00%) | 4.86 × 10 |
| IFT88 | 2 (10.00%) | 0 (0.00%) | 4.86 × 10 |
| MAOA | 2 (10.00%) | 0 (0.00%) | 4.86 × 10 |
| OTOL1 | 2 (10.00%) | 0 (0.00%) | 4.86 × 10 |
| PHEX | 2 (10.00%) | 0 (0.00%) | 4.86 × 10 |
| SH3KBP1 | 2 (10.00%) | 0 (0.00%) | 4.86 × 10 |
| TCEANC | 2 (10.00%) | 0 (0.00%) | 4.86 × 10 |
| TFCP2L1 | 2 (10.00%) | 0 (0.00%) | 4.86 × 10 |
| TPTE2 | 2 (10.00%) | 0 (0.00%) | 4.86 × 10 |
| PBRM1 | 4 (20.00%) | 8 (3.08%) | 6.54 × 10 |
| ALK | 3 (15.00%) | 5 (1.92%) | 0.0139 |
| MYOM2 | 3 (15.00%) | 5 (1.92%) | 0.0139 |
| ALPK3 | 2 (10.00%) | 1 (0.38%) | 0.014 |
| COL14A1 | 2 (10.00%) | 1 (0.38%) | 0.014 |
| ETV5 | 2 (10.00%) | 1 (0.38%) | 0.014 |
| HEBP1 | 2 (10.00%) | 1 (0.38%) | 0.014 |
| HOXB2 | 2 (10.00%) | 1 (0.38%) | 0.014 |
| LRMDA | 2 (10.00%) | 1 (0.38%) | 0.014 |
| MCTP2 | 2 (10.00%) | 1 (0.38%) | 0.014 |
| MED16 | 2 (10.00%) | 1 (0.38%) | 0.014 |
| MLH1 | 2 (10.00%) | 1 (0.38%) | 0.014 |
| NEIL2 | 2 (10.00%) | 1 (0.38%) | 0.014 |
| NFE2L1 | 2 (10.00%) | 1 (0.38%) | 0.014 |
| NUDT10 | 2 (10.00%) | 1 (0.38%) | 0.014 |
| RIMS2 | 2 (10.00%) | 1 (0.38%) | 0.014 |
| USP6 | 2 (10.00%) | 1 (0.38%) | 0.014 |
| ZNF577 | 2 (10.00%) | 1 (0.38%) | 0.014 |
| CDKN2A | 4 (20.00%) | 11 (4.23%) | 0.0156 |
| MT-ND4 | 4 (20.00%) | 11 (4.23%) | 0.0156 |
| HERC1 | 3 (15.00%) | 6 (2.31%) | 0.0199 |
| ARSL | 2 (10.00%) | 2 (0.77%) | 0.0267 |
| DISP2 | 2 (10.00%) | 2 (0.77%) | 0.0267 |
| DLEC1 | 2 (10.00%) | 2 (0.77%) | 0.0267 |
| DLX3 | 2 (10.00%) | 2 (0.77%) | 0.0267 |
| ERC2 | 2 (10.00%) | 2 (0.77%) | 0.0267 |
| LCOR | 2 (10.00%) | 2 (0.77%) | 0.0267 |
| OTULINL | 2 (10.00%) | 2 (0.77%) | 0.0267 |
| TAC4 | 2 (10.00%) | 2 (0.77%) | 0.0267 |
| UBTD2 | 2 (10.00%) | 2 (0.77%) | 0.0267 |
| GIGYF2 | 3 (15.00%) | 7 (2.69%) | 0.0272 |
| ATP13A2 | 2 (10.00%) | 3 (1.15%) | 0.0426 |
| CACNA1A | 2 (10.00%) | 3 (1.15%) | 0.0426 |
| COX11 | 2 (10.00%) | 3 (1.15%) | 0.0426 |
| EPHA3 | 2 (10.00%) | 3 (1.15%) | 0.0426 |
| HEATR6 | 2 (10.00%) | 3 (1.15%) | 0.0426 |
| RANBP17 | 2 (10.00%) | 3 (1.15%) | 0.0426 |
| Gene | Altered group | Unaltered group | p-value |
|---|---|---|---|
| MT-CO2 | 4 (23.53%) | 2 (0.76%) | 1.32 × 10 |
| BLK | 3 (17.65%) | 1 (0.38%) | 7.23 × 10 |
| C2CD5 | 3 (17.65%) | 1 (0.38%) | 7.23 × 10 |
| MCPH1 | 3 (17.65%) | 2 (0.76%) | 1.74 × 10 |
| APCDD1 | 2 (11.76%) | 0 (0.00%) | 3.48 × 10 |
| ARFGAP1 | 2 (11.76%) | 0 (0.00%) | 3.48 × 10 |
| C8ORF74 | 2 (11.76%) | 0 (0.00%) | 3.48 × 10 |
| CLN8 | 2 (11.76%) | 0 (0.00%) | 3.48 × 10 |
| DEFB1 | 2 (11.76%) | 0 (0.00%) | 3.48 × 10 |
| DEFB130A | 2 (11.76%) | 0 (0.00%) | 3.48 × 10 |
| DEFB134 | 2 (11.76%) | 0 (0.00%) | 3.48 × 10 |
| DEFB135 | 2 (11.76%) | 0 (0.00%) | 3.48 × 10 |
| DPYSL2 | 2 (11.76%) | 0 (0.00%) | 3.48 × 10 |
| EEF1D | 2 (11.76%) | 0 (0.00%) | 3.48 × 10 |
| EIF3B | 2 (11.76%) | 0 (0.00%) | 3.48 × 10 |
| ERICH1 | 2 (11.76%) | 0 (0.00%) | 3.48 × 10 |
| FAM66A | 2 (11.76%) | 0 (0.00%) | 3.48 × 10 |
| FAM66D | 2 (11.76%) | 0 (0.00%) | 3.48 × 10 |
| FAM86B1 | 2 (11.76%) | 0 (0.00%) | 3.48 × 10 |
| FBXL6 | 2 (11.76%) | 0 (0.00%) | 3.48 × 10 |
| FBXO25 | 2 (11.76%) | 0 (0.00%) | 3.48 × 10 |
| FDFT1 | 2 (11.76%) | 0 (0.00%) | 3.48 × 10 |
| FGL1 | 2 (11.76%) | 0 (0.00%) | 3.48 × 10 |
| FUT10 | 2 (11.76%) | 0 (0.00%) | 3.48 × 10 |
| GATA4 | 2 (11.76%) | 0 (0.00%) | 3.48 × 10 |
| GK | 2 (11.76%) | 0 (0.00%) | 3.48 × 10 |
| IKBKB | 2 (11.76%) | 0 (0.00%) | 3.48 × 10 |
| KBTBD11 | 2 (11.76%) | 0 (0.00%) | 3.48 × 10 |
| KRT85 | 2 (11.76%) | 0 (0.00%) | 3.48 × 10 |
| LINC00208 | 2 (11.76%) | 0 (0.00%) | 3.48 × 10 |
| LINC00529 | 2 (11.76%) | 0 (0.00%) | 3.48 × 10 |
| LINC02905 | 2 (11.76%) | 0 (0.00%) | 3.48 × 10 |
| MAGEB16 | 2 (11.76%) | 0 (0.00%) | 3.48 × 10 |
| MAOA | 2 (11.76%) | 0 (0.00%) | 3.48 × 10 |
| MIR124-1HG | 2 (11.76%) | 0 (0.00%) | 3.48 × 10 |
| MTMR9 | 2 (11.76%) | 0 (0.00%) | 3.48 × 10 |
| NUDT18 | 2 (11.76%) | 0 (0.00%) | 3.48 × 10 |
| OR10A2 | 2 (11.76%) | 0 (0.00%) | 3.48 × 10 |
| OR4F21 | 2 (11.76%) | 0 (0.00%) | 3.48 × 10 |
| PDHA1 | 2 (11.76%) | 0 (0.00%) | 3.48 × 10 |
| PINX1 | 2 (11.76%) | 0 (0.00%) | 3.48 × 10 |
| PRPS2 | 2 (11.76%) | 0 (0.00%) | 3.48 × 10 |
| PRSS51 | 2 (11.76%) | 0 (0.00%) | 3.48 × 10 |
| PYCR2 | 2 (11.76%) | 0 (0.00%) | 3.48 × 10 |
| RALBP1 | 2 (11.76%) | 0 (0.00%) | 3.48 × 10 |
| RN7SKP159 | 2 (11.76%) | 0 (0.00%) | 3.48 × 10 |
| RN7SL293P | 2 (11.76%) | 0 (0.00%) | 3.48 × 10 |
| RN7SL318P | 2 (11.76%) | 0 (0.00%) | 3.48 × 10 |
| RNA5SP251 | 2 (11.76%) | 0 (0.00%) | 3.48 × 10 |
| RNA5SP252 | 2 (11.76%) | 0 (0.00%) | 3.48 × 10 |
We further evaluated the potential interactions between PYCR1, PYCR2, PYCRL, and their neighboring genes. Our results showed that 43 nodes, 188 edges, and 3 clusters were obtained in the constructed PPI network of PYCR1 and its neighboring genes in patients with KIRP (Fig. 6A). Furthermore, PYCR1 and its neighboring genes were linked to a complex interaction network (70 genes and 226 edges) through co-expression, physical interactions, shared protein domains, and prediction (Fig. 6B). However, we found that 46 nodes, 158 edges, and 3 clusters were obtained in the constructed PPI network of PYCR2 and its neighboring genes in patients with KIRP (Fig. 6C). Furthermore, PYCR2 and its neighboring genes were linked to a complex interaction network (71 genes and 217 edges) through co-expression, physical interactions, genetic interactions, and prediction (Fig. 6D). Additionally, 33 nodes, 126 edges, and 3 clusters were obtained in the constructed PPI network of PYCRL and its neighboring genes in patients with KIRP (Fig. 6E). In addition, PYCRL and its neighboring genes were linked to a complex interaction network (60 genes and 188 edges) through co-expression, physical interactions, shared protein domains, and prediction (Fig. 6F).
 Fig. 6.
Interaction analyses of PYCR and their neighboring genes in KIRP (STRING and GeneMANIA). (A) PPI network of PYCR1 and its neighboring genes in patients with KIRP (STRING). (B) Network analyses of PYCR1 and its neighboring genes in patients with KIRP (GeneMANIA). (C) PPI network of PYCR2 and its neighboring genes in patients with KIRP (STRING). (D) Network analyses of PYCR2 and its neighboring genes in patients with KIRP (GeneMANIA). (E) PPI network of PYCRL and its neighboring genes in patients with KIRP (STRING). (F) Network analyses of PYCRL and its neighboring genes in patients with KIRP (GeneMANIA).
We further performed GO and KEGG pathway enrichment analyses of PYCR1, PYCR2, PYCRL, and their top 50 altered neighboring genes in patients with KIRP using Metascape. We found that the molecular functions related to PYCR1 and its neighboring genes mainly included voltage-gated calcium channel activity, phospholipid binding, and ubiquitin-like protein ligase binding (Fig. 7A). Their cellular components include nuclear ubiquitin ligase complexes, tertiary granules, and cation channel complexes (Fig. 7B). Their biological processes included protein localization to lysosomes, regulation of wound healing, and negative regulation of cell activation (Fig. 7C). Arrhythmogenic right ventricular cardiomyopathy and cardiac muscle contraction were enriched according to KEGG pathway analysis (Fig. 7D). However, our results showed that nuclear receptor binding, DNA-binding transcription activator activity, RNA polymerase II-specific, phosphotransferase activity, alcohol group as acceptor, and oxidoreductase activity were molecular functions related to PYCR2and its neighboring genes (Fig. 7E). The RNA polymerase II transcription regulator complex and the cytoplasmic region were their cellular components (Fig. 7F). Cellular response to oxidative stress, regulation of the G1/S transition of the mitotic cell cycle, and the enzyme-linked receptor protein signaling pathway were the main biological processes (Fig. 7G). KEGG pathway analysis revealed that PYCR2 and its neighboring genes were associated with pathways in cancer (Fig. 7H). Furthermore, the molecular functions related to PYCRL and its neighboring genes mainly include oxidoreductase activity, kinase activity, and GTPase regulator activity (Fig. 7I). The cellular components were spindles (Fig. 7J). The mitotic cell cycle process, positive regulation of protein localization, small molecule biosynthetic process, and chemotaxis were the main biological processes (Fig. 7K). Arginine and proline metabolism and amino acid biosynthesis were found to be enriched according to KEGG pathway analysis (Fig. 7L).
 Fig. 7.
GO function and KEGG pathways enrichment analyses of PYCR1, PYCR2, PYCRL, and their neighboring genes in patients with KIRP (Metascape). (A) Molecular functions of PYCR1 and its neighboring genes. (B) Cellular components of PYCR1 and its neighboring genes. (C) Biological processes of PYCR1 and its neighboring genes. (D) KEGG pathway analysis of PYCR1 and its neighboring genes. (E) Molecular functions of PYCR2 and its neighboring genes. (F) Cellular components of PYCR2 and its neighboring genes. (G) Biological processes of PYCR2 and its neighboring genes. (H) KEGG pathway analysis of PYCR2 and its neighboring genes. (I) Molecular functions of PYCRL and its neighboring genes. (J) Cellular components of PYCRL and its neighboring genes. (K) Biological processes of PYCRL and its neighboring genes. (L) KEGG pathway analysis of PYCRL and its neighboring genes.
We analyzed the miRNA targets of
PYCR1, PYCR2, and PYCRL using LinkedOmics. ATAAGCT
(miR-21), ATGTAGC (miR-221 and miR-222), GTTATAT (miR-410), ATAGGAA (miR-202),
and TACAATC (miR-508) were the top five miRNA targets of PYCR1 in patients with KIRP (False discovery rate (FDP)
| Gene set | Leading edge number | p-value | FDR |
|---|---|---|---|
| ATAAGCT, miR-21 | 40 | 0 | 0.012789 |
| ATGTAGC, miR-221, miR-222 | 55 | 0 | 0.017763 |
| GTTATAT, miR-410 | 32 | 0 | 0.018331 |
| ATAGGAA, miR-202 | 35 | 0 | 0.018758 |
| TACAATC, miR-508 | 26 | 0 | 0.018879 |
| Gene set | Leading edge number | p-value | FDR |
|---|---|---|---|
| TGCACTG, miR-148A, miR-152, miR-148B | 108 | 0 | 0 |
| CTATGCA, miR-153 | 74 | 0 | 0 |
| AATGTGA, miR-23A, miR-23B | 126 | 0 | 0 |
| ATGTAGC, miR-221, miR-222 | 50 | 0 | 0 |
| TGCTGCT, miR-15A, miR-16, miR-15B, miR-195, miR-424, miR-497 | 207 | 0 | 0 |
| Gene set | Leading edge number | p-value | FDR |
|---|---|---|---|
| AAGCCAT, miR-135A, miR-135B | 140 | 0 | 0 |
| AAAGGGA, miR-204, miR-211 | 77 | 0 | 0 |
| TCTGATC, miR-383 | 18 | 0 | 0 |
| AGCACTT, miR-93, miR-302A, miR-302B, miR-302C, miR-302D, miR-372, miR-373, miR-520E, miR-520A, miR-526B, miR-520B, miR-520C, miR-520D | 145 | 0 | 0 |
| ACACTGG, miR-199A, miR-199B | 60 | 0 | 0 |
We analyzed mRNA sequencing data from 290 patients with KIRP using the
LinkedOmics TCGA database. Our results showed that the expression of 20,023 genes
correlated with PYCR1 expression, of which, 10,041 and 9982 genes were
positively and negatively correlated with PYCR1 expression, respectively
(Fig. 8A). Furthermore, we screened 50 genes significantly positively and
negatively correlated with PYCR1 expression in patients with KIRP
(p
 Fig. 8.
Genes differentially expressed in correlation with PYCR expression in KIRP (LinkedOmics). (A) Pearson test was used to analyze correlations between PYCR1 expression and genes differentially expressed in patients with KIRP. (B,C) Heatmaps showing genes positively and negatively correlated, respectively, with PYCR1 in patients with KIRP (top 50 genes). (D,E,F) The scatter plots show Pearson’s correlation of PYCR1 expression with expression of ADA, NPM, and TKT, respectively, in patients with KIRP. (G) Pearson test was used to analyze correlations between PYCR2 expression and genes differentially expressed in patients with KIRP. (H,I) Heatmaps showing genes positively and negatively correlated, respectively, with PYCR2 in patients with KIRP (top 50 genes). (J,K,L) The scatter plots show Pearson’s correlation of PYCR2 expression with expression of PFDN2, JTB, and HAX1, respectively, in patients with KIRP. (M) Pearson test was used to analyze correlations between PYCRL expression and genes differentially expressed in patients with KIRP. (N,O) Heatmaps showing genes positively and negatively correlated, respectively, with PYCRL in patients with KIRP (top 50 genes). (P,Q,R) The scatter plots show Pearson’s correlation of PYCRL expression with expression of SHARPIN, YDJC, and NUBP2, respectively, in patients with KIRP.
We used TIMER to evaluate the relationship between immune cell infiltration and
PYCR1, PYCR2, and PYCRL expression in patients with
KIRP. Our results showed that the expression level of PYCR1 in patients
with KIRP was positively correlated with B cell (Cor = 0.217, p =
4.71 × 10
 Fig. 9.
The correlation between PYCR and immune cell infiltration in KIRP (TIMER). (A) PYCR1. (B) PYCR2. (C) PYCRL.
PYCR has been reported to be overexpressed in various types of tumors, such as bladder, prostate, and gastric cancers [14]. However, PYCR expression has not yet been reported in patients with KIRP. Initially, we compared the expression levels of PYCR in patients with KIRP according to sample types, sex, age, and individual cancer stage and found that PYCR transcript levels were considerably upregulated in patients with KIRP. Interestingly, our results showed that PYCR1 and PYCR2 transcript levels were markedly upregulated in females than in males, and patients aged 21–40 years had higher PYCR1 and PYCR2 transcript levels than patients in other age groups. However, studies have confirmed that the incidence of RCC in males is higher than that in females [15]. Whether PYCR1 and PYCR2 differences in expression by sex and age are associated with the onset and prognosis of KIRP has not yet been reported. In addition, the number of cases in some individual groups was small. Hence, this requires further investigation. Furthermore, we found an extensive positive correlation between PYCR1, PYCR2, and the pathological stage of patients with KIRP. Our results also showed that PYCR1, PYCR2, and PYCRL were altered by 4%, 7%, and 6%, respectively, in 280 patients with KIRP. We also found that PYCR1 and PYCRL promoter methylation levels were considerably downregulated in patients with KIRP. Genetic changes and promoter methylation often result in abnormal gene expression and function. Increased expression of PYCR1 and PYCRL caused by genetic changes and promoter methylation may also serve as an important factor in KIRP progresion. In addition, we found that the methylation levels of CpG sites in PYCR (PYCR1: cg25759517 and cg19202384; PYCR2: cg07049680, cg23091741, and cg06086141; PYCRL: cg26507094) were notably correlated with the prognosis of patients with KIRP. This revealed that the methylation levels of PYCR act as effective prognostic biomarkers for KIRP, indicating that PYCR may play a critical role in KIRP progression. The most frequently altered neighboring genes of PYCR for PYCR1 were (ALYREF, ANAPC11, and ARHGDIA), PYCR2 were (PBRM1, CDKN2A, and ALK), and PYCRL were (MT-CO2, BLK, and C2CD5). In cancer patients with high PYCR1 expression, increased PYCR1 activity is associated with higher expression of oncogenes, such as ALYREF, ANAPC11, and ARHGDIA. PYCR1-driven oncogenes promote tumor cell proliferation and metastasis [16, 17, 18]. PBRM1, CDKN2A, and ALK are frequently mutated in lung cancer and are associated with tumor resistance [19]. MT-CO2 is a mitochondrial gene whose mutation has been widely reported in various human tumors. MT-CO2 variation may be a potential prognostic biomarker in MUTYH-associated polyposis patients [20]. CDKN2A is the second most common tumor suppressor gene in cancers. CDKN2A is frequently altered in chordoma [21]. In conclusion, these gene alterations may be involved in the occurrence and development of KIRP to different degrees and in different pathways. Finally, we assessed the prognostic value of PYCR expression in patients with KIRP. Our results showed that patients with KIRP with low PYCR1 and PYCR2 expression had longer survival rates than those with high PYCR1 and PYCR2 expression. Thus, PYCR1 and PYCR2 may serve as potential prognostic markers in patients with KIRP.
We further evaluated the potential interactions between PYCR and its neighboring genes. We found that PYCR and its neighboring genes are linked to a complex interaction network through co-expression, physical interactions, and prediction. Next, we evaluated the functions of PYCR and its neighboring genes. We found that the molecular functions of PYCR1 and its neighboring genes were tumor-associated voltage-gated calcium channel activity, phospholipid binding, and ubiquitin-like protein ligase binding. For instance, the voltage-gated calcium channel is closely related to cancer pain and inhibiting its activity can reduce cancer pain [22]. In addition, inhibition of T-type voltage-gated calcium channels showed anti-proliferative and cytotoxic effects and is an important anticancer target [23]. Neuronally expressed developmentally downregulated 4 (NEDD4) is a ubiquitin-like protein ligase that accelerates tumor growth and metastasis by regulating the microRNA-132/NRF2 axis [24]. NEDD4 is a potential therapeutic target for the prevention of tumor recurrence and metastasis. In addition, we found that nuclear receptor binding, DNA-binding transcription activator activity, and RNA polymerase II-specificity, which are related to tumorigenesis and development, were the molecular functions of PYCR2 and its neighboring genes. For example, overexpression of nuclear receptor-binding protein 1 inhibits colorectal cancer cell proliferation and promotes apoptosis [25]. The KEGG pathway of PYCR2 and its neighboring genes is involved in cancer pathways. In addition, the molecular functions associated with PYCRL and its neighboring genes mainly include oxidoreductase, kinase, and GTPase-regulatory activities related to tumor metabolism. Their KEGG pathway analysis revealed their involvment in proline metabolism. Proline has been shown to act as a potent anti-oxidative stress agent capable of protecting cells from various reactive oxygen species (ROS) inducers. Excessive ROS production is detrimental, through oxidative damage to DNA, proteins, and lipids, to the survival of cancer cells. In summary, regulating the functions of PYCR and its neighboring genes may be an important strategy for the treatment of KIRP.
The increasing incidence of various cancers constitutes an urgent need to
identify accurate early diagnostic markers and develop more effective treatments.
MicroRNAs (miRNAs) are small non-coding RNAs with great potential as diagnostic
markers and therapeutic targets in cancer clinics. Therefore, we explored miRNA
targets of PYCR in patients with KIRP. We found that miR-21, miR-221, miR-222,
miR-410, miR-202, and miR-508 are targets of PYCR1. In recent years,
many studies have shown that targeting miR-21 in combination with conventional
chemotherapy drugs can improve therapeutic outcomes and overcome drug resistance
and tumor recurrence [26, 27]. Inhibition of miR-221-3-p and miR-222-3-p can
prevent cancer cell viability, migration, and invasion and promote apoptosis
[28]. miR-221/222 has potential as an auxiliary diagnostic marker for tumors
[29]. miR-410 acts as a cancer inducer in colorectal cancer, and miR-410-3-p
promotes colorectal cancer cell migration and invasion by activating the
NF-
We explored the correlation between differentially expressed genes and PYCR expression in patients with KIRP. We found that the expression of 20,023 genes was correlated with PYCR1 expression. ADA, NPM3, and TKT were the top three genes positively correlated with the expression of PYCR1. Adenosine deaminase (ADA) regulates intracellular and extracellular adenosine concentrations by converting adenosine to inosine. Adenosine accumulates in high concentrations in tumors and exerts a series of malignancy-promoting effects [40]. Transketolase (TKT) is a key enzyme in the non-oxidative pentose phosphate pathway. TKT can promote the development of liver cancer in a non-metabolic manner through its nuclear localization and EGFR pathway [41]. In addition, we found that PFDN2, JTB, and HAX1 were the top three genes positively correlated with the expression of PYCR2. Prefoldin subunits (PFDN2) are involved in cancer progression. PFDN2 may serve as poor prognostic markers for gastric cancer [42]. JTB is a tumor suppressor gene in various malignancies and can be used as a biomarker for breast cancer [43]. Studies have confirmed that HS-1-associated protein-1 (HAX1) enhances non-small cell lung cancer survival and metastasis through the AKT/mammalian target of the rapamycin (MTOR) and double minute 2 protein (MDM2)/P53 signaling pathways [44]. Furthermore, SHARPIN, YDJC, and NUBP2 were the top three genes positively correlated with the expression of PYCRL. SHARPIN plays an important role in tumorigenesis. Overexpression of SHARPIN promotes tumor progression in ovarian cancer [45]. Chitooligosaccharide deacetylase homolog (YDJC) contributes to induction of protein phosphatase 2A (PP2A) ubiquitination by increasing epithelial-mesenchymal transition (EMT). Hence, YDJC may become a new target for antitumor therapy [46]. Therefore, targeting these genes may provide adjuvant therapy for KIRP.
Immunotherapy is a novel clinical cancer treatment. Tumor immune infiltration is closely related to clinical prognosis. As expected, the expression level of PYCR in patients with KIRP was positively or negatively correlated with the level of immune cell infiltration. B-cell-mediated inflammation may play an important role in promoting the progression of aggressive malignancies. However, data from preclinical studies have shown significant differences in the role of B cells at different stages of cancer development. In mouse models of precancerous lesions, B cells appear to cause inflammation, which in turn induces precancerous lesions [47]. CD8+ T cells play a central role in anti-tumor immunity. CD8+ T cells are activated upon stimulation by tumor antigens and then differentiate into functional cells and migrate to the tumor site. Activated CD8+ T cells can directly destroy tumor cells by releasing perforin and granzymes and by inducing death ligand/death receptor-mediated apoptosis. They also secrete cytokines to regulate the immune system in tumor cells. However, disturbances in mitochondrial dynamics can affect CD8+ T cell function. Overall, mitochondrial abnormalities in CD8+ T cells contribute to cancer development [48]. Therefore, targeting PYCR or PYCR-related regulatory targets may be a feasible strategy for regulating immune cell infiltration in patients with KIRP.
This study systematically analyzed the expression, gene regulatory network, prognostic value, and target prediction of PYCR in patients with KIRP, elucidated the relationship between PYCR and KIRP, and provided new insights into KIRP treatment.
PYCR, Pyrroline-5-carboxylate reductase; KIRP, kidney renal papillary cell carcinoma; KEGG, Kyoto Encyclopedia of Genes and Genome; GO, Gene Ontology; RCC, renal cell carcinoma; PPI, protein-protein interactions; GEPIA, Gene Expression Profiling; miRNA, MicroRNA.
The datasets used and/or analyzed during the current study are available from the corresponding author on reasonable request.
JC and YS performed data analysis work and aided in writing the manuscript. ZS designed the study and assisted in writing the manuscript. LL, YC, LD, QX, QL, XL, and JZ edited the manuscript. All authors read and approved the final manuscript.
Not applicable.
We appreciate the funding support from the Guangdong Medical University, Zhanjiang, and Guangdong province.
This research was funded by Guangdong province ordinary colleges and universities young innovative talents project (4SG21202G), national pharmaceutical economic information network science and technology communication innovation project of chinese pharmaceutical association (CMEI2021KPYJ00310), postdoctoral Foundation of Guangdong Medical University (4SG22292G), and the project of financial fund science and technology special competitive allocation of Zhanjiang (Zhanke[2010]174).
The authors declare no conflict of interest.