


 , Serkos A. Haroutounian 1
1 Laboratory of Nutritional Physiology and Feeding, Agricultural University of Athens, 11855 Athens, Greece
Academic Editor: Tomasz M. Karpiński
Abstract
Background: Essential oils (EO) are considered as safe and sustainable
alternatives of synthetically produced industrial raw materials. While EO are
renewable resources their production is traced to land use, therefore employing
nonrenewable resources. This fact is often neglected during market up-take, which
is established on EO bioactivity efficacy. Methods: Present study is
aiming this knowledge gap through an innovative algorithm that employs spatial
yield, bioactivity performance and fundamental experimentation details to
calculate the land footprint. The proposed methodology is tested upon a concise
pool of 54 EO, of which 9 originate from 8 culinary herbs, 27 from 3 juniper
taxa, and 18 from 6 Citrus sp. crops. All 54 EO were subjected to
repellent evaluation and 44 of them also to larvicidal, encompassing in the
protocol both choice and no-choice bioassays. Results: Based on these
bioprospecting data the proposed protocol effectively calculated the land
footprint for all EO and bioassays. The repellent land footprint indicated as
more sustainable the EO from savory, oregano, tarhan, thyme, Greek sage, and
juniper berries for which each application corresponds to 3.97, 4.74, 7.33, 7.66,
8.01 and 8.32 m
Keywords
- sustainability
- essential oil
- pesticide
- land footprint
- bioprospecting
Sustainability was introduced as an international policy priority through the “Rio Declaration” in 1992 and is expected to constitute the leading development principle for the 21st century. During the same year, the sustainable development was unequivocally linked with the natural capital by Costanza and Dally [1]. They, first among many to follow, discriminated the natural capital in two primeval qualities: active or renewable vs. inactive or nonrenewable. Moreover, this highly influential work has highlighted as key sustainability target the safeguarding of the natural capital future perspectives. Consequently, numerous scientific efforts were diverted between waste and energy reduction in industrial production [2], but also towards the deployment of renewable resources as a substitute of the nonrenewable assets [3].
Natural products constitute one of the main alternatives for the substitution of nonrenewable resources. They have been proven as an efficient renewable source of raw materials with very promising potentials for the amelioration of various sectors’ environmental performance, since they are generally quoted as sustainable [4]. Notable examples of sectoral approaches exploiting the natural products potentials may be traced in pharmaceutical industry since they constitute the primary source for the development of new medicines [5]. Natural products in the form of essential oils (EO) have also been identified as a prominent source for renewable raw materials of chemical industry [6], to produce fine chemicals [7]. Food industry sector also experiences significant impacts by EOs advances either in the form of dietary and health beneficiary compounds [8], or as preservatives and food spoilage control agents [9]. A notable mature example is traced in the agrochemicals industry, where the EOs, in the form of biopesticides, conform a sound and preferable alternative of conventional pesticides, with a plethora of regulatory and best practice documentation [10]. Further justification for the consideration of EOs as preferable natural products is provided by their prospects in cultural heritage artefacts conservation [11], and/or restoration [12].
These promising perspectives for the application of EOs for the sustainable transformation of both economy and society are not unquestioned. The relative discussions, initially focused on legislative and regulatory issues, soon were expanded towards intellectual property rights [13], economic feasibility [14] and ecological sustainability [15]. In specific, Hall and Bawa [16] in their study concerning the trade-offs between economic and ecological issues have indicated their unfavourable impacts on nature conservation caused by the harvesting of wild plant populations. The profound answer of cultivating the herbal material, has also become a matter of vivid conversations within the scientific community, with focus on the competition for land use between food and cash crops [17]. These arguments have initiated the development of high-throughput screening protocols, mostly referred as bioprospecting, aiming to provide a cross assessment of the EO bioactivity efficacy to facilitate market and society uptake of early research results [18].
Essential oils have been occupying a pivotal role on the development of sustainable biocides, including applications as antibacterial [19], antifungal [20], and pesticide agents [21]. Among them their use as pesticides present numerous and diverse targets including preharvest [22], and postharvest pests relating to the aspects of food security and safety [21], special purpose pesticides [11], and disease vectors relating to public health issues that torture earths tropical to temperate zones [23]. In this last case, of the disease vectors, but also in other cases two major mode of activities are evaluated for commercial purposes [21, 24]. The repellent when there is a need of low toxicity and selective targeting [24]. The biocidal when there is the need of sterilization that requires high toxicity, but also requires selective targeting [25].
Present study aspires to ameliorate previous advances in bioprospecting through the development and application of an innovative EO sustainability assessment protocol that considers the aspects of yield, bioactivity, and consumption of nonrenewable sources, which are implicated in their production. Protocol development was structured on the case study of essential oils (EO) and their potentials as bio-pesticides [26], which display significant economic [4], and ecological implications [10]. Moreover, the selection of the present essay’s subject was based on the facilitation of both choice and nonchoice bioassays and the consideration of uniform and widely available data sets, ameliorating previous evaluation approaches [27], but also focusing in a versatile and multipurposed natural product in the form of the EO to enhance the proposed methodology’s adaptability and replicability [28].
A sum of 54 EO in the form of Essential Oils (EO) have been incorporated in the present study. These EOs and their respective details of taxa of origin, collection, isolation methodology, yield, composition, and bioactivity have been categorized according to the plant tissues origin and were published in three major clusters.
The first focused on forest plants and includes three species of Juniperus of the Cupressaceae Family [29]; J. phoenicea L. (juniper) from which 17 EOs were retrieved (J 01 – J 17), J. drupacea Labill. (Syrian juniper) with 17 EOs (J 18 – J 34) and J. excelsa M.Bieb. (Greek juniper) with 1 EO (J 35).
The second cluster is based on cultivated plants and contains six Citrus species of Rutaceae Family [30]; C. paradisi Macfad. (grapefruit; C 01 – C 04), C. limon (L.) Osbeck (lemon; C 05 – C 08), C. reticulata Blanco (tangerine; C 09 – C 12), C. sinensis (L.) Osbeck (orange; C 13 – C 16), C. japonica Thunb. (kumquat; C 17), and Citrus x auarantium L. (bitter orange; C 18).
The third cluster is focused on culinary herbs and includes eight taxa from various families [24], each contributing one EO apart from tarhan which contributed two. These herbs are Ruta chalepensis L. (rue; V 01), Echinophora tenuifolia ssp. sibthorpiana (Guss.) Tutin (tarhan; V 05 – V 06), Salvia fruticose Mill. (Greek sage; V 09), Thymbra capitata (L.) Cav. (thyme; V 10), Origanum onites L. (oregano; V12), Foeniculum vulgare Mill. (fennel; V 14), Vitex agnus-castus L. (monk’s pepper; V 15) and Satureja thymbra L. (savory; V 16). All EOs along with their metadata are included in Appendix Table 2.
The essential oils of the study were retrieved mostly by hydro distillation (J 01 – J 35, V 01 – V 16, C 04, C 08, C 12, C 16 – C 18), but also through cold press (C 01, C 05, C 09, C 13), and by combination of them (C 02, C 03, C 06, C 07, C 10, C 11, C 14, C 15). This variability of the essential oil retrieval methodology was included to increase the proposed methodology applicability.
The repellent and larvicidal properties of the EOs were assessed against the Asian Tiger Mosquito in bioassays performed uniformly in all EOs [24, 29, 30].
A summary of the proposed methodology is presented as a semantic diagram in Fig. 1 (Ref. [7]), and extensively presented in 3 major stages.
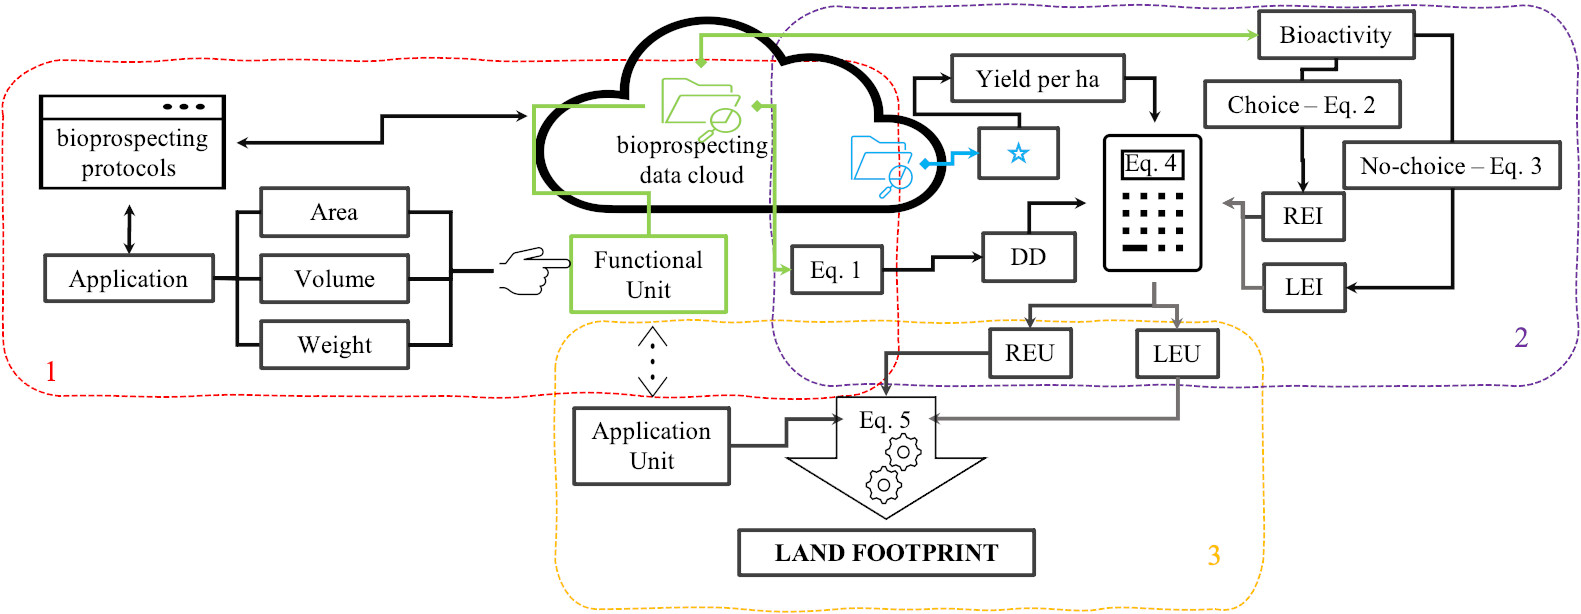
Starting point of the proposed protocol is the selection of the functional unit, a decision of crucial importance for the indicator’s translation. The calculation of the functional unit is based on the available experimental data and incorporates the amount of the EO used for the bioassay and the total area of the experimental application.
The functional unit is calculated for both repellent and larvicidal
experimentation, according to Eqn. 1 and expresses the volume of natural product
required for the coverage of 1 m
FU: Functional Unit in mL per m
DD
A
The EO’s spatial yield constitutes a fundamental figure for structuring the proposed methodology. The calculation of this parameter is based on a methodology recently introduced by authors for the estimation of the essential oil annual crop potentials [7], a methodology that is readily applicable for all classes of natural products. A deviation from this approach is applied for Citrus crops since their prevailing cultivation scheme and the respective plantation density were incorporated instead of the estimated 50% of land coverage.
Next element for the construction of final equation refers to the incorporation of the bioactivity exhibited by the investigated EO. Herein, a binary approach was applied to transform the expression of bioactivity as a clear number ranging from 0 to 1.
In this respect, the repellent coefficient was calculated as a clear number in order to provide a net multiplier of 1 for the optimum result (no landings) and escalate downwards as the number of landings increase. The respective indicator is calculated in accordance with the Eqn. 2.
REI: Repellent Efficacy Index,
L
Respectively the larvicidal coefficient was calculated as a single number in order to provide a net multiplier of 1 for the best result (100% mortality) and escalating downwards as the percent of mortality decreases. This indicator is calculated in the terms of Eqn. 3.
LEI: Larvicidal Efficacy Index.
M
Finally, all above mentioned figures were incorporated in the calculation of the Land Equivalent Unit indicator. This indicator refers to the annual volume of essential oil production from a land area of 1 hectare and simultaneously incorporates the land use efficacy by each natural product that is evaluated. In specific, this indicator is calculated in the terms of Eqn. 4, reflecting both larvicidal and repellent activities.
LEU: Land Equivalent Units in m
P
FU: Functional Unit of Repellent or Larvicidal application in mL per m
B
The enumeration of functional unit is concluded into two distinct values: one
for repellent and one for larvicidal bioassay. These values express the amount of
natural product required to cover 1 m
The choice of spatial coverage as functional unit has based on the corresponding methodological principle proposed by Wackernagel and Yount [31] and summarizes the so far achievements on sustainability assessment under the footprint heading. This choice enhances the interconnectivity results of the proposed protocol with the National Footprint Accounting, the prominent sustainability assessment methodology [32, 33]. The latter incorporates as fundamental figure the regenerative capacity of biosphere in conjunction with the land use productivity.
In addition, this choice also serves the replicability of the proposed methodology, since the required primary data are uniformly obtained through the initial stage of the more prominent bioprospecting protocols for biopesticides and through the plant biology and botanical description. Furthermore, this choice is adaptable by different bioprospecting protocols that incorporate the application of the discriminative dose in volume and/or weight. Furthermore, the functional unit choice also takes into consideration the final product application unit in order to facilitate the expression of the indicator as a clear number that corresponds to the land area required for the production of a single dose of the evaluated natural product.
The annual yield per hectare of the EOs was calculated in accordance with a recently presented methodology [7], which is also proved applicable for differentiated production schemes [34]. These yields are presented in Table 1 and discussed shortly in follow.
| EO | Spatial Yield (L/ha) | Bioactivity Coefficient | Land Equivalent Unit (m | ||
|---|---|---|---|---|---|
| REI | LEI | REU | LEU | ||
| V 01 | 20.46 | 0.08 | 0.75 | 84.30 | 581.48 |
| V 05 | 14.78 | 0.53 | 0.42 | 393.09 | 235.23 |
| V 06 | 26.99 | 0.89 | 0.66 | 1.194.32 | 675.01 |
| V 09 | 21.85 | 1.00 | 0.02 | 1.092.49 | 16.56 |
| V 10 | 22.86 | 1.00 | 1.00 | 1.142.86 | 866.13 |
| V 12 | 36.89 | 1.00 | 1.00 | 1.844.64 | 1.397.98 |
| V 14 | 38.19 | 0.22 | 0.80 | 424.31 | 1.157.76 |
| V 15 | 6.67 | 0.44 | 0.14 | 148.25 | 35.39 |
| V 16 | 44.11 | 1.00 | 0.96 | 2.205.47 | 1.604.59 |
| J 01 | 3.52 | 0.38 | N/A | 66.85 | N/A |
| J 02 | 5.45 | 1.00 | 0.67 | 272.73 | 138.48 |
| J 03 | 9.92 | 0.02 | 0.04 | 9.87 | 15.04 |
| J 04 | 44.04 | 0.05 | N/A | 103.72 | N/A |
| J 05 | 3.63 | 1.00 | 0.02 | 181.44 | 2.75 |
| J 06 | 54.44 | 0.09 | 0.08 | 253.14 | 165.03 |
| J 09 | 3.78 | 0.10 | N/A | 18.18 | N/A |
| J 10 | 6.49 | 0.89 | 0.18 | 287.34 | 44.29 |
| J 11 | 13.36 | 0.47 | 0.26 | 313.60 | 131.61 |
| J 14 | 5.60 | 0.80 | 1.00 | 224.16 | 212.35 |
| J 15 | 6.95 | 0.35 | 0.90 | 120.63 | 236.97 |
| J 16 | 4.97 | 1.00 | N/A | 248.58 | N/A |
| J 17 | 21.04 | 1.00 | 0.02 | 1.051.84 | 15.94 |
| J 18 | 5.45 | 1.00 | 0.67 | 272.29 | 138.26 |
| J 19 | 5.00 | 1.00 | 0.94 | 250.16 | 178.21 |
| J 21 | 5.80 | 0.80 | 0.26 | 231.97 | 57.13 |
| J 23 | 12.84 | 0.53 | 0.40 | 341.52 | 194.64 |
| J 24 | 2.91 | 1.00 | 1.00 | 145.30 | 110.12 |
| J 25 | 4.80 | 0.80 | 0.96 | 191.81 | 174.44 |
| J 26 | 5.11 | 0.05 | 0.94 | 12.08 | 181.94 |
| J 28 | 2.53 | 0.04 | N/A | 4.88 | N/A |
| J 29 | 6.30 | 0.02 | 0.06 | 7.62 | 14.33 |
| J 30 | 3.09 | 1.00 | N/A | 154.27 | N/A |
| J 31 | 1.64 | 0.02 | N/A | 2.04 | N/A |
| J 32 | 5.92 | 0.13 | 0.12 | 38.82 | 26.93 |
| J 33 | 4.58 | 0.08 | 0.54 | 19.07 | 93.70 |
| J 35 | 9.11 | 0.09 | N/A | 41.39 | N/A |
| C 01 | 5.12 | 0.03 | 0.02 | 7.55 | 3.88 |
| C 02 | 4.25 | 0.02 | 0.28 | 4.12 | 45.09 |
| C 03 | 4.10 | 0.03 | 0.24 | 5.24 | 37.25 |
| C 04 | 5.73 | 0.80 | 0.25 | 229.08 | 54.25 |
| C 05 | 2.52 | 0.04 | 0.74 | 5.25 | 70.66 |
| C 06 | 1.61 | 0.03 | 0.31 | 2.01 | 18.90 |
| C 07 | 1.37 | 0.02 | 0.26 | 1.69 | 13.45 |
| C 08 | 4.19 | 1.00 | 0.02 | 209.30 | 3.17 |
| C 09 | 3.36 | 0.03 | 0.14 | 4.54 | 17.82 |
| C 10 | 2.42 | 0.03 | N/A | 3.59 | N/A |
| C 11 | 2.26 | 0.05 | 0.46 | 5.95 | 39.44 |
| C 12 | 3.14 | 0.20 | 0.1 | 32.21 | 11.91 |
| C 13 | 7.59 | 0.02 | 0.51 | 7.52 | 146.73 |
| C 14 | 6.07 | 0.02 | 0.94 | 5.83 | 216.36 |
| C 15 | 5.06 | 0.02 | 0.84 | 4.76 | 161.13 |
| C 16 | 6.41 | 1.00 | 0.54 | 320.60 | 131.20 |
| C 17 | 1.38 | 0.80 | 0.75 | 55.23 | 39.24 |
| C 18 | 2.90 | 1.00 | N/A | 144.76 | N/A |
As more productive were proven the juniper ripe berry (J 05) and savory (V 16) EOs with annual production of 54.44 L and 44.11 L respectively, followed by the juniper unripe berry (J 04) EO, estimated to 44.04 L. Only 10 more of the EOs were proven to exceed the 10 L yield per hectare and year. In specific, fennel (V 14) and oregano (V 12) were the two EOs that exceeded the 30 L threshold, followed by these from tarhan (V 06), thyme (V 10), Greek sage (V 09), juniper (J 17) and (V 01), which all exceeded the threshold of 20 L.
The remaining three EOs were originated from tarhan (V 05), Juniper (J 11) and Syrian juniper (J 23) with estimated annual production capacity of more than 10 L. The more productive of the Citrus sp. EOs were those from orange (C 13, C 16, C 14, C 15) followed by two from grapefruit (C 04, C 01) which were in between 5 and 10 L of projected annual production per hectare and year. In the same range were listed in total 19 EOs mostly originated from juniper leaf and Syrian juniper leaves and berry. Finally, 22 EOs were estimated to be the least productive with annual yield not exceeding the 5 L per hectare. These were originated mostly from the wood of the forest trees and the Citrus sp. crops.
It must be noticed here that the above figures may also serve as a sustainability indicator for the finalized products, since there is a specificized content of natural product. This amount can be readily attributed to the corresponding required land for its production through the annual per hectare yield. Nevertheless, since the scope of the study was the ex-ante evaluation of the most productive and the most potent EO another critical figure is still missing from the equation.
The calculation of the two bioactivity coefficients followed the general rule that 0 is translated as no activity and 1 as maximum activity. The calculation algorithms enabled the uniform expression from the results of—both for choice and no-choice experimentation protocols—the performed bioassays for the evaluation of EO bioactivity. The results are presented cumulatively in Table 1, while their distribution in 5 major bioactivity clusters characterized as inactive, mild, moderate, potent, and of high activity is presented and discussed in follow separately for the choice (repellence) and no-choice (larvicidal) bioassays.
The distribution of the 54 EOs in the 5 bioactivity clusters is depicted in Fig. 2. In the high activity cluster are included twenty-two EOs, with fifteen of them exhibiting zero landings.
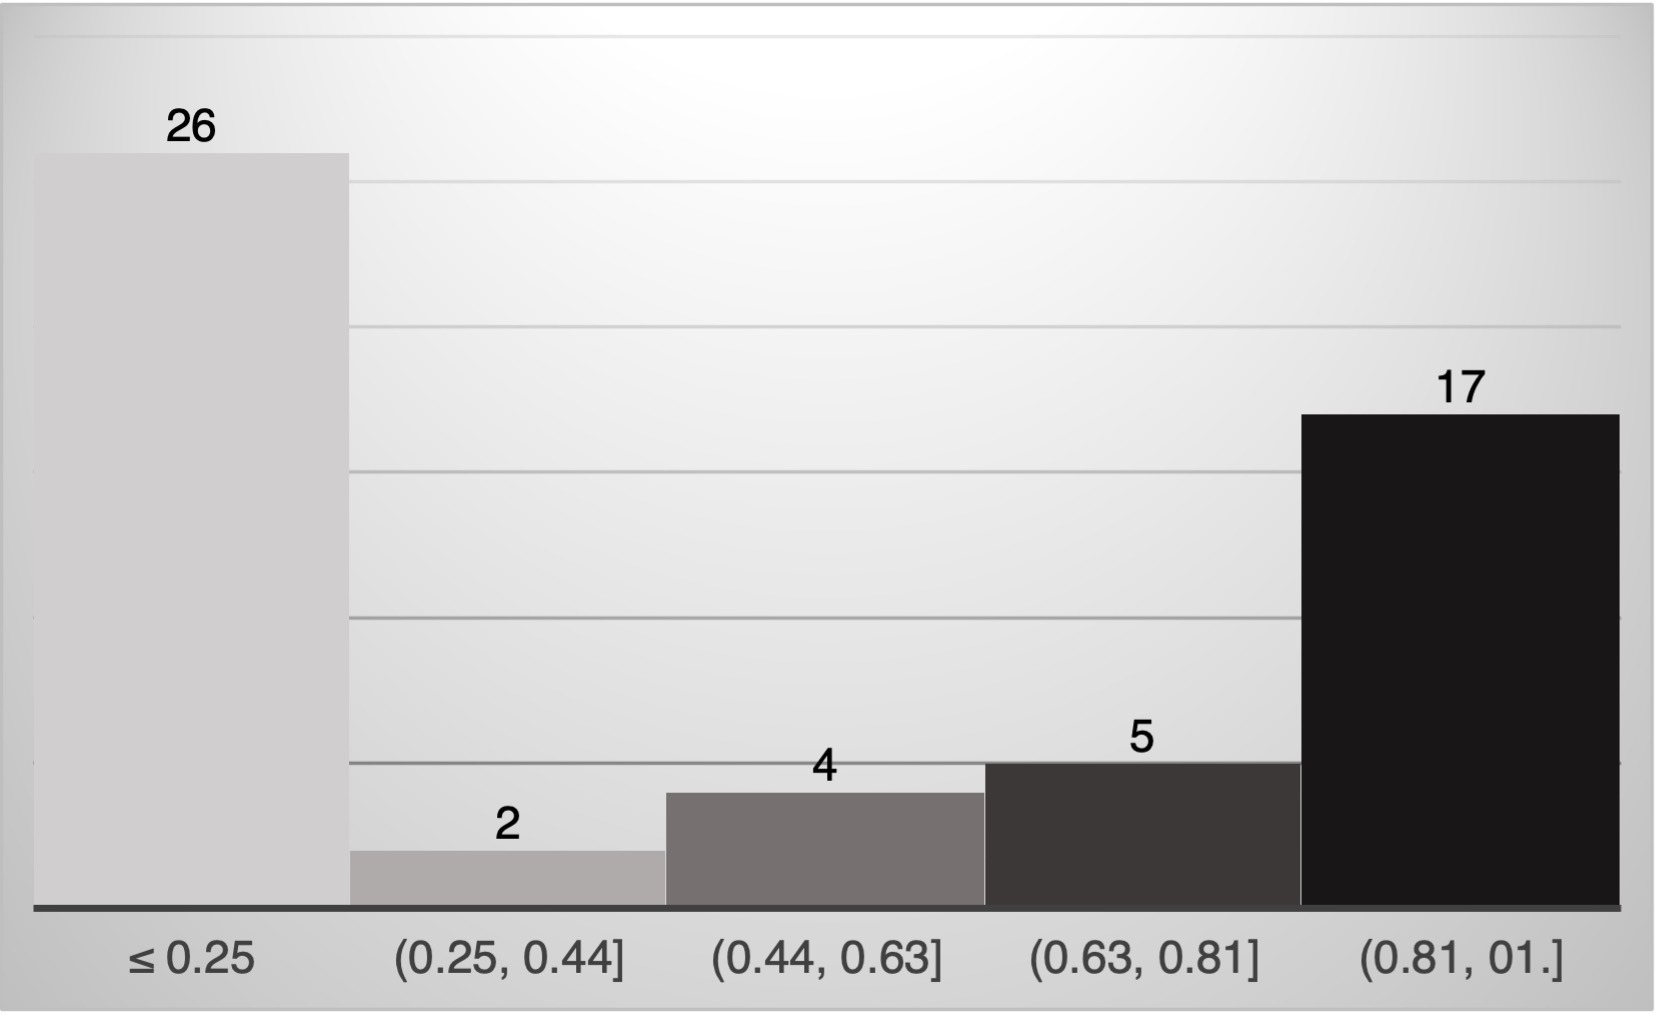 Fig. 2.
Repellent Efficacy Indicator Clusters.
These last EOs belong to various taxa and include samples originating from tarhan (V 06), oregano (V 12), thyme (V 10), Greek sage (V 09), juniper leaf (J 02, J 05) and berry (J 16, J 17), orange fruit (C 16), Syrian juniper leaves (J 18, J 19, J 24, J 30) and bitter orange (C 18). In this high activity cluster were also included two more EOs presenting REI higher than 0.80. These were the EOs from tarhan (V 06) and juniper leaves (J 10). In the cluster of potent were assigned 5 EOs, with REI 0.80 and originating from Syrian juniper berry (J 21) and leaves (J 25), juniper leaves (J 14), grapefruit (C 04), kumquat (C 17). In the group of moderate activity were included four EOs, with two of them exhibiting REI of 0.53 (tarhan, V 05; Syrian juniper berries, J 23), while the REI of juniper berries (J 11) EO was 0.47 and that from monk’s pepper (V 15) 0.43. Two EOs from the leaves of juniper (J 01, J 15) were found of mild activity exhibiting REI values 0.38 and 0.35 respectively. In the low activity cluster were assigned 26 EOs from which only three presented REI above 0.20 and these were originated from tangerine (C12), fennel (V 14) and Greek juniper (J 35), while all other EOs were assigned REI values close to or lesser to 0.10.
In the present case not all the investigated EOs were evaluated. This happens because limitations in the laboratory scale production of the EOs did not produce adequate quantities for duplicate testing. In specific 10 EOs were omitted and therefore concluding to 44 samples the distribution of which in the 5 bioactivity clusters is depicted in Fig. 3.
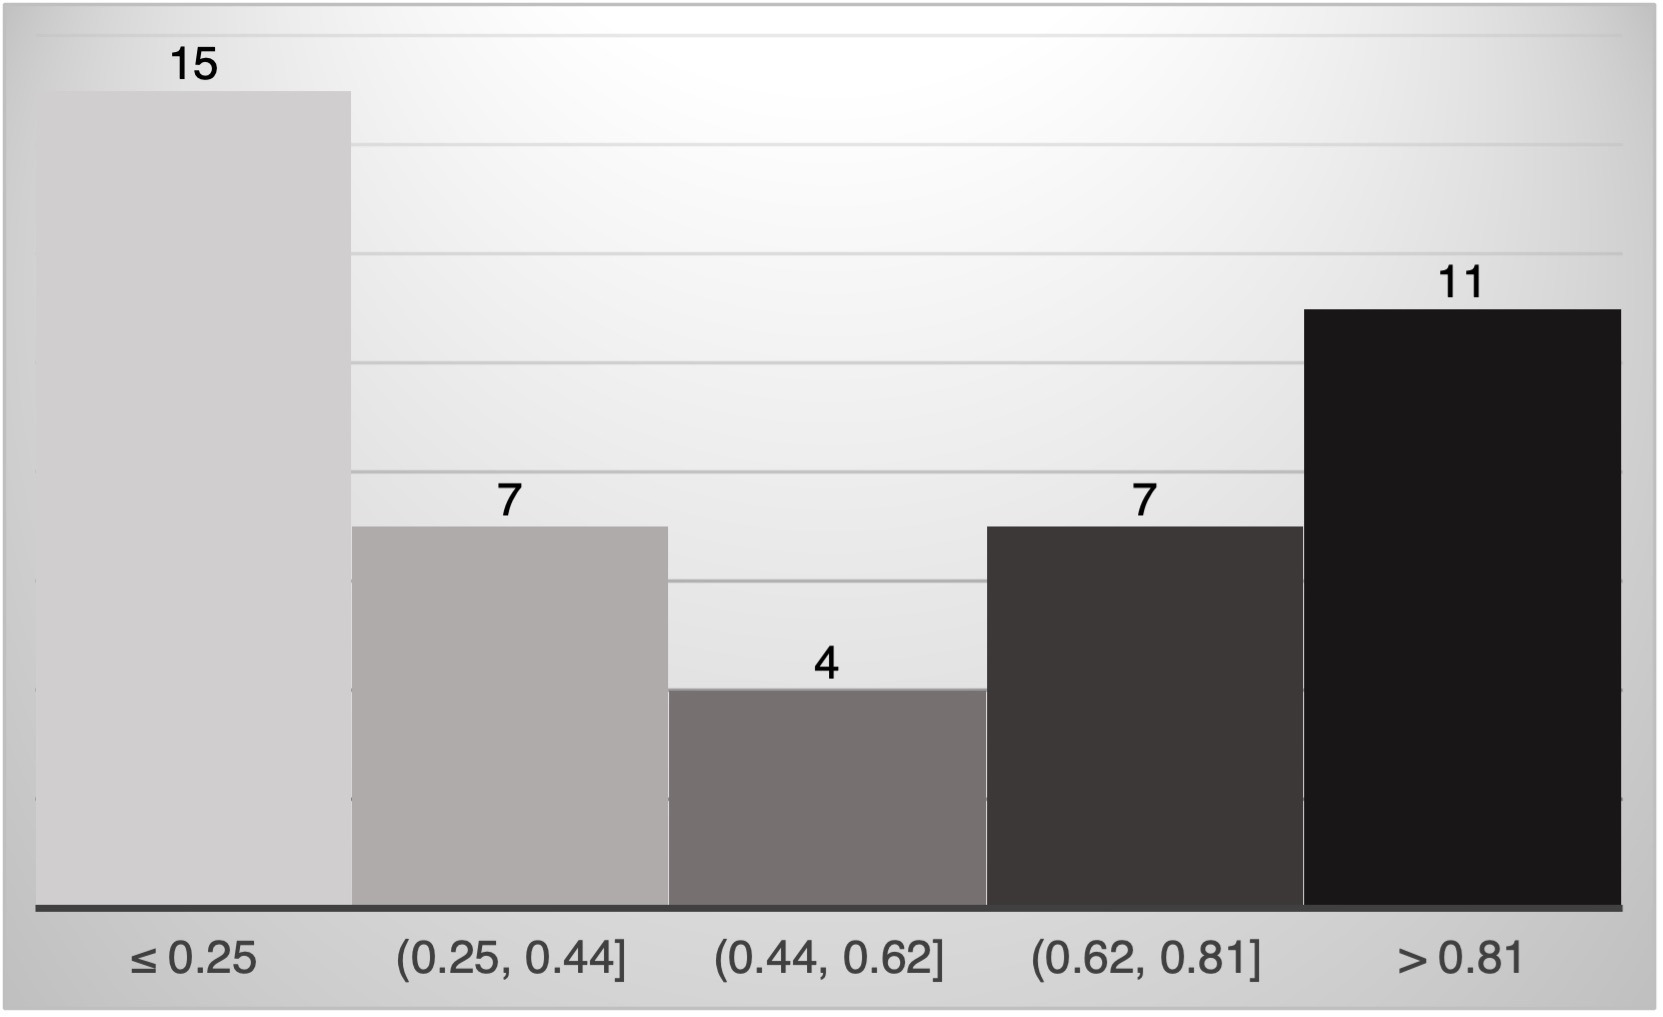 Fig. 3.
Larvicidal Efficacy Indicator Clusters.
In the high activity cluster are included 11 EOs from which the four that exhibited 100% larval toxicity originate from oregano (V 12), thyme (V 10), juniper leaves (J 14) and Syrian juniper leaves (J 24). In the same group were also assigned seven more EOs presenting LEI values above 0.81. These were in LEI descending order: 0.96 savory (V 16) and Syrian juniper leaves (J 25); 0.94 Syrian juniper leaves (J 19, J 26) and orange (C 14); 0.90 juniper leaves (J 15); 0.84 orange (C 15). In the cluster of potent bioactive EOs were included the EOs from fennel (V 14), rue (V 01), kumquat (C 17), lemon (C 05), juniper leaves (J 02), Syrian juniper leaves (J 18), and tarhan (V 06). The EOs that were found to exhibit moderate activity were these from Syrian juniper berries (J 33), orange (C 16, C 13) and tangerine (C 11). In the mild activity cluster were assigned seven EOs and more specifically these from tarhan (V 05), Syrian juniper berries (J 23), lemon (C 06, C 07), grapefruit (C 02), juniper berries (J 11) ans Syrian juniper berries (J 21). Finally, in the inactive cluster were catalogued fifteen EOs of various origin.
The cumulative results of LEU calculation for the repellence and toxicity
sustainability assessments are presented in Table 1. These results present for
first time an estimation for EO land productivity corrected upon their
bioactivity. The sustainability evaluation of both repellent and larvicidal
properties of the EOs studied highlighted in both cases oregano (V 12) and savory
(V 16) as most potent with repellent LEU values 1397.98 and 1604.59 m
In the repellent sustainability assessment juniper and Syrian juniper EOs
presented significant records. In specific, juniper (J 17) and Syrian juniper
berries (J 23) berries EOs exhibited repellent LEU of 1050.84 and 341.52
m
These values which are capable for outlining the land utilization efficacy of each EO, may be further translated on the base of the functional unit refinement. In specific the adjusting of LEU, in respect with the covered area per application can provide a land footprint projection for each of the natural products, EOs in the present case, under consideration. The numerical calculations were performed according to Eqn. 5.
LF: Land Footprint in m
LEU: Land equivalent unit in m
OU: Operational Unit in m
This final step of the proposed methodology was omitted from the description of the protocol as it is highly depended upon the nature of the EO utilization. It was deemed more appropriate, since these calculations are established upon case specific figures, to be presented for each purpose separately. Thus, the land footprint projections are described, presented, and discussed in follow for the repellence and larvicidal bioassays.
Based on the fact the final application of any repellent scopes to protect the
exposed human skin, as operational unit for the repellent land footprint was
chosen the coverage of the 50% of the average human skin’s surface. Considering
that the area of the human skin varies between individuals from 1.5 to 2.0
m
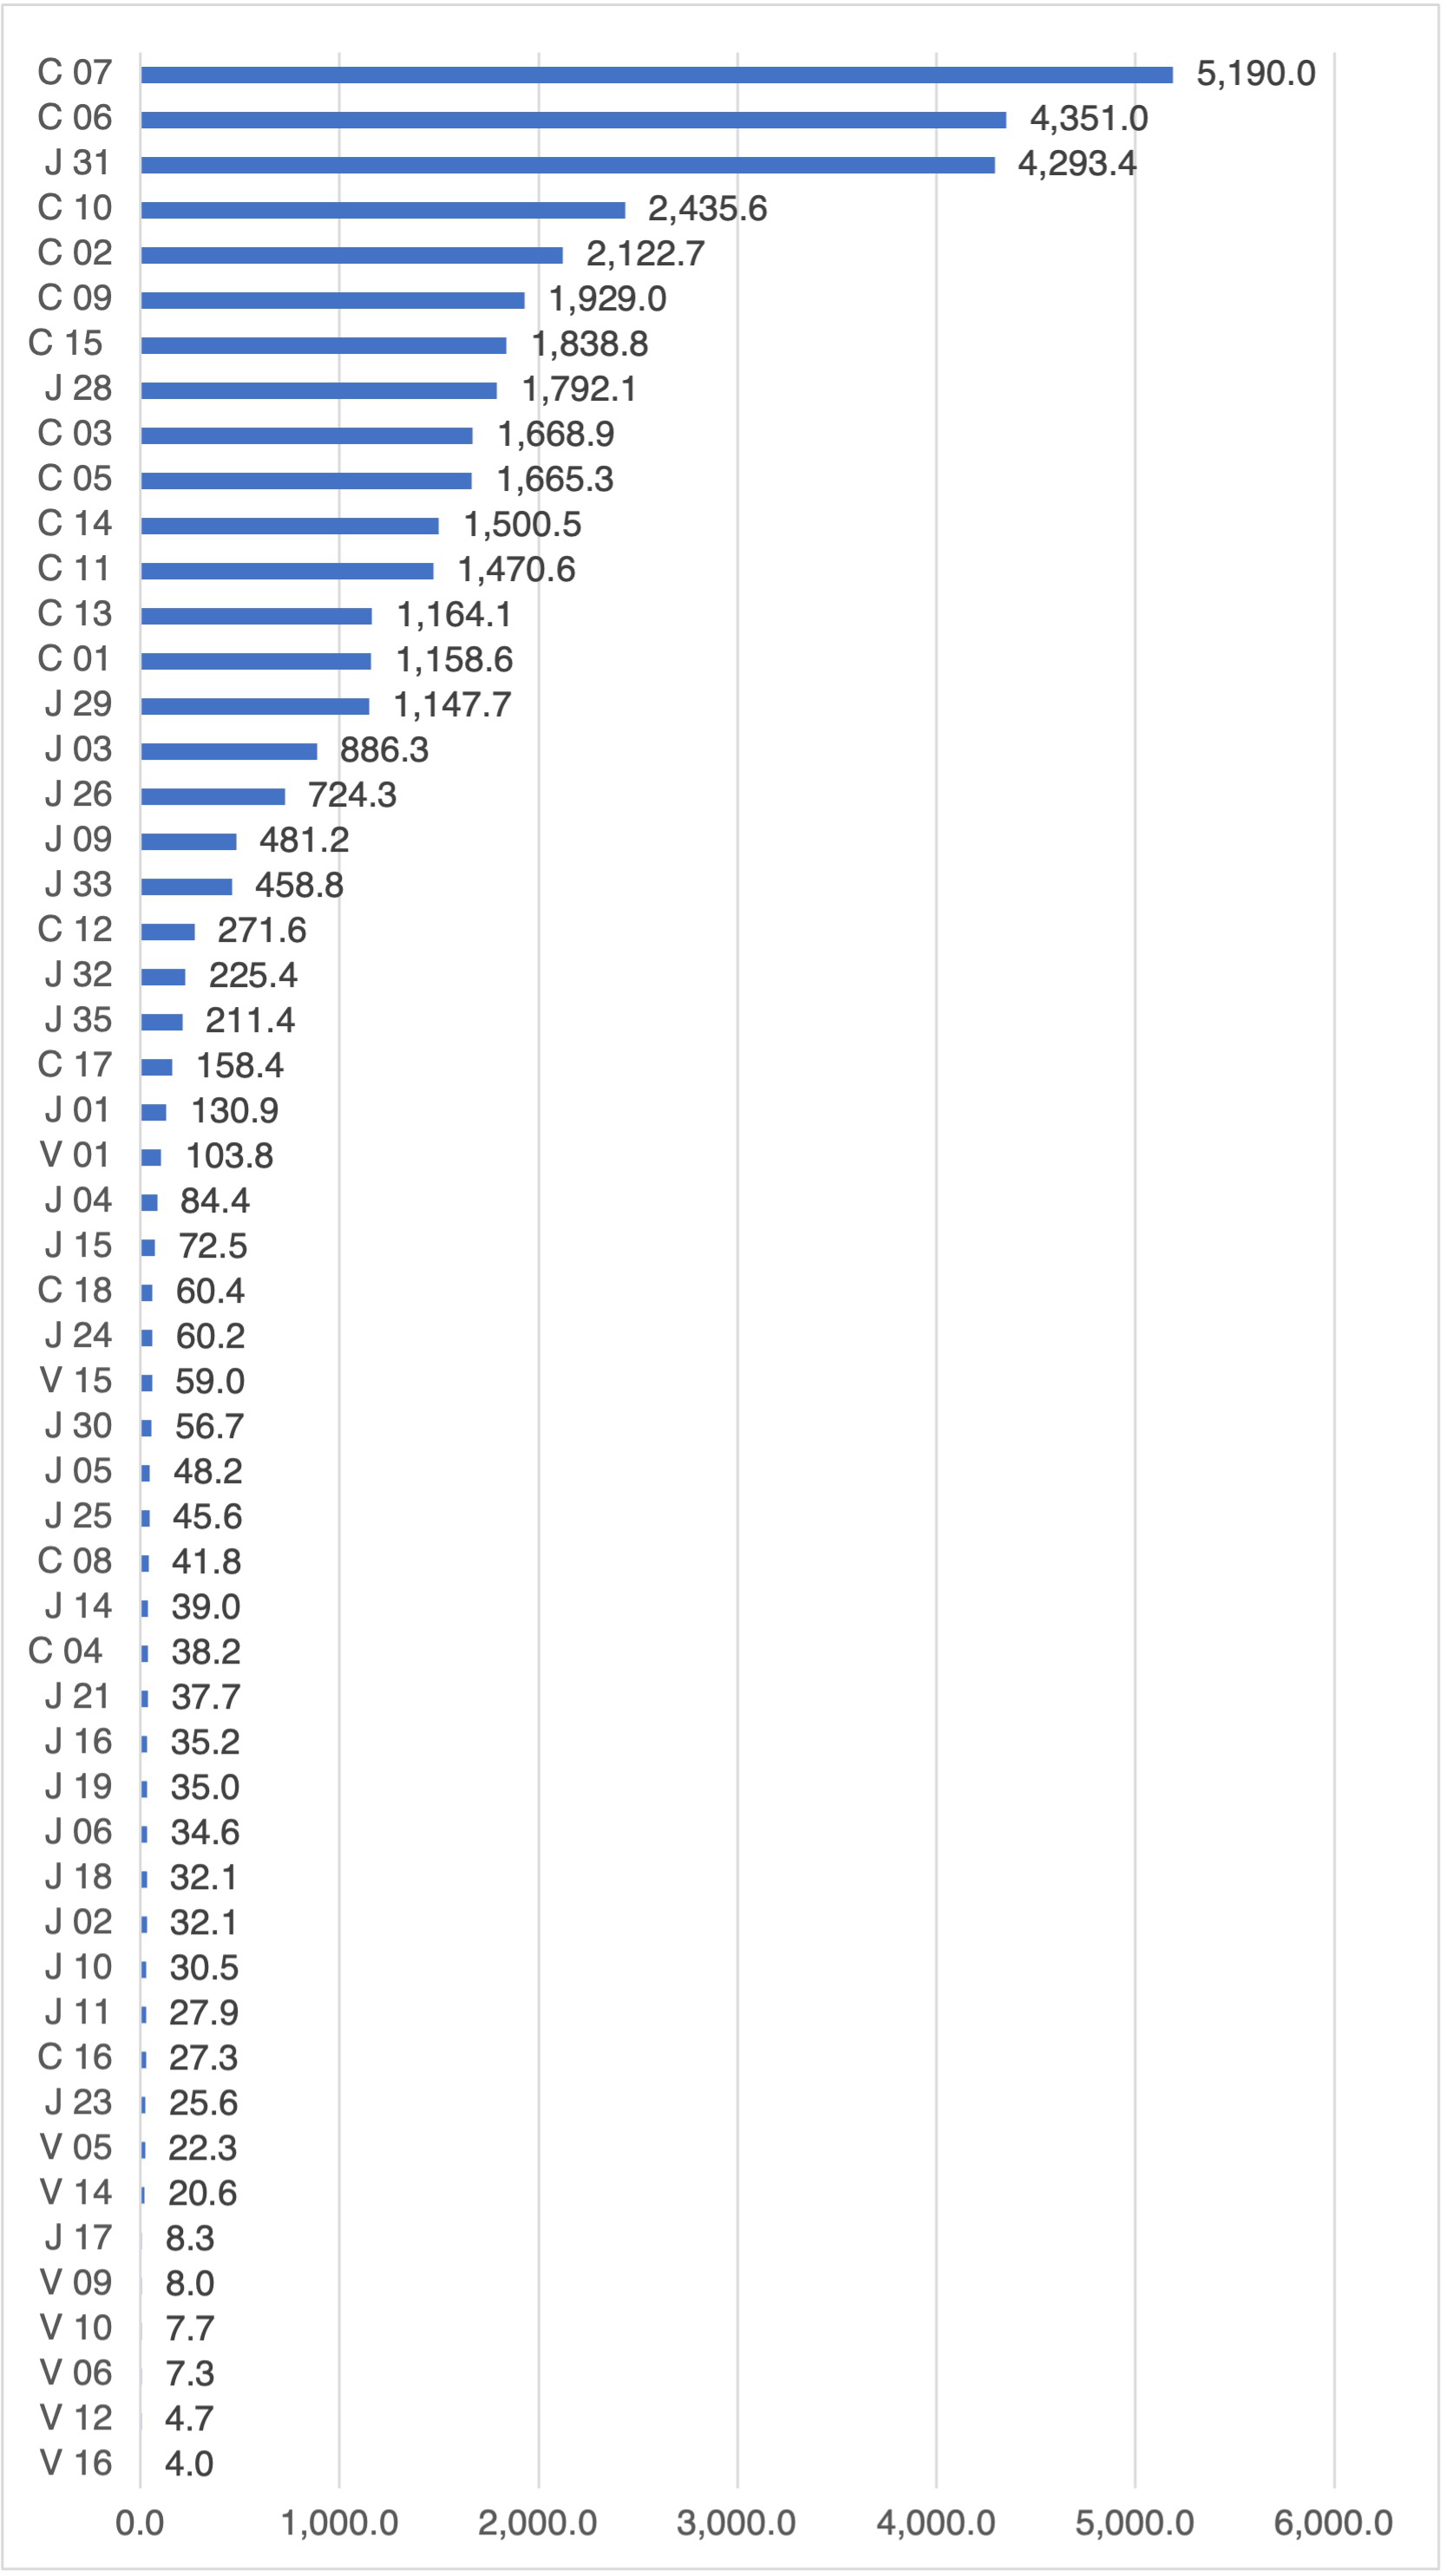 Fig. 4.
Land footprint of repellent EOs in m
The sustainability assessment of repellent usage of EOs, highlighted as best of
the best these from savory (V 16), oregano (V 12), tarhan (V 06), Greek sage (V
10), thyme (V 09) and juniper (J 17) exhibiting a land footprint per application
less than 10 m
On the other hand, another group of EOs that presented land footprint less than
40 m
The fundamental assumption for the larvicidal application unit was defined by
the large-scale interventions, which in municipal level are mostly focussed on
catch-basins treatment. The size of them varies between countries but also in
relation to the drainage system grade; primary catch-basins dimensions escalate
from 0.25 by 0.25 m to 0.5 by 0.7 m. For the purposes of the study as application
unit was selected an intermediate size rectangle catch-basin 0.5 by 0.5 m the
surface of which was calculated to 0.25 m
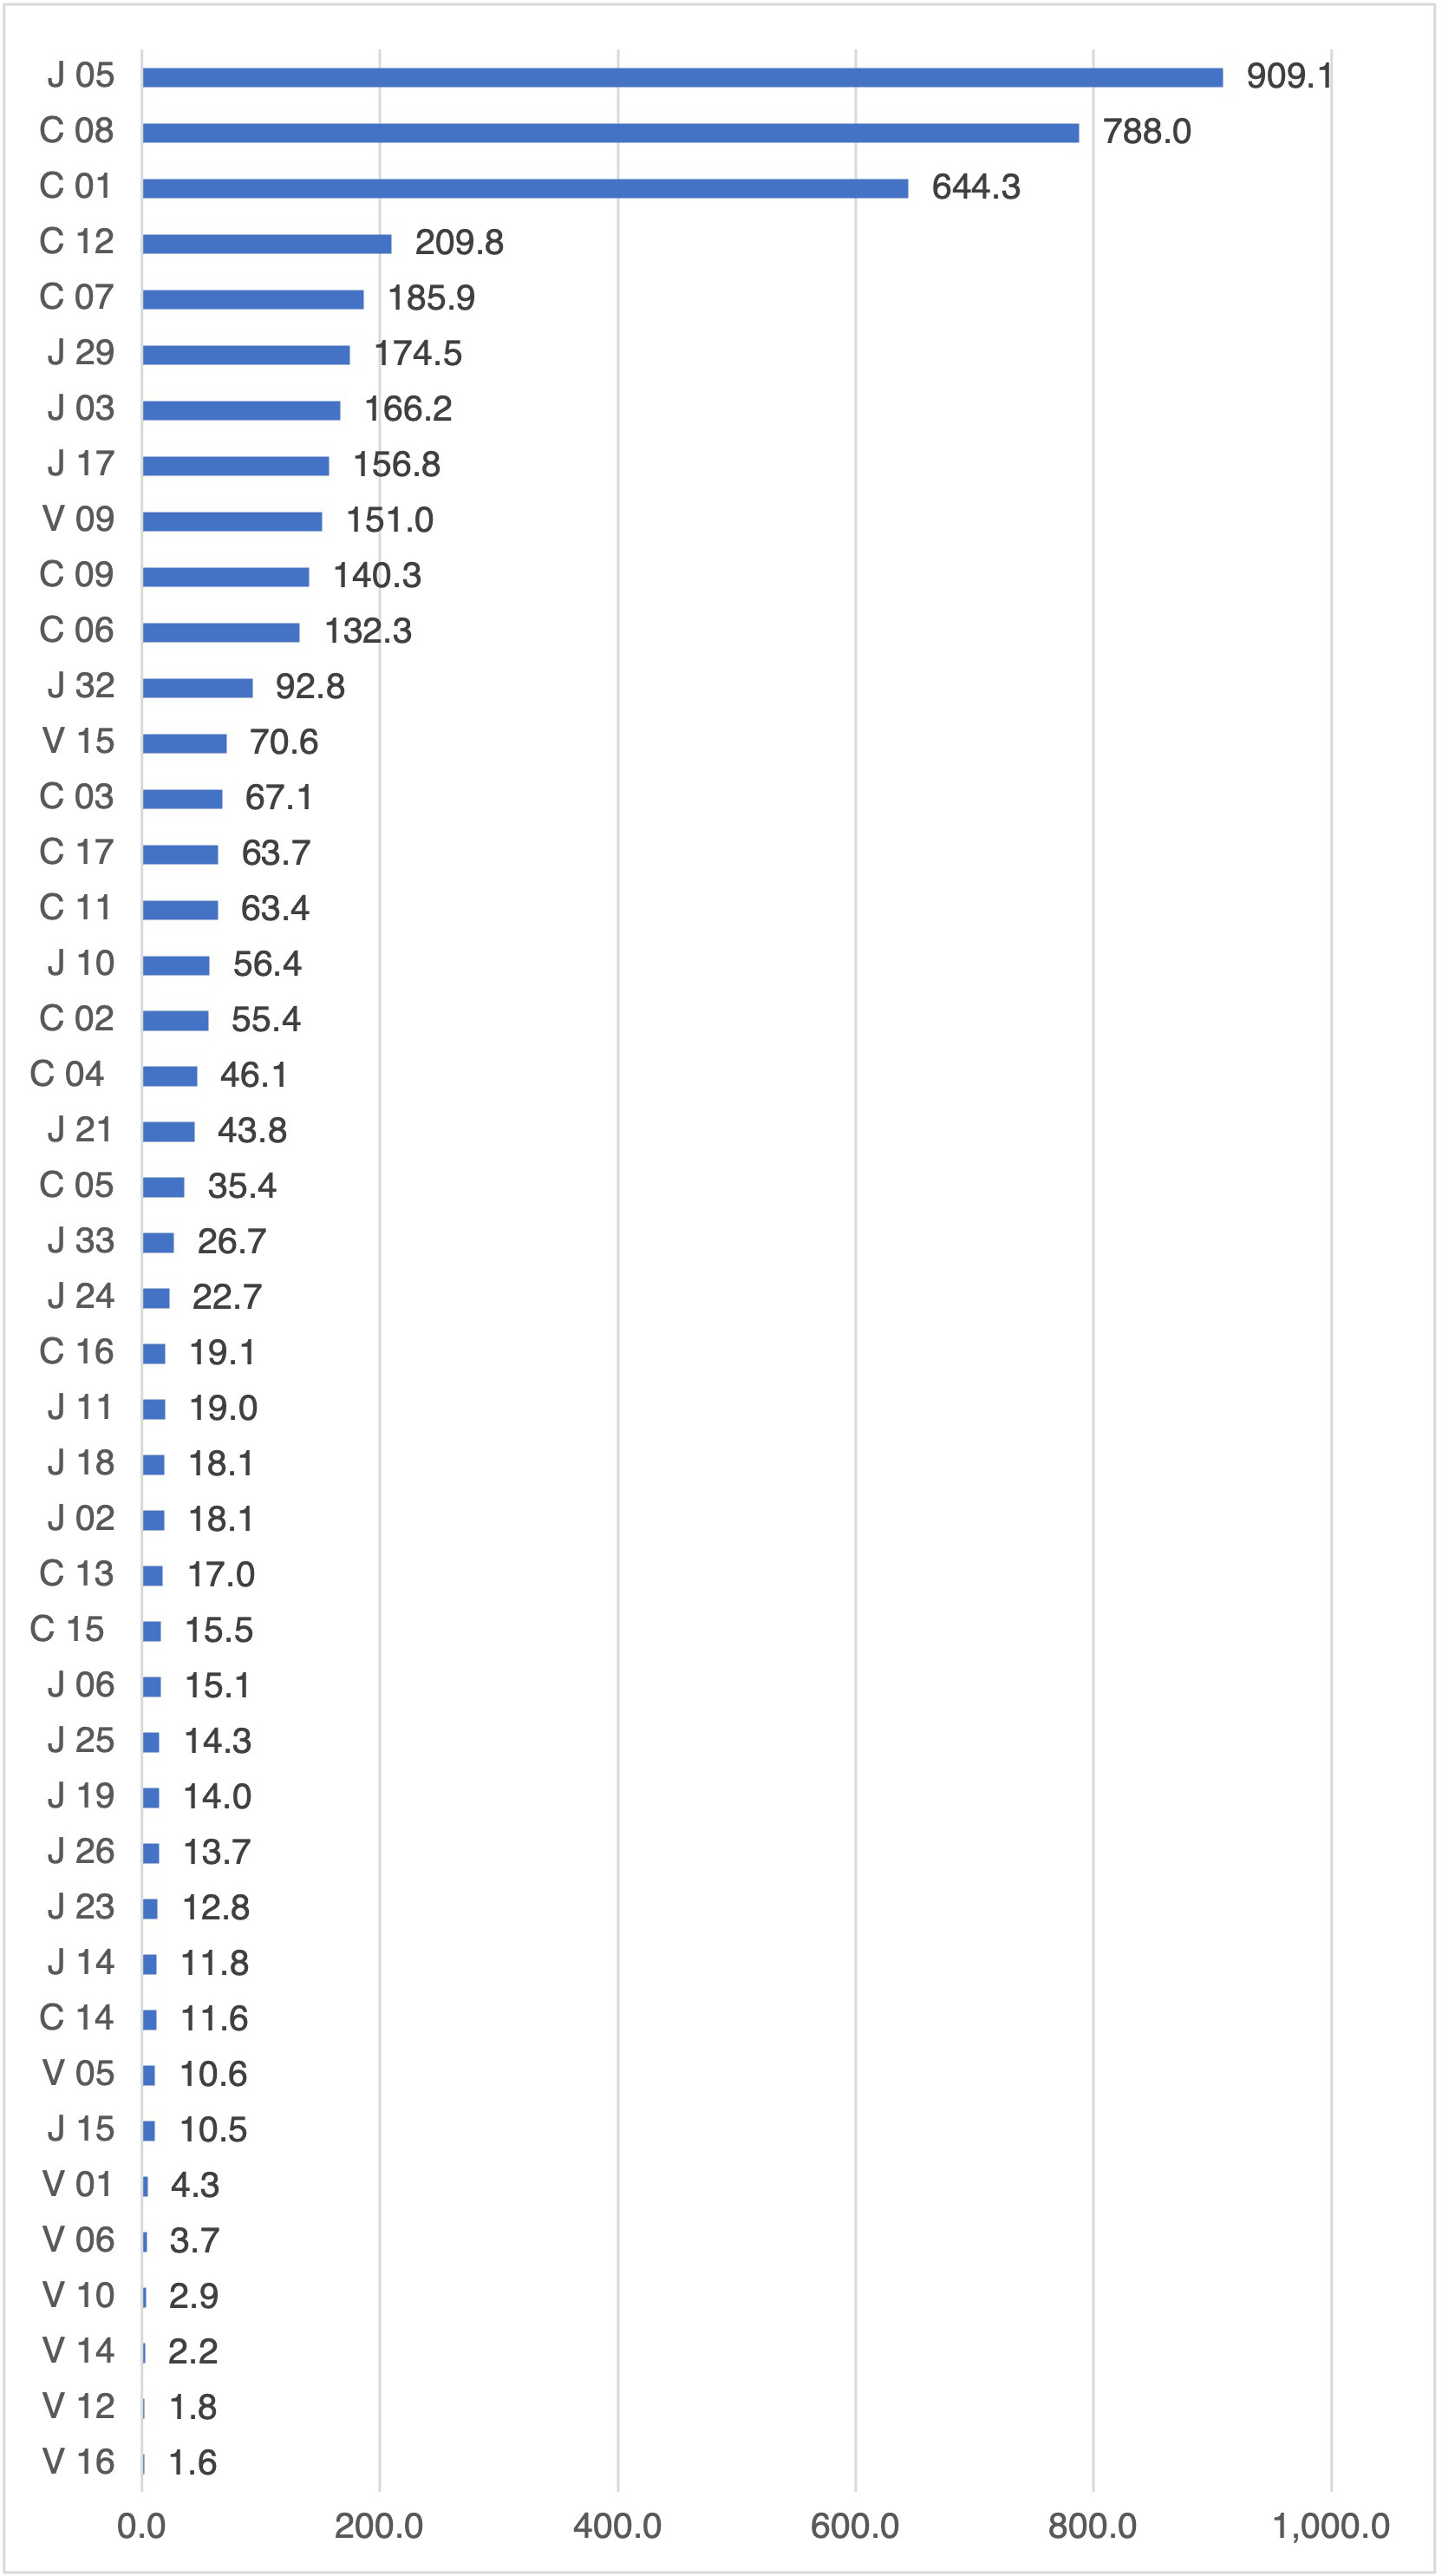 Fig. 5.
Land footprint of larvicidal EOs in m
A first remark on the larvicidal land footprint of the EOs reflects the
comparison in between the two uses considered in the present study, which
indicates larvicidal use as more sustainable than repellent, since in all the EOs
from oregano (V 12), Greek sage (V 10), juniper (J 14) and Syrian juniper (J 24)
that presented LEI and REI value of 1, as more sustainable was proven the
larvicidal use which in oregano presented a larvicidal land footprint of 1.79
m
Another significant difference is observed in the bioactivity coefficient of the
six more sustainable EOs that presented land footprint less than 10 m
The performed ex-ante sustainability assessment results indicated in
this case also potential directions and targets for further research. Beside the
already mentioned EOs as potent active ingredients deserving more focus were
indicated 15 more EOs that presented land footprint less than 20 m
The proposed methodology has been proven able to provide a sustainability assessment of natural product in the form of EOs based on broadly available early experimentation data. This assessment was performed through the respective land footprint calculation, which produced comparable results for both choice and no-choice bioassays. Spatial yield and bioactivity were effectively combined and corrected each other producing a cross-checked sustainability performance figure. Moreover, the initial stage of functional unit selection also serving the operational unit definition manages to increase the adaptability of the proposed methodology in all types of bioprospecting screening. Finally, the cumulative results provided insights on the validity of the initial experimentation design and were proven capable to discriminate on the sustainability of different uses for the same EO. Thus, the proposed methodology maybe proven a valuable tool for the valorisation of numerous broadly available experimental data, enhancing this way the EO market up-take.
The datasets used and/or analyzed during the current study are available from the corresponding author on reasonable request.
EE and SH—designed the research study. EE—performed the research and analyzed the data. SH—provided help, guidance, and advice on method development. All authors contributed to editorial changes in the manuscript. All authors read and approved the final manuscript.
Not applicable.
The funders had no role in study design, data collection and analysis, decision to publish, or preparation of the manuscript. We also thank the project coordinator and colleague Dr. Antonios Michaelakis for sharing the data included in the present study.
This research was funded by EU Environmental Funding Programme Life+ Environment Policy And Governance and Greek National Funds And Emilia-Romagna Regional Funds, grant number LIFE12 ENV/GR/000466.
The authors declare no conflict of interest.
See Table 2.
| Code | Taxon | EO origin | EO Yield (mL/kg) |
|---|---|---|---|
| V 01 | Ruta chalepensis L. | whole plant | 4.71 |
| V 05 | Echinophora tenuifolia ssp. sibthorpiana (Guss.) Tutin | whole plant | 3.13 |
| V 06 | 5.71 | ||
| V 09 | Salvia fruticosa Mill. | aerial parts | 4.46 |
| V 10 | Thymbra capitata (L.) Cav. | aerial parts | 5.33 |
| V 12 | Origanum onites L. | aerial parts | 6.72 |
| V 14 | Foeniculum vulgare Mill. | aerial parts | 5.35 |
| V 15 | Vitex agnus-castus L. | aerial parts | 2.05 |
| V 16 | Satureja thymbra L. | aerial parts | 13.11 |
| J 01 | J. phoenicea L. | leaf | 0.86 |
| J 02 | 1.33 | ||
| J 03 | berry unreap | 3.12 | |
| J 04 | 13.84 | ||
| J 05 | berry reap | 1.05 | |
| J 06 | 15.76 | ||
| J 09 | leaf | 0.92 | |
| J 10 | 1.59 | ||
| J 11 | berry unreap | 4.20 | |
| J 14 | leaf | 1.37 | |
| J 15 | 1.70 | ||
| J 16 | berry unreap | 1.56 | |
| J 17 | 6.61 | ||
| J 18 | J. drupacea Labill | leaf | 1.47 |
| J 19 | 1.36 | ||
| J 21 | berry unreap | 1.84 | |
| J 23 | berry reap | 3.79 | |
| J 24 | leaf | 2.91 | |
| J 25 | 1.30 | ||
| J 26 | 1.38 | ||
| J 28 | berry unreap | 0.80 | |
| J 29 | leaf | 1.71 | |
| J 30 | 0.84 | ||
| J 31 | berry unreap | 0.52 | |
| J 32 | 1.88 | ||
| J 33 | 1.45 | ||
| J 35 | J. excelsa M. Bieb | aerial parts | 2.55 |
| C 01 | C. paradisii MacFab | CPEO | 0.50 |
| C 02 | CPEO Vol. Fr. 1 | 0.42 | |
| C 03 | CPEO Vol. Fr. 2 | 0.40 | |
| C 04 | fruit | 0.56 | |
| C 05 | C. limon (L.) Osbeck | CPEO | 0.70 |
| C 06 | CPEO Vol. Fr. 1 | 0.45 | |
| C 07 | CPEO Vol. Fr. 2 | 0.38 | |
| C 08 | fruit | 1.16 | |
| C 09 | C. reticulata Blanko | CPEO | 0.60 |
| C 10 | CPEO Vol. Fr. 1 | 0.43 | |
| C 11 | CPEO Vol. Fr. 2 | 0.40 | |
| C 12 | fruit | 0.56 | |
| C 13 | C. sinensis (L.) Osbeck | CPEO | 0.70 |
| C 14 | CPEO Vol. Fr. 1 | 0.56 | |
| C 15 | CPEO Vol. Fr. 2 | 0.47 | |
| C 16 | fruit | 0.59 | |
| C 17 | C. japonica Thunb. | fruit | 0.87 |
| C 18 | C. x auarantium L. | fruit | 0.38 |