


Frontiers in Bioscience-Landmark (FBL) is published by IMR Press from Volume 26 Issue 5 (2021). Previous articles were published by another publisher on a subscription basis, and they are hosted by IMR Press on imrpress.com as a courtesy and upon agreement with Frontiers in Bioscience.
 , Heena R. Bhojwani 1, Khushboo V. Begwani 1, Harshank A. Dawne 1, Rajiv P. Gude 2, Sadhana S. Sathaye 3, Divya M. Kanchan 3
1 Department of Pharmaceutical Chemistry, Principal K. M. Kundnani College of Pharmacy, Cuffe-Parade, Mumbai 400 005, Maharashtra, India
2 Gude Lab, Cancer Research Institute, Advanced Centre for Treatment Research and Education in Cancer, Tata Memorial Centre, Kharghar, Navi Mumbai 410 210, Maharashtra, India
3 Department of Pharmaceutical Science and Technology, Institute of Chemical Technology, Matunga, Mumbai - 400019, Maharashtra, India
Abstract
Naturally occurring flavonoids have been shown to possess anticancer activity. We have previously shown that certain synthetic flavonoids also exert significant antiproliferative potential in MOLT-4, MCF-7, and HepG2 cell lines. To this end, we evaluated eight synthetic flavones for their CDK2 binding by molecular docking. Most flavones showed interaction with Leu 83. Based on docking and antiproliferative activity, we chose 3’-nitroflavone and 3’, 5’-dimethoxyflavone for the molecular dynamics (MD) simulation and CDK2 inhibition studies. MD simulation studies confirmed interactions with CDK2 (as observed in docking). Furthermore, the inhibitory activities of CDK2/cyclin A2 enzyme for 3’-nitroflavone and 3’, 5’-dimethoxyflavone were found to be 6.17 and 7.19 μM, respectively. 3’-nitroflavone and 3’, 5’-dimethoxyflavone displayed moderate activity in colony formation assay, wound-scratch assay, and Leighton tube studies. Based on these data, the synthesized flavones might have clinical potential as potential inhibitors of CDK2.
Keywords
- Flavones
- Metastasis
- Melanoma
- CDK2
- Molecular docking
- MD simulation
Flavonoids are naturally occurring polyphenolic compounds consisting of a common phenylbenzopyrone skeleton. Position of the phenyl ring on the benzopyrone skeleton and presence or absence of both C2-C3 double bond as well as the alcoholic hydroxyl group at C3 constitute the structural features which differentiate the flavonoids into various classes such as flavones, flavonols, isoflavones, flavanols, flavanones, and flavanonols (1). Most of these naturally occurring compounds belonging to different classes vary in the number and the positions of the phenolic hydroxyl groups (2).
The naturally occurring flavonoids are reported to possess multiple biological activities (3). The antioxidant, anti-inflammatory and antiproliferative activities of these compounds are explored to a greater extent (4-8). Antioxidant activity of natural flavonoids is extensively studied and is reported to be dependent upon the number and the positions of the phenolic hydroxyl groups (6). No such relationship could be established between the hydroxyl groups of the natural flavonoids and their antiproliferative activity. The phenolic hydroxyl groups are responsible for both reduced bioavailability due to extensive conjugation (6) as well as the microbial degradation in the gut (9). Many synthetic flavonoids, devoid of phenolic hydroxyl groups were synthesized and some of them demonstrated significant antiproliferative activity in the past (10). Natural flavonoids appear to be versatile with reference to the mechanism of their antiproliferative action (11). Multiple studies report flavonoids to cause inhibition of the growth factor receptors (12) and/or multiple downstream signaling pathways (13), inhibition of activation of carcinogens (14) and inhibition of cyclin-dependent kinases (15-17). Flavopiridol, one of the most important synthetic flavonoid was systematically explored for its mechanism of action and was shown to cause inhibition of important cell cycle kinase, cyclin-dependent kinase, including CDK1, CDK2, CDK4, CDK6 and CDK7 (17). Many of the naturally occurring flavonoids are also shown to inhibit CDK2 (16). In addition, some of the flavonoids are also reported to possess antimetastatic activity (18).
We had synthesized some synthetic flavones devoid of phenolic hydroxyl groups in our laboratory. Some of the synthetic compounds had also shown preliminary antiproliferative activity (19). In order to probe further into the mechanism of action of these compounds, we decided to explore these compounds for a possible CDK2 inhibitory activity. We decided to use the computational tools for exploring in-silico CDK2 binding, followed by experimental determination of CDK2 binding. We also decided to explore the antimetastatic potential of representative flavones.
Ligands were drawn using 2D-sketcher of Maestro 11 module of Schrodinger’s suite 2017-1. The ligand preparation using LigPrep was done by converting the structure format from 2D to 3D. The hydrogen atoms were added to ensure an all-atom structure. The probable ionization state was determined at a user-defined pH of 7.4 for ligands. Specified chiralities were retained and no tautomers were generated. Default parameter for amide bonds was selected. The prepared structures were used for the molecular docking studies (20). Molecular docking studies were done using Glide (20) software. The crystal structure of CDK2 (PDB code: 2WXV) complexed with an inhibitor (ligand identifier WXV) was used for docking. Protein preparation wizard was used for protein structure refinement. All the water molecules that did not form any interactions or were not a part of the active site were deleted. Hydrogen atoms were added to the protein which included the protons necessary to define the correct ionization and tautomeric states of the amino acid residues. The protein structure was energy minimized using the impact refinement module. The steric clashes existing in the structures were removed using OPLS 2005 force field. Minimization was terminated at a default RMSD cut off of 0.30 Å. After preparation of the protein, the receptor grid was generated using the receptor grid generation panel (20). The protein structure for CDK2 was included as a workspace entry and its ligand WXV was picked to be excluded from receptor grid generation using the ‘receptor’ tab. Default Van der Waals scaling factor of 1.0 and charge scale factor of 0.25 were used. Glide uses two boxes namely, the enclosing or the outer box and bounding or the inner box for the grid generation. The outer box was generated by taking the centroid of the co-crystallized ligand as the center for this box. Size section of the ‘site’ tab provided options for the size of the enclosing box. The default option of docking ligands similar in size to the co-crystallized ligand was used. The center for the enclosing box acted as the center for bounding box too. The default setting of 10 Å on each side was used for the bounding box. According to these specifications for the center and size the final enclosing box was generated (20, 21). No constraints were used. The docking protocol was validated for CDK2 by removing the inhibitor from their complexes, re-docking and calculating root mean square deviation (RMSD) (20-24). The prepared ligands viz. flavones were docked using the default settings in Glide with the extra-precision method (22).
Molecular dynamics (MD) simulations were performed using Desmond (Schrodinger LLC, NY 2016) (25, 26). The OPLS 2005 force-field was used to model the amino acid interactions in the protein, and the TIP3P method was used for the water model. Equilibration of the system was carried out using the default protocol provided in Desmond (25). The default protocol for equilibration consists of a series of restrained minimizations and molecular dynamics simulations that slowly relax the system without deviating substantially from the initial protein coordinates. The TIP3P water molecules were then added in the orthorhombic dimensions of each water box were 10 Å×10 Å ×10 Å and the system was neutralized using 0.15 M NaCl. The relaxation of the system was achieved by implementing the default protocol of Steepest Descent and the LBFGS algorithms in a combined manner (25). The simulation was performed under the NPT ensemble for 5 ns implementing the Berendsen thermostat and barostat methods. Nose-Hoover thermostat algorithm was used to maintain the temperature at 300K. The 1 atm of pressure was maintained using the Martyna- Tobias-Klein Barostat algorithm. The short-range coulombic interactions were analyzed using a cut-off value of 9.0 Å. The handling of long-range coulombic was done using smooth particle mesh Ewald method. All covalent bonds containing the hydrogen atoms were constrained using SHAKE algorithm, with a tolerance of 10-9 A °. The final production run was carried out for 50 ns, and the trajectory sampling was done at an interval of 1.2 ps. 1000 frames were generated. Three-dimensional structures and trajectories were visually inspected using the Maestro graphical interface (Schrodinger 2016-4). Root mean square deviations (RMSD) and Root mean square fluctuations (RMSF) were calculated for CDK2 and the flavones using initial structures as reference. The simulation interaction diagrams were also generated for analyzing the interactions and contacts throughout the simulation period (25, 26).
The CDK2/CyclinA2 assay involved the use of CDK2/CyclinA2 Kinase Enzyme System Catalog No. V2971 and ADP GloTM Kinase Assay kit Catalog No. V9101 purchased from Promega Corporation. The ADP-Glo Kinase Assay is a luminescent assay that detects the amount of ADP produced in a kinase reaction. The principle of this assay is that ADP generated in the kinase assay is converted to ATP which is then converted to light by Ultra-Glo Luciferase and the light is measured using a luminometer. Firstly, the concentration of kinase to be used was determined by carrying out the assay using 0, 2.5, 5, 10 and 20ng of CDK2/CyclinA and luminescence was observed. A plot of RLU vs log10[Cdk2/CyclinA2], ng was used to identify the concentration of CDK2/CyclinA to be used. This was done by calculating the S/B ratio and 10ng was identified to be suitable.
Further, the assay was done in three steps. First, the kinase reaction was done in presence and absence of the inhibitor. Second, the ADP-Glo reagent was added to terminate the reaction and deplete the remaining ATP. In the third step, Kinase Detection Reagent was added which converts the ADP produced in the kinase reaction to ATP. This newly converted ATP is measured using a luciferase/luciferin reaction. The concentrations used for inhibitors were 1μM, 3μM, and 10 μM.
A stock solution of the drug of concentration 1000μg/ml was prepared by dissolving 2mg of the compound in 20μl of DMSO and making the volume up to 2ml with Dulbecco’s Modified Eagle’s Medium (DMEM) medium. The stock solutions of the drug were filtered by passing through a 0.2μm membrane filter. A series of 7 concentrations (1000μg/ml, 100μg/ml, 10μg/ml, 1μg/ml, 0.1μg/ml, 0.01μg/ml and 0.001μg/ml) in decreasing order was then made by appropriate dilutions of the stock solution (29-32).
The B16F10 melanoma cells were cultured in DMEM supplemented with 10% fetal bovine serum (FBS). The medium was also supplemented with Penicillin (100 μg /ml) and Streptomycin (100μg/ml) to avoid bacterial contamination. After the cells became confluent, the medium was removed and the cell debris and dead cells, if any, were removed by treatment with the trypsin-EDTA solution (0.25% each) for about 5minutes. The cells were then washed with Phosphate Buffer Solution (PBS) (pH 7.2). Fresh DMEM supplemented with 10% fetal bovine serum was added to the cells and they were transferred in a test-tube. A small quantity of the cells was stained by addition of Tryphan blue dye. B16F10 cells were seeded in 96 well plates at a concentration of 4 x 10³ cells/100 μl/well and incubated for 24 h. The seeded cells were then incubated at 37°C in 95% air + 5% carbon dioxide for 24hrs using Thermoscientific incubator. These cells were treated with the compound solutions for 24 h at a concentration range between 0.001 μg/ml-1000μg/ml for the determination of IC50. After the stipulated period of incubation, the cells were washed with PBS (pH 7.2) and 5% solution of MTT dye (in PBS) was added and incubated at 37°C for 4hrs. The plates were then centrifuged at 1500rpm for 20min (Plasto Crafts Rota 4R-V/FM). The MTT solution was aspirated from the wells and 100μl of DMSO was added to each well. The optical density of each well was measured by using an ELISA plate reader (ELX 800, Bio-Tek Instruments Inc.) at 540nm with a reference wavelength of 690nm (29-32). The results obtained were plot using GraphPad Prism v.5.
The compound solutions were prepared as 2 different concentrations, at values of IC30 and IC50. For this, the quantity of the drug required to make the desired concentration was weighed and dissolved in a minimum quantity of DMSO. The desired volume was made with DMEM medium supplemented with 10% FBS, Penicillin (100μg /ml) and Streptomycin (100μg/ml). It was then filtered through a 0.2μm membrane filter. The dilutions for each compound were made as shown in Table 1.
| Desired concentration | Dilution | |
|---|---|---|
| 3’, 5’-dimethoxyflavone | 500 μg/ml | 2.5 mg drug + 5ml of DMEM medium |
| 300 μg/ml | 1.5 mg drug + 5ml of DMEM medium | |
| 3’-nitroflavone | 20 μg/ml | 0.1 mg drug + 5ml of DMEM medium |
| 12 μg/ml | 0.06 mg drug + 5ml of DMEM medium | |
For colony formation assay, 35 mm Petri plates were seeded with 450 cells/ plate and incubated at 37°C in 95% air + 5% carbon dioxide for 24hrs using Thermoscientific incubator. After 24hrs of incubation, the Petri plates were removed from the incubator and the medium was removed. The cells were washed with PBS. The cells were then treated with the prepared drug solutions (2ml/plate) of 2 different concentrations. Fresh medium (2ml/plate) was added to the Petri plate labeled as untreated control (UC). All the plates were again incubated at 37°C in 95% air + 5% carbon dioxide for 24hrs. After 24hrs of incubation, the plates were again removed from the incubator and the drug solutions were aspirated from the plates. The cells were washed with PBS and fresh medium was added to each plate. All the plates were again incubated at 37°C in 95% air + 5% carbon dioxide for 72hrs. At the end of the incubation period of 72 hrs, the medium was removed and the cells were washed with PBS. The cells were fixed by treatment of methanol for 2 minutes and were washed again with PBS. They were then stained by treatment of 1% crystal violet solution for 5minutes. The plates were then washed thoroughly with water and dried. They were viewed under the microscope and photographs of the colonies were taken (29, 33).The results obtained were evaluated with one way ANOVA using GraphPad Prism v.5.
B16F10 cells were seeded at a concentration of 0.3 x10⁶ cells/ml in 35 mm Petri plates and incubated at 37°C in 95% air + 5% carbon dioxide for 24hrs. After 24hrs of incubation, the plates were removed and the medium was discarded. With the help of a sterilized pipette tip, wounds were made in the cells by scratching the Petri plate. The plates were then washed with PBS. It was then replaced by fresh medium (2ml/plate) in the plate labeled untreated control and 0hr. The rest of the plates were filled with the drug solutions of the desired concentration. All the plates were then incubated at 37°C in 95% air + 5% carbon dioxide. The plate labeled as 0hr was immediately fixed by treatment with methanol for 2minutes and kept in the refrigerator. After 24hrs of incubation, the plates were again removed from the incubator and the drug solutions were aspirated from the plates. The cells were washed with PBS and fixed by treatment of methanol for 2minutes. The fixed cells were then stained by using 1% solution of crystal violet in methanol for about 5minutes. The plates were then washed thoroughly with water and dried. The cells were visualized under the microscope for the migration of cells across the wound. Fifteen measurements were recorded for each compound and percent migration for each was calculated considering migration in untreated control as 100% (29, 34, 35).The results obtained were evaluated with one way ANOVA using GraphPad Prism v.5.
B16F10 melanoma cells were seeded at concentration 2 x 10⁴cells/ml and transferred to 35mm Petri plates previously equipped with 2 cover slips per plate. They were incubated at 37°C in 95% air + 5% carbon dioxide for 24hrs in 35 mm Petri plates on cover slips in DMEM medium. After 24hrs of incubation, the plates were removed and the medium was discarded.
The plates were then washed with PBS. It was then replaced by fresh medium (2ml/plate) in the plate labeled untreated control. The rest of the plates were filled with the drug solutions of the desired concentration. All the plates were then incubated at 37°C in 95% air + 5% carbon dioxide for 24hrs. After 24hrs of incubation, the plates were again removed from the incubator and the drug solutions were aspirated from the plates, washed with PBS and fixed by treatment of methanol for 2minutes. The cover slips from each plate were removed and dipped in hematoxylin for about 2 minutes for staining the nucleus, washed with PBS dried and then dipped in Eosin for 2minutes for staining the cytoplasm. The coverslips were then washed with 70% ethanol and dried. They were then dipped in xylene for few seconds to dehydrate the cells and were mounted on the slide using D.P.X. mountant. The cover slips were observed under Zeiss Upright Microscope fitted with Axio Cam MR5 and photographs were taken (29, 36).
The docking studies were performed for the synthetic flavones using the CDK2 structure with PDB id 2WXV (identified as the best from our unpublished results). The study was conducted in two parts where the first part involved the validation of docking protocol and second was the docking of flavones.
The docking protocol was validated by calculating RMSD values between the docked conformation and native conformation. An RMSD value of 0.7685Å for the co-crystallized ligand (WXV) depicted the accuracy of the docking program. In order to further assess the accuracy, the interactions produced on re-docking were checked with that of the interactions observed in native conformation for WXV. Reproduction of the same interactions indicated the accuracy of the docking protocol.
All of the synthesized flavones were subjected to docking in CDK2. The docking results were analyzed with reference to the dock scores as well as the interactions with the receptor. A detailed analysis of the ATP binding site of CDK2 has been done and reported in the literature (37). A number of key regions including hinge region (Glu81, Phe82, and Leu83), a hydrophobic pocket (Ile10, Phe82, Asp86, and Leu134); the relatively small region between the gatekeeper residue (Phe80) and the DFG motif (Asp145) and a solvent accessible region toward Lys89 have been identified (37). Our results indicated that all the synthetic flavones were able to interact with the key hinge region residue, Leu83 via hydrogen bonding interaction. In addition, 3’-nitroflavone was able to interact with Lys33 and Asp145. The other synthetic flavones did not reproduce all of these interactions and produced lower dock scores (Figure 1 and Table 2). Taking into consideration the dock scores, the energies and the biological activities obtained on cell lines (19), we decided to focus our attention on two compounds, viz. 3’-nitroflavone (3’-NF) and 3’, 5’-dimethoxyflavone (3’, 5’-DMF).
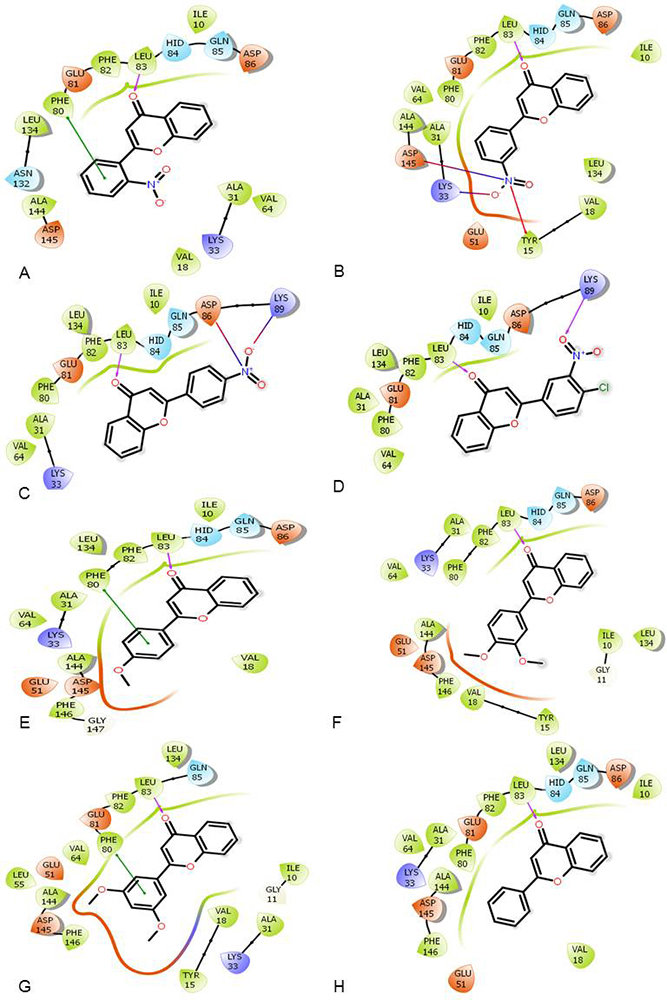 Figure 1
Ligand Interaction Diagram for the 8 docked synthetic flavones in CDK2 (PDB: 2WXV) where (A) 2’-nitroflavone; (B) 3’-nitroflavone; (C) 4’-nitroflavone; (D) 4’-chloro, 3’-nitroflavone; (E) 4’-methoxyflavone; (F) 3’, 4’-dimethoxyflavone; (G) 3’, 5’-dimethoxyflavone; and (H) flavone.
| Synthetic Flavone | Phe |
Leu |
Asp |
Lys |
Lys 89 | Tyr |
Asp |
dock score |
Glide Emodel (kcal/ |
Glide energy |
|---|---|---|---|---|---|---|---|---|---|---|
| 2’-nitroflavone | pi-pi stacking | H-bonding | -7.531 | -52.582 | -36.471 | |||||
| 3’-nitroflavone | H-bonding | salt-bridge | pi-cation | salt-bridge | -8.516 | -54.428 | -38.409 | |||
| 4’-nitroflavone | H-bonding | salt-bridge | salt-bridge | -6.694 | -52.988 | -39.337 | ||||
| 4’-chloro-3’-nitroflavone | H-bonding | H-bonding | -6.785 | -56.817 | -39.348 | |||||
| 3’, 4’-dimethoxy flavone | H-bonding | -8.377 | -55.516 | -34.857 | ||||||
| 3’, 5’-dimethoxy flavone | pi-pi stacking | H-bonding | -7.807 | -51.735 | -36.743 | |||||
| 4’-methoxyflavone | pi-pi stacking | H-bonding | -8.144 | -50.606 | -35.564 | |||||
| flavone | H-bonding | -7.278 | -45.954 | -33.459 |
For further assessment of the stability of the docked complexes, each complex was subjected to MD simulation analysis for 50ns (38, 39). The Root Mean Square Deviation (RMSD) was used to measure the average change in position of the ligand from its docked pose. Backbone and Cα RMSD value was found between 0.8 and 3.2 Å for 3’-nitroflavone and the simulation converged till end around 2.8 Å indicating the complex formed was stable. Likewise, it was observed that the protein backbone and Cα RMSD values fluctuated between 0.8 to 2.2 Å in case of 3’, 5’-dimethoxyflavone and converged to 2.0 Å till the end of the simulation. This indicated a stable complex formation (Figure 2). RMSD of a ligand is calculated when the protein-ligand complex is first aligned on the protein backbone of the reference and then the RMSD of the ligand heavy atoms is measured. The value observed in the case of 3’-nitroflavone was around 2.0 Å and for 3’, 5’-dimethoxyflavone, it was 2.4Å. Values lesser than the RMSD of the protein indicate that the ligand has not diffused away from its initial binding site. Further, the RMSD of a ligand that is aligned and measured just on its reference conformation was also calculated. This RMSD value was found to be around 0.4Å for 3’-nitroflavone and 0.5 Å for 3’, 5’-dimethoxyflavone indicating minimum internal fluctuations (Figure 3).
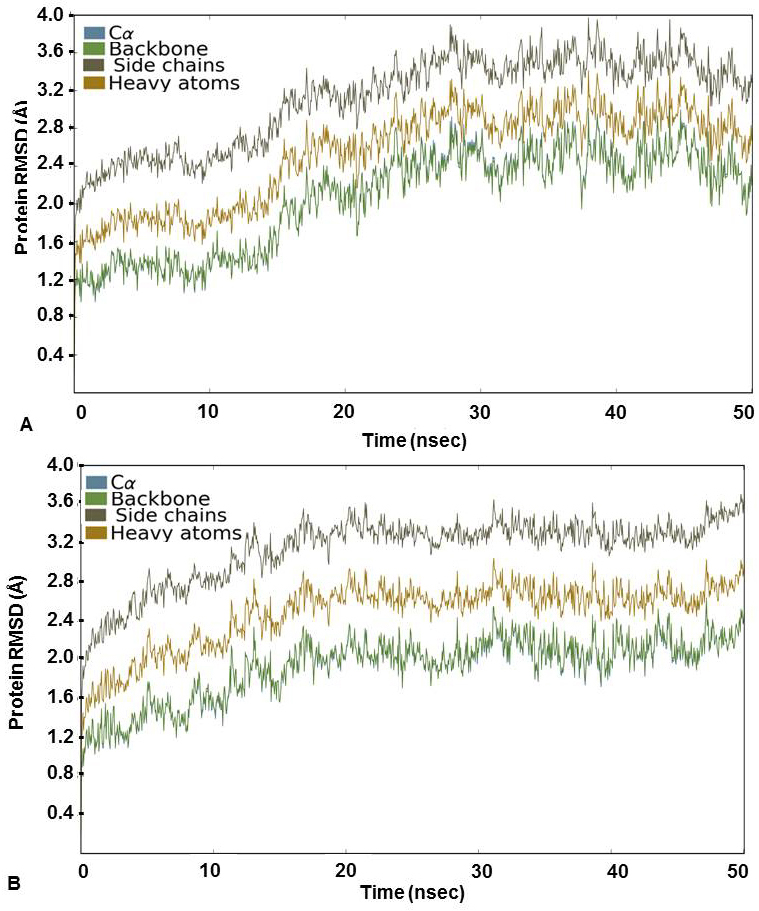 Figure 2
Protein RMSD (Å) for the Cα, Backbone, Side chains and heavy atoms observed during the course of simulation study for CDK2 complexed with (A) 3’-nitroflavone and (B) 3’, 5’-dimethoxyflavone.
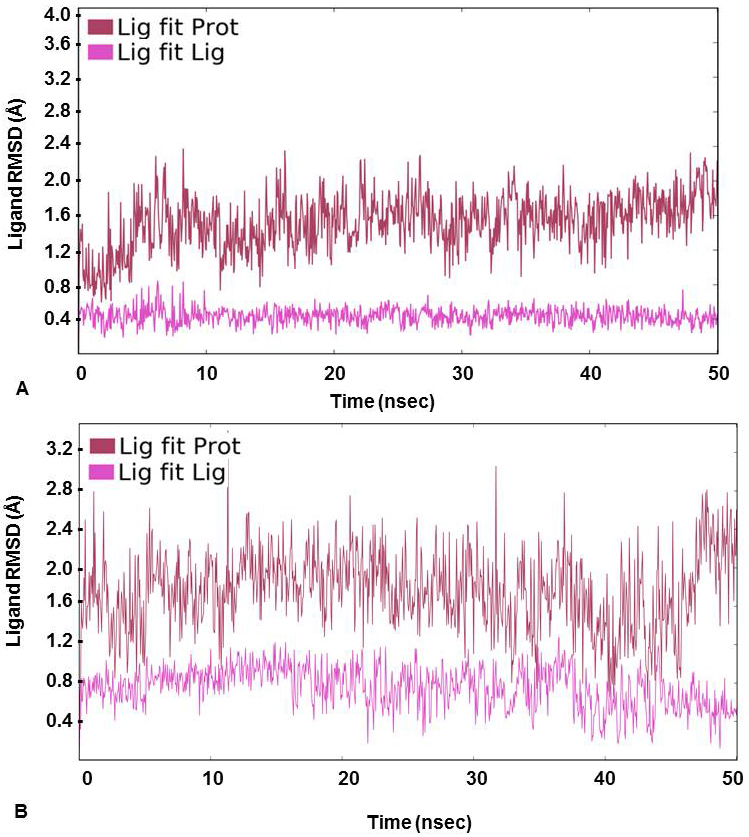 Figure 3
Ligand RMSD (Å) calculated on protein as well as ligand during the course of simulation study for (A) 3’-nitroflavone and (B) 3’, 5’-dimethoxyflavone in complex with CDK2.
Likewise, Root Mean Square Fluctuation (RMSF) was also analyzed for the docked complexes. It indicated a stable complex formation as the higher RMSF values were observed for protein in the loop regions only. The alpha-helical and beta-strand regions were found to have minimum fluctuations and the protein-ligand contact in these regions did not lead to any major fluctuations (Figure 4). It was also evident from the value obtained for ligand RMSF which was less than 2Å that there were no major internal fluctuations in case of both flavones (Figure 5).
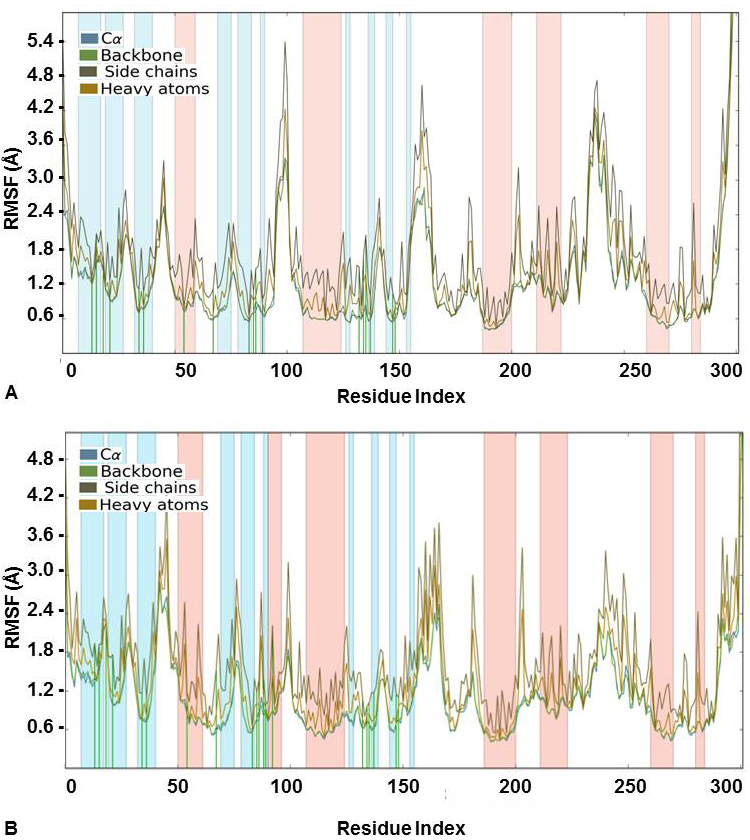 Figure 4
Protein RMSF (Å) for the Cα, Backbone, Side chains and heavy atoms observed during the course of simulation study for CDK2 complexed with (A) 3’-nitroflavone and (B) 3’, 5’-dimethoxyflavone. Green lines indicate contact with the protein residues.
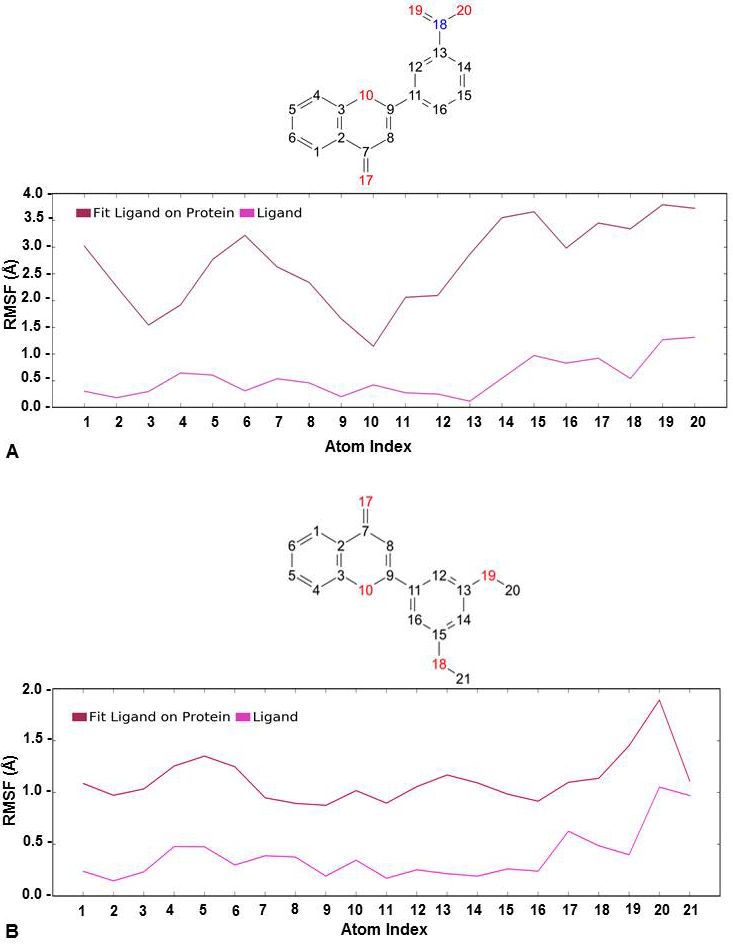 Figure 5
Ligand RMSF (Å) calculated on protein as well as ligand during the course of simulation study for (A) 3’-nitroflavone and (B) 3’, 5’-dimethoxyflavone in complex with CDK2.
Further, protein-ligand interactions were assessed for the 2WXV-3’-nitroflavone complex. Hydrogen bonds, hydrophobic interactions, and ionic interactions were majorly studied. The histogram plot and the protein-ligand contact have been given (Figure 6 and Figure 7). It was observed that for 99% of the simulation time, hydrogen bonding interaction was observed between Leu83 (backbone NH donor) and the carbonyl group of C-Ring of 3’-nitroflavone. Additionally, hydrogen bonding interaction was observed between the side-chain of Lys33 and 3’-nitro group of 3’-nitroflavone. Similar interaction was seen with Asn132. Rare hydrogen bond contacts were observed for His84. The major hydrophobic interaction (other) observed was between Leu134 and 3’-nitroflavone. Hydrophobic interactions such as pi-pi, pi-cation, and other types were observed with Phe80. Some other hydrophobic interactions were also observed between Ile10, Val18, Ala31, Val64, Phe82, as well as Ala144 and the 3’-nitroflavone. For nearly 2% of the total simulation time, pi-cation interaction was observed between Tyr15 and the ligand. The molecular dynamics simulation for the CDK2 and 3’nitroflavone complex indicates that interactions observed in the docked pose were reproduced majorly in the simulation studies. Only one salt-bridge interaction observed with Asp145 was not reproduced significantly. It was observed that no direct interactions were made with this residue and only indirect interactions were produced for a brief period.
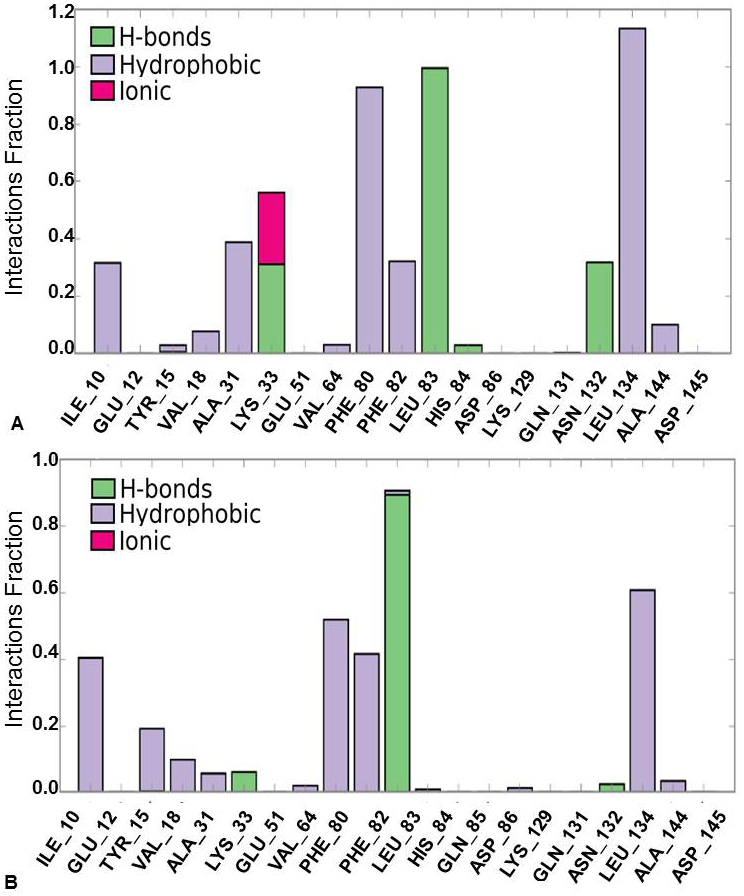 Figure 6
Protein-Ligand Interaction Histogram Plot forCDK2 and (A) 3’-nitroflavone, (B) 3’, 5’-dimethoxyflavone.
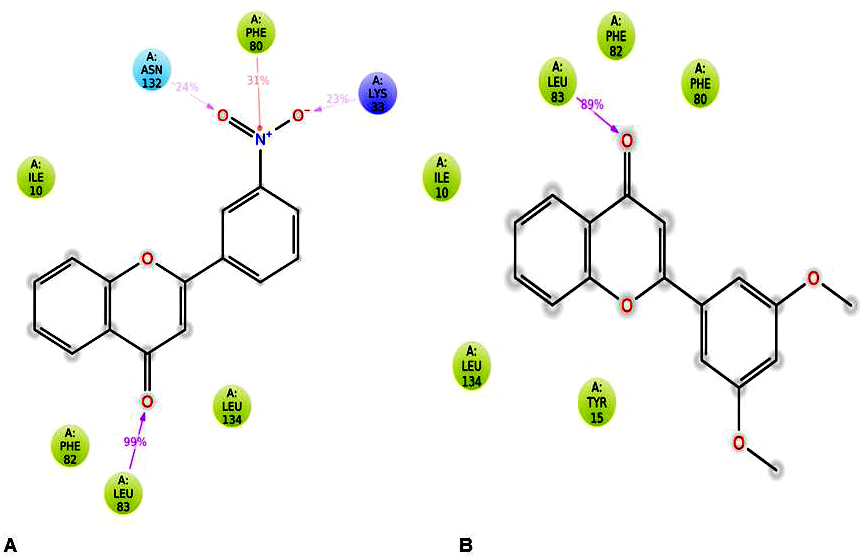 Figure 7
Ligand-Protein Interaction diagram for (A) CDK2-3’-nitroflavone and (B) CDK2-3’, 5’-dimethoxyflavone.
It was observed that for 89% of the simulation time, hydrogen bonding interaction was observed between Leu83 (backbone NH donor) and the carbonyl group of C-Ring of 3’, 5’-dimethoxyflavone as observed in the best pose obtained during docking studies. The major hydrophobic interaction observed was between Leu134 and 3’, 5’-dimethoxyflavone. Some other hydrophobic interactions were also observed between Ile10, Phe80, as well as Leu134 and 3’, 5’-dimethoxyflavone. It is important to note that the hydrophobic interactions of pi-pi stacking type were observed with Phe80 were not reproduced in the simulations. Further, Phe82 was found to be producing hydrophobic contacts for over 40% of the simulation time. Other hydrophobic interactions were observed with Tyr15, Val 18, Ala31, Val64, Lys89, Asn132 and Ala 144 for less than 20% of the simulation time. These studies indicated that the two flavones produce the important interactions with CDK2 on binding.
Furthermore, it was considered important to analyze the timeline representation of the interactions and contacts owing to the difference in the results obtained for the two flavones. In case of 3’-nitroflavone, it was seen that the interactions and contacts made with Leu83 persisted till the end of 50ns. Constant interaction was also observed with Phe80. Some contacts with Ile10, Leu134 and Ala31 were observed throughout the simulation run. Frequent interactions and contacts have been observed with Lys33 and Leu134. Interactions with Tyr15 were observed only in the beginning of simulation run. These persisted for less than 10ns and then later occasional contacts were seen with this residue. All these findings suggest that interactions with Leu83 and Phe80 are important for binding of 3’-nitroflavone to CDK2 and contribute to the stability of the complex.
Similarly, the timeline representation analysis for 3’, 5’-dimethoxyflavone revealed that interactions and contacts made with Le83 were constant for most period of the simulation run which is supported by the histogram plot observed for the same. Constant contacts were observed with Phe80 and Leu134 over the period of 50ns. Frequent contacts were observed with Tyr15. Further, few contacts were seen with Lys33 and Ala31. This timeline data supports the RMSD and RMSF values observed for the CDK2-3’, 5’-dimethoxyflavone complex and which further supports the importance of interaction with Leu83 that is responsible for the overall stability.
The CDK2/cyclin A2 protein kinase assays were performed using the Kinase-Glo Plus luminescence kinase assay kit (Promega). It measures kinase activity by quantifying the amount of ATP remaining in solution after the kinase reaction. The luminescence measured is correlated with the remaining amount of ATP present. This is inversely correlated with the enzyme activity. Likewise, in this study, the percent enzyme activity of the tested compounds against CDK2/cyclin A protein kinase was measured at concentrations of 1, 3, and 10 μM. The reference kinase inhibitor staurosporine was used as positive control (Table 3).
| Compound | log (drug) concentrations | ||
|---|---|---|---|
| 0 | 0.477121 | 1 | |
| 3’, 5’-dimethoxyflavone | 107.0309 | 90.96477 | 33.4765 |
| 3’-ntroflavone | 105.9811 | 68.14603 | 17.76823 |
| Staurosporine | 47.33158 | 20.1543 | 6.140142 |
3’-nitroflavone and 3’, 5’-dimethoxyflavone were evaluated for their inhibitory activity against CDK2/cyclin A2 protein kinase at the aforementioned concentrations. At 1 μM, both the flavones did not lead to any inhibition of the activity. Further, at 3 μM and 10 μM concentration, 3’-nitroflavone produced 68.14 and 17.77 % of enzyme activity. In the case of 3’, 5’-dimethoxyflavone, it was observed that the % enzyme activity was 90.96 and 33.48 at 3 μM and 10 μM, respectively. This has been represented as a plot of % enzyme activity v/s log (drug) concentration (Figure 8). The IC50 values obtained for 3’-nitroflavone and 3’, 5’-dimethoxyflavone were 6.17 and 7.19 μM; respectively. This data corroborates well with the results obtained in the docking and MD simulation studies.
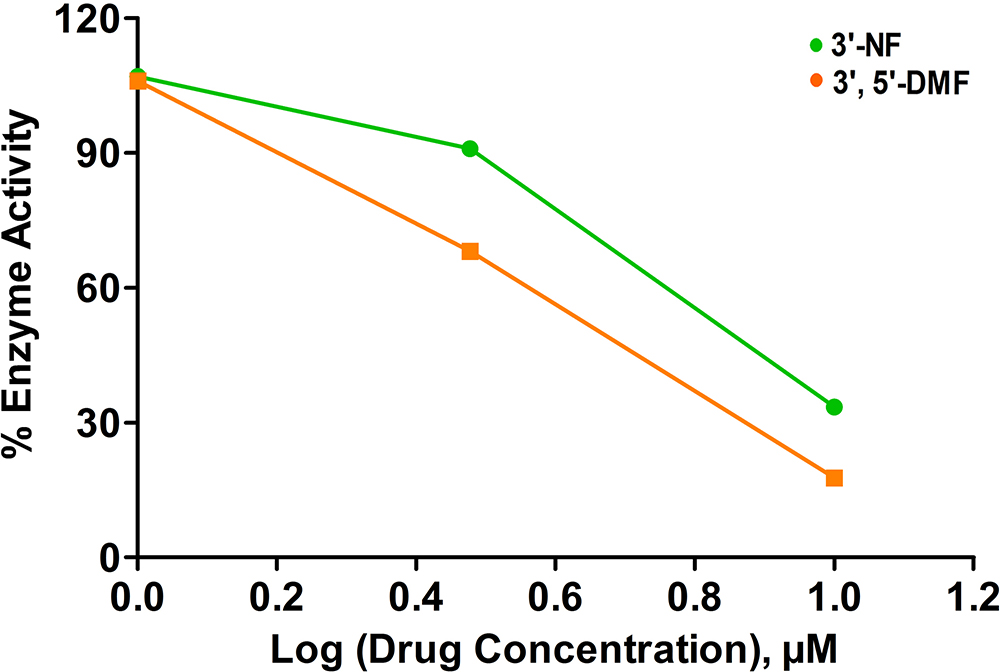 Figure 8
% Enzyme activity measured for CDK2 after assay with different concentrations of 3’-nitroflavone (3’-NF) and 3’, 5’-dimethoxyflavone (3’, 5’-DMF).
Both the compounds which displayed considerable CDK2 inhibitory activity, i.e. 3’-nitroflavone and 3’, 5’-dimethoxyflavone were subjected to antimetastatic studies. The cell line B16F10 is reported to be one of the few cell lines with very high metastatic potential, leading to its selection in the present study. The IC30 and IC50 values for both experimental compounds were determined using MTT assay. Techniques used to study antimetastatic activity included colony formation assay, wound scratch assay and Leighton tube assay (30-32).
The IC50 values of the compounds were calculated by carrying out MTT assay on B16F10 melanoma cell lines (33). The cells were treated with seven different concentrations ranging from 1000μg/ml to 0.001μg/ml. The plot for the MTT assay has been given in Figure 9. The IC50 values were calculated at 24hrs. 3’, 5’-dimethoxyflavone showed an IC50 value of 500μg/ml whereas 3’-nitroflavone showed an IC50 value of 20μg/ml (Table 4). The molar concentrations have also been given in Table 4. Similarly, IC30 values were also calculated. However, this result was not comparable to the result of their CDK2 inhibitory activities.
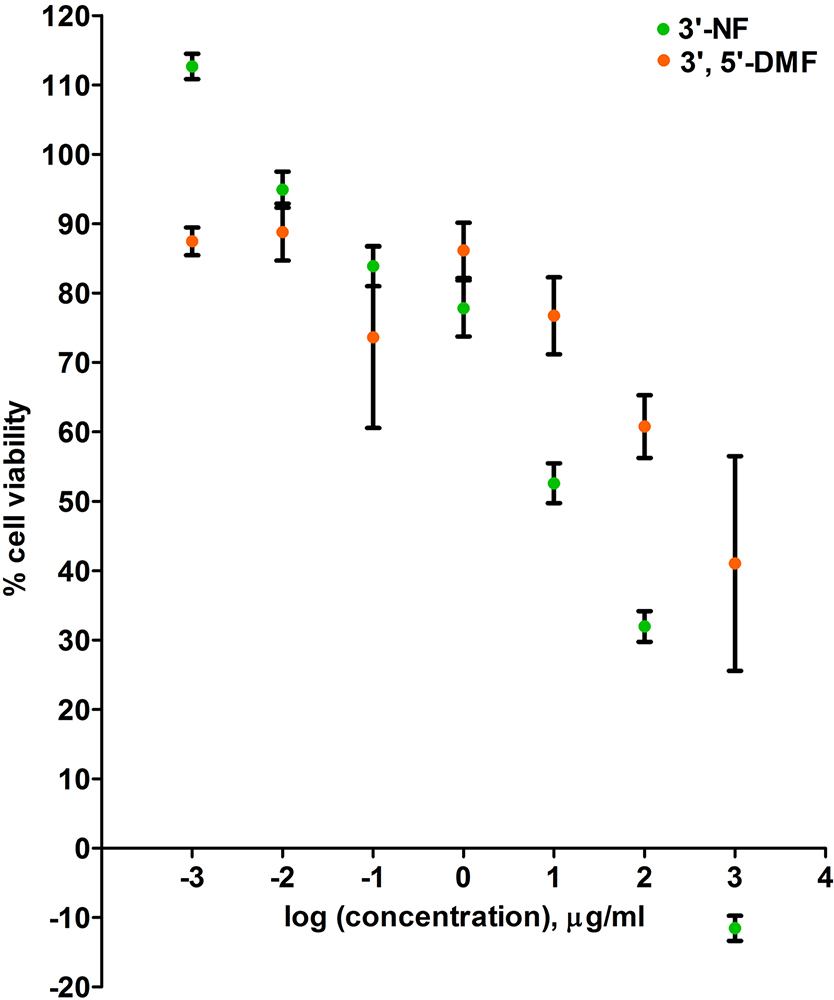 Figure 9
Represents the cytotoxicity data of 3’, 5’-dimethoxyflavone and 3’-nitroflavone against B16F10 cell line. B16F10 cells were treated with seven different concentrations of the test compounds for 24 h; Data is represented as mean ± SEM (n = 6)
| Compounds | IC30 (μg/ml) | IC30 (Molar Concentration) | IC50 (μg/ml) | IC50 (Molar Concentration) |
|---|---|---|---|---|
| 3’, 5’-dimethoxyflavone | 300 | 1.0627 mM | 500 | 1.7712 mM |
| 3’-nitroflavone | 12 | 44.9035 μM | 20 | 74.8391 μM |
Cancerous cells are prone to the formation of colonies from a single cell due to their inherent property of uncontrolled division and proliferation (29, 33). In the present work, colony formation assay was performed at IC30 and IC50 concentrations for the two flavones. A concentration-dependent decrease in the formation of colonies was observed for both as observed from the average number of colonies shown in Figure 10. The decrease in the number of colonies after the treatment of drug as compared to the number of colonies in untreated control indicates the effectiveness of the drug on the survival and proliferation of the cells. These results indicated that 3'-nitroflavone was more effective in reducing the average number of colonies.
Cell migration is an important component of cell invasion and spread of cancer cells through the body (29). The in-vitro analysis of the migration of cells was carried out using wound scratch assay. An increase in the wound distance after treatment with compounds when compared with the wound distance in untreated control indicates the antimetastatic activity of the drug.
It was evident that 3’, 5’-dimethoxyflavone and 3’-nitroflavone resulted in an increase in the wound distance as compared to the untreated control when the cells were treated with them. The wound distances have been shown (Figure 11) and depict the distance on treatment with both compounds in comparison to untreated control. 3’, 5’-dimethoxyflavone was found to be 87.07% and 47.56% migration of cells at a concentration of 300μg/ml and 500μg/ml, respectively (Table 5). Similarly, 3’-nitroflavone allowed 83.32% and 54.52% migration of cells at concentrations of 12 μg/ml and 20μg/ml, respectively (Table 5). The results of this assay clearly depict that 3’-nitroflavone possesses greater antimetastatic potential as compared to 3’, 5’-dimethoxyflavone.
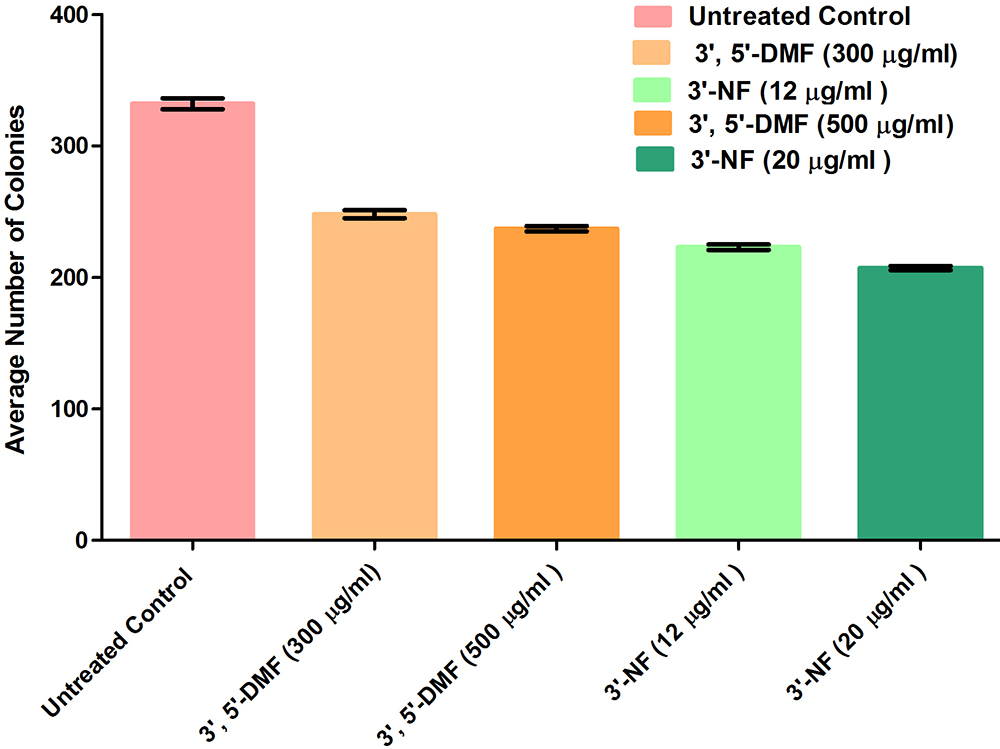 Figure10
Represents the average number of colonies formed in control group and on treatment with 3’, 5’-dimethoxyflavone and 3’-nitroflavone against B16F10 cell line. B16F10 cells were treated with different concentrations of the test compounds for 24 h; Data is represented as mean ± SEM (n = 3). Average number of colonies on treatment with 300 and 500μg/ml of 3’, 5’-dimethoxy flavone was not significant (p>0.05). The decrease in the average number of colonies was significant at p<0.05 for the following: 500μg/ml 3’, 5’-dimethoxyflavone vs 12 μg /ml 3'-nitroflavone as well as 12 μg /ml vs 20 μg /ml 3’-nitroflavone. Lastly, the following groups had significant difference in the average number of colonies at p<0.001: 300μg/ml 3’, 5’-dimethoxy flavone vs 12 μg /ml 3'-nitroflavone, 300 μg /ml 3’, 5’-dimethoxy flavone vs 20 μg /ml 3'-nitroflavone, and 500 μg /ml 3’, 5’-dimethoxy flavone vs 20 μg /ml 3'-nitroflavone.
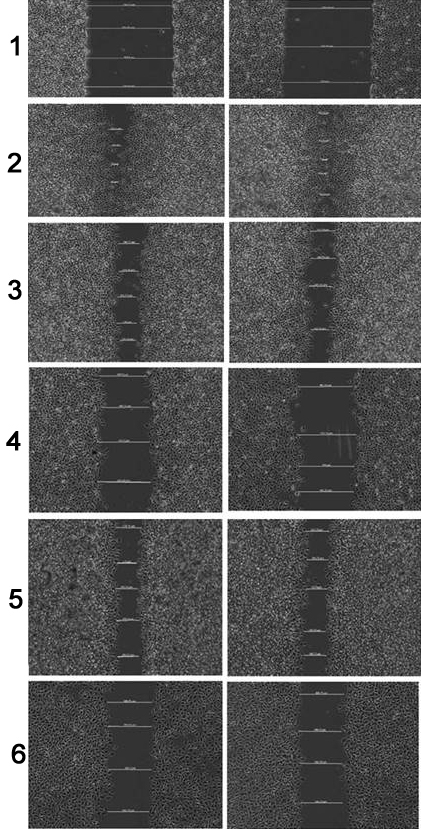 Figure 11
Represents the wound-distance at 0hr, on treatment with UC (untreated control), (A-1) and (A-2) 300 and 500μg/ml of 3’, 5’-dimethoxyflavone; (B-1) and (B-2) 12 and 20μg/ml of 3’-nitroflavone (p<0.05 for B-1 v/s B-2 and p< 0.0001 for all other groups).
| Antimetastatic assay | Parameter evaluated | Concentration of experimental compounds | ||||
|---|---|---|---|---|---|---|
| Untreated Control (nil) | 3’, 5’-dimethoxy |
3’, 5’-dimethoxy |
3’-nitro |
3’-nitro flavone |
||
| Colony formation assay | Average number of colonies | 332 | 248 | 237 | 223 | 207 |
| Wound scratch assay | % Migration | 100 | 87.07 | 47.56 | 83.32 | 54.52 |
Leighton tube assay was carried out for the synthesized flavones to assess their potential to cause changes in the cellular morphology in comparison to each other. The morphology of the cells after staining was observed under the microscope at 10x, 40x and 100x magnifications. It is evident that both compounds caused changes in the cell structure, swelling of cells, spindle formation and consequent cell damage (Figure 12). Additionally, there was a reduction in the population of B16F10 cells in the groups treated with the flavones compared to untreated control. Any deformation in the cell shape after drug treatment indicates an easy passage of the cells through the microcirculation and thus less probability of adhesion to the cells and decreased metastasis (29).
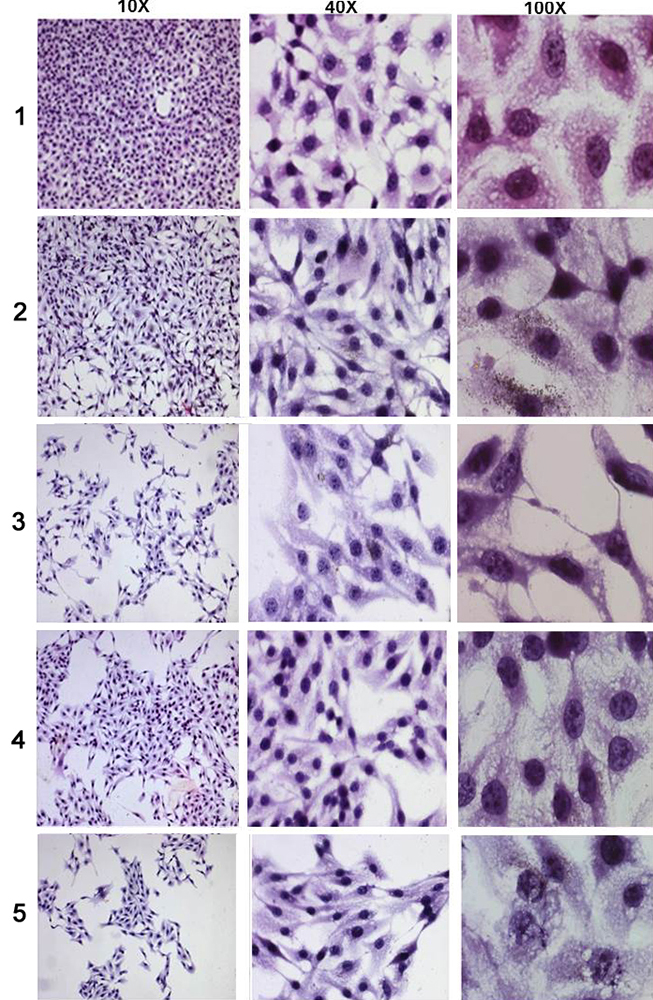 Figure 12
Changes in the B16F10 cellular morphology on treatment with compounds at different concentrations where (1) untreated control, (2) A-1, 300μg/ml of 3’, 5’-dimethoxyflavone, (3) A-2, 500μg/ml of 3’, 5’-dimethoxyflavone, (4) B-1, 12 μg/ml of 3’-nitroflavone, (5) B-2, 20μg/ml of 3’-nitroflavone.
All the results of the antimetastatic activity indicate that 3’-nitroflavone is more potent, producing nearly similar activity as 3’, 5’-dimethoxyflavone at 25 times lower dose. However, both the compounds were able to produce a moderate antimetastatic activity and a good CDK2 inhibitory activity.
In conclusion, two synthetic flavones with some antiproliferative activity against some of the cell lines were studied with respect to their probable mechanism of action. Encouraged by the report of natural flavones like luteolin and some of their synthetic analogs like flavopiridol showing good CDK2 inhibition, we tested these compounds for possible CDK2 inhibitory activity. The in silico studies indicate that the compounds may be good inhibitors of CDK2 and the binding studies confirmed the same with both compounds displaying CDK2 inhibition in micromolar quantities. Both the compounds showed a moderate antimetastatic activity as indicated by the results of the colony formation assay, wound scratch assay and Leighton tube assay. Both the flavones can be explored further with respect to their CDK2 inhibitory activity (Figure 13).
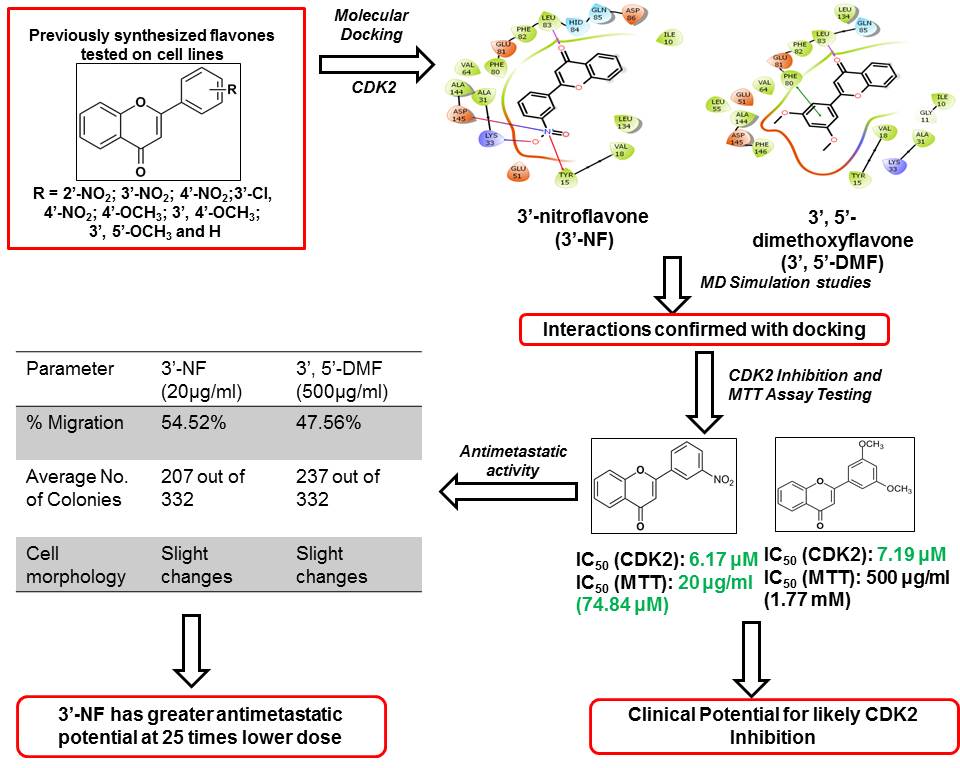 Figure 13
Summary of findings for CDK2 inhibition and antimetastatic effect of flavones.
This work was supported by grants from University Grants Commission (F. No. 41-745/2012 (SR)) and Department of Science and Technology (Letter SR/FST/College-264 dated 18th November, 2015).
CDK1
Cyclin-dependent kinase 1
Cyclin-dependent kinase 2
Cyclin-dependent kinase 4
Cyclin-dependent kinase 6
Cyclin-dependent kinase 7
two dimensional
three dimensional
Grid-based Ligand Docking with Energetics
protein data bank
Optimized Potential for Liquid Simulations
Root mean square deviations
Molecular Dynamics
Root mean square fluctuations
Adenosine diphosphate
Adenosine triphosphate
Dimethyl Sulfoxide
Dulbecco’s Modified Eagle’s Medium
Ethylene diamine tetra-acetic acid
fetal bovine serum
Phosphate buffer solution
3-(4,5-Dimethylthiazol-2-yl)-2,5-Diphenyltetrazolium Bromide.