


 , Wei Liu 1,2,*
1 Experiment Center of Teaching & Learning, Institute of Chinese Materia Medica, Institute of Interdisciplinary Integrative Medicine Research, Shanghai University of Traditional Chinese Medicine, 201203 Shanghai, China
2 Institute of Liver Diseases, Key Laboratory of Liver and Kidney Diseases (Ministry of Education), Shanghai Key Laboratory of Traditional Chinese Clinical Medicine, Shuguang Hospital Affiliated to Shanghai University of Traditional Chinese Medicine, 201203 Shanghai, China
† These authors contributed equally.
Academic Editor: Zhaoguo Liu
Abstract
Background: Liver fibrosis is a dysregulated wound-healing process in
response to diverse liver injuries, and an effective drug therapy is not yet
available. Genistein, which is one of the most active natural flavonoids mainly
derived from soybean products (e.g., Cordyceps sinensis mycelium),
exhibits various biological effects, including hepatoprotective and
anti-inflammatory properties. However, the anti-hepatic fibrosis mechanisms of
genistein are poorly understood. The aim of our research is to explore the effect
and the possible mechanism of genistein against liver fibrosis. Materials
and methods: Cell counting kit-8, EdU, and flow cytometry assays were applied to
evaluate the effects of genistein on cell viability, proliferation, and cell
cycle arrest in human hepatic stellate cell (HSC) line LX2 cells. HSC activation
was induced by transforming growth factor-
Keywords
- Genistein
- Liver fibrosis
- Hepatic stellate cells (HSC)
- Macrophage functional properties
- JAK2/STAT3/SOCS3 signaling pathway
Liver fibrosis, the excessive accumulation of extracellular matrix (ECM)
proteins, is a pivotal structural basis of the pathogenesis in
many chronic liver diseases [1, 2]. If left untreated, progressive fibrosis
eventually develops into cirrhosis, liver failure, and hepatocellular carcinoma
[1, 3]. In recent years, although great progress has been made in understanding
the pathogenesis, effective anti-liver fibrosis drugs have not been developed
[4]. Hepatic stellate cells (HSC), the main cell population of
liver-synthesizing ECM proteins, not only secrete some ECM components including
proteoglycan and glycoprotein, but also synthesize several collagenases to
maintain normal basement membrane structure, which plays an important role during
the development of hepatic fibrosis [4, 5]. In addition to ECM synthesis, the
pathological process of hepatic fibrosis also involves ECM degradation, which is
synergistically regulated by matrix metalloproteinases (MMPs) and tissue
inhibitors of metalloproteinases (TIMPs) [6]. Studies have shown that activated
HSC can increase the synthesis and decrease degradation of ECM, scar tissue from
excessive deposition of ECM gradually distorts the normal parenchymal structure
and impairs its function in this process, and finally leads to the development of
liver fibrosis [7]. Furthermore, inflammation is a hallmark of liver fibrosis.
Many studies have demonstrated that chronic liver inflammation drives hepatic
fibrosis by accelerating liver macrophage infiltration through the secretion of
cytokines and chemokines, such as interleukin-1
The janus kinase/signal transducer and activator of transcription (JAK/STAT) pathway specifically mediates the signal transduction of many cytokines and growth factors from the cell membrane to the nucleus [12]. The activation of JAK2/STAT3 signaling is among the distinctive hallmarks of HSC activation, and it is involved in the development of liver fibrosis [13, 14]. Studies in HSCs shown that the inhibition of JAK2/STAT3 pathway prevents HSC morphological trans-differentiation and downregulates the expression levels of pro-fibrotic genes [15]. The suppressor of cytokine signaling 3 (SOCS3), an inhibitor protein of STAT3 signaling, can inhibit JAK/STAT pathways and thereby exert important actions in liver fibrosis [16, 17]. The expression of SOCS3 gradually increases with the aggravation of liver fibrosis and decreases during the reversal process [16].
Dimethylnitrosamine (DMN), a potent hepatotoxin, can induce liver fibrosis and
cirrhosis. In rats, DMN administration can lead to severe necrosis and ECM
protein deposition in the liver [18, 19]. Thus, in investigating human liver
fibrosis and cirrhosis, the DMN induced liver injury rat model is reproducible
and potentially valuable animal model. Genistein
(4
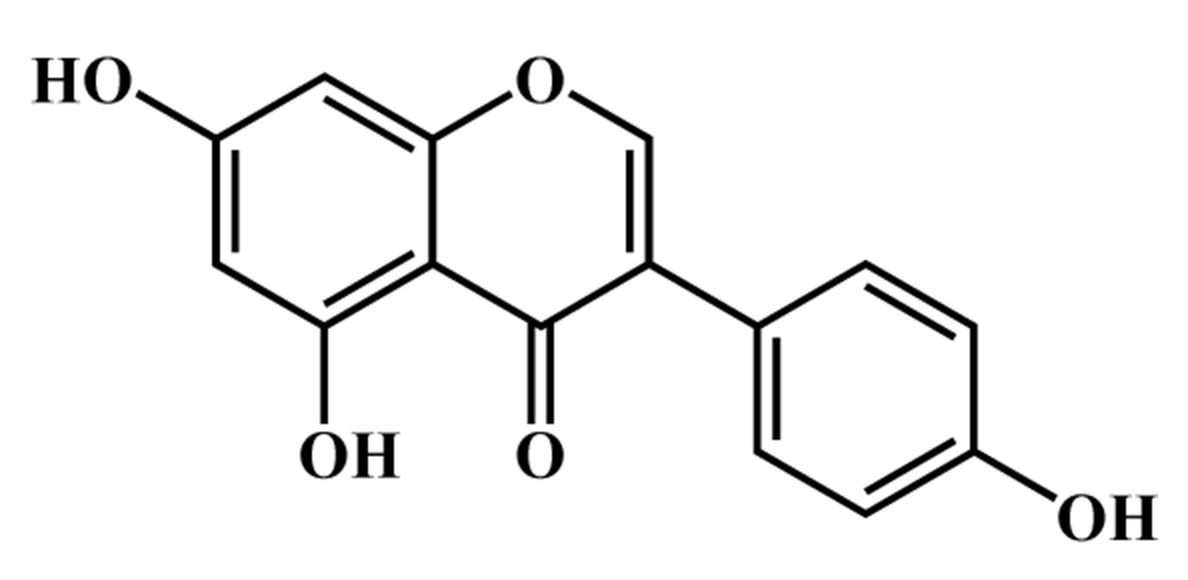 Fig. 1.
Chemical structure of genistein.
Genistein was obtained from Dalian Meilun Biology Technology Co., Ltd. (Dalian,
China). Dimethylnitrosamine was obtained from TCI (Shanghai) Chemical Industry
Development Co., Ltd. Dulbecco’s modified Eagle’s medium (DMEM, high glucose) and
fetal bovine serum (FBS) were obtained from Gibco Life Technology (Gibco
Invitrogen Corporation, Barcelona, Spain). Aspertate aminotransferase (AST),
alanine aminotransferase (ALT), alkaline phosphatase (ALP), and total bile acid
(TBA) test kits, hematoxylin and Eosin (H&E) staining kit, and hydroxyproline
(Hyp) assay kit were obtained from Nanjing Jiancheng Bioengineering Institute
(Nanjing, China). Reverse transcriptase assay kit was purchased from Applied
Biological Materials Inc. (abm, Vancouver, Canada). TRIzol reagent and all primer
were obtained from Shanghai Sangon Biological Engineering Co. Ltd. (Shanghai,
China). SYBR Green Realtime PCR master mix was obtained from Toyobo Co., Ltd.
(Osaka, Japan) Cell counting kit-8 (CCK-8) was obtained from Dojindo Laboratories
Co., Ltd. (Kumamoto, Japan). BeyoClick™ EdU cell proliferation kit
with Alexa Fluor 594 and cell cycle and apoptosis analysis kit were obtained from
Beyotimebiology Co., Ltd. (Shanghai, China). RIPA lysis buffer, proteinase and
phosphatase inhibitor, BCA protein concentration assay kit and
QuickBlock™ blocking buffer for western blot were obtained from
Beyotimebiology Co., Ltd. (Shanghai, China). Antibodies JAK2 (#3230), p-JAK2
(#3771), STAT3 (#9139) and p-STAT3 (#9145) were obtained from Cell Signaling
Technology (Danvers, MA, United States);
Forty male Wistar rats (SPF grade, weight of 140
LX2 cells were seeded in 12-well plates with 5
LX2 cells were cultured at 5
LX2 cells were grown in 12-well plates and were treated with genistein (20, 40
and 80
Briefly, LX2 cells, seeded into the 6-well plate at 1
Serum AST, ALT, ALP and TBA levels, and the content of hepatic Hyp were measured using a matched test kit. In short, the serum samples were thawed at room temperature, and then placed in an automatic analyzer according to the labeling sequence. Subsequently, the corresponding detection reagents were added into the analyzer detection reagent bottle to detect serum AST, ALT, ALP, and TBA levels. Furthermore, hepatic Hyp content was assessed by alkaline hydrolysis method. Approximately 50 mg of liver tissues were weighed and hydrolyzed, and pH was adjusted to 6.0–6.8. The detection steps were performed according to the manufacturer’s instructions.
Formalin-fixed paraffin-embedded tissue samples were cut into 4-
The tissue sections were routinely de-waxed and dehydrated, and underwent
antigen retrieval with mixing 4% sodium citrate buffer. Endogenous peroxidase
activity and non-specific antigens were blocked with methanol containing 3%
H
An 8
The proteins from the liver tissues and LX2 cells were extracted using RIPA
lysis buffer. Simply, LX2 cells and liver tissues were lysed with RIPA lysis
buffer containing phosphatase and protease inhibitor, and lysed tissues and cells
were centrifuged at 12,000 rpm for 20 min. The protein concentration was measured
using the BCA protein assay kit. And then, the samples, SDS-PAGE protein loading
buffer (5
Total RNA from rat hepatic tissues and LX2 cells was extracted using TRIzol
reagent. Briefly, liver tissues and LX2 cells were lysed using TRIzol reagents.
Afterward, chloroform, isopropanol, 75% ethanol, and anhydrous ethanol were
added to the solutions of homogenized tissues and lysed cells, and then
centrifuged at 12,000 rpm 4
| Gene | Forward primer (5′-3′) | Reverse primer (5′-3′) |
| Human | ||
| CTATGCCTCTGGACGCACAACT | CAGATCCAGACGCATGATGGCA | |
| Col1A1 | GATTCCCTGGACCTAAAGGTGC | AGCCTCTCCATCTTTGCCAGCA |
| GAPDH | GTCTCCTCTGACTTCAACAGCG | ACCACCCTGTTGCTGTAGCCAA |
| Rat | ||
| AAGTATCCGATAGAACACG | TAGATAGGCACGTTGTGAG | |
| Col1A1 | ACAGACCAACAACCCAAACTC | ACTTATACCCACATAGGTCTTCAAG |
| MMP1 | GGAAGGTGATATTGTGTTCGCC | CTATGGTCTCCTCTGTAGAAGGC |
| MMP9 | CACTGTAACTGGGGGCAACT | CACTTCTTGTCAGCGTCGAA |
| TIMP1 | TGGCATCCTCTTGTTGCTATC | ACAGCGTCGAATCCTTTGAG |
| IL-6 | AGCCAGAGCTGTGCAGATGA | GCAGGCTGGCATTTGTGGTT |
| TNF- |
CCCCAAAGGGATGAGAAGTT | CACTTGGTGGTTTGCTACGA |
| IL-1 |
GGATGAGGACATGAGCACCT | AGCTCATATGGGTCCGACAG |
| MCP-1 | AGCATCCACGTGCTGTCTC | GATCATCTTGCCAGTGAATGAG |
| GAPDH | CCATCAACGACCCCTTCATT | GACCAGCTTCCCATTCTCAG |
Data are expressed as mean
Genistein was used in HSC line LX2 cells to evaluate the effect of genistein on
cell growth by CCK8 assay, EdU staining, cell cycle analysis. First, the cell
viability was evaluated by CCK8 assay, compared with the control group, cell
viability was not significantly inhibited within 150
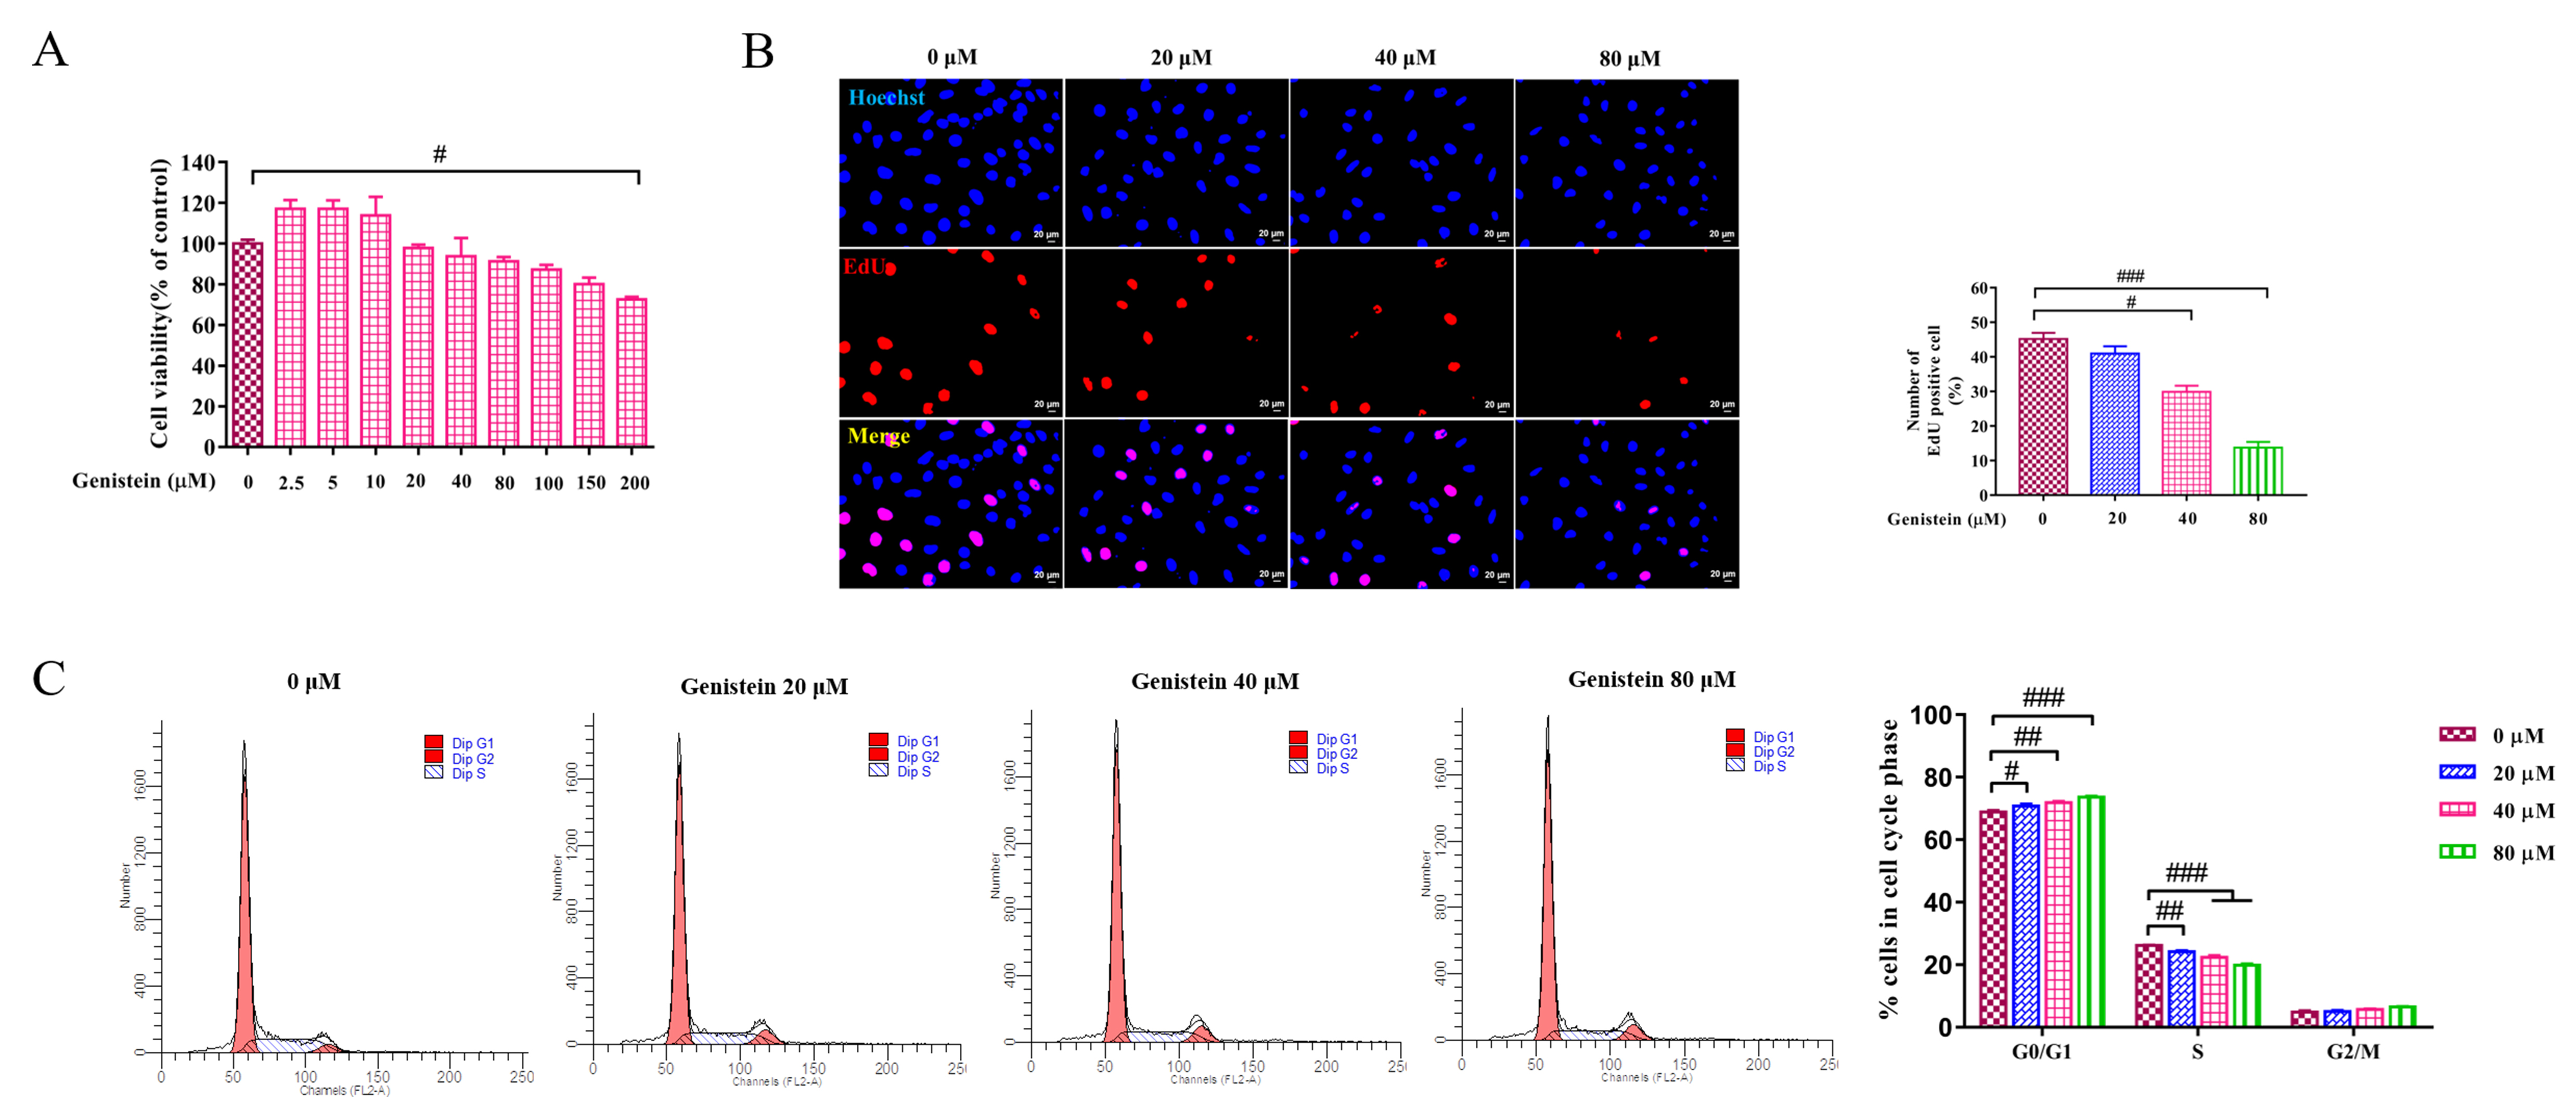 Fig. 2.
The effects of genistein on cell viability, proliferating and
cell cycle. (A) CCK8 test was used to evaluate the effect of different
concentrations of genistein on cell viability at 24 h in LX2 cells was detected
by. (B) EdU assay was performed to detected the effect of genistein (20, 40 and
80
HSC activation is a key event in the occurrence and development of liver
fibrosis. Thus, its activation is usually evaluated in the study of fibrosis. In
this work, the expressions of
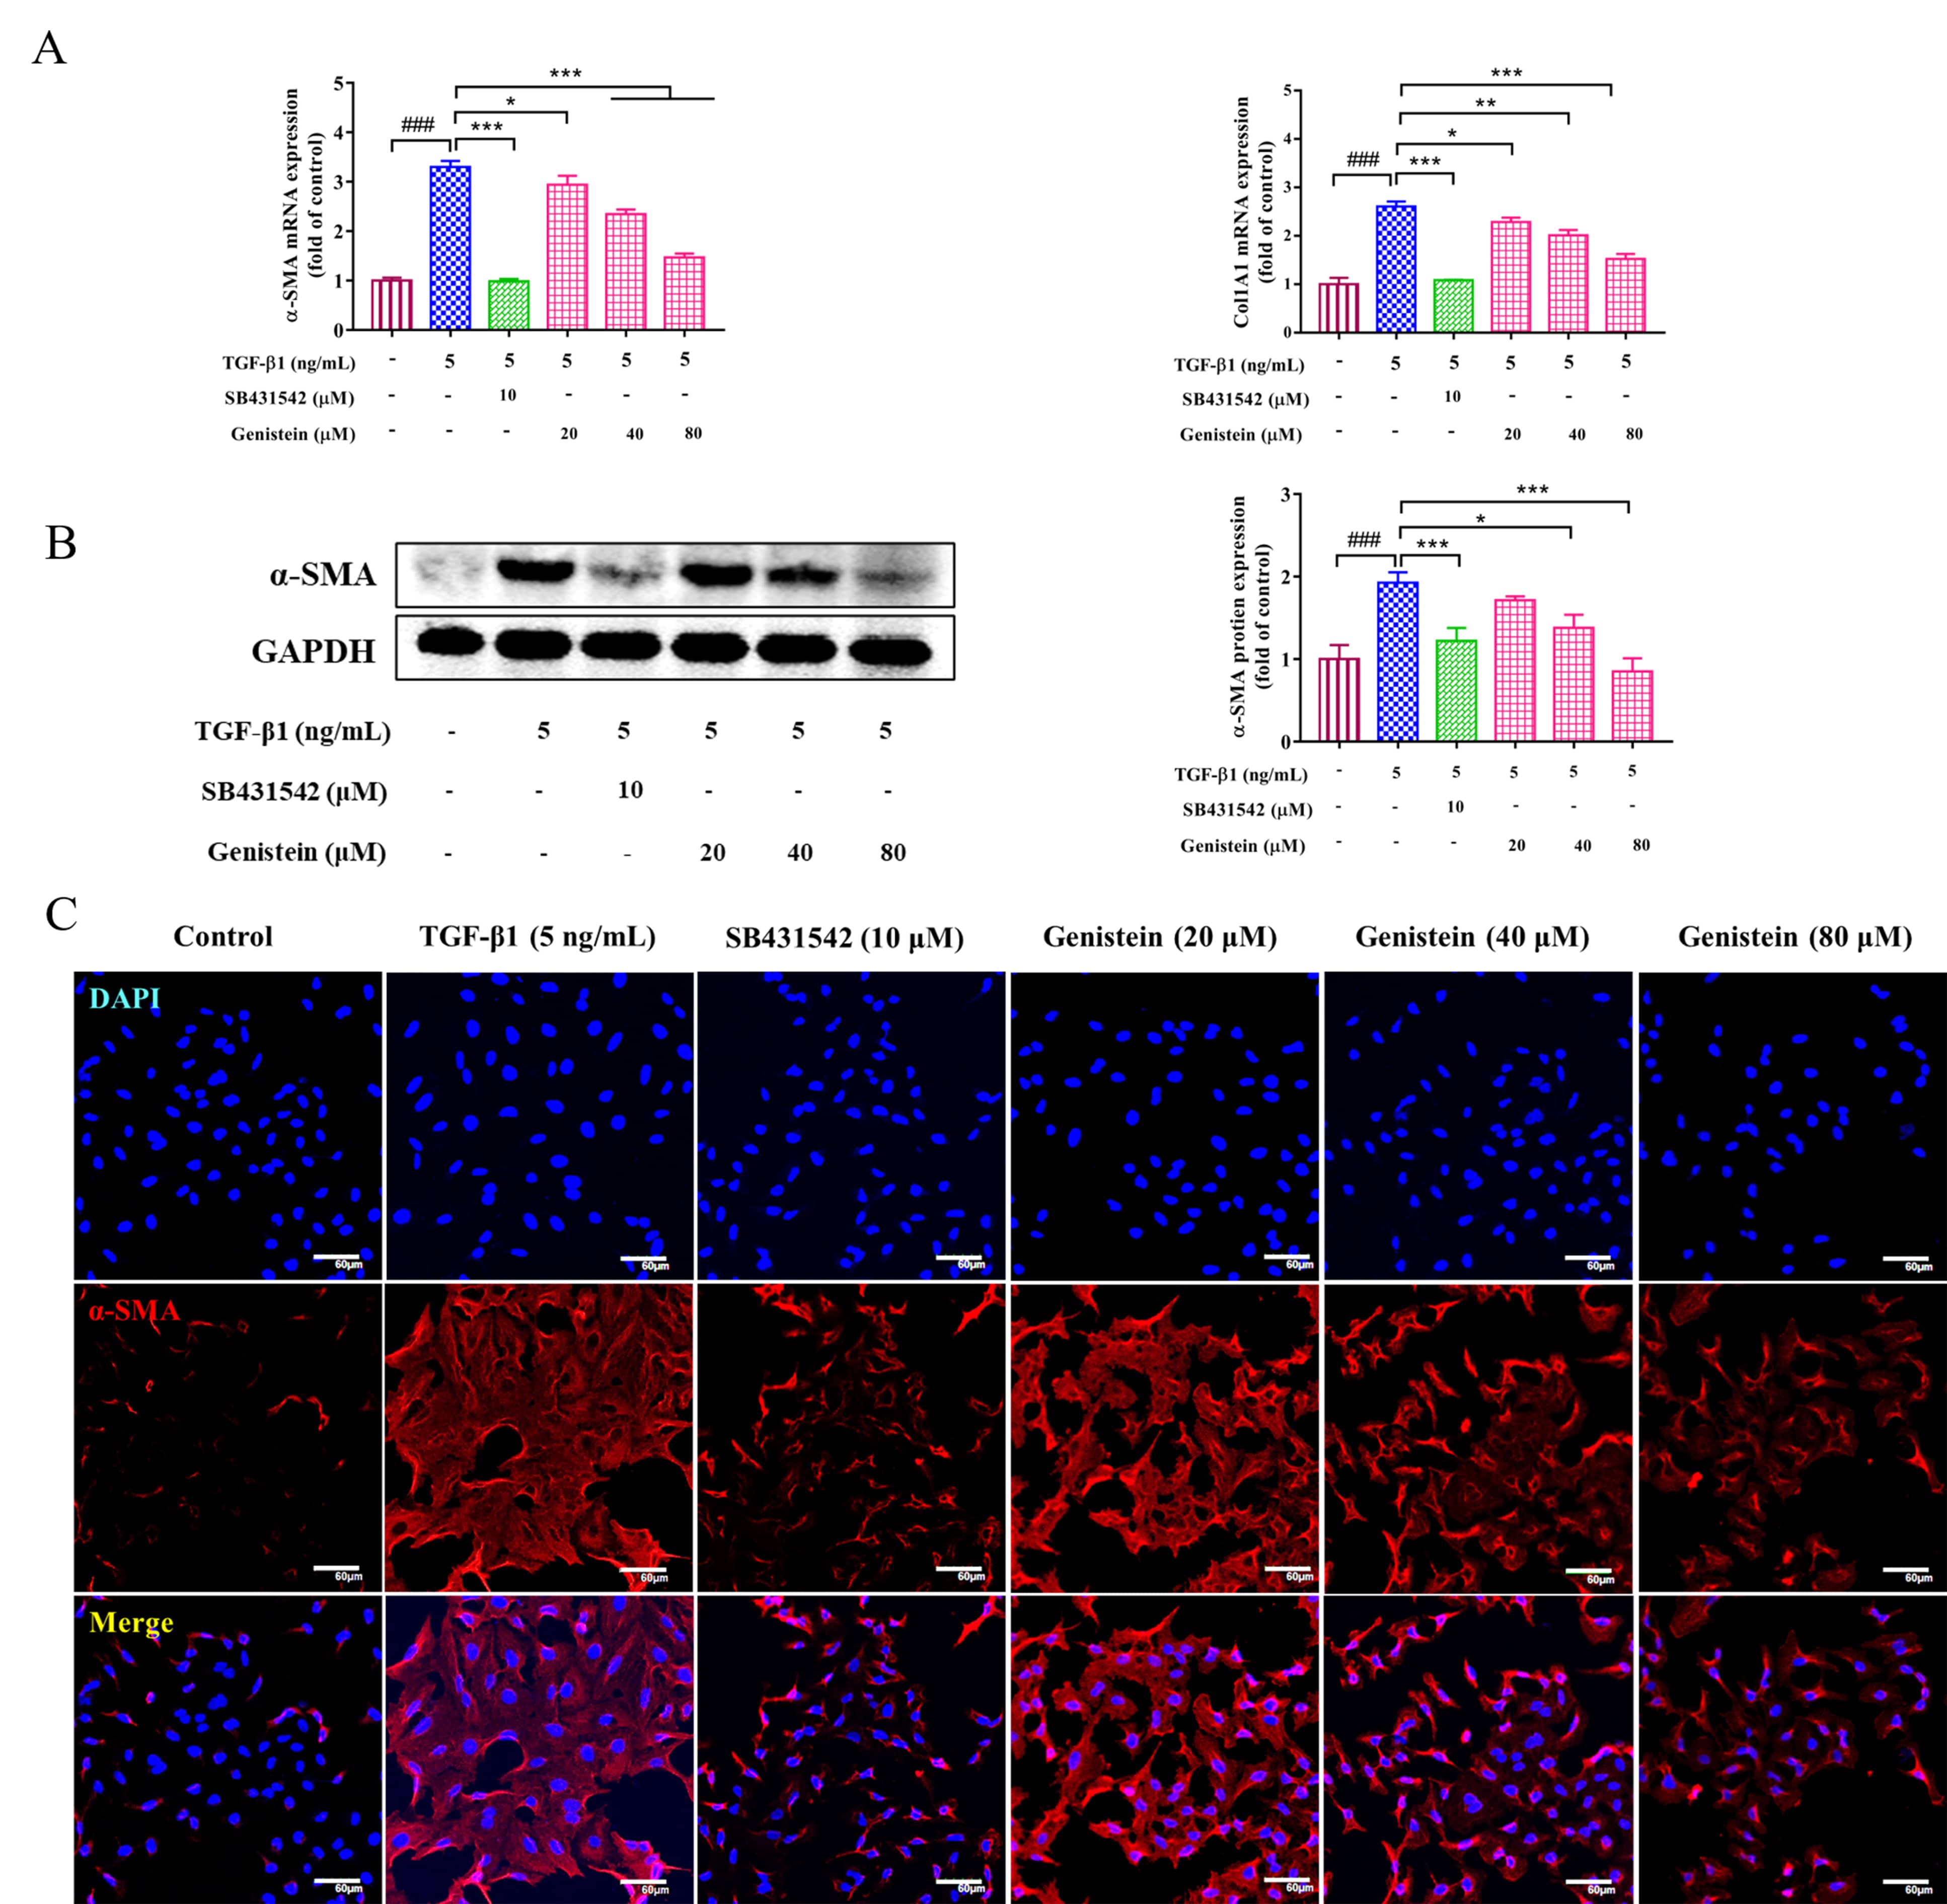 Fig. 3.
The effects of genistein on the expressions of
Liver pathological histology was determined in rats by H&E staining. As shown
in Fig. 4A, the structure of hepatic lobular was severely collapsed and
formed more complete pseudo-lobules, an abundance of inflammatory cells
infiltrated in the portal tract area, the central vein area, and the hepatic
sinusoid in DMN rats compared with the control rats. However, compared with the
DMN rats, these changes of liver histopathology in genistein-treated rats were
significantly improved. Serum biochemistry indices: AST, ALT, ALP, and TBA
levels, were also detected. As shown in Fig. 4C, the serum levels of AST, ALT,
ALP, and TBA were increased significantly by administration with DMN (p
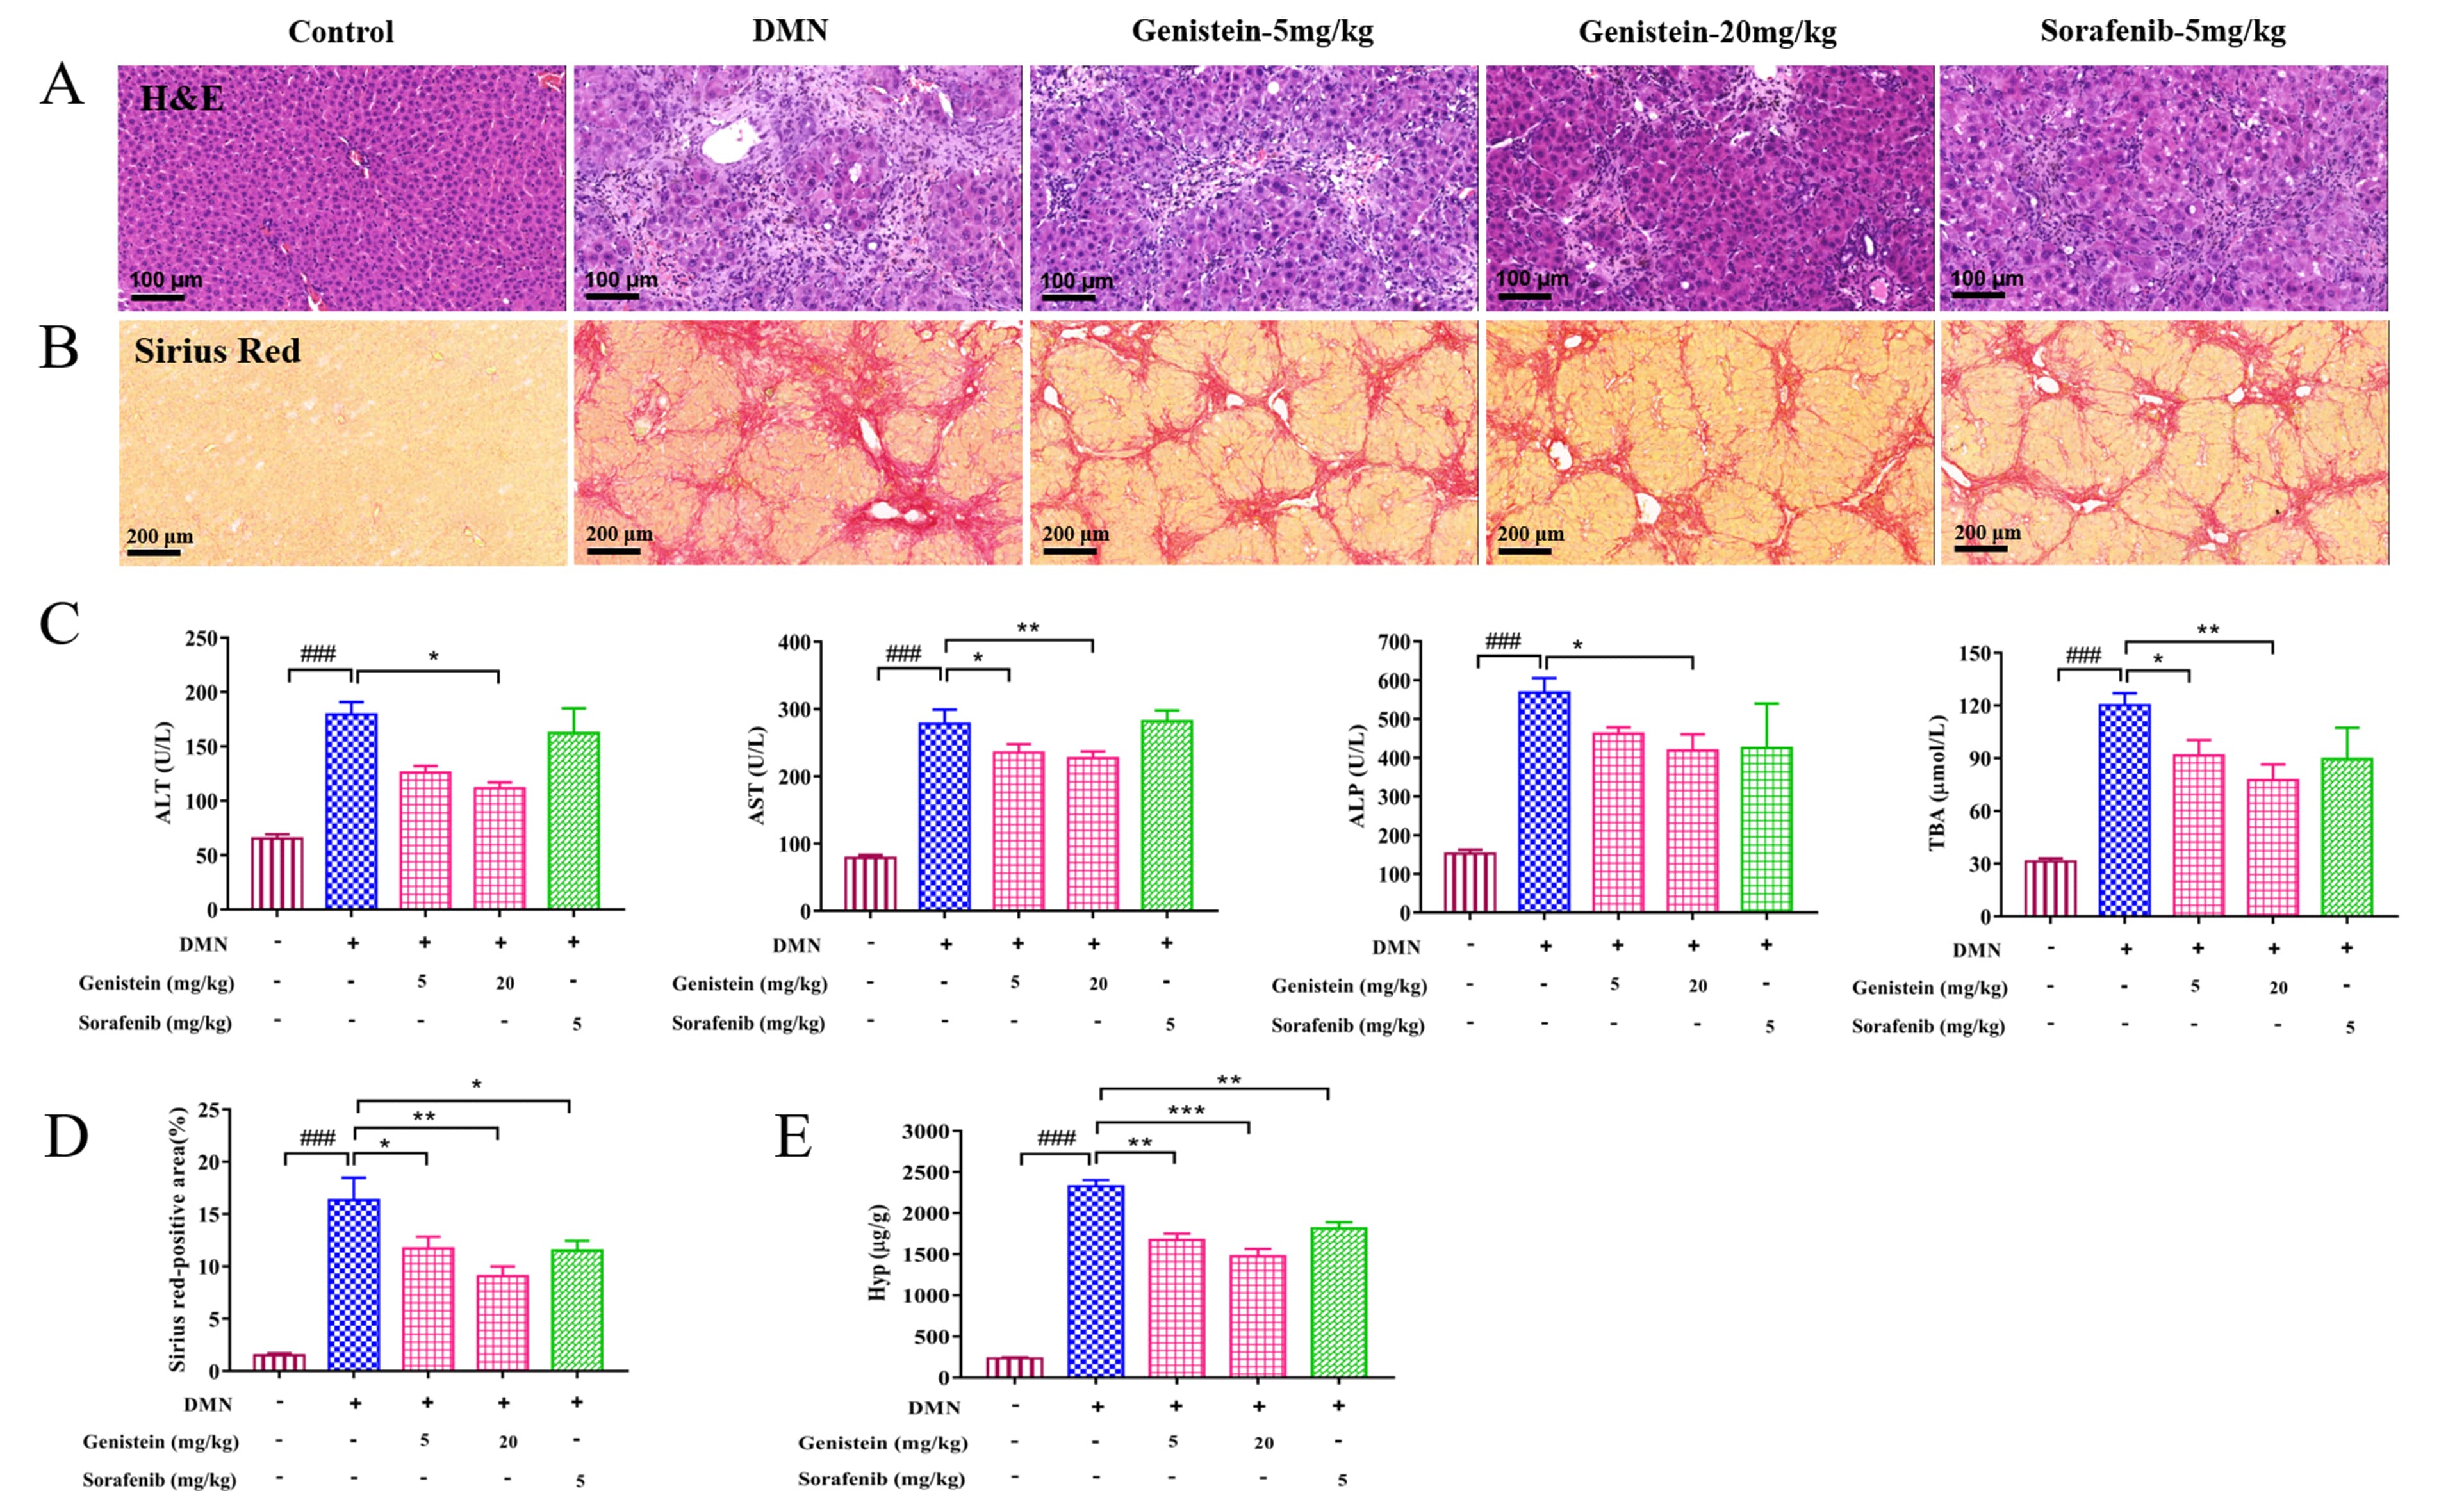 Fig. 4.
The effects of genistein on the liver injury and the collagen
deposition in the DMN-induced rats. (A) Representative images of H&E staining
(scale bar 100
In addition, the deposition of collagen fibers was evaluated by sirius red
staining. Compared with the control rats, several collagen fibers formed fibrous
septum, destroyed the structure of hepatic lobule, and formed pseudo lobule in
the liver with hepatic fibrosis (Fig. 4B). After genistein treatment, several
changes were improved. For instance, reduced collagen depositions and fibrous
septa were observed in these rats compared with the DMN-induced rats. Further,
sirius red-positive area was calculated to evaluate indirectly hepatic collagen
content. The result indicated that sirius red-positive area was obviously
decreased after genistein treatment, compared with the DMN model group
(p
Consistent with the in vitro experiments, the expressions of
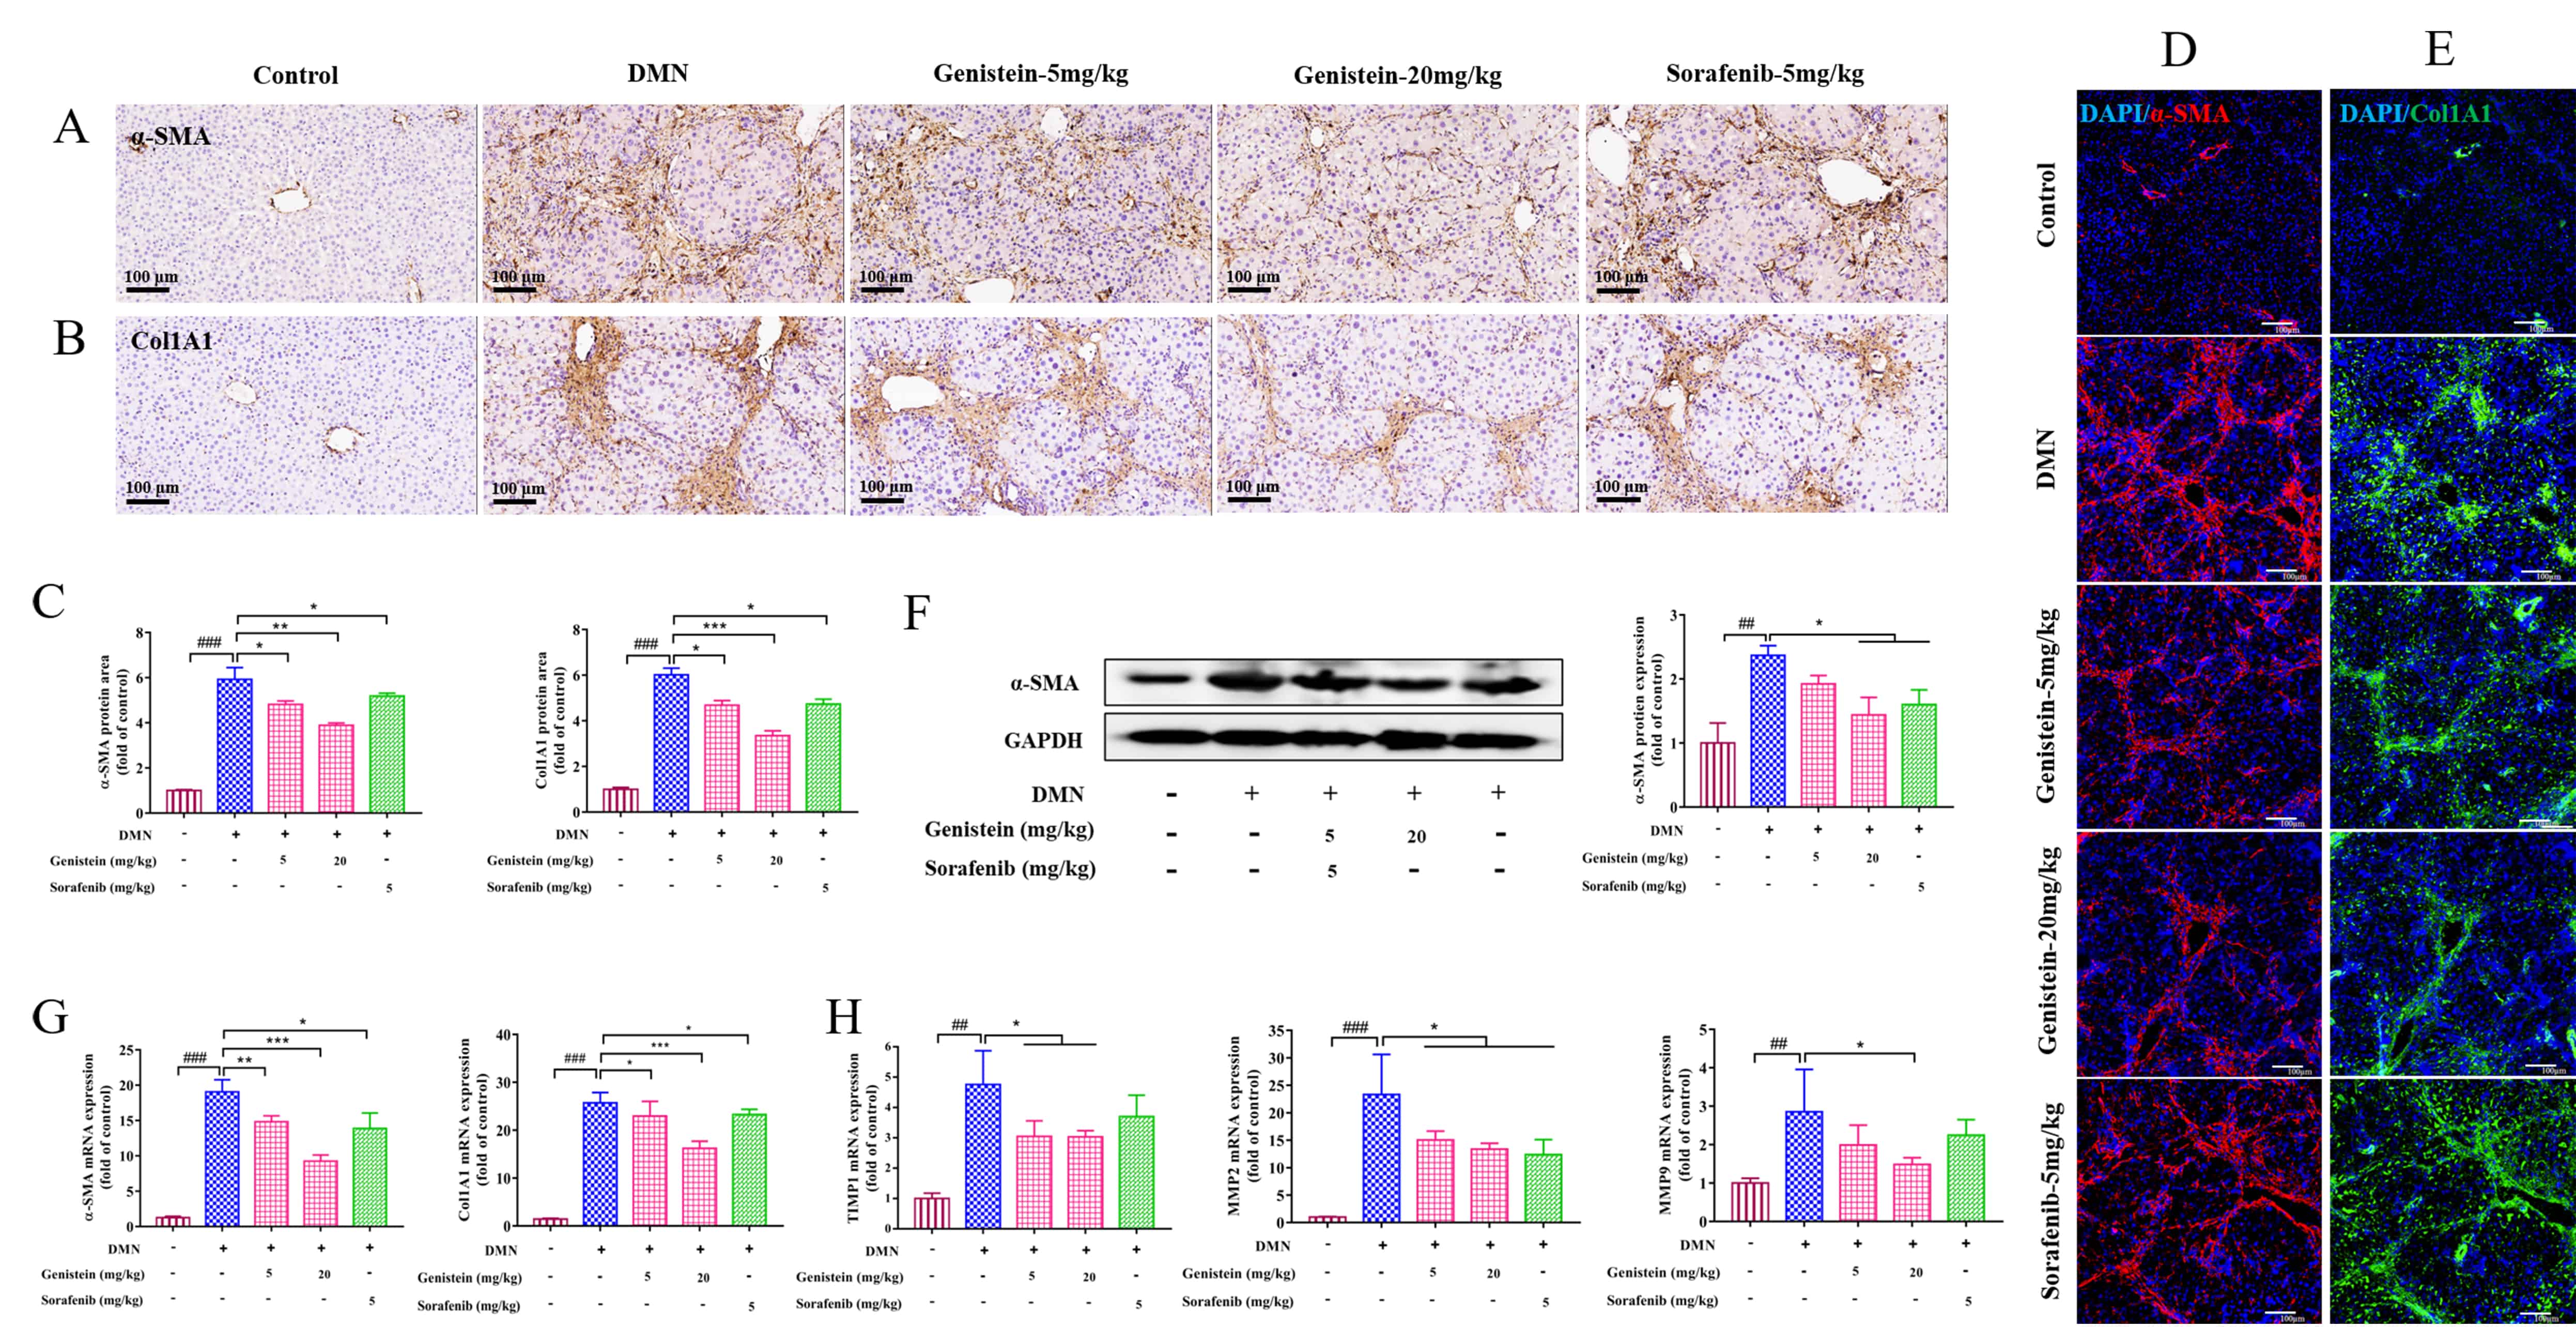 Fig. 5.
The effects of genistein on the expressions of HSC, MMPs and
TIMPs in the DMN-induced rats. (A,B) Immunohistochemistry assay was used to
determine the effects of genistein on the protein expression levels of
MMPs and TIMPs are directly involved in the balance between synthesis and
degradation of ECM in the liver [24]. Thus, in the present study, MMP2, MMP9, and
TIMP1 at the levels of transcription were detected. The results indicated that
the elevated mRNA expressions of MMP2 and MMP9 in DMN-induced rats were reversed
after treatment by genistein (p
Liver fibrosis is an inflammatory response. Thus, inflammation related-factors
were evaluated at the transcriptional levels in this work. qRT-PCR results
indicated that the increased mRNA expressions of IL-1
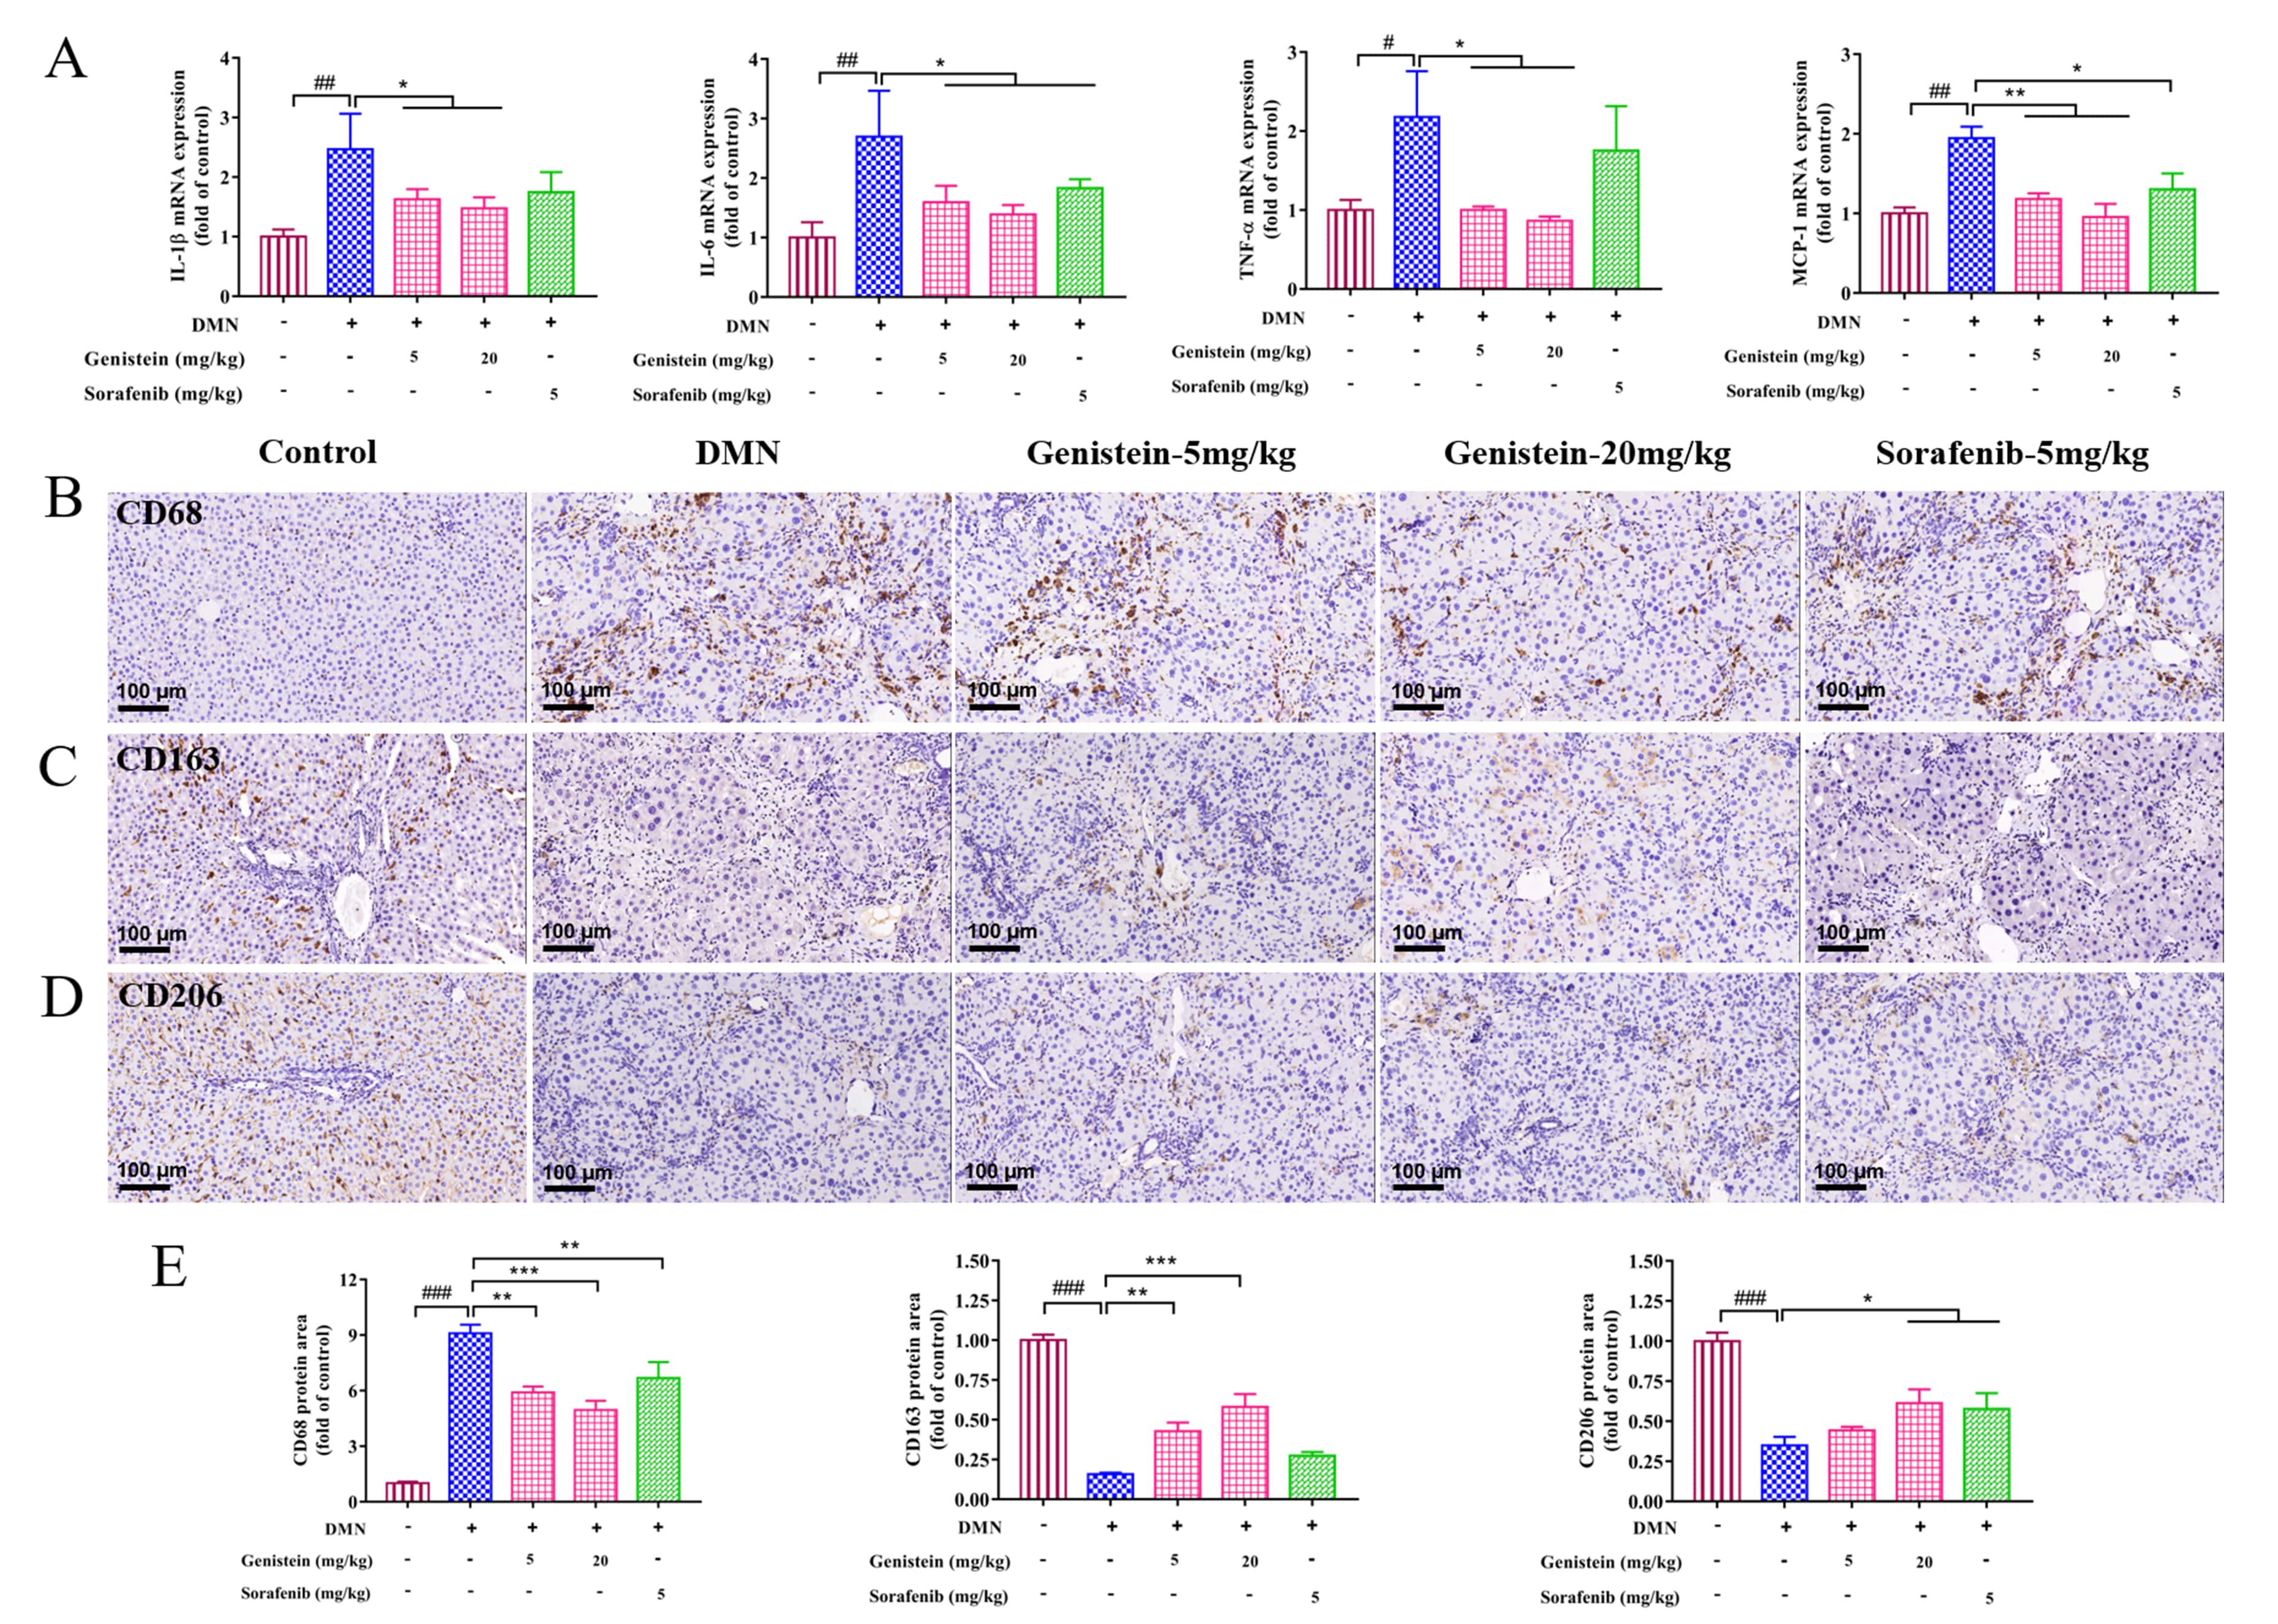 Fig. 6.
The effects of genistein on inflammatory infiltration and
macrophage functional properties in rats induced by DMN. (A) qRT-PCR was
performed to evaluate the effects of genistein on the mRNA expression levels of
IL-1
JAK2/STAT3 and SOCS3 pathway plays an important role during liver fibrosis. In
the present study, the protein expressions of JAK2, STAT3, and SOCS3 and the
phosphorylation of JAK2 and STAT3 were detected. In vivo, the results
indicated that the expression levels of p-JAK2/JAK2 and p-STAT3/STAT3 were
clearly increased in rats with DMN-induced fibrosis (p
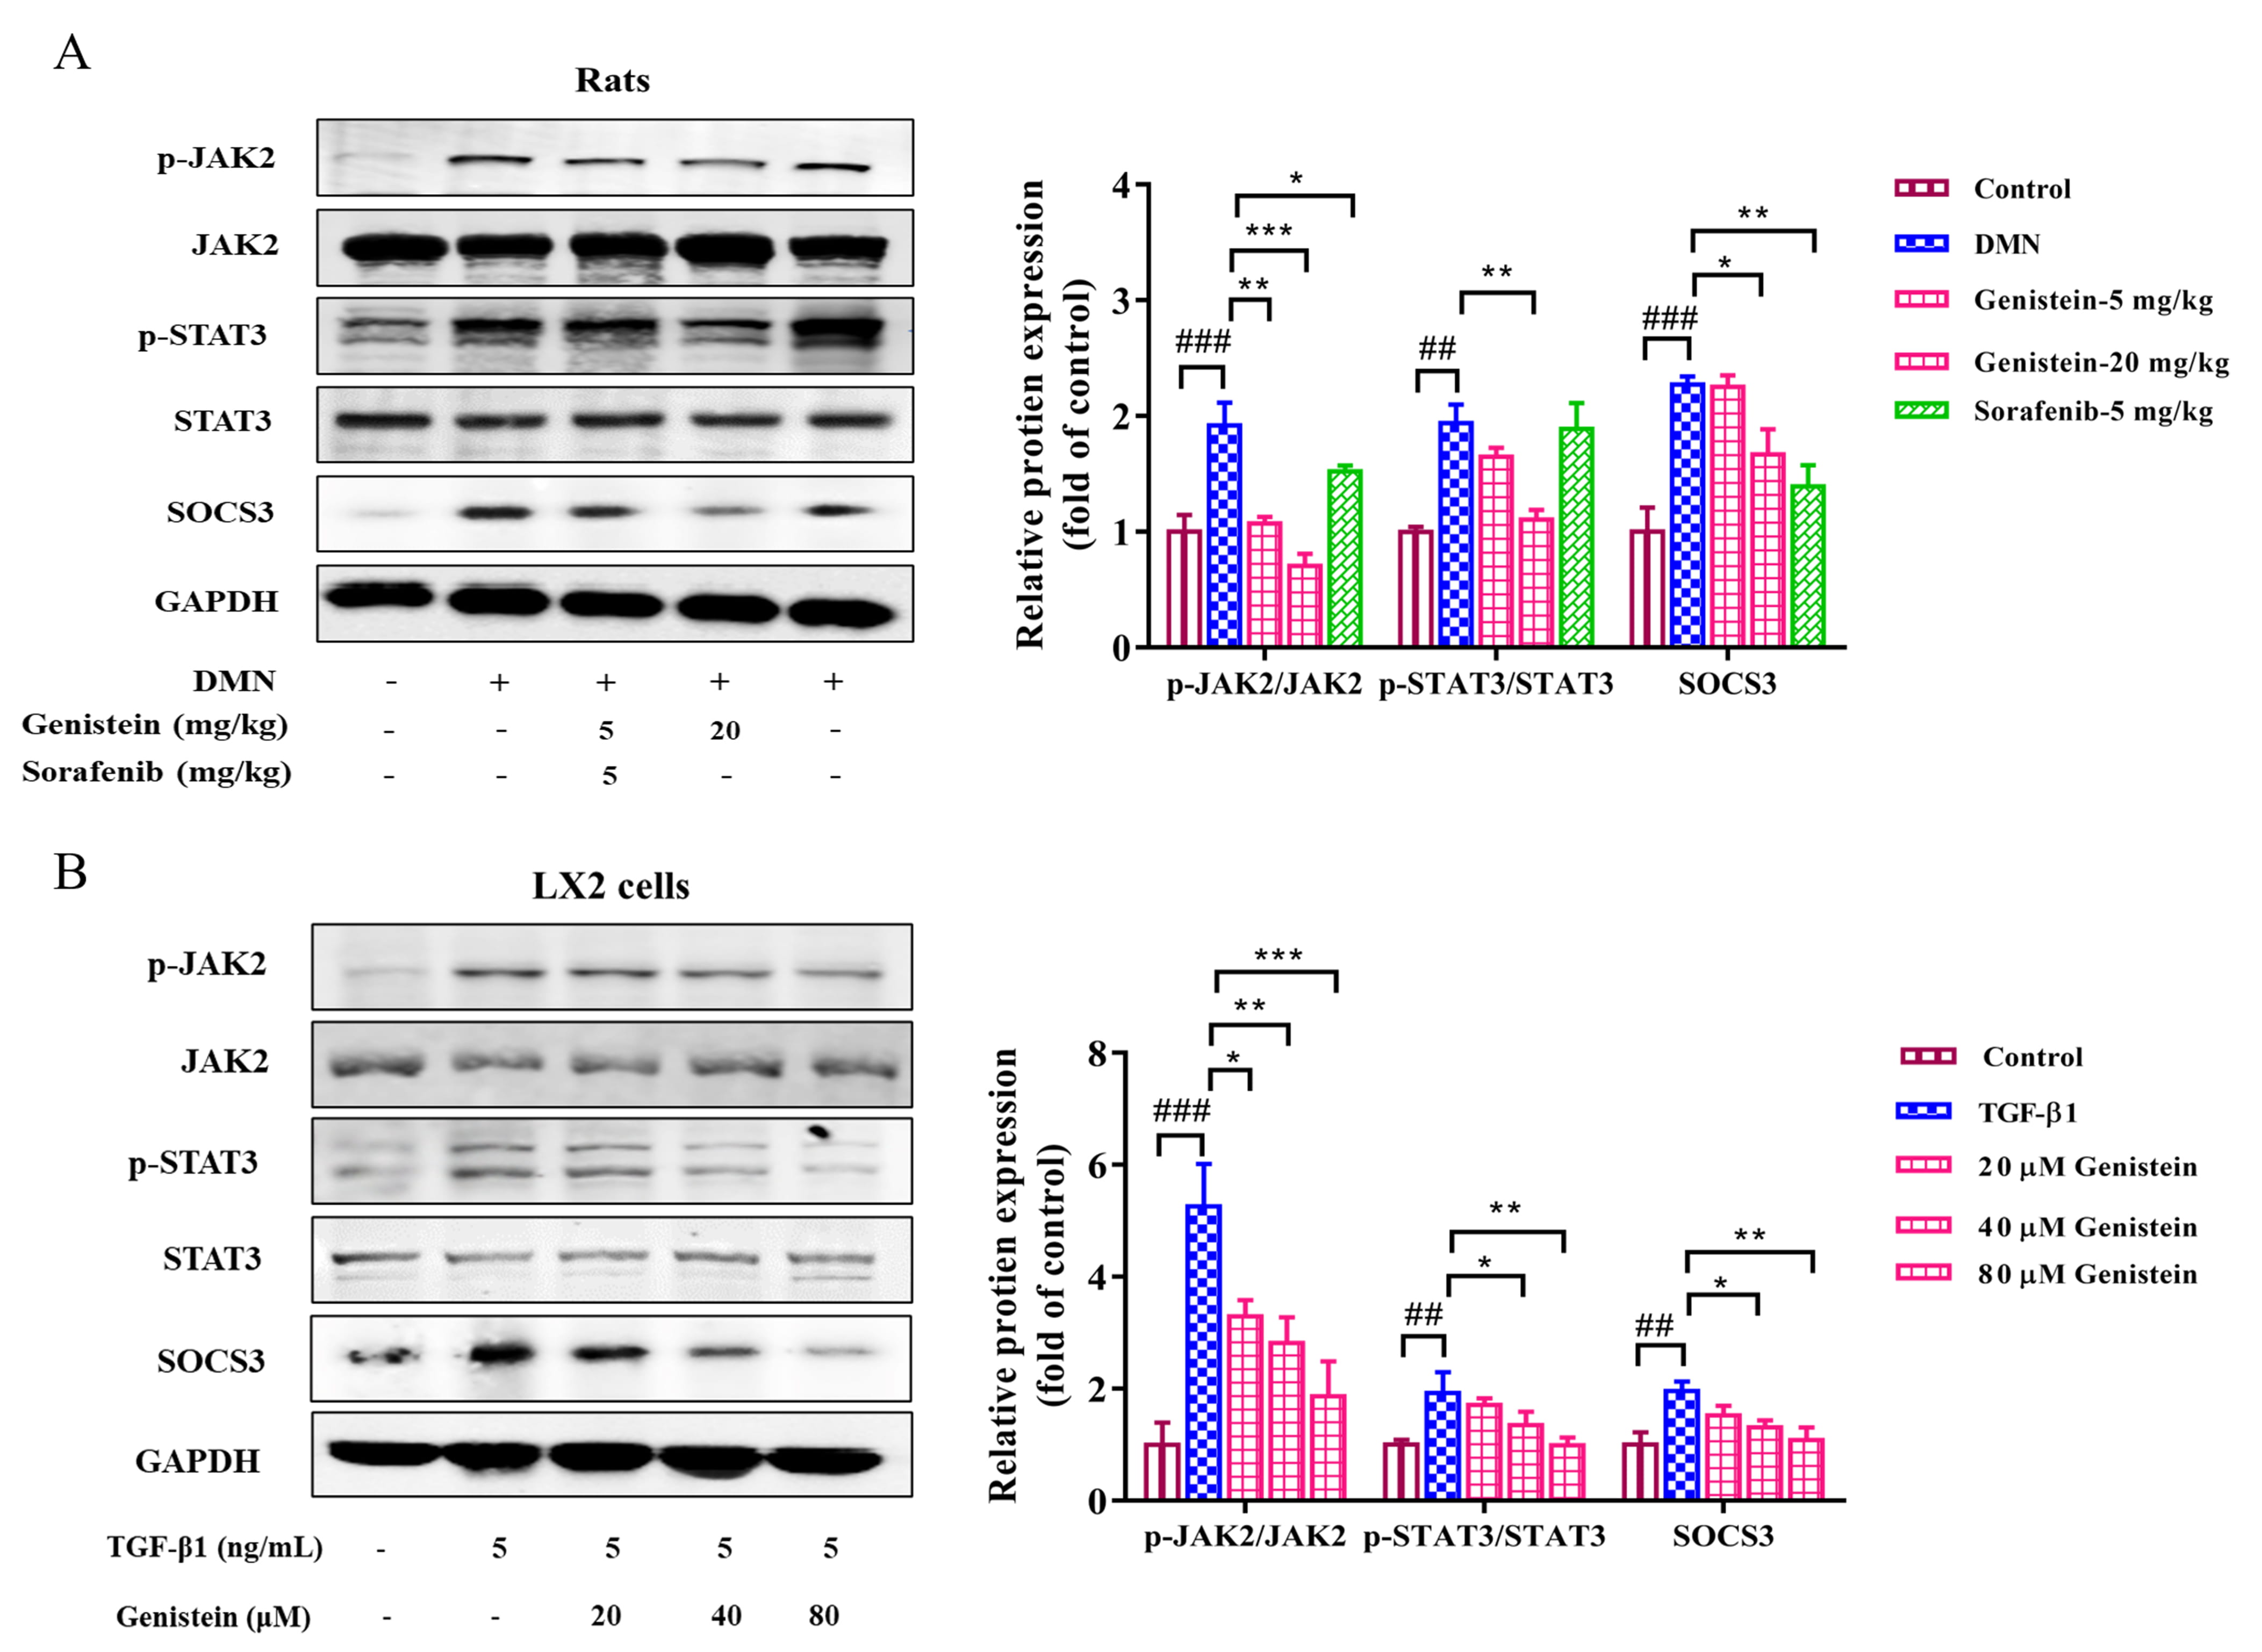 Fig. 7.
The effects of genistein on the JAK2/STAT3/SOCS3 pathway.
Western blot was used to assess the protein expression levels of p-STAT3, STAT3,
p-JAK2, JAK2, and SOCS3 (A) in the liver and (B) in LX2 cells were assessed by,
protein expression was normalized against GAPDH level. Data are shown as mean
Hepatic fibrosis is a common pathological consequence for diverse liver injuries induced by chronic viral and metabolic disorders [1]. Effective drugs are not yet available in clinic. Several studies have previously attempted to investigate the anti-fibrosis effects of genistein, and liver injury and fibrosis were significantly improved via genistein treatment in experimental models mediated by D-galactosamine [25], carbon tetrachloride [26], schistosomiasis [27], and methionine-choline-deficient diet [28]. However, these studies are focused on the current understanding of the pharmacodynamics, and research about the mechanism remains insufficient.
HSC proliferation and activation are closely related to the development of
fibrosis. In the present study, we first evaluated cell viability, proliferation,
and cell cycle arrest in LX2 cells. The inhibition of cell viability and
proliferation, the increase of G0/G1, and the reduction of S phase population
were observed in genistein-treated cells. Thus, the genistein-mediated
suppression of cell proliferation may be caused by cell cycle arrest, but the
mechanism remains to be explored in detail in future studies. Meanwhile, HSC
activation in LX2 cells was induced by TGF-
To research the possible mechanism of genistein on the synthesis and degradation of ECM, we assessed the expressions of MMPs, and TIMPs in the liver. MMP2 and MMP9 are the primary MMPs that degrade normal liver matrix, while its activity is inhibited by TIMP1, a pivotal regulator in the remodeling of extracellular matrix [6]. Although MMP2 and MMP9 can accelerate degradation of ECM and its expressions are reduced in liver fibrosis, some studies also believe that the expressions of MMP2 and MMP9 substantially increased because of the body’s response to the degradation of excessive ECM during liver fibrosis [29, 30]. In the present work, at the transcriptional levels, the elevated expressions of MMP2, MMP9, and TIMP1 in the liver with DMN rats were obviously decreased by genistein treatment. Therefore, genistein contributes to degradation of ECM by regulating the expressions of MMPs and TIMPs.
Chronic liver inflammation plays a predominant role in the initiation and
progression of hepatic fibrosis [31, 32]. In the present study, inflammation
factors were evaluated at the transcriptional levels, the elevated expressions of
IL-1
In previous studies, the mechanism of genistein against liver fibrosis was
limited to TGF-
Furthermore, the serum and liver levels of genistein should be measured to
establish concentrations that can be referred to as therapeutic. The contents of
genistein in the serum and liver tissue of DMN-induced fibrosis rats were
detected by LC-MS (Supplementary Fig. 1). The result is shown in
Supplementary Fig. 2, in which the contents of genistein in the liver
tissue of 5 mg/kg and 20 mg/kg genistein groups were successfully detected, and
the contents of genistein in the serum of genistein-20 mg/kg group were detected.
Notably, these samples were obtained approximately 24 h after the last oral
administration. This study aimed to effectively understand the exposure of
genistein in blood after oral administration genistein. The plasma concentration
vs time curves of genistein in rats after oral treated 20 mg/kg
genistein are shown in Supplementary Fig. 3. According of the
quantitative results, the pharmacokinetic parameters were calculated and
summarized in Supplementary Table 1. After oral treated 20 mg/kg
genistein, genistein was detected in rat plasma at different sampling points.
Genistein could be quickly absorbed into blood with T
In conclusion, the results presented here indicate that genistein efficiently attenuates hepatic fibrosis induced by DMN in rats, and this condition may be related to the regulation of the functional properties of macrophage and JAK2/STAT3/SOCS3 signaling pathway.
YX and DZ performed the experiments, analyzed the data and wrote the manuscript. HY, YL, LZ, CZ, GC and YH assisted with the experiments. JC, HZ and YM critically revised the manuscript. PL and WL designed the research, conceived the ideas, and revised the manuscript. All authors read and reviewed the manuscript.
The animal study was reviewed and approved by the Animal Ethics Committee of Shanghai University of Traditional Chinese Medicine (PZSHUTCM190322007; Approval date: July 27, 2018).
Not applicable.
This work was supported by the National Natural Science Foundation of China (No. 82004162, 81703681 and 81530101), “Chen Guang” project supported by Shanghai Municipal Education Commission and Shanghai Education Development Foundation (No. 20CG50), Young Elite Scientists Sponsorship Program by CAST (No. 2020QNRC001), Shanghai Sailing Program (No. 17YF1419800 and 20YF1449500), China Postdoctoral Science Foundation (No. 2020M681367). Budget project of Shanghai University of traditional Chinese medicine (No. 2020LK029).
The authors declare no conflict of interest.
Supplementary material associated with this article can be found, in the online version, at https://www.imrpress.com/journal/FBL/26/12/10.52586/5050.