


1 Department of Biology, University of Ottawa, Ottawa, ON K1N 6N5, Canada
2 Department of Agriculture and Agri-Food, Ottawa Research and Development Center, Ottawa, ON K1A 0C6, Canada
3 Aquatic and Crop Resource Development Research Centre, National Research Council of Canada, Saskatoon, SK S7N 5C2, Canada
Academic Editor: Changsoo Kim
Abstract
Background: Flax is one of the eight founder crops of agriculture. It
is believed to have been domesticated as a long-day plant that has since spread
to survive in a wide range of eco-geographic regions extending from the warm
Indian subcontinent to the low latitude east African highlands and to the cool
and high-latitude Eurasia. Understanding the genetic basis underlying its
adaptation and selection events throughout its dispersion is essential to develop
cultivars adapted to local environmental conditions. Methods: Here we
detected genetic signatures of local adaptation and selection events of flax
based on 385 accessions from all major flax growing regions of the world using
genome scan methods and three genomic datasets: (1) a genome-wide dataset of more
than 275K single nucleotide polymorphisms (SNPs), (2) a filtered dataset of 23K
SNPs with minor allele frequency
Keywords
- GWAS
- FST
- Principal component
- Adaptive loci
- Genetic signatures
- Candidate genes
Adaptation of a species to a gradient of environmental conditions is attributed to the phenotypic plasticity and genetic variation within the gene pool of the species [1, 2]. While phenotypic plasticity to a wide range of environmental conditions maintains genetic homogeneity [3], variants permit differential adaptation to local environments via selection and prompts genetic divergence of populations [4]. Climate factors act as major forces in the selection of variants increasing fitness from a gene pool and consequently drive local adaptation and genetic divergence [5]. Early domesticated crops have spread to extensive eco-geographic ranges, far from where their wild ancestors originated. Their success along latitudinal gradients is usually governed by their phenological behavior in response to spatial variations in climate and related factors, especially day-length and temperature [6]. The agricultural founder crops that are believed to have been domesticated in the Fertile Crescent were presumed to be adapted to vernalization and long-day flowering [6]. These crops are now well spread throughout the world and adapted to a range of eco-geographic conditions; consequently, post-domestication genetic divergence can be observed among eco-spatially separated populations [7]. Such divergence is presumably attributed to loci selected in specific environments with high coefficients of genetic differentiation between populations that specify the genetic basis underlying the adaptation [8].
Understanding the genetic signatures underlying local adaptation of landraces and/or cultivars is an essential step for developing hastened and effective breeding and conservation schemes in crops. Recent advances in sequencing technologies enable the production of large genomic datasets, and their genome-wide scans enable the detection of outlier loci that are signatures of local adaptations [9, 10, 11]. Outlier loci detection based on genetic differentiation without prior knowledge of the driving environmental forces and genome-environment association (GEA) have recently been used to detect and cross-validate these outliers as important signatures of adaptation to diverse environments [12, 13]. Alleles under selection in a specific environment experience a higher fixation rate than alleles of neutral effects for the environment [8]. In the absence of environmental condition records, such as climate data, genome scan techniques can be used to discriminate loci harboring alleles under heavy selection pressure. These techniques along with GEA based on multi-year environmental data records have become useful to study the genetic basis of adaptation to climatic and other environment-specific conditions [13, 14]. Genome scans based on outlier loci detection and GEA have been used to discover local adaptation signatures in several plant species like barrel clover [15], sorghum [16], barley [17], maize [18], oat [19], common bean [20], crop wild relatives [21, 22, 23] and Arabidopsis [24].
Flax (Linum usitatissimum L.) is one of the eight founding crops of
agriculture in the fertile crescent [25]. It is believed to have first been
domesticated in present-day Syria [26] and spread to nearly all of its current
eco-geographic distribution in the Old-World millennia ago. As archeological and
paleontological evidences show, flax was cultivated in Mesopotamian and Egyptian
irrigated fields ca. 7000 BC [25] and Europe ca. 6000 BC [27]. It started being
used for its fiber and seeds in Western Europe ca. 5500 BC [28] and reached as
far as China by 3000 BC [29]. Some of these post-domestication distributions
eventually became secondary centers of diversification [30]. Today, the crop is
grown from the warm Indian subcontinent to the temperate zones of Europe and
America and the low latitude North-East of African Highlands. Genetic variation
and population structure of flax are majorly attributed to environmental and
anthropogenic selection pressures [31]. The genetic variation of flax correlates
with latitudinal gradient-related variables such as the day-length during the
cropping months [31, 32]. With the assumption that such genetic variations are
attributed to loci for environmental adaptation, we performed two genome scans,
namely principal component analysis (PCA) and Wright’s fixation index
(F
The plant materials used in this project include 385 accessions that were collected from more than 35 flax-growing countries. Approximately 60% of the germplasm originated from the Old-World, i.e., where flax has been cultivated for millennia, including the postulated centers of origin and secondary centers of diversity.
Genome-wide SNP datasets were extracted from a 1.7M SNP dataset originally
generated by resequencing the flax core collection (n = 407) using the Illumina
HiSeq 2000 platform [31, 33]. SNPs were filtered with a 90% call rate and a
minimum minor allele frequency (MAF) of 5%. To reduce the number of missing
SNPs, imputation was performed using LinkImpute [34] implemented in TASSEL v5
[35] with default parameters, but with the maximum distance between sites set to
100 kb. Individuals with
In order to define the appropriate number of ancestral populations, estimates were obtained using the pcadapt tool [36]. Here eigenvalues were computed for 50 PCs and visualized into scree plots. By applying the cattle rule [37], the PC to the left of the last PC with eigenvalues that deviates from the smooth line is considered to be the most appropriate number of populations. To corroborate the estimated number of populations, a cross validation [38] was performed using ADMIXTURE [39] which uses a Bayesian clustering approach. PCA was performed based on the estimated number of populations (K) and a neighbor-joining (NJ) phylogenetic analysis was carried out using TASSEL [35]. The PCA based on the first three PCs and the NJ tree were visualized using ggplot2 [40] in R and interactive Tree Of Life (iTOL) [41], respectively.
Following the PCA clustering using the 23K dataset, individuals were assigned to
one of 12 populations. To estimate the genetic variation between populations,
pairwise genetic differentiation between populations was estimated with the
fixation index (F
The geographic region/country that best represents the population was assigned for each population based on the passport data, which indicates the origin of dominant members of a population. The representative geographic areas were inferred based on the history of cultivation of flax in each of the regions (Supplementary Table 1). Therefore, geographic coordinates of a representative district or a province with a long history of flax cultivation were used as environmental data tags. To get insight into some environmental factors, mean annual temperature data downloaded from www.wroldclim.org was overlaid onto the world map using DIVA-GIS v7.5 (LizardTech Inc, Portland, OR, USA) [47]. The representative coordinates of each population were positioned onto the world map along with the annual temperature data (Fig. 1).
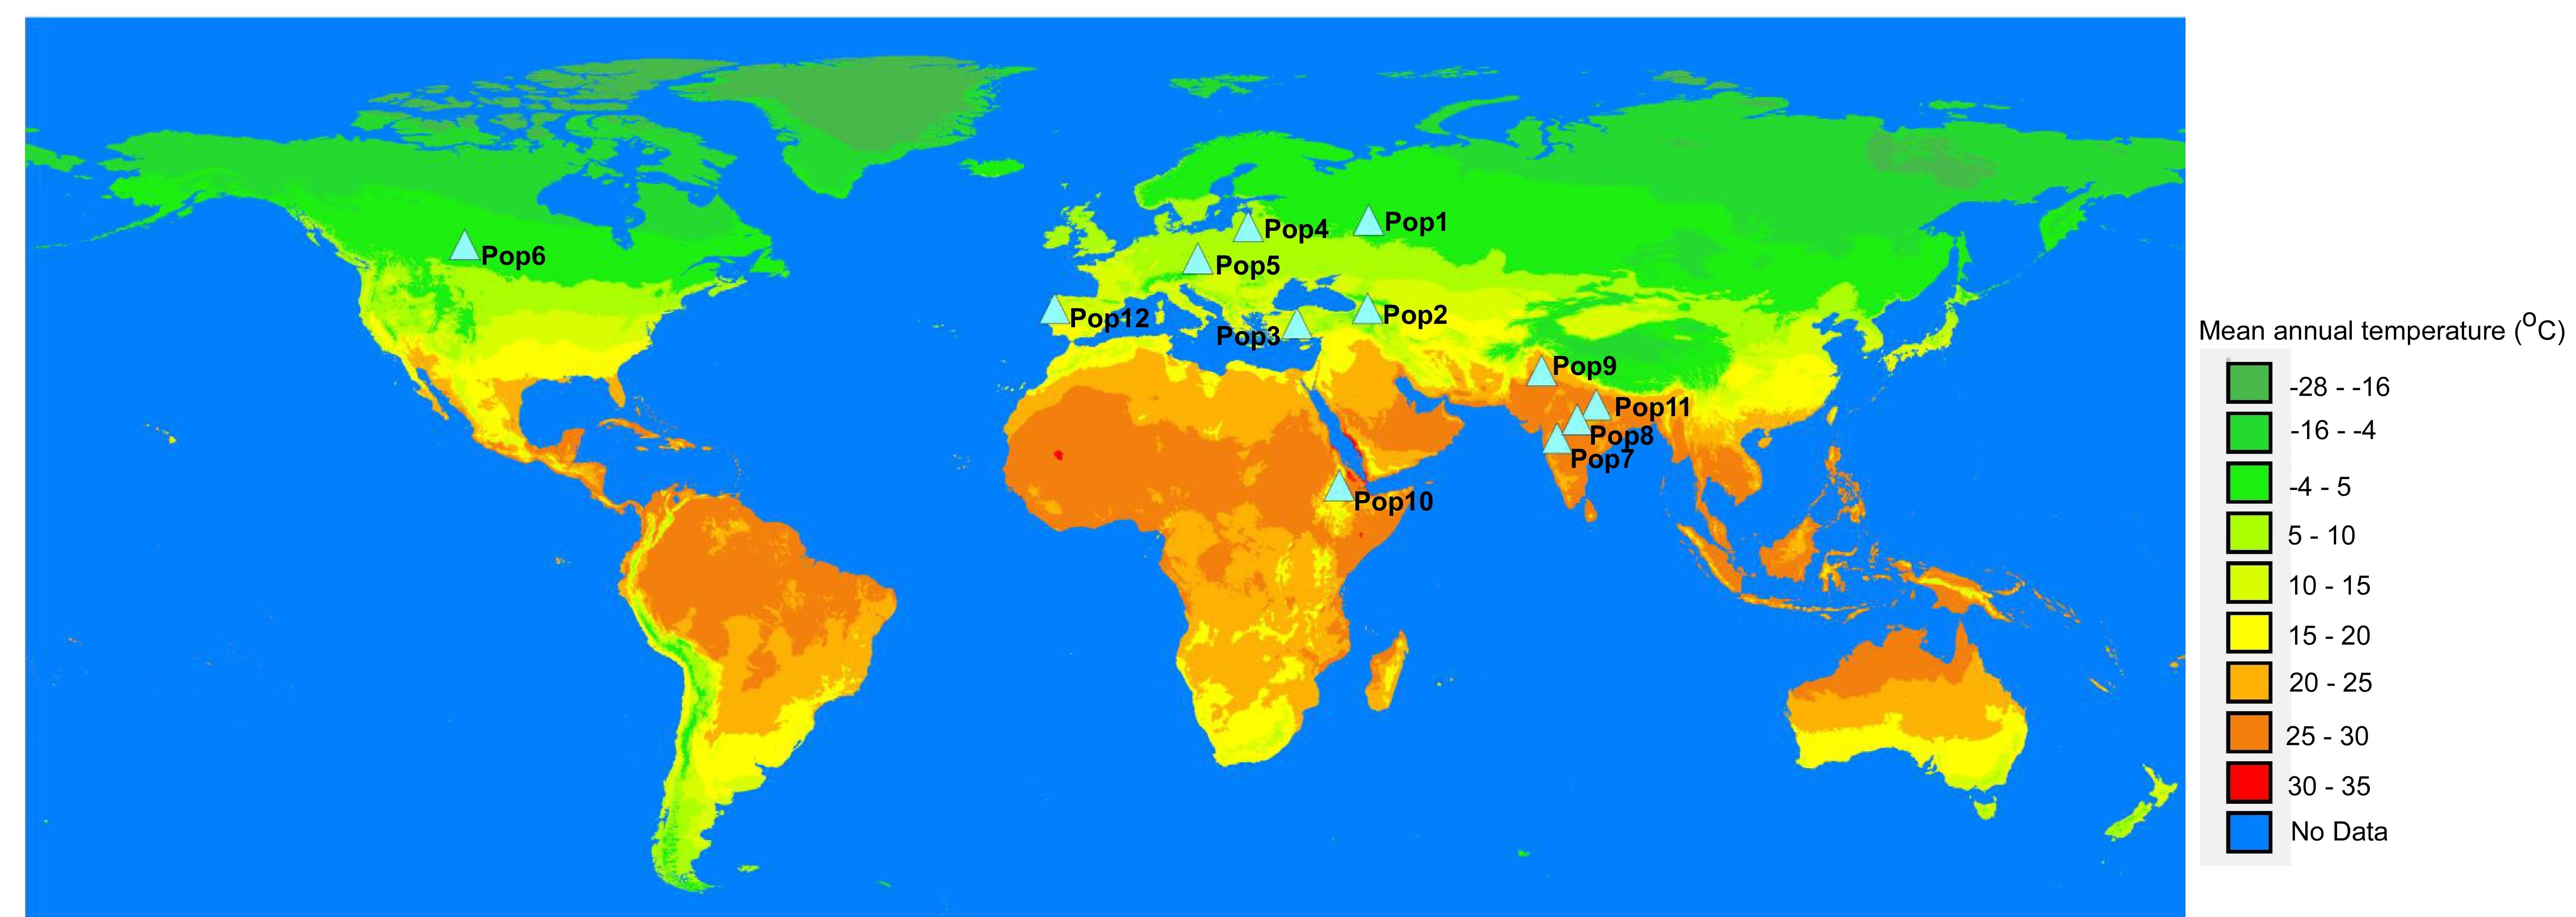 Fig. 1.
World map overlaid with mean annual temperatures and showing the geographic locations assigned to the populations (Pop1-12).
The monthly mean temperature and day-length data for each population were downloaded from 22 years of records available in the NASA database (https://power.larc.nasa.gov/). The average records of these periods were considered. The cropping period for the selected regions was determined based on the major crop calendars from FAO (http://www.amis-outlook.org/amis-about/calendars/soybeancal/en/) for all populations that follow similar northerly cropping patterns. Because flax is a Rabi crop in some parts of the world such as India and Pakistan, different cropping calendars (https://nfsm.gov.in/nfmis/rpt/calenderreport.aspx and http://namc.pmd.gov.pk/crop-calender.php) were used for genotypes of Indian and Pakistani origins, respectively.
To detect outlier loci associated with local adaptation signatures, two
genome-scan methods were used: individual SNP F
Genomic regions that consistently showed a strong association with an
environmental factor across the datasets for both of the first two methods
(PCADAPT, and F
Genomic regions spanning 20 kb up and downstream of the most significant SNP loci were examined for the presence of candidate genes for local adaptation using the flax reference genome annotation [33]. Linkage disequilibrium (LD) between candidate genes and their associated marker was calculated using gpart package in R [49]. Candidate gene putative functions were further assessed through the identification of their Arabidopsis orthologs (www.arabidopsis.org) and through a literature search evidencing their role(s) in adaptation.
Filtering of the datasets yielded a total of 277,399, 23,592 and 34,451 SNPs for the two genome-wide (277 and 23K) and the exon-based (34K) datasets, respectively. The former two contained 385 genotypes, while the exon-based dataset included 393. The estimated number of populations [36] was 12 (Supplementary Fig. 3) which is also consistent with the result from cross validation technique where the lowest error was obtained at K = 13 (Supplementary Fig. 4). The populations tended to follow geographic gradient where Pop1-5 were dominated by Eurasian accessions (Supplementary Table 1. Pop6, Pop10 and Pop12 contained mostly Canadian, Abyssinian and Mediterranean accessions, respectively, whereas the majority of the South Asian accessions grouped into the remaining three populations (Fig. 2A,B). The NJ phylogenetic analysis clustered the accessions slightly differently, i.e., reflecting both geographic and historical-use patterns of variation (Fig. 2C). Accessions from Old-World flax-growing regions tended to have longer branches compared to those from the New-World regions. In addition, the majority of the fiber types clustered in the single clade Pop1_FIB (Fig. 2C).
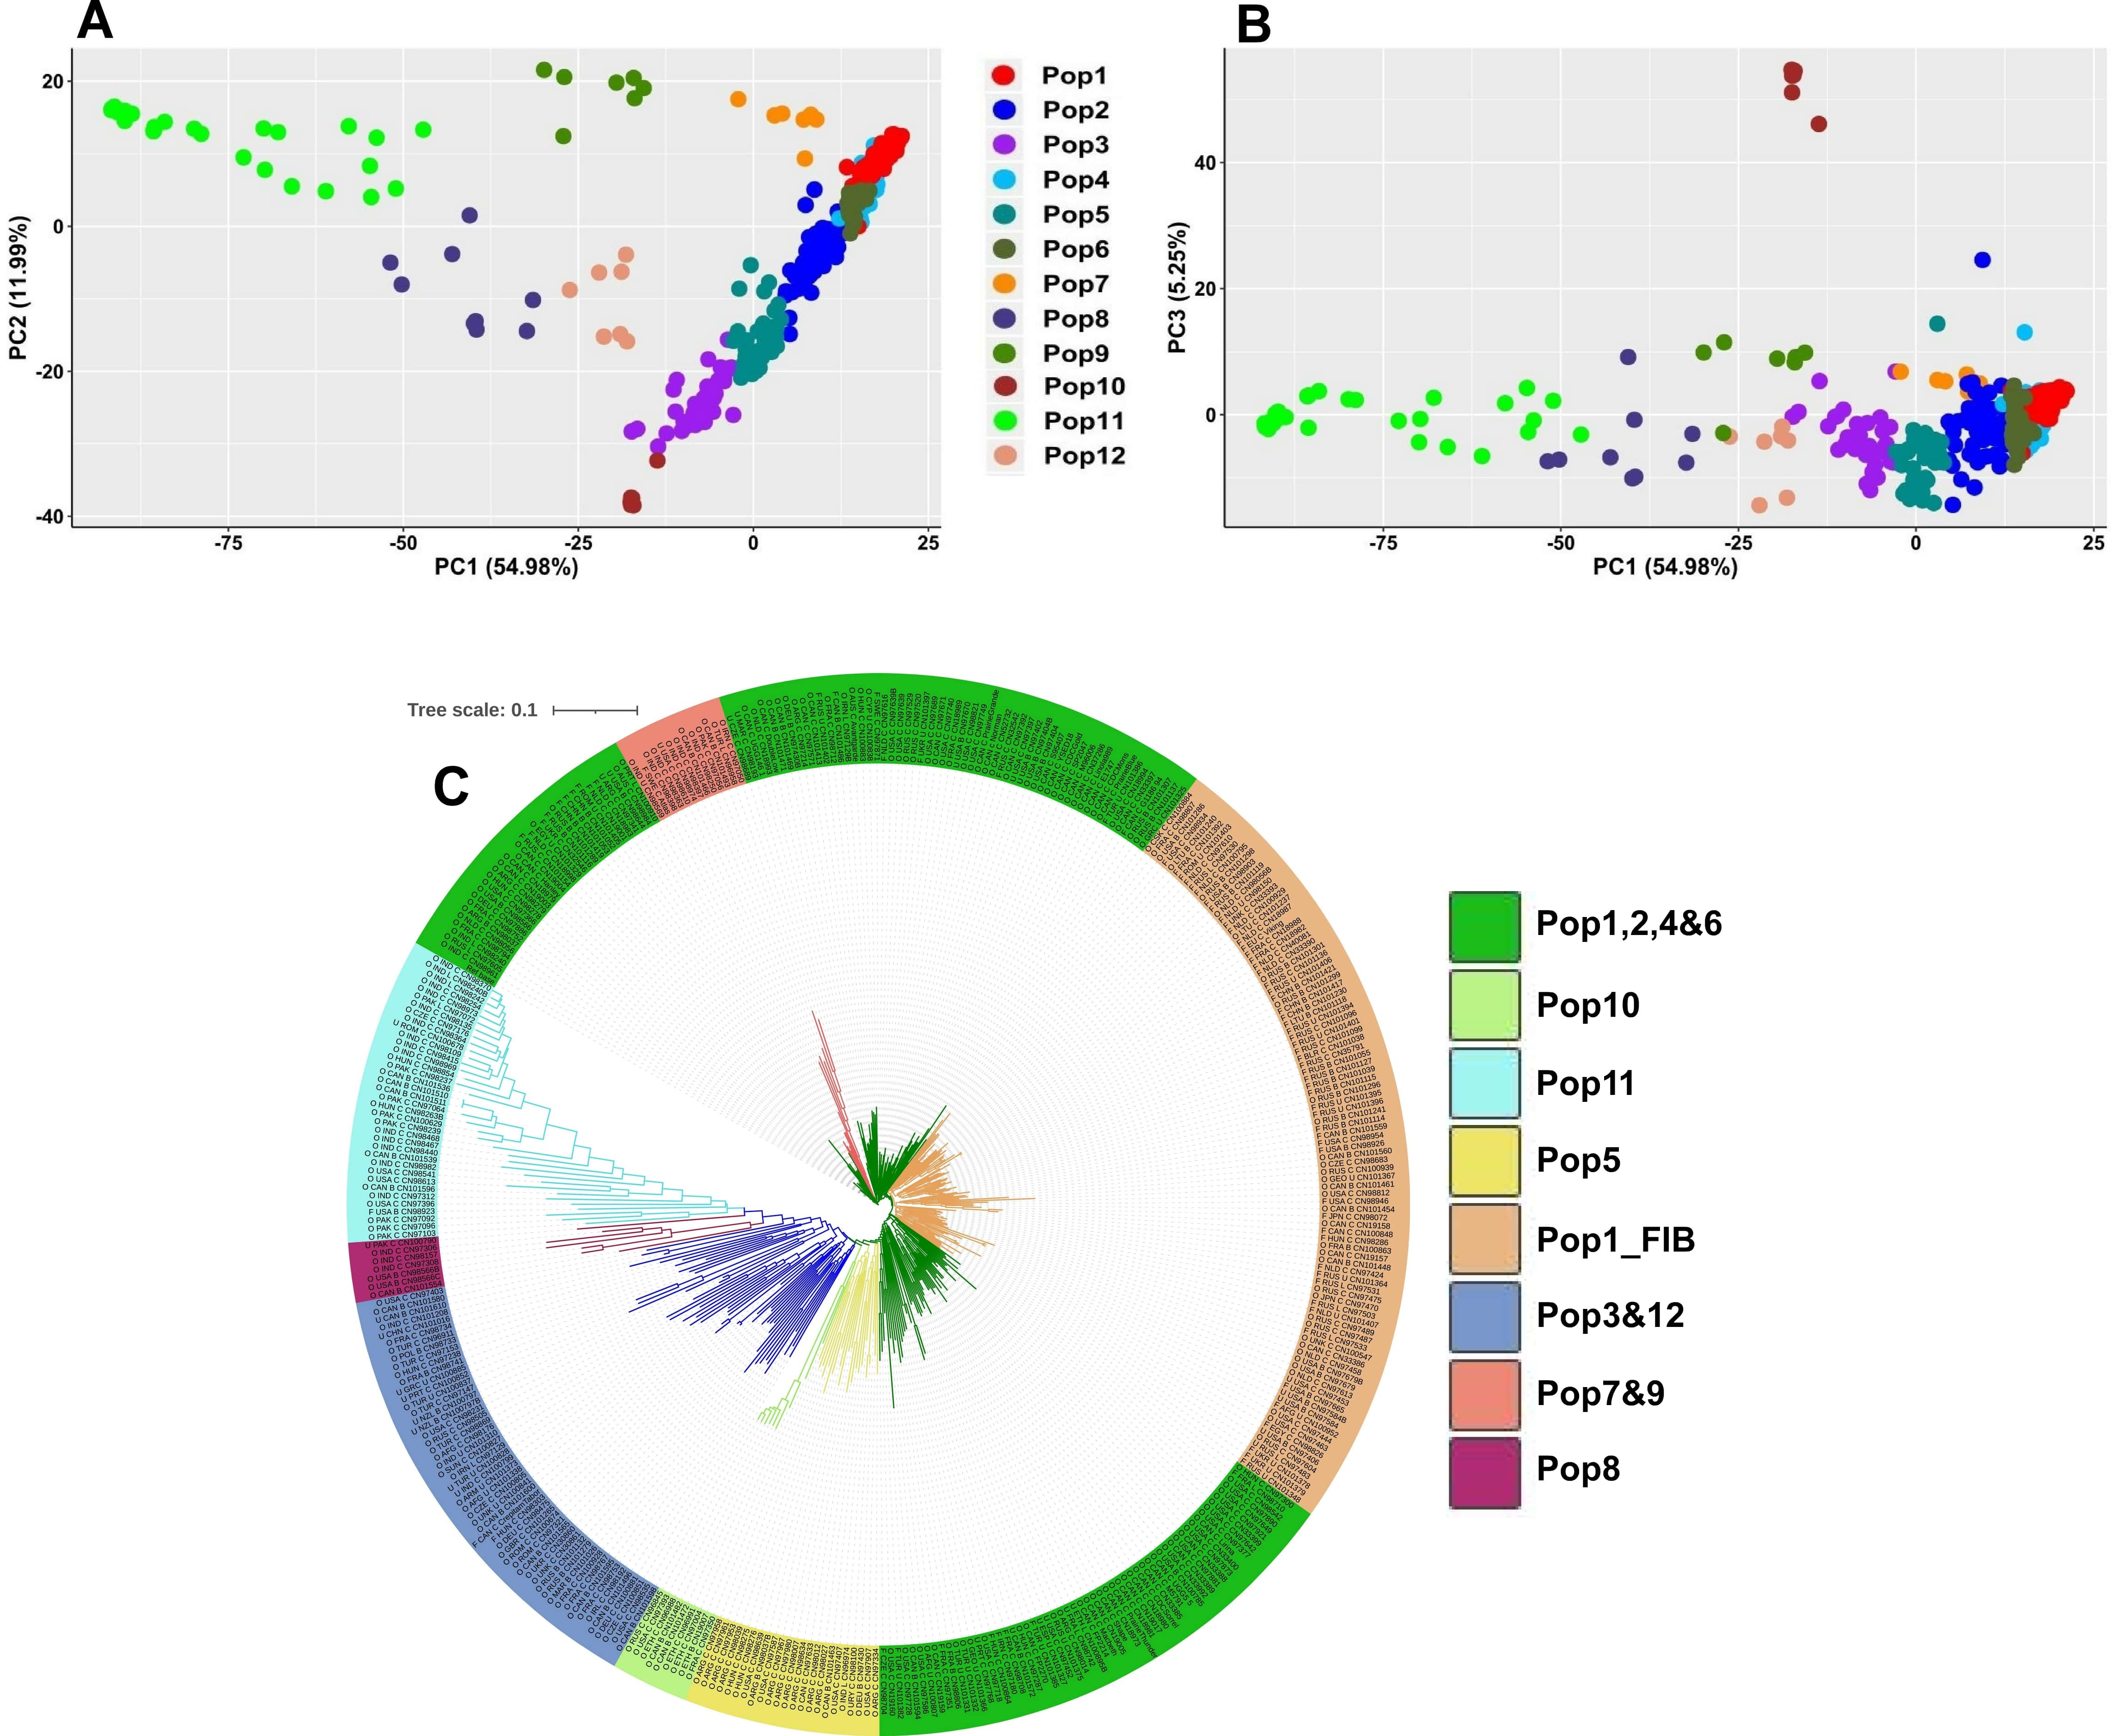 Fig. 2.
Population genetic structure based on the 23K SNP dataset. (A) and (B) principal component analysis (PCA) clustering of the accessions based on the first three principal components (PC1, PC2 and PC3). (C) Neighbor-joining (NJ) phylogenetic tree where accessions from the Old-World flax growing regions tended to have longer branches. Accession names in NJ indicate the type (O, oil; F, fiber; U, unknown), the country of origin, the breeding status (C, cultivar; B, breeding material; L, landrace) followed by the accession name.
Pairwise population differentiation was significant (p
| Population | Pop1 | Pop2 | Pop3 | Pop4 | Pop5 | Pop6 | Pop7 | Pop8 | Pop9 | Pop10 | Pop11 |
| Pop2 | 0.09 | ||||||||||
| Pop3 | 0.35 | 0.13 | |||||||||
| Pop4 | 0.05 | 0.05 | 0.22 | ||||||||
| Pop5 | 0.24 | 0.06 | 0.06 | 0.14 | |||||||
| Pop6 | 0.06 | 0.03 | 0.22 | 0.02ns | 0.13 | ||||||
| Pop7 | 0.22 | 0.13 | 0.23 | 0.21 | 0.18 | 0.17 | |||||
| Pop8 | 0.63 | 0.38 | 0.24 | 0.48 | 0.29 | 0.49 | 0.39 | ||||
| Pop9 | 0.54 | 0.33 | 0.30 | 0.45 | 0.31 | 0.42 | 0.27 | 0.32 | |||
| Pop10 | 0.72 | 0.51 | 0.38 | 0.69 | 0.43 | 0.62 | 0.75 | 0.53 | 0.69 | ||
| Pop11 | 0.76 | 0.61 | 0.51 | 0.67 | 0.55 | 0.67 | 0.62 | 0.34 | 0.48 | 0.68 | |
| Pop12 | 0.53 | 0.27 | 0.18 | 0.38 | 0.19 | 0.38 | 0.34 | 0.23 | 0.32 | 0.54 | 0.48 |
| ns, non significant variation at p | |||||||||||
Pop1 and Pop2 harbored the most common haplotype from each of the 15 chromosomes (Table 2). All accessions considered, chromosome 1 displayed the lowest percentage of common haplotype with ~19% while chromosome 4 had the highest with 78%. Some populations, such as Pop8, 9 and 11, contained very few common haplotypes while others, such as Pop1, 2, 4 and 6, comprised a large proportion of individuals with common haplotypes across all chromosomes (Table 2).
| Chr |
Overall | Pop1 | Pop2 | Pop3 | Pop4 | Pop5 | Pop6 | Pop7 | Pop8 | Pop9 | Pop10 | Pop11 | Pop12 |
| Chr1 | 18.96 | 40.83 | 15.52 | 0.00 | 11.11 | 0.00 | 25.00 | 28.57 | 0.00 | 0.00 | 0.00 | 0.00 | 0.00 |
| Chr2 | 64.68 | 97.50 | 70.69 | 40.00 | 88.89 | 30.77 | 95.45 | 57.14 | 0.00 | 14.29 | 28.57 | 0.00 | 0.00 |
| Chr3 | 29.09 | 54.17 | 22.41 | 0.00 | 66.67 | 56.41 | 0.00 | 0.00 | 0.00 | 0.00 | 0.00 | 0.00 | 0.00 |
| Chr4 | 78.18 | 99.17 | 94.83 | 71.43 | 100.00 | 92.31 | 90.91 | 71.43 | 11.11 | 0.00 | 0.00 | 0.00 | 28.57 |
| Chr5 | 75.06 | 100.00 | 81.03 | 45.71 | 100.00 | 92.31 | 90.91 | 14.29 | 0.00 | 0.00 | 100.00 | 0.00 | 57.14 |
| Chr6 | 51.43 | 94.17 | 58.62 | 14.29 | 55.56 | 30.77 | 52.27 | 14.29 | 0.00 | 0.00 | 0.00 | 0.00 | 0.00 |
| Chr7 | 51.95 | 56.67 | 68.97 | 37.14 | 77.78 | 74.36 | 65.91 | 0.00 | 0.00 | 0.00 | 85.71 | 0.00 | 14.29 |
| Chr8 | 64.42 | 55.83 | 74.14 | 97.14 | 77.78 | 100.00 | 70.45 | 0.00 | 44.44 | 14.29 | 100.00 | 5.88 | 85.71 |
| Chr9 | 49.61 | 56.67 | 65.52 | 25.71 | 88.89 | 64.10 | 75.00 | 0.00 | 0.00 | 0.00 | 0.00 | 0.00 | 28.57 |
| Chr10 | 59.22 | 56.67 | 81.03 | 48.57 | 88.89 | 97.44 | 75.00 | 0.00 | 44.44 | 0.00 | 0.00 | 0.00 | 57.14 |
| Chr11 | 35.32 | 54.17 | 43.10 | 0.00 | 83.33 | 10.26 | 61.36 | 0.00 | 0.00 | 0.00 | 0.00 | 0.00 | 0.00 |
| Chr12 | 32.47 | 51.67 | 37.93 | 0.00 | 77.78 | 7.69 | 50.00 | 0.00 | 0.00 | 14.29 | 0.00 | 0.00 | 0.00 |
| Chr13 | 60.00 | 100.00 | 58.62 | 14.29 | 88.89 | 28.21 | 97.73 | 14.29 | 0.00 | 0.00 | 0.00 | 0.00 | 14.29 |
| Chr14 | 65.19 | 57.50 | 84.48 | 97.14 | 88.89 | 89.74 | 75.00 | 0.00 | 33.33 | 14.29 | 100.00 | 0.00 | 57.14 |
| Chr15 | 62.86 | 62.50 | 84.48 | 77.14 | 55.56 | 92.31 | 72.73 | 28.57 | 0.00 | 0.00 | 100.00 | 2.94 | 42.86 |
| Div | 0.096 | 0.189 | 0.444 | 0.209 | 0.3914 | 0.206 | 0.000 | 0.222 | 0.286 | 0.000 | 0.337 | 0.571 | |
| No.Ind | 385 | 120 | 58 | 35 | 18 | 39 | 44 | 7 | 9 | 7 | 7 | 34 | 7 |
Private haplotypes are those found in a single population. Based on this definition, 30 private haplotypes were observed in seven of the populations (Supplementary Table 2). The South Asian (Pop11) and Abyssinian (Pop10) populations contained 48% and 20% of the private haplotypes, respectively (Fig. 3). The most frequently observed private haplotype was Chr14: Hap1 which was present in 97% of the accessions of the South Asian population (Pop11) representing 8.6% of all accessions (Supplementary Table 2). The highest gene diversity was in Pop12 followed by Pop5 which putatively originated from Mediterranean Portugal and Turkey regions respectively (Supplementary Table 1). In contrast, Pop7 and Pop10 displayed no diversity (Table 2).
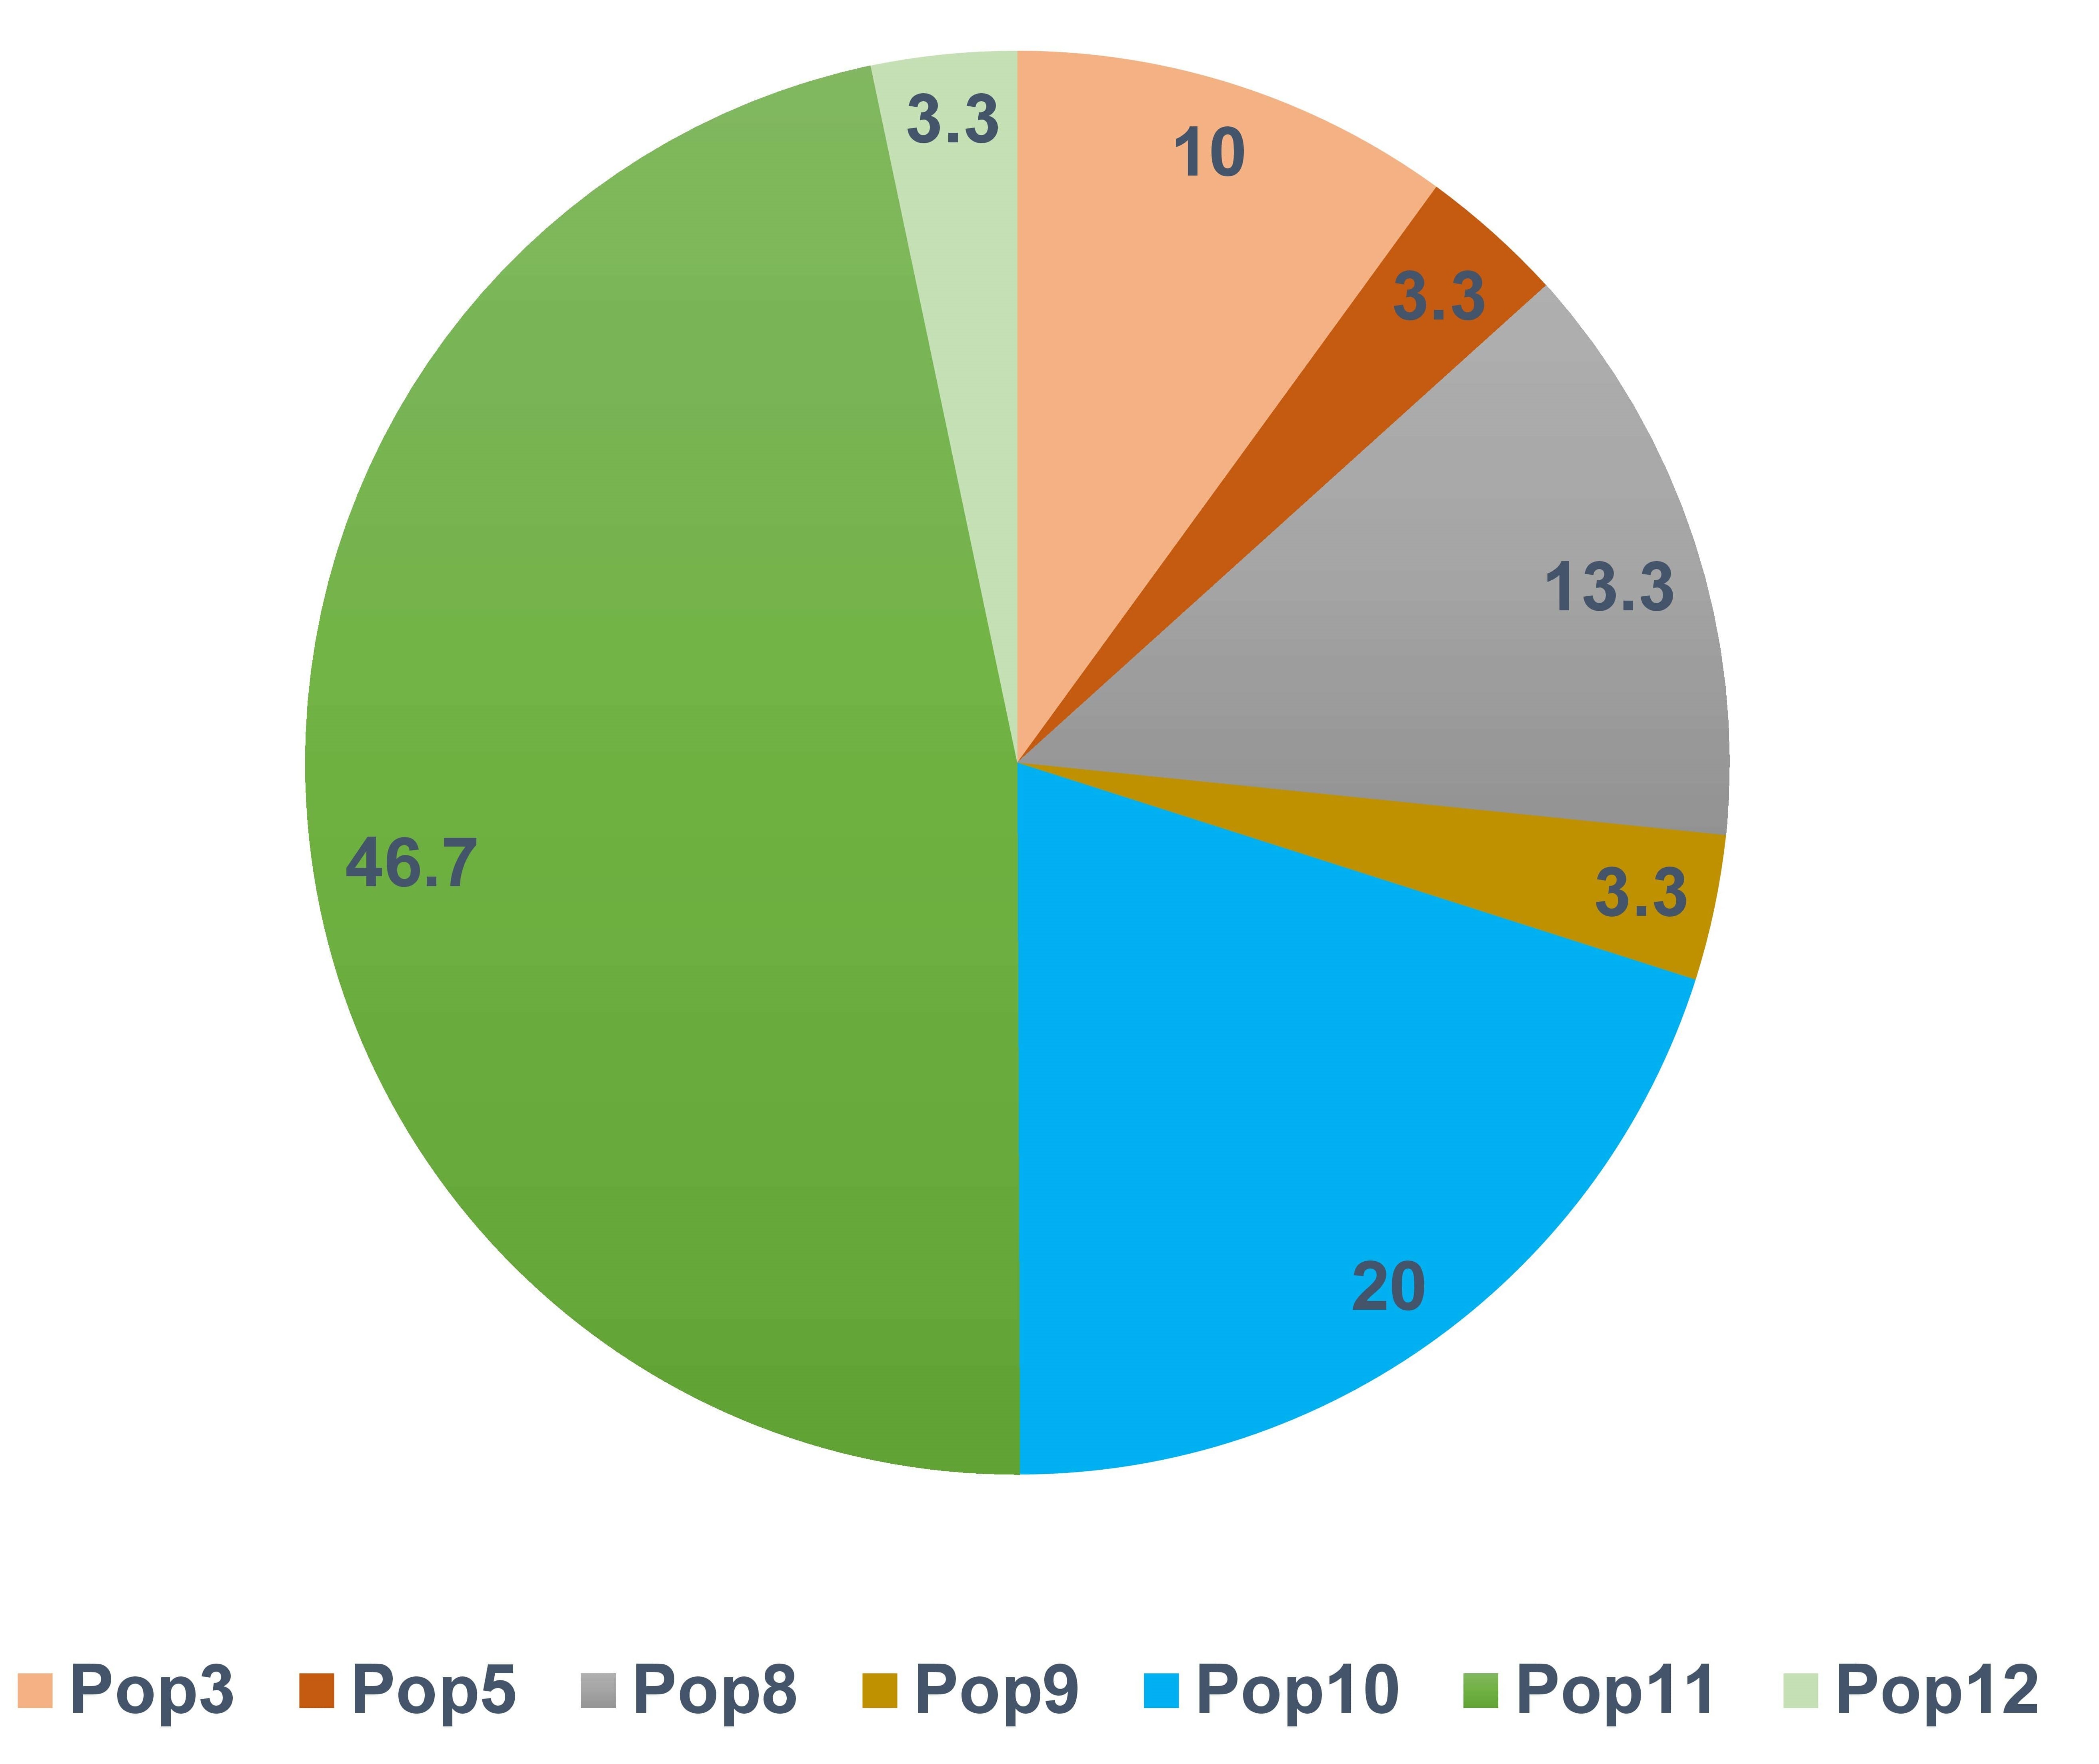 Fig. 3.
Frequency distribution of private haplotypes by population. Only seven of the 12 populations had private haplotypes.
A total of 19 outliers were detected, including six on chromosomes 1, 8, 9 and
12 that were detected in all three datasets with both PCADAPT and
F
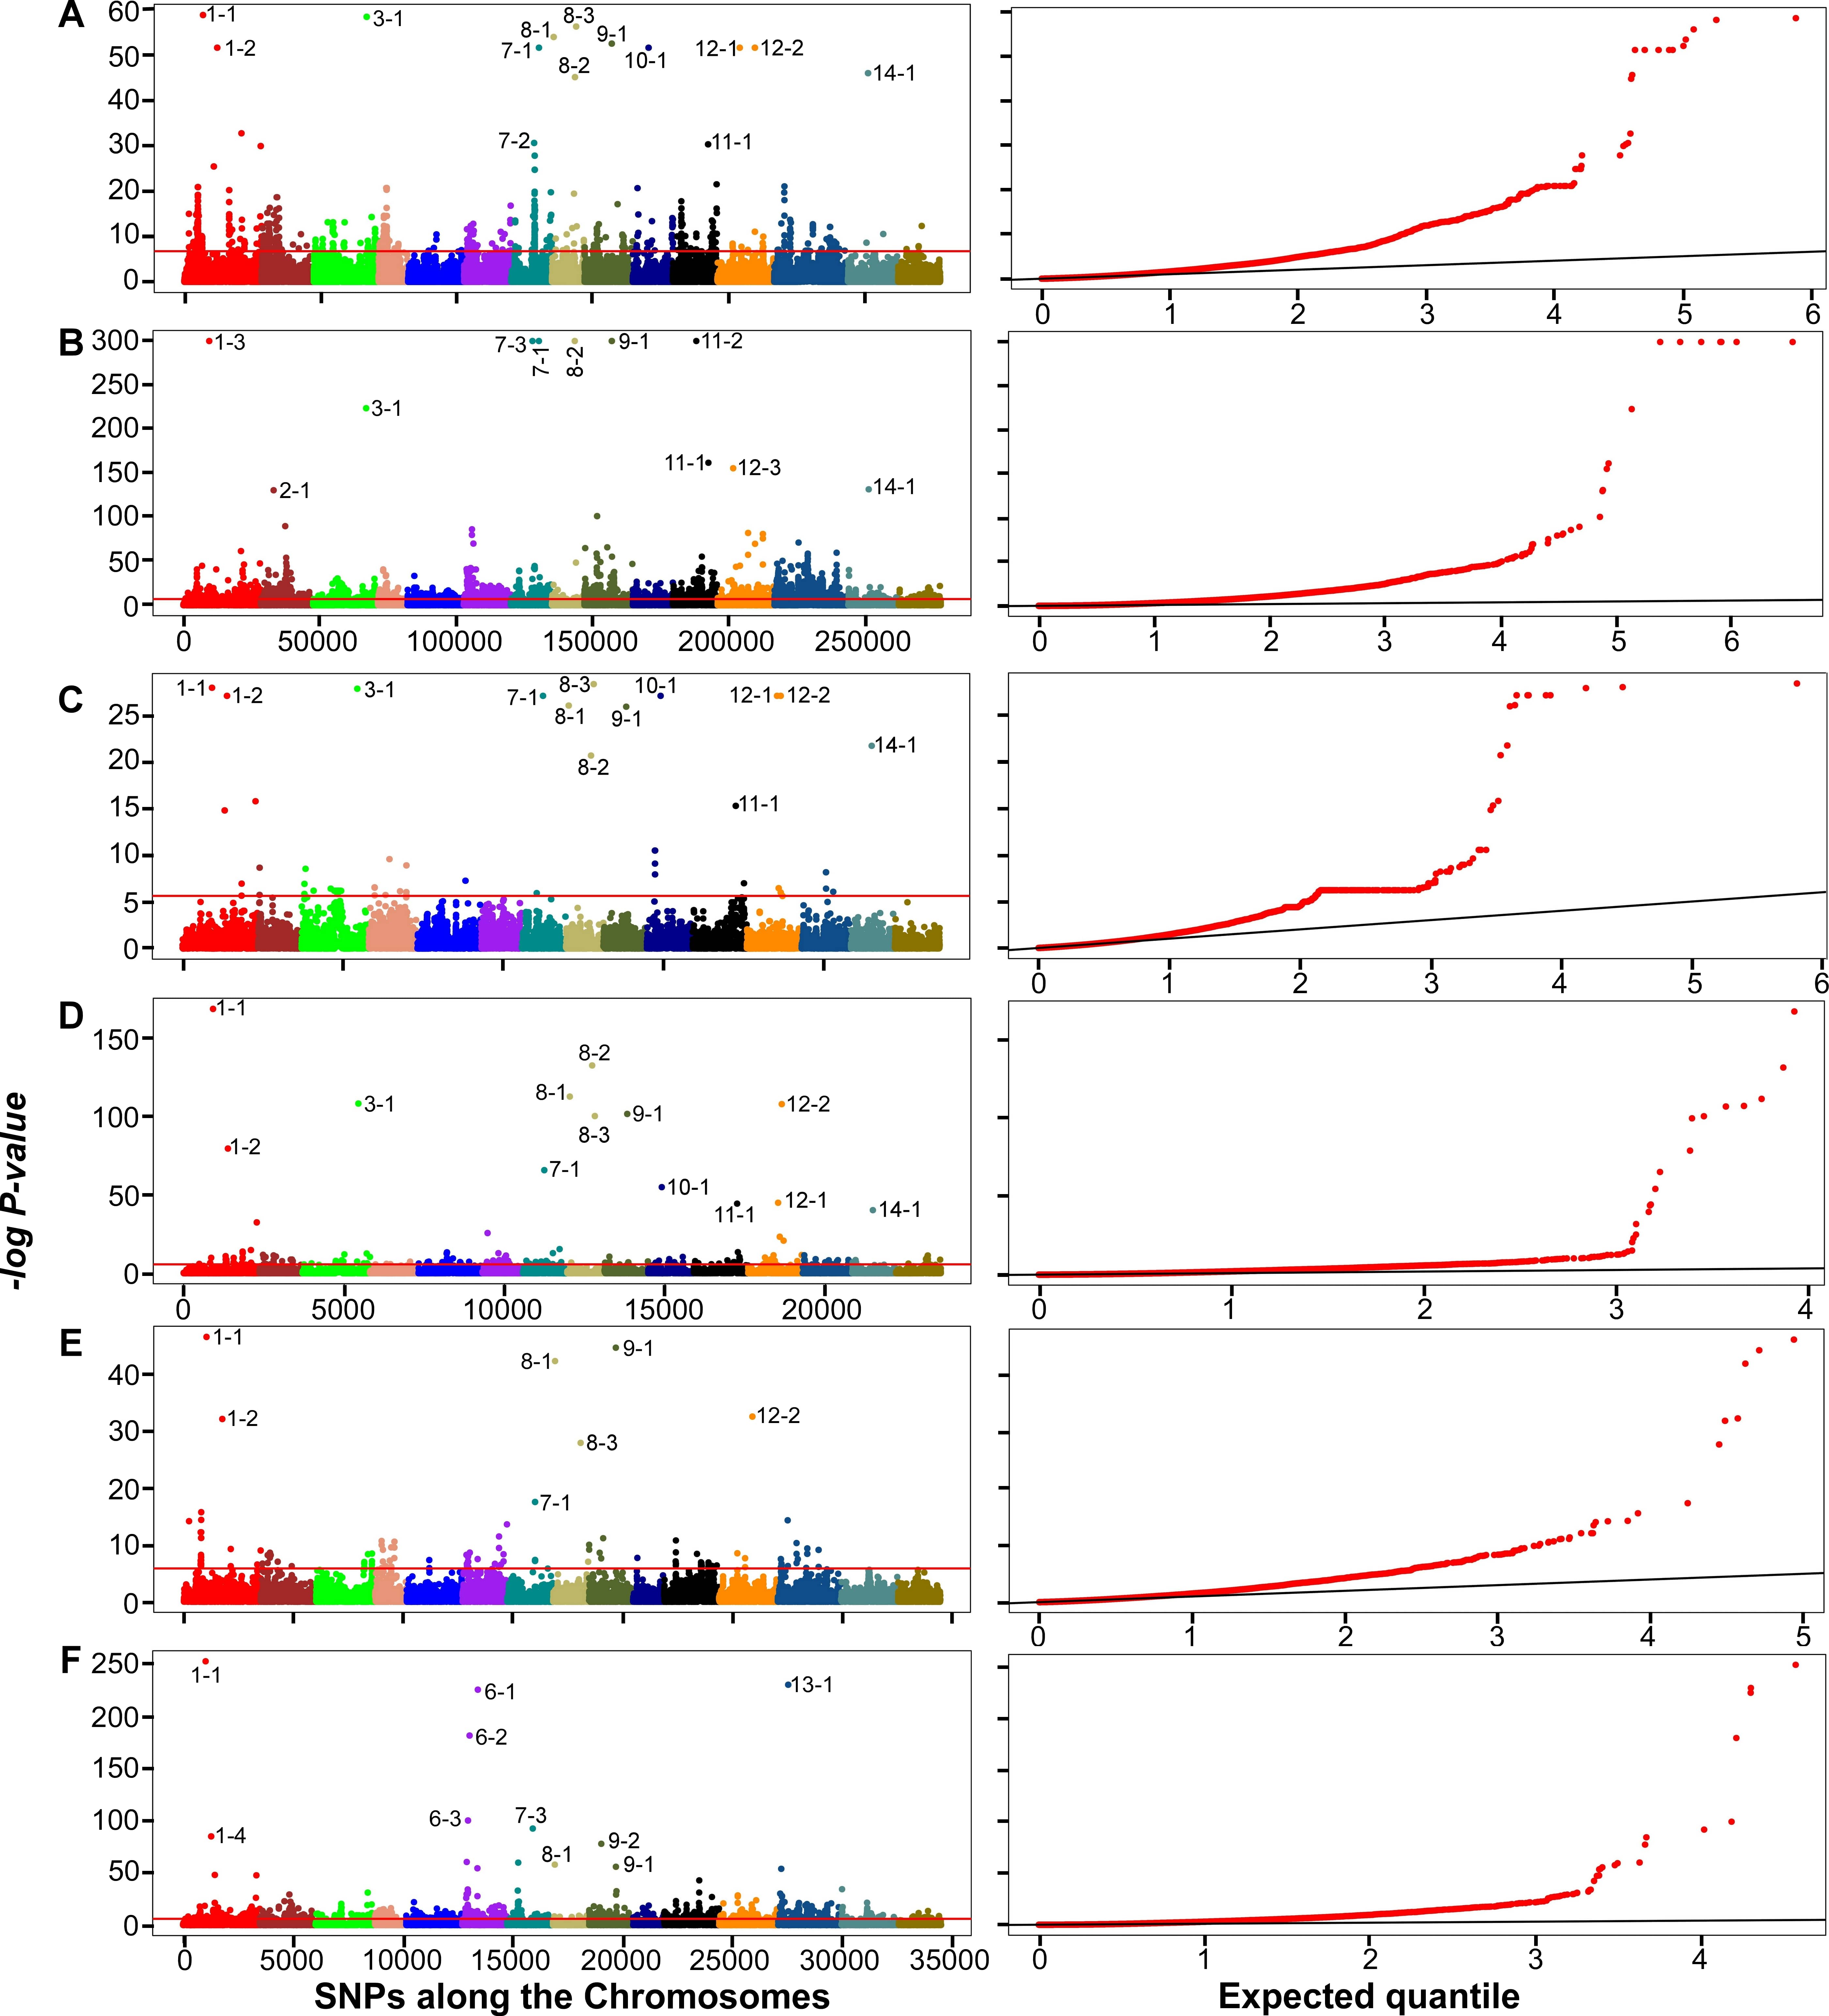 Fig. 4.
Manhattan plots (left panels) and quantile-quantile (Q-Q) plots
(right panels) of genome-wide associations using PCADAPT (A,C,E) and
F
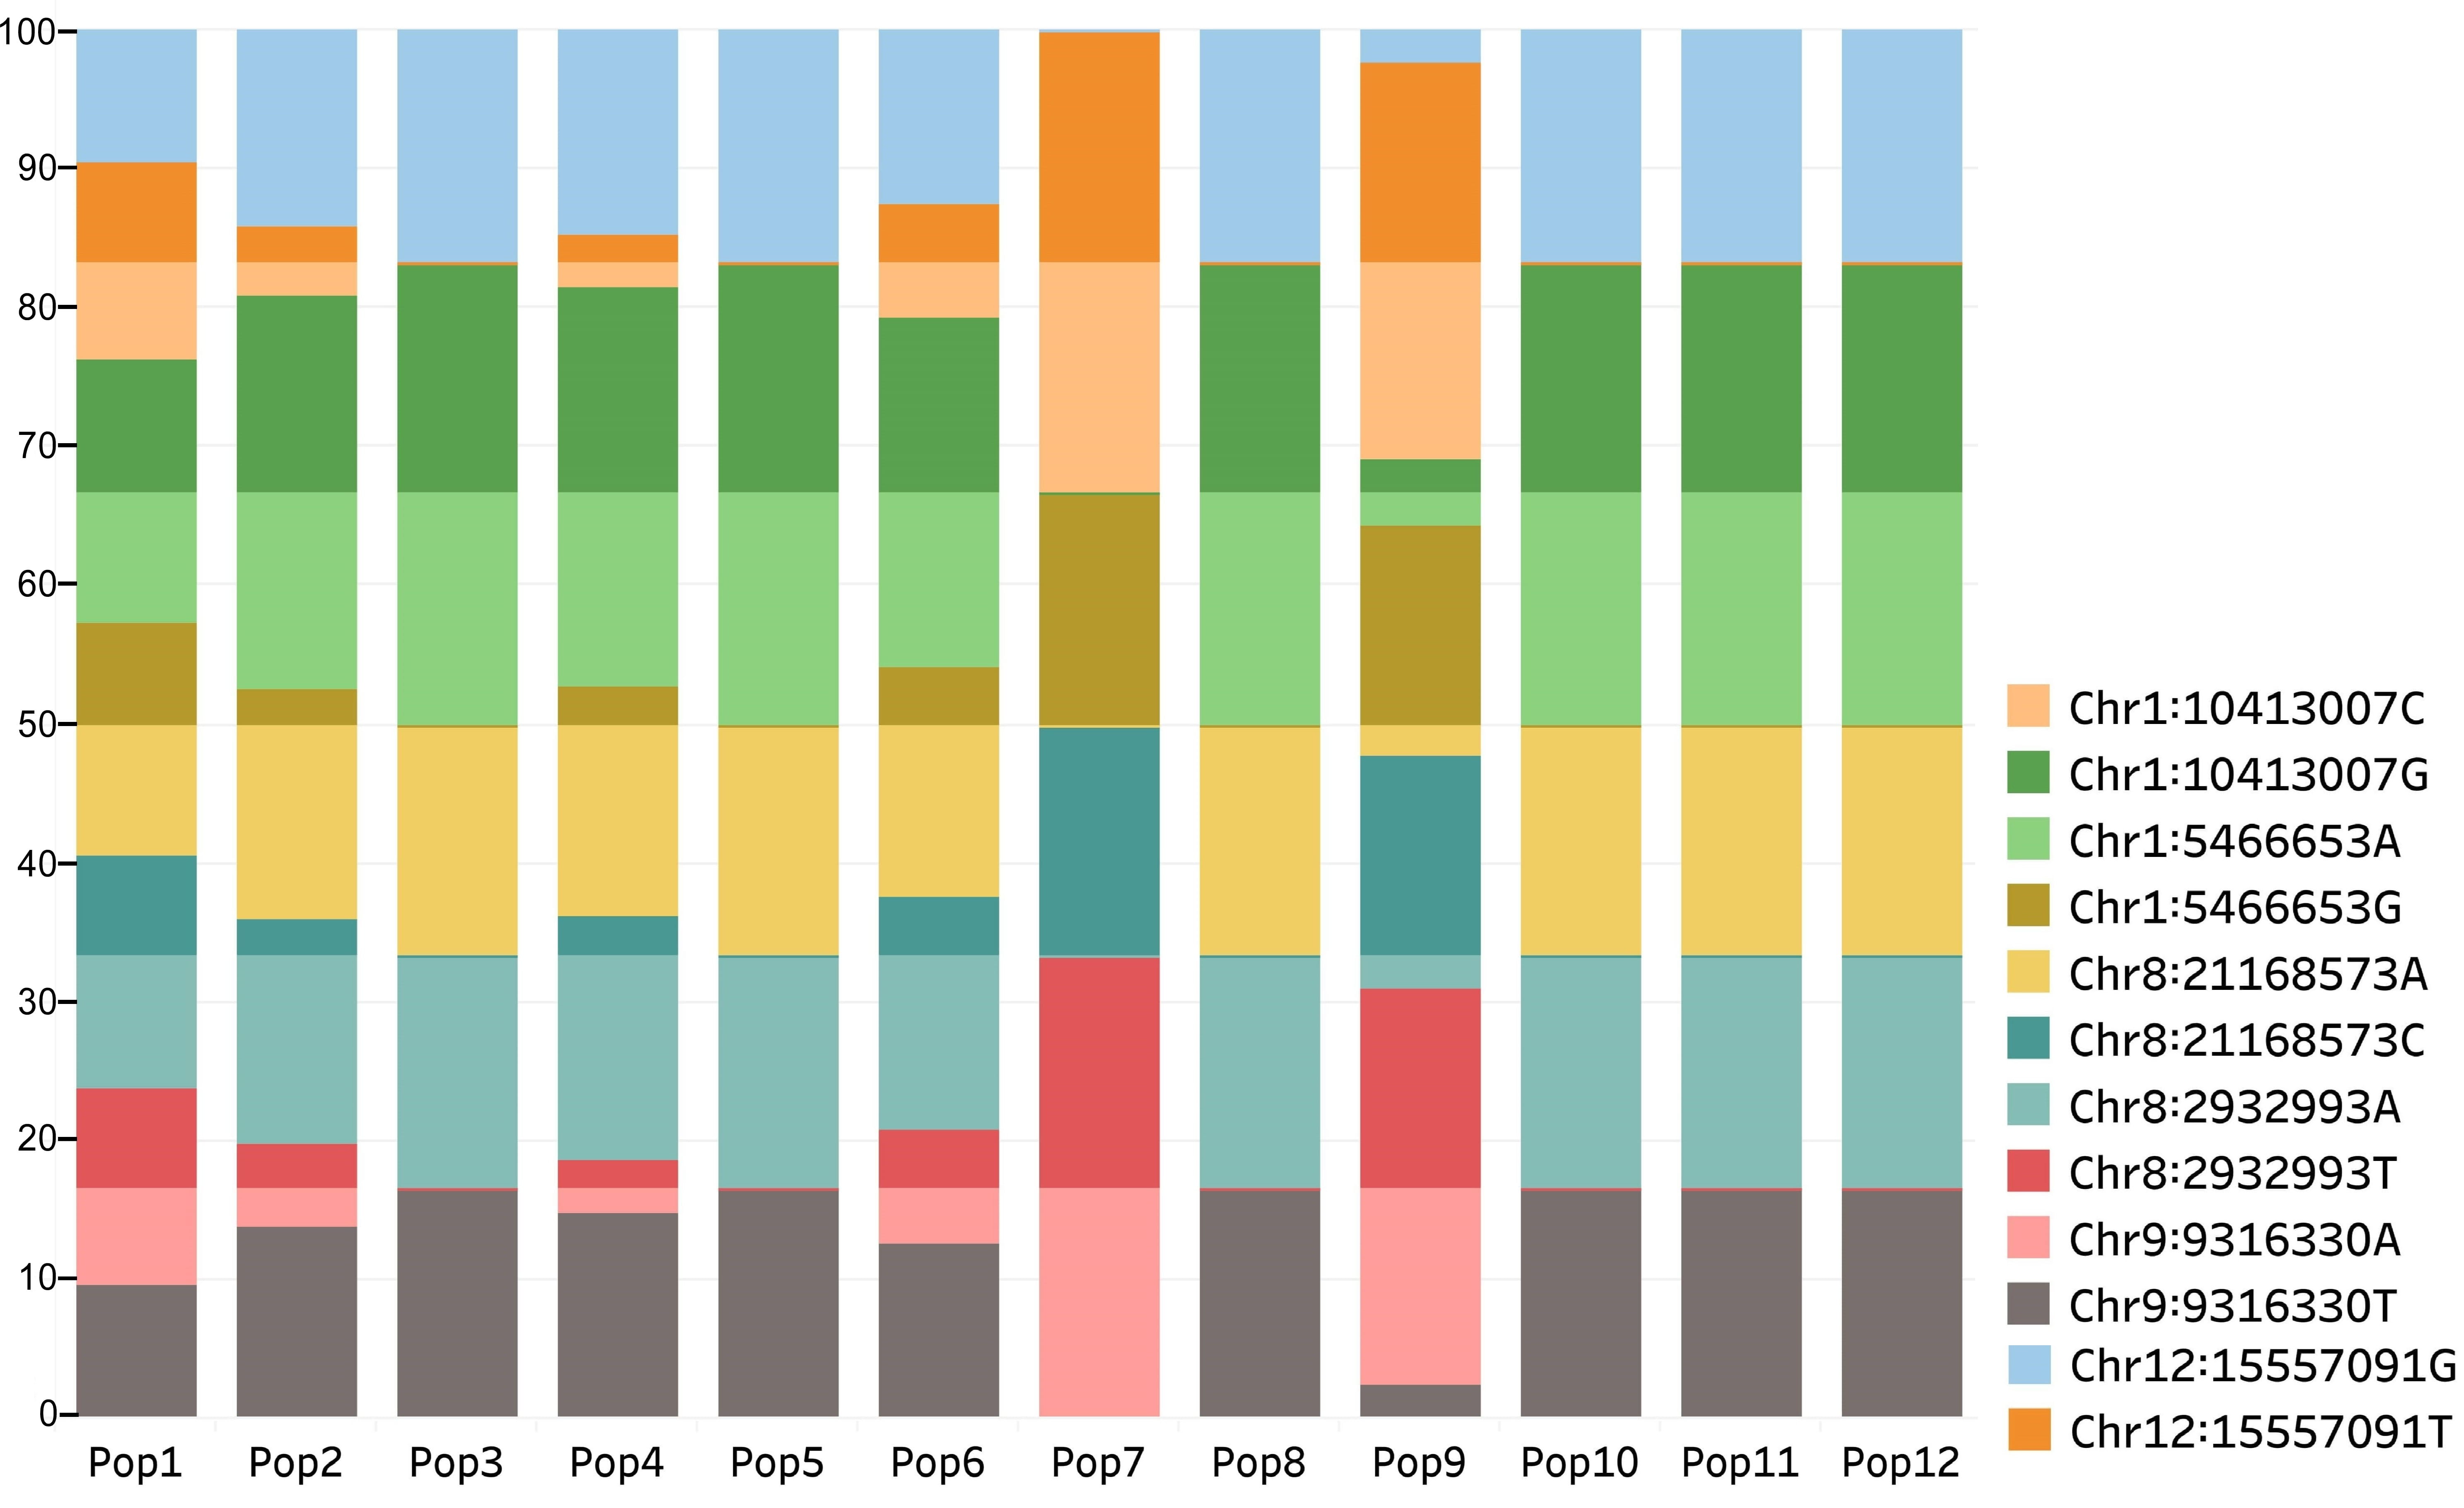 Fig. 5.
Distribution of alleles at loci detected in the three SNP datasets among the populations. Populations from old flax growing region (Pop3, 5, 7–12) displayed a higher frequency of one of the alleles at each locus than the remaining populations from relatively newer flax growing regions.
PC-based genome scan of the 34K dataset detected several significant SNPs on
chromosome 1 between positions 3612570 and 3671655 (Fig. 4) with
p-values between 2.1
GEA based on PC1 associated with latitude, average day-length and temperature during the cropping season performed using the assigned coordinates of the population resulted in significant SNPs on chromosomes 3, 7, 9 and 13 (Fig. 6). The significant locus at Chr3:16799360 harbored multiple candidate genes for flowering time regulation, including the AT2G29950 ortholog Lus10040667 that is predicted to be an EARLY FLOWERING LOCUS-LIKE1 (ELF4-L1) gene (Table 3). The locus Chr7:16799360 contains AT1G67170 ortholog Lus10015495 that is predicted to encode a FLOWERING LOCUS C EXPRESSOR-LIKE 2 (FLL2) gene (Table 3).
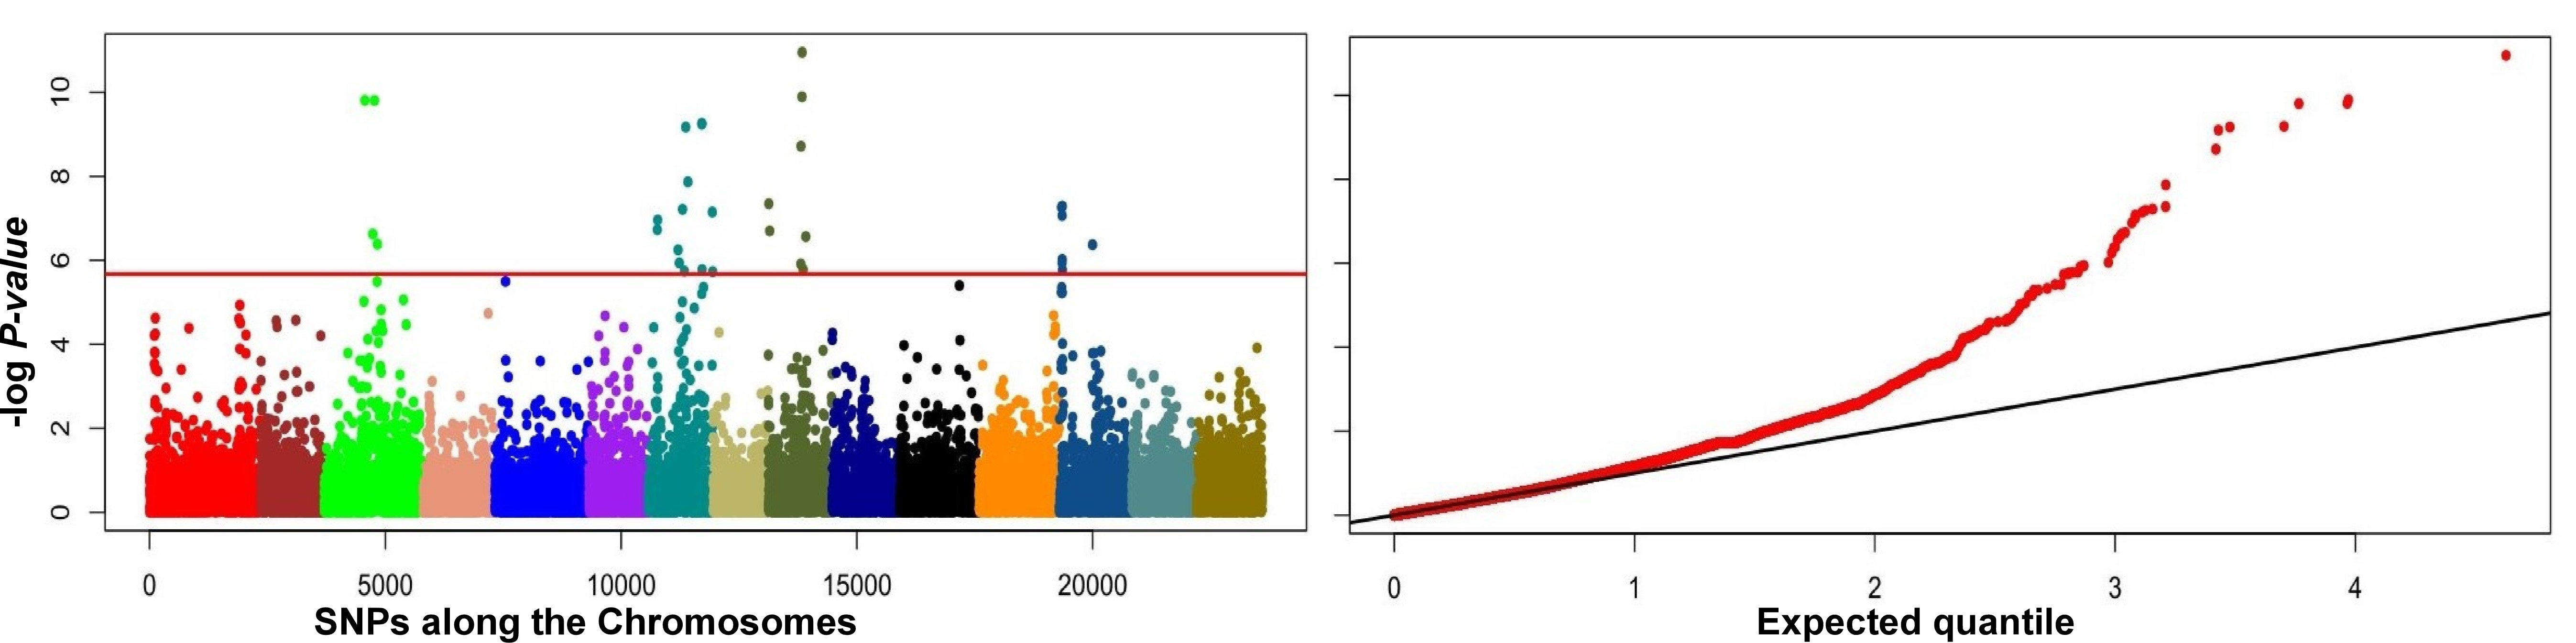 Fig. 6.
Manhattan and quantile-quantile (Q-Q) plots of the first principal component (PC) for latitude, day-length and temperature of the cropping seasons using the genome-wide 23K SNP dataset showing outliers on four of the 15 flax chromosomes.
| Outlier SNP | p value | Candidate gene | Gene position | Arabidopsis ortholog | Gene annotation |
| Chr3:6169770 | 5.4 |
Lus10040667 | 6206833-6207246 | AT2G29950 | ELF4-L1 |
| Chr3:9175844 | 1.0 |
||||
| Chr7:16799360 | 4.0 |
Lus10015495 | 16806888-16808239 | AT1G67170 | FLL2 |
| Chr7:16798937 | 4.1 |
||||
| Chr9:11962263 | 4.4 |
Lus10028960 | 1178447-1180169 | AT5G57280 | RID2 |
| Chr9:11798402 | 5.3 |
||||
| Chr13:878058 | 5.1 |
||||
| Chr13:10377859 | 4.1 |
Lus10010694 | 1019336-1020295 | AT2G02540 | HB21/ZFHD4 |
| Lus10010693 | 1025094-1025489 | AT2G02540 | HB21/ZFHD5 |
Understanding the adaptation of genotypes to environmental gradients is important for breeding and conservation [50]. Natural selection in a wide-range of environmental gradients leads to genetic divergence and selection of adapted variants [51]. Environmental variations along the latitudinal gradient are major forces of selection that lead to genetic divergence in plants [52]. Phenological variations are some of the better known patterns in plants along the latitudinal biosphere [53]. Flax is a species that spread through nearly the full span of crops’ latitudinal range, being grown from the low latitude of the East African highlands to the high latitude of temperate regions, as well as from the warm South Asian to the cool Eurasian climates. Apart from natural selection, anthropogenic influences, such as selection and germ introduction into new niches, also play major roles in the success and spread of crop plants, including flax [31]. This study provides insights into genetic signatures of global scale adaptation of flax across its wide range of habitats.
The genetic structure observed in this experiment is consistent with what was establish in previous works, which demonstrated the clustering of accessions attributed to their eco-geographic origin [31, 54]. The relatively high differentiation and high concentration of private haplotypes in populations dominated by South Asian accessions may suggest the adaptation of the crop to warm regions [55, 56]. This is unlike the cool and/or temperate habitats where flax is widely grown [57]. Flax in this warm South Asian region might also be adapted to short-day photoperiod given that flax accessions from this region differ from the common flax adapted to grow under the long-day seasons of most cooler regions [56, 58]. In a similar way, the higher rate of private haplotypes in the Abyssinian population may be attributable to adaptation of the crop to the equatorial region, with equinox effects, elevation-induced cool temperate climate and windstorms [31, 59]. Despite the high private haplotype concentration, the low gene diversity in the Abyssinian population may suggest effect of genetic drift [60]. The lack of private haplotypes in some populations such as Pop1, 2, 4, and 6, dominated by Eurasian and Canadian accessions, can be due to introduction of materials of different origins, selection of dual flax types (both fiber and oil) or through hybridization with wider germplasm in breeding programs [31, 61].
The outlier loci harbored genes of known roles for local adaptation. Most loci
detected using the PCADAPT and F
The ELF4-L4 gene at Chr7:10407650 locus plays a significant role in circadian clocking [76] and flowering time [77], which are both affected by day-length, and consequently, latitude. The tandemly repeated FBX92 genes at Chr8:2932993 locus can also be important signatures of adaptation of flax to varying environmental factors along its latitudinal gradient. FBX92 mediates responses to different abiotic stresses including light [78]. The FBX92 protein affects leaf sizes in Arabidopsis [79], which may contribute to adaptation to latitude-induced abiotic stresses such as temperature [80]. The multiple copies of the UGT87A gene at locus Chr1:3612570 and Chr1:3671655 might also play an important role in flowering time regulation and abiotic stress response. In Arabidopsis, UGT87A2 mutants overexpressing the flowering repressor FLOWERING LOCUS C (FLC) had delayed flowering times regardless of the duration of the day-length [81]. UGT87A2 is also involved in plant adaptation to osmotic stresses, including drought and salinity, via regulation of multiple genes mediating responses to these stresses [82]. The Chr1:3612570-3671655 locus harbors multiple copies of the UGT87A2 gene which may suggest its involvement in flax adaptation through regulation of stress responses [81, 82]. Other outlier loci also harbored genes of importance for local adaptation. For example, Lus10042995 and Lus10042996 were predicted to be orthologous to ethylene response factors ERF106 (AT5G07580) and ERF105 (AT5G51190), respectively. The former is DECREASE WAX BIOSYNTHESIS2 (DEWAX2) that negatively regulates cuticular biosynthesis [83], and, as such, adversely impacts cuticular wax-related tolerance to abiotic stresses such as drought [84]. In contrast, the latter (ERF105) is a transcription factor involved in freezing tolerance [85]. Moisture availability and temperature are among the major factors that shaped the genetic structure of flax, and they constitute major determinants of the success of the crop in its current eco-geographic regions [31], which span the warm semi-arid Indian subcontinent [55, 86] to the relatively cool and humid temperate Eurasian regions [87].
Most of the outlier SNP loci that are associated with the PC1 of major environmental factors such as cropping season day-length, temperature and latitude, also harbored important genes with known roles in adaptive divergence of plants along eco-geographic gradients. The ELF4-L1 orthologous gene at Chr3:6169770 locus is predicted to regulate circadian rhythm and flowering time [88, 89], suggesting the adaptive signature of this locus in flax. Chr7:16799360, which marks the locus harboring the predicted FLOWERING LOCUS C EXPRESSOR-LIKE 2 (FLL2) gene, is another crucial latitudinal gradient adaptation signature. FLLs have been reported for their role in the regulation of FLOWERING LOCUS C (FLC) and vernalisation [90, 91]. The AT2G02540 orthologous genes Lus10010693 and Lus10010694 at the Chr13:10377859 locus also mediate flowering time via positive regulation of FLC [92, 93]. Flax is a “long-day” plant whose flowering time can be determined by both photoperiod and vernalisation [94]. The strong association between loci harboring genes that regulate flowering time and vernalisation suggests the importance of these loci for genetic divergence, which allowed flax to expand to vast geographic regions. Since GEA was performed based on representative putative locations, validation using materials of known and precise geographic coordinates and associated site factors such as climatic, edaphic and biodiversity records, remains warranted.
The F
DS and SC conceived the project. DS and SC designed and conducted the research. SC and FY generated the SNP. DS performed the data analysis. DS prepared the manuscript. SC and FY revised the manuscript.
Not applicable.
We thank Nick Manseau, Madeleine Lévesque-Lemay and Tara Edwards for editorial inputs.
This Agri-Innovation Project (J-000279) was funded by the Flax Council of Canada and Agriculture and Agri-Food Canada.
The authors declare no conflict of interest.
Supplementary material associated with this article can be found, in the online version, at https://www.imrpress.com/journal/FBL/26/12/10.52586/5049.