


 , Silvia Paciotti 1, Leonardo Gatticchi 2, Domenico Rizzo 3,4, Federico Paolini Paoletti 1, Marco Fragai 3,4,5, Lucilla Parnetti 1,*
1 Laboratory of Clinical Neurochemistry, Section of Neurology, Department of Medicine and Surgery, University of Perugia, 06132 Perugia, Italy
2 Section of Physiology and Biochemistry, Department of Medicine and Surgery, University of Perugia, 06132 Perugia, Italy
3 Magnetic Resonance Center (CERM), University of Florence, 50019 Sesto Fiorentino, Italy
4 Department of Chemistry “Ugo Schiff”, University of Florence, 50019 Sesto Fiorentino, Italy
5 Consorzio Interuniversitario Risonanze Magnetiche MetalloProteine (CIRMMP), 50019 Sesto Fiorentino, Italy
Abstract
Background: The prion-like misfolding and aggregation of
Keywords
- α-synuclein
- PMCA
- RT-QuIC
- SAAs
- Influencing factors
Parkinson’s disease (PD), the most common neurodegenerative movement disorder,
is pathologically characterized by the presence, in selectively vulnerable brain
regions, of intracytoplasmic and axonal inclusions, called Lewy bodies and Lewy
neurites, which consist of aggregates of misfolded
In
Kinetic modelling was performed to highlight the most contributing mechanisms of
Escherichia Coli BL21(DE3) Gold were transformed with pT7-7 vector
cloned with the gene encoding
Lyophilized aliquots of
Monomeric
To avoid problems related to biological variance of CSF samples, CSF aliquots
from a single female hydrocephalic patient of 67 years old were used in this
work. This patient showed no cognitive or motor impairment. Lumbar puncture was
performed according to international guidelines [45, 46]. Following a
standardized procedure, 12 mL of CSF were collected in a sterile polypropylene
tube and centrifuged at room temperature for 10 min (2000
To extract the position of inflection points, ThT fluorescence profiles were fitted with Boltzmann’s sigmoidal functions by using the non-linear fitting routine of OriginPro 9.0. Linear regression analyses were performed with the linear regression tool of Microsoft Excel.
We started our analysis by making simulations to understand the simplest kinetic
model that could explain the aggregation kinetics of
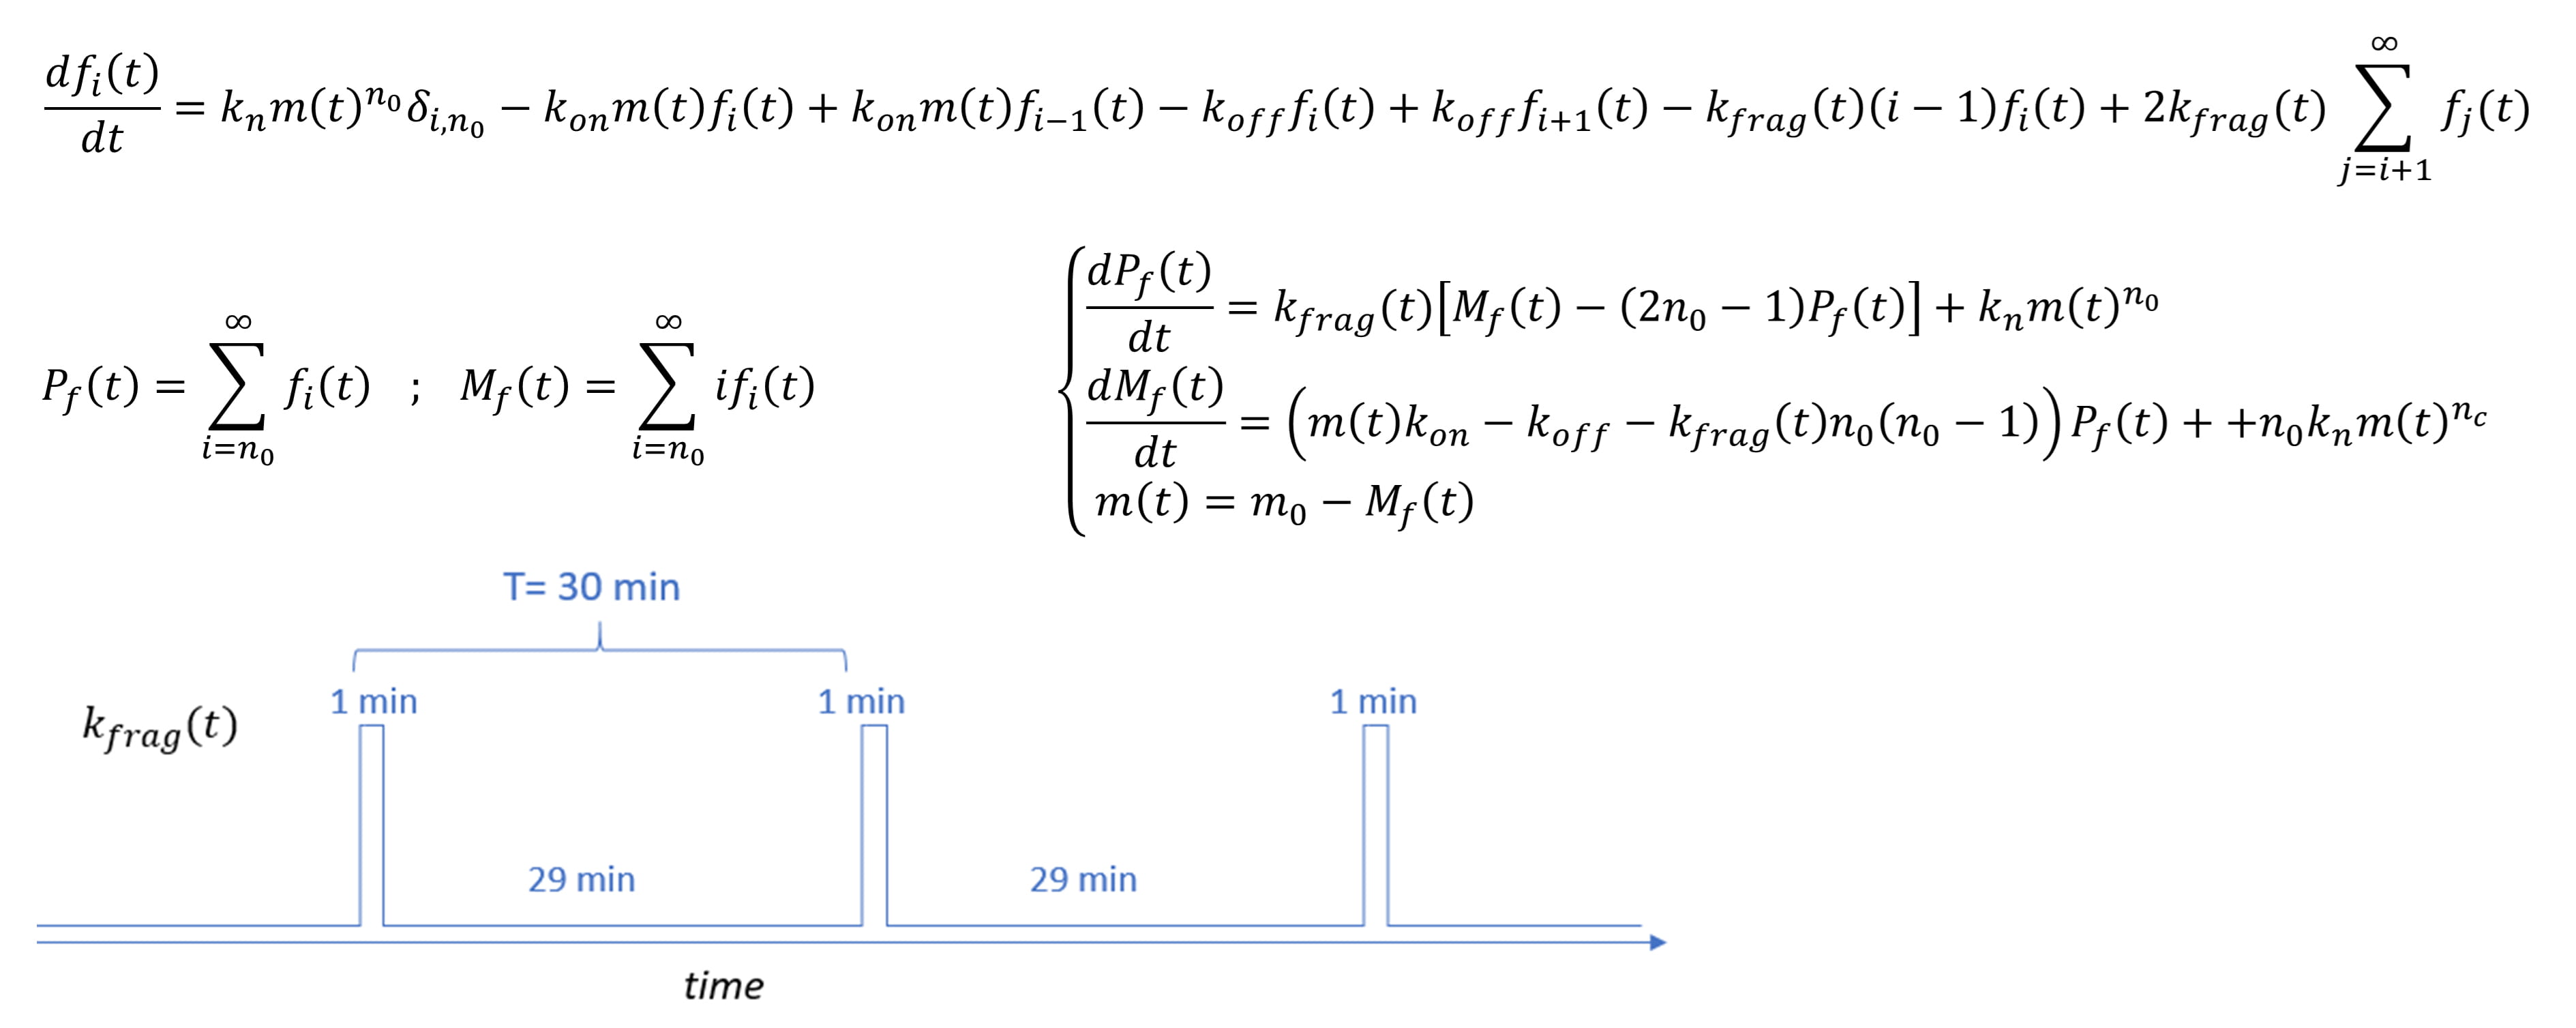 Fig. 1.
Description of the kinetic model used to interpret the
aggregation of
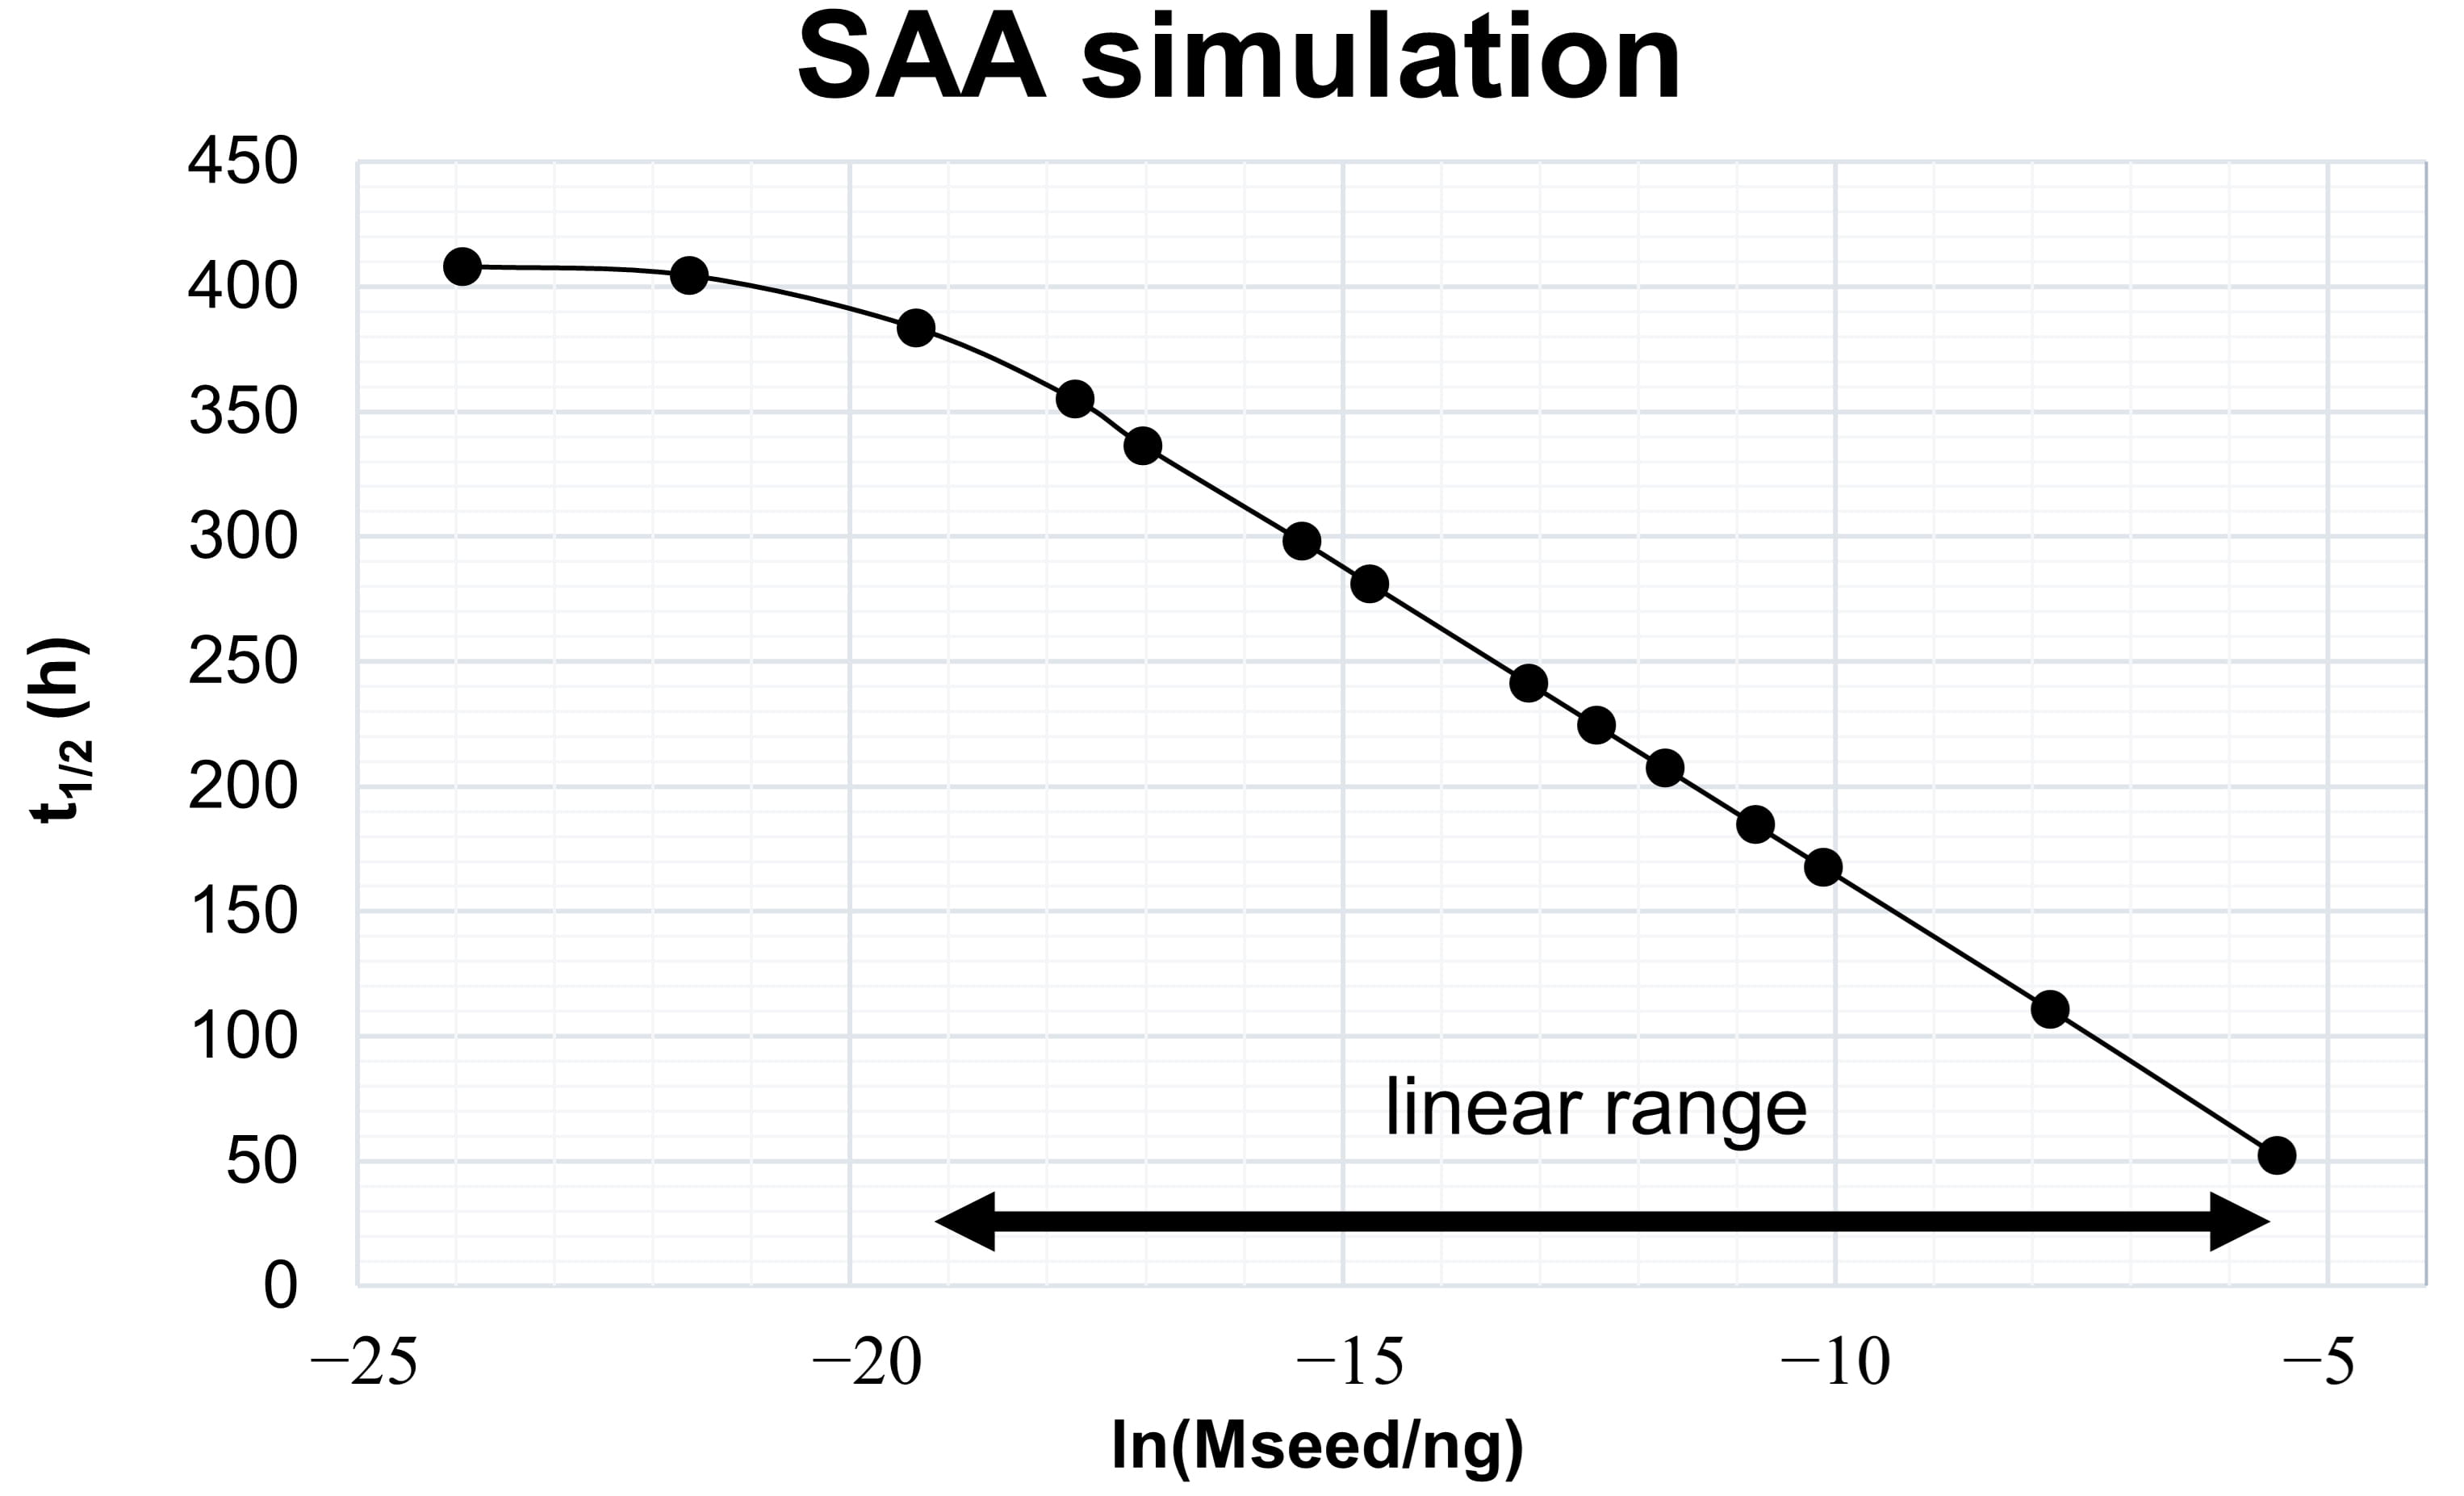 Fig. 2.
Kinetic model-derived relation between aggregate mass and
t
The simulated range of seed masses shown in Fig. 2 is arbitrary and not related to experimental values. The range of seed masses, for which it is possible to obtain this linear relation depends on the kinetic constants of the processes, which themselves depend on the nature of the protein-protein interaction and on experimental variables like temperature, pH, shaking cycles, protein concentrations and ionic strength. Optimizing the experimental variables, to maximize the differentiation between seed masses, is the first step in developing SAAs for the diagnosis of synucleinopathies.
We evaluated the impact on
The addition of glass beads to wells containing Thioflavin-T (ThT) and monomeric
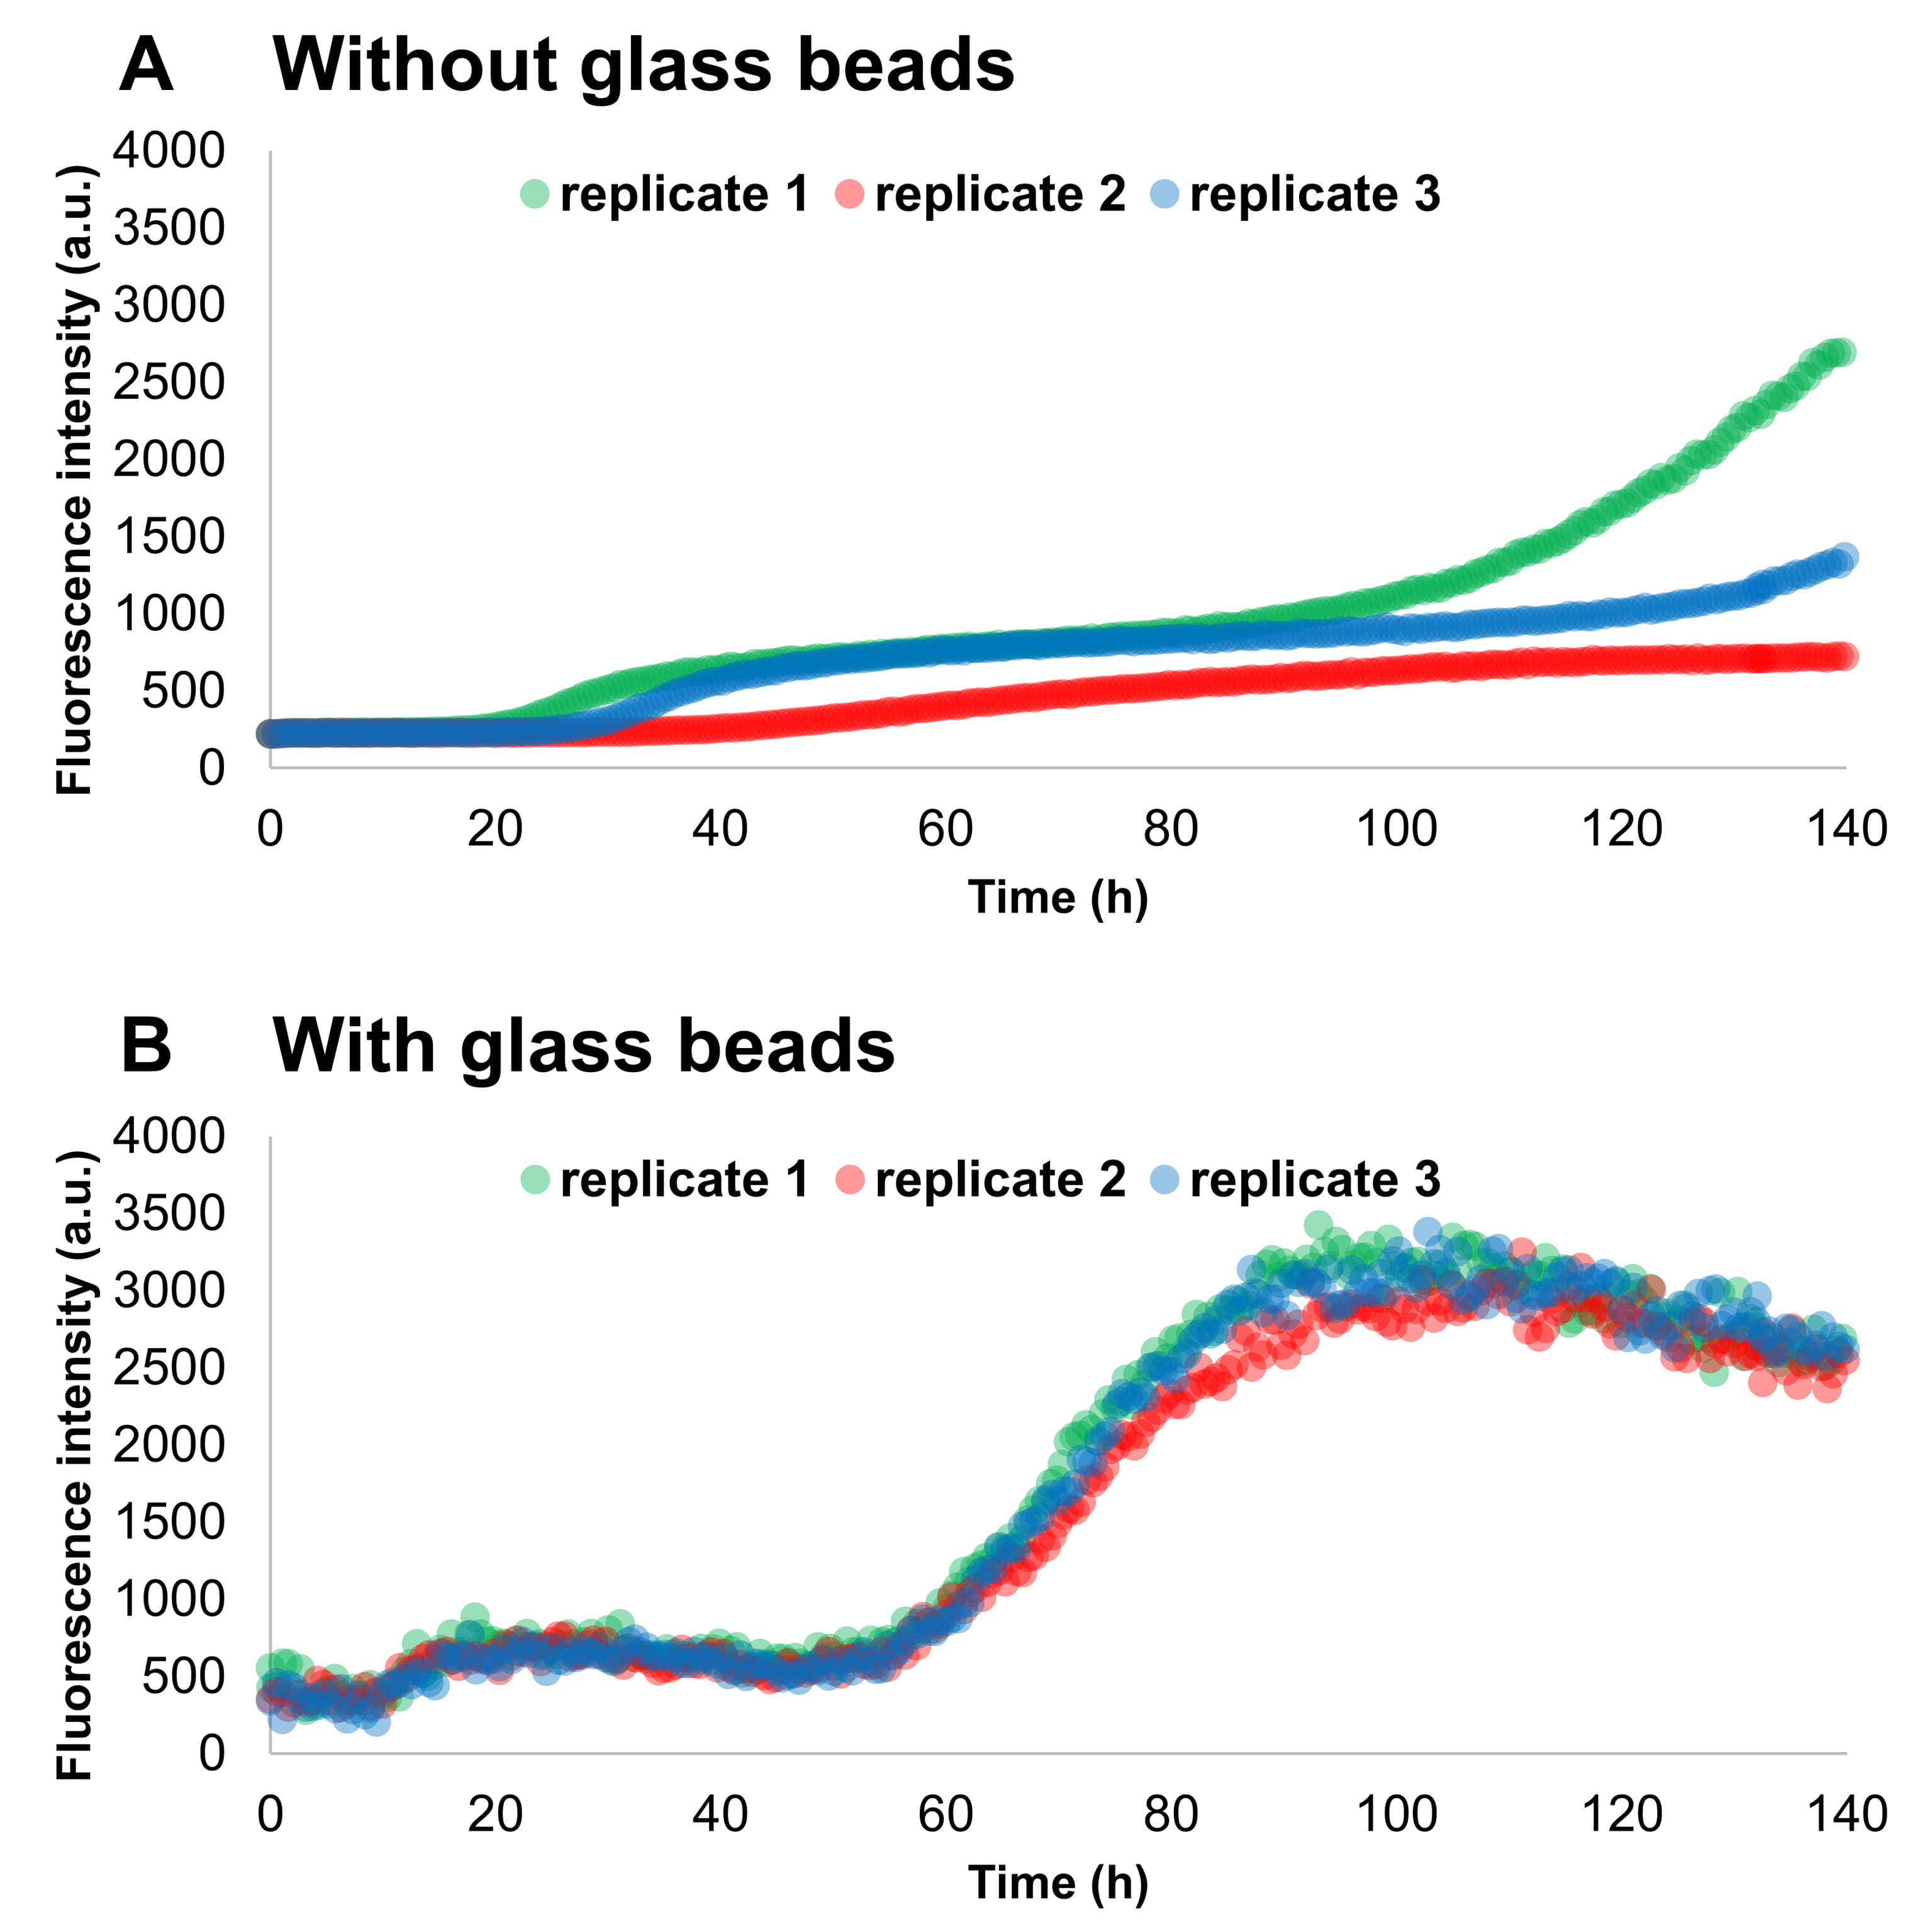 Fig. 3.
The addition of glass beads increases the reproducibility among
replicate samples in SAAs. Monomeric
A second experiment was performed to evaluate the impact of different size and
number of glass beads in three different buffers, the results are shown in Fig. 4.
From this image, it is possible to appreciate that a single bead of 3 mm of
diameter produced a faster aggregation with respect to 17 beads with a diameter
of 0.5 mm. Moreover, for any beads size and number, the aggregation of
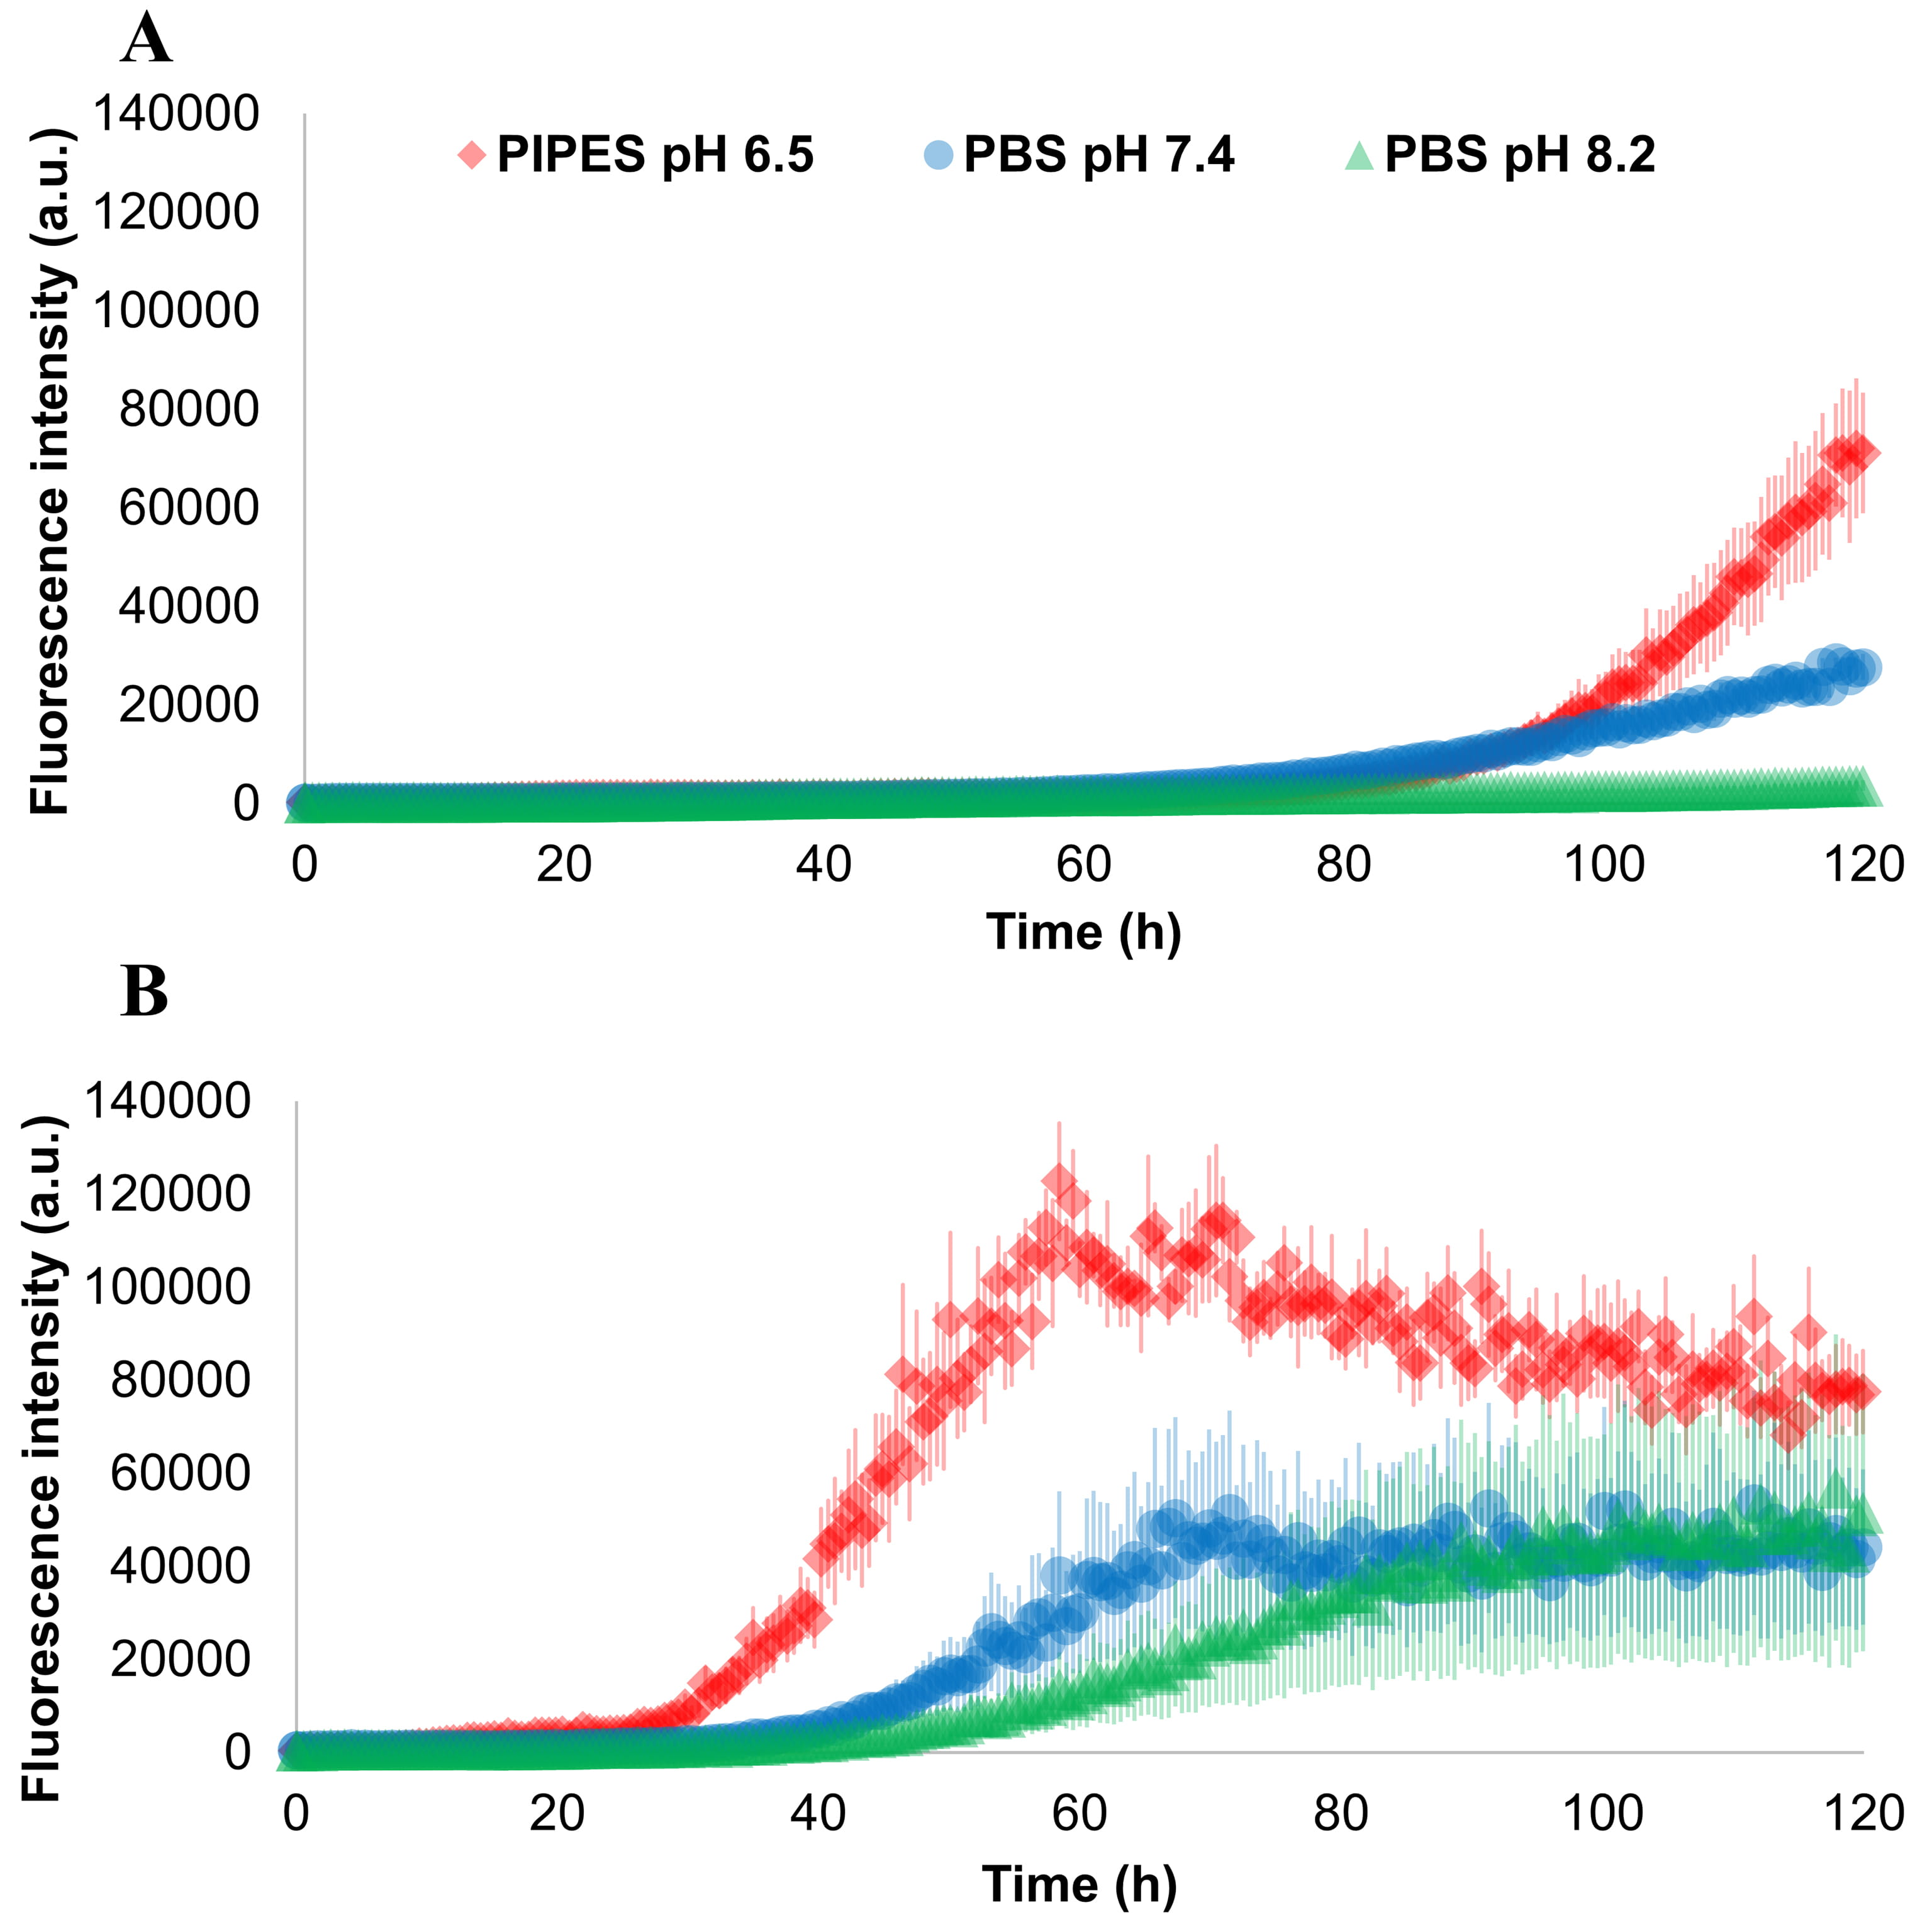 Fig. 4.
Effect of different buffers and beads on
CSF coming from a single hydrocephalus subject not suffering from
neurodegenerative diseases was subsequently added to the reaction mix. In this
way, we could test the different analytical variables on different aliquots from
the same subject without introducing effects linked to biological variance. The
detection limit and the ability to differentiate among seed masses were tested by
adding in-lab made preformed aggregates (seeds) in different quantity in each
well, the protocol used to produce
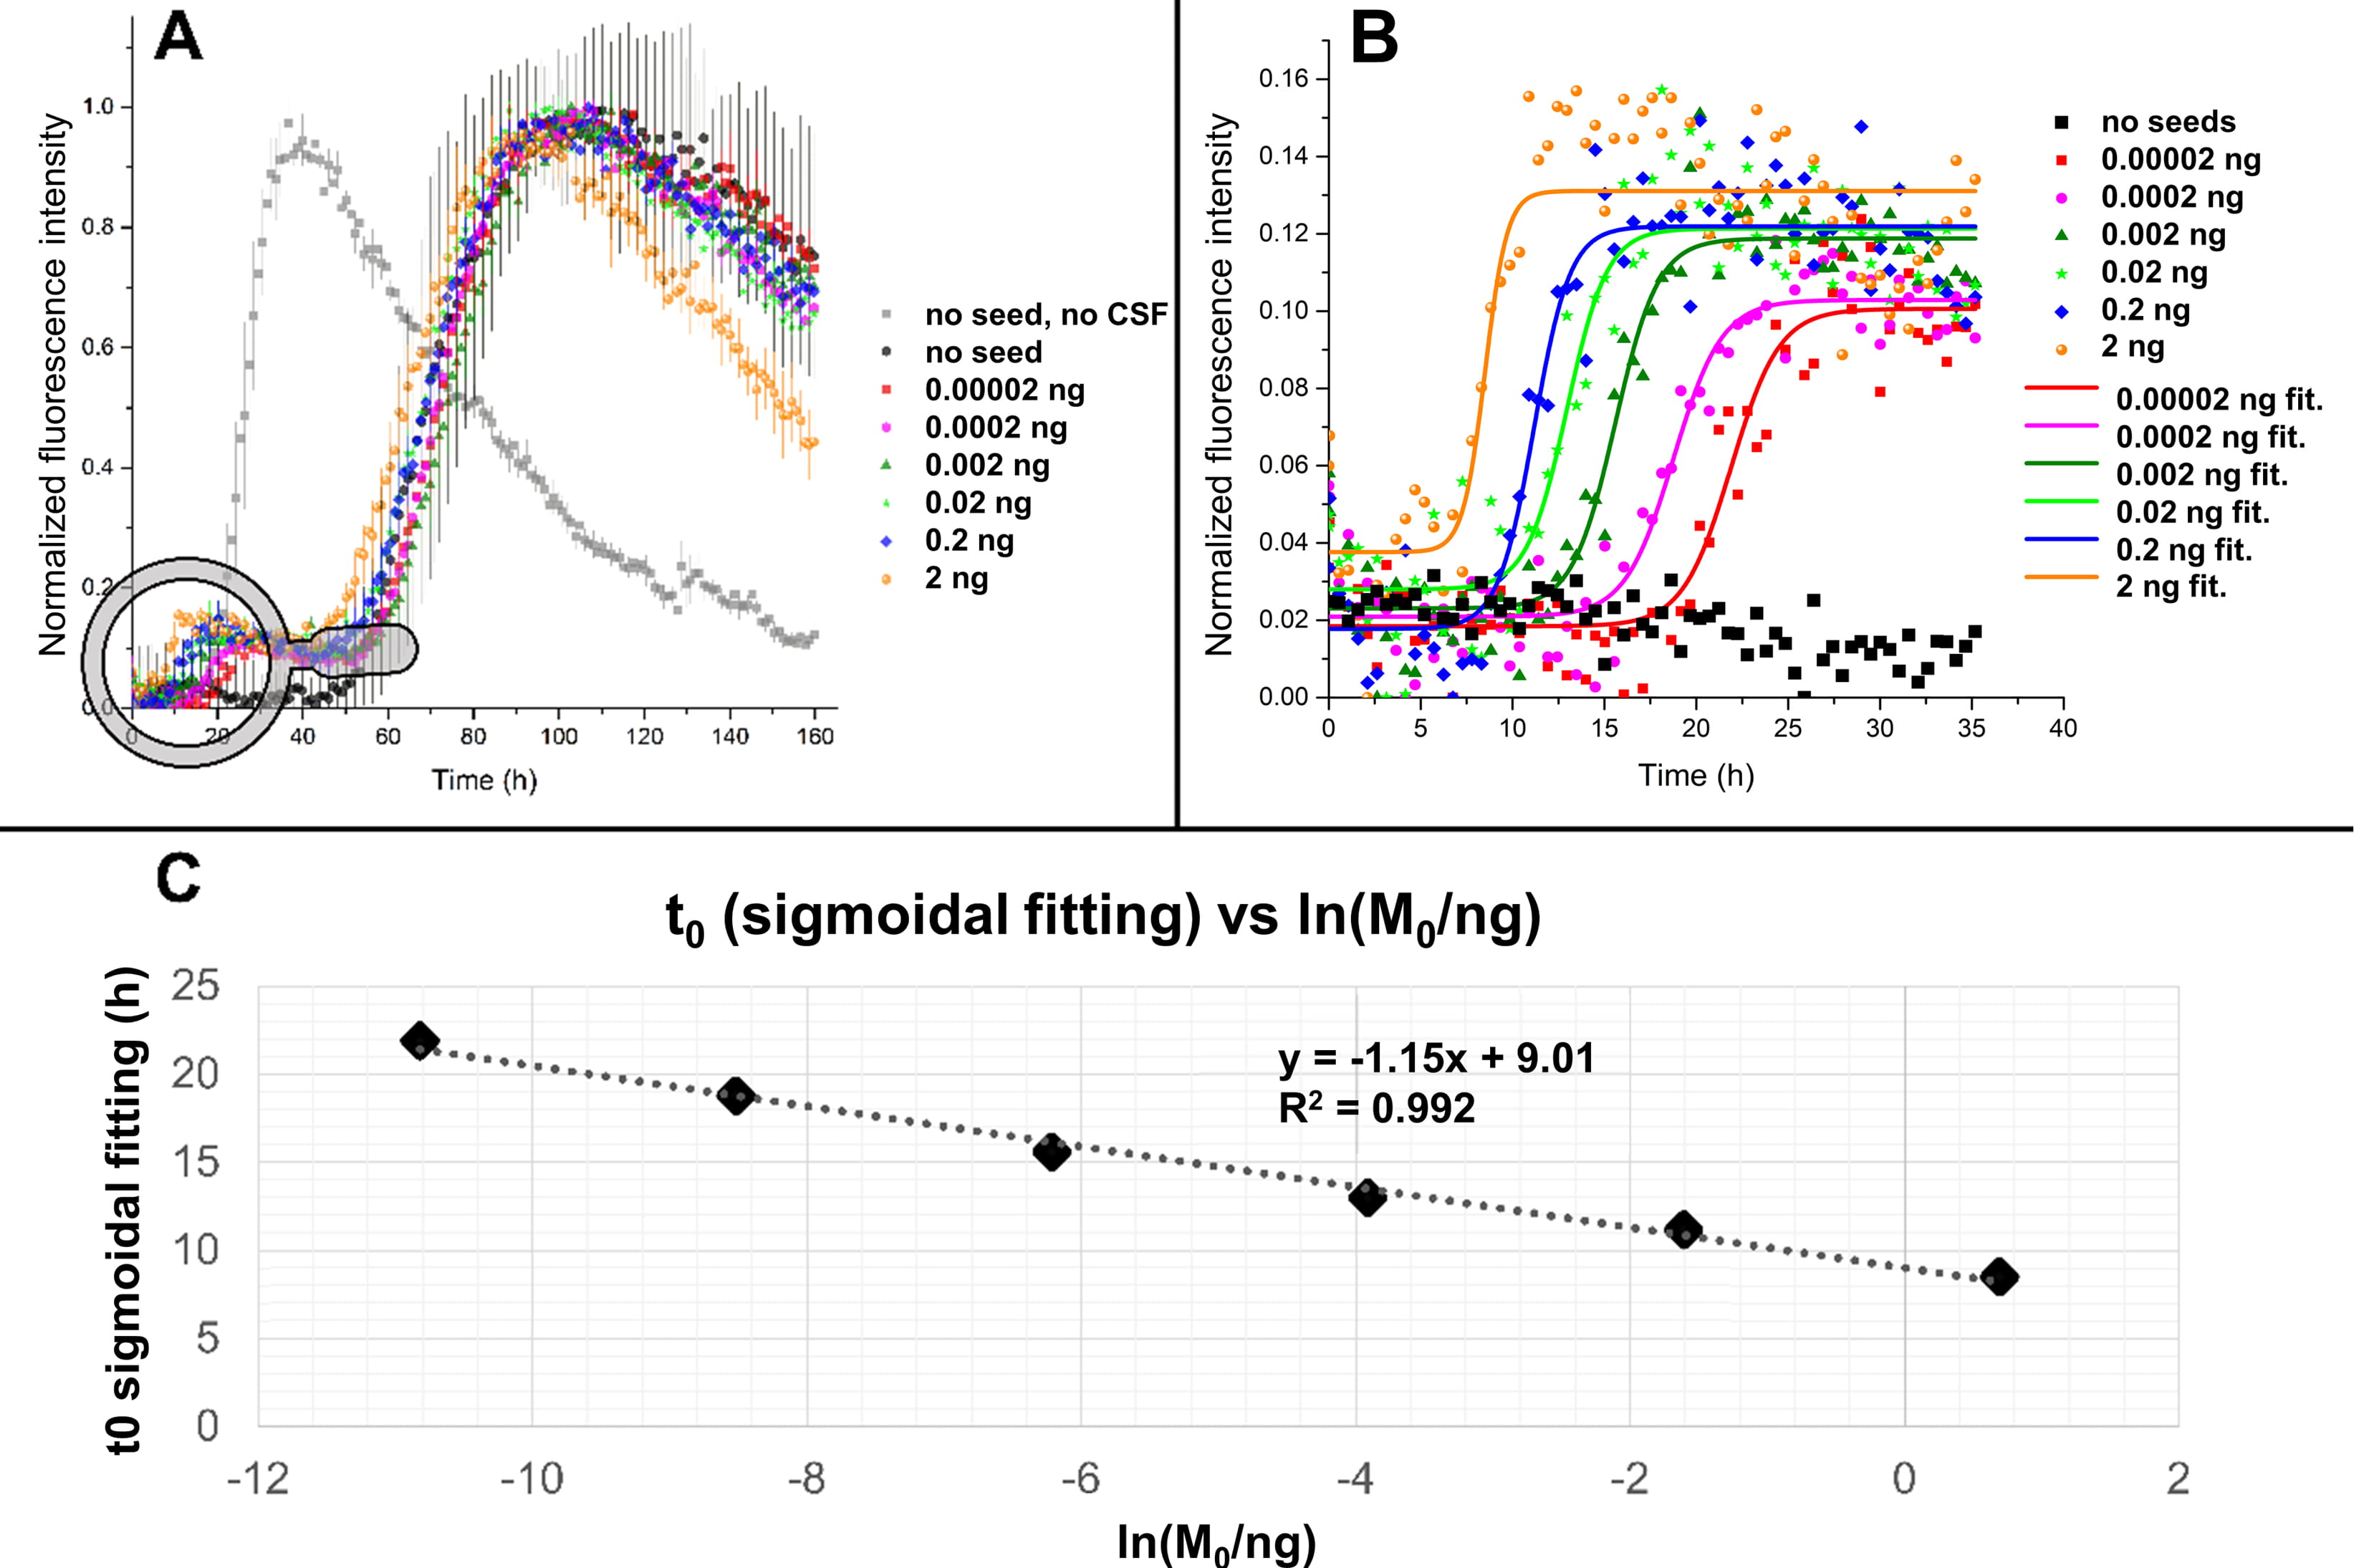 Fig. 5.
Fitting of ThT profiles in the presence of human CSF and
preformed seeds. (A) SAA performed using 0.125 mg/mL of recombinant
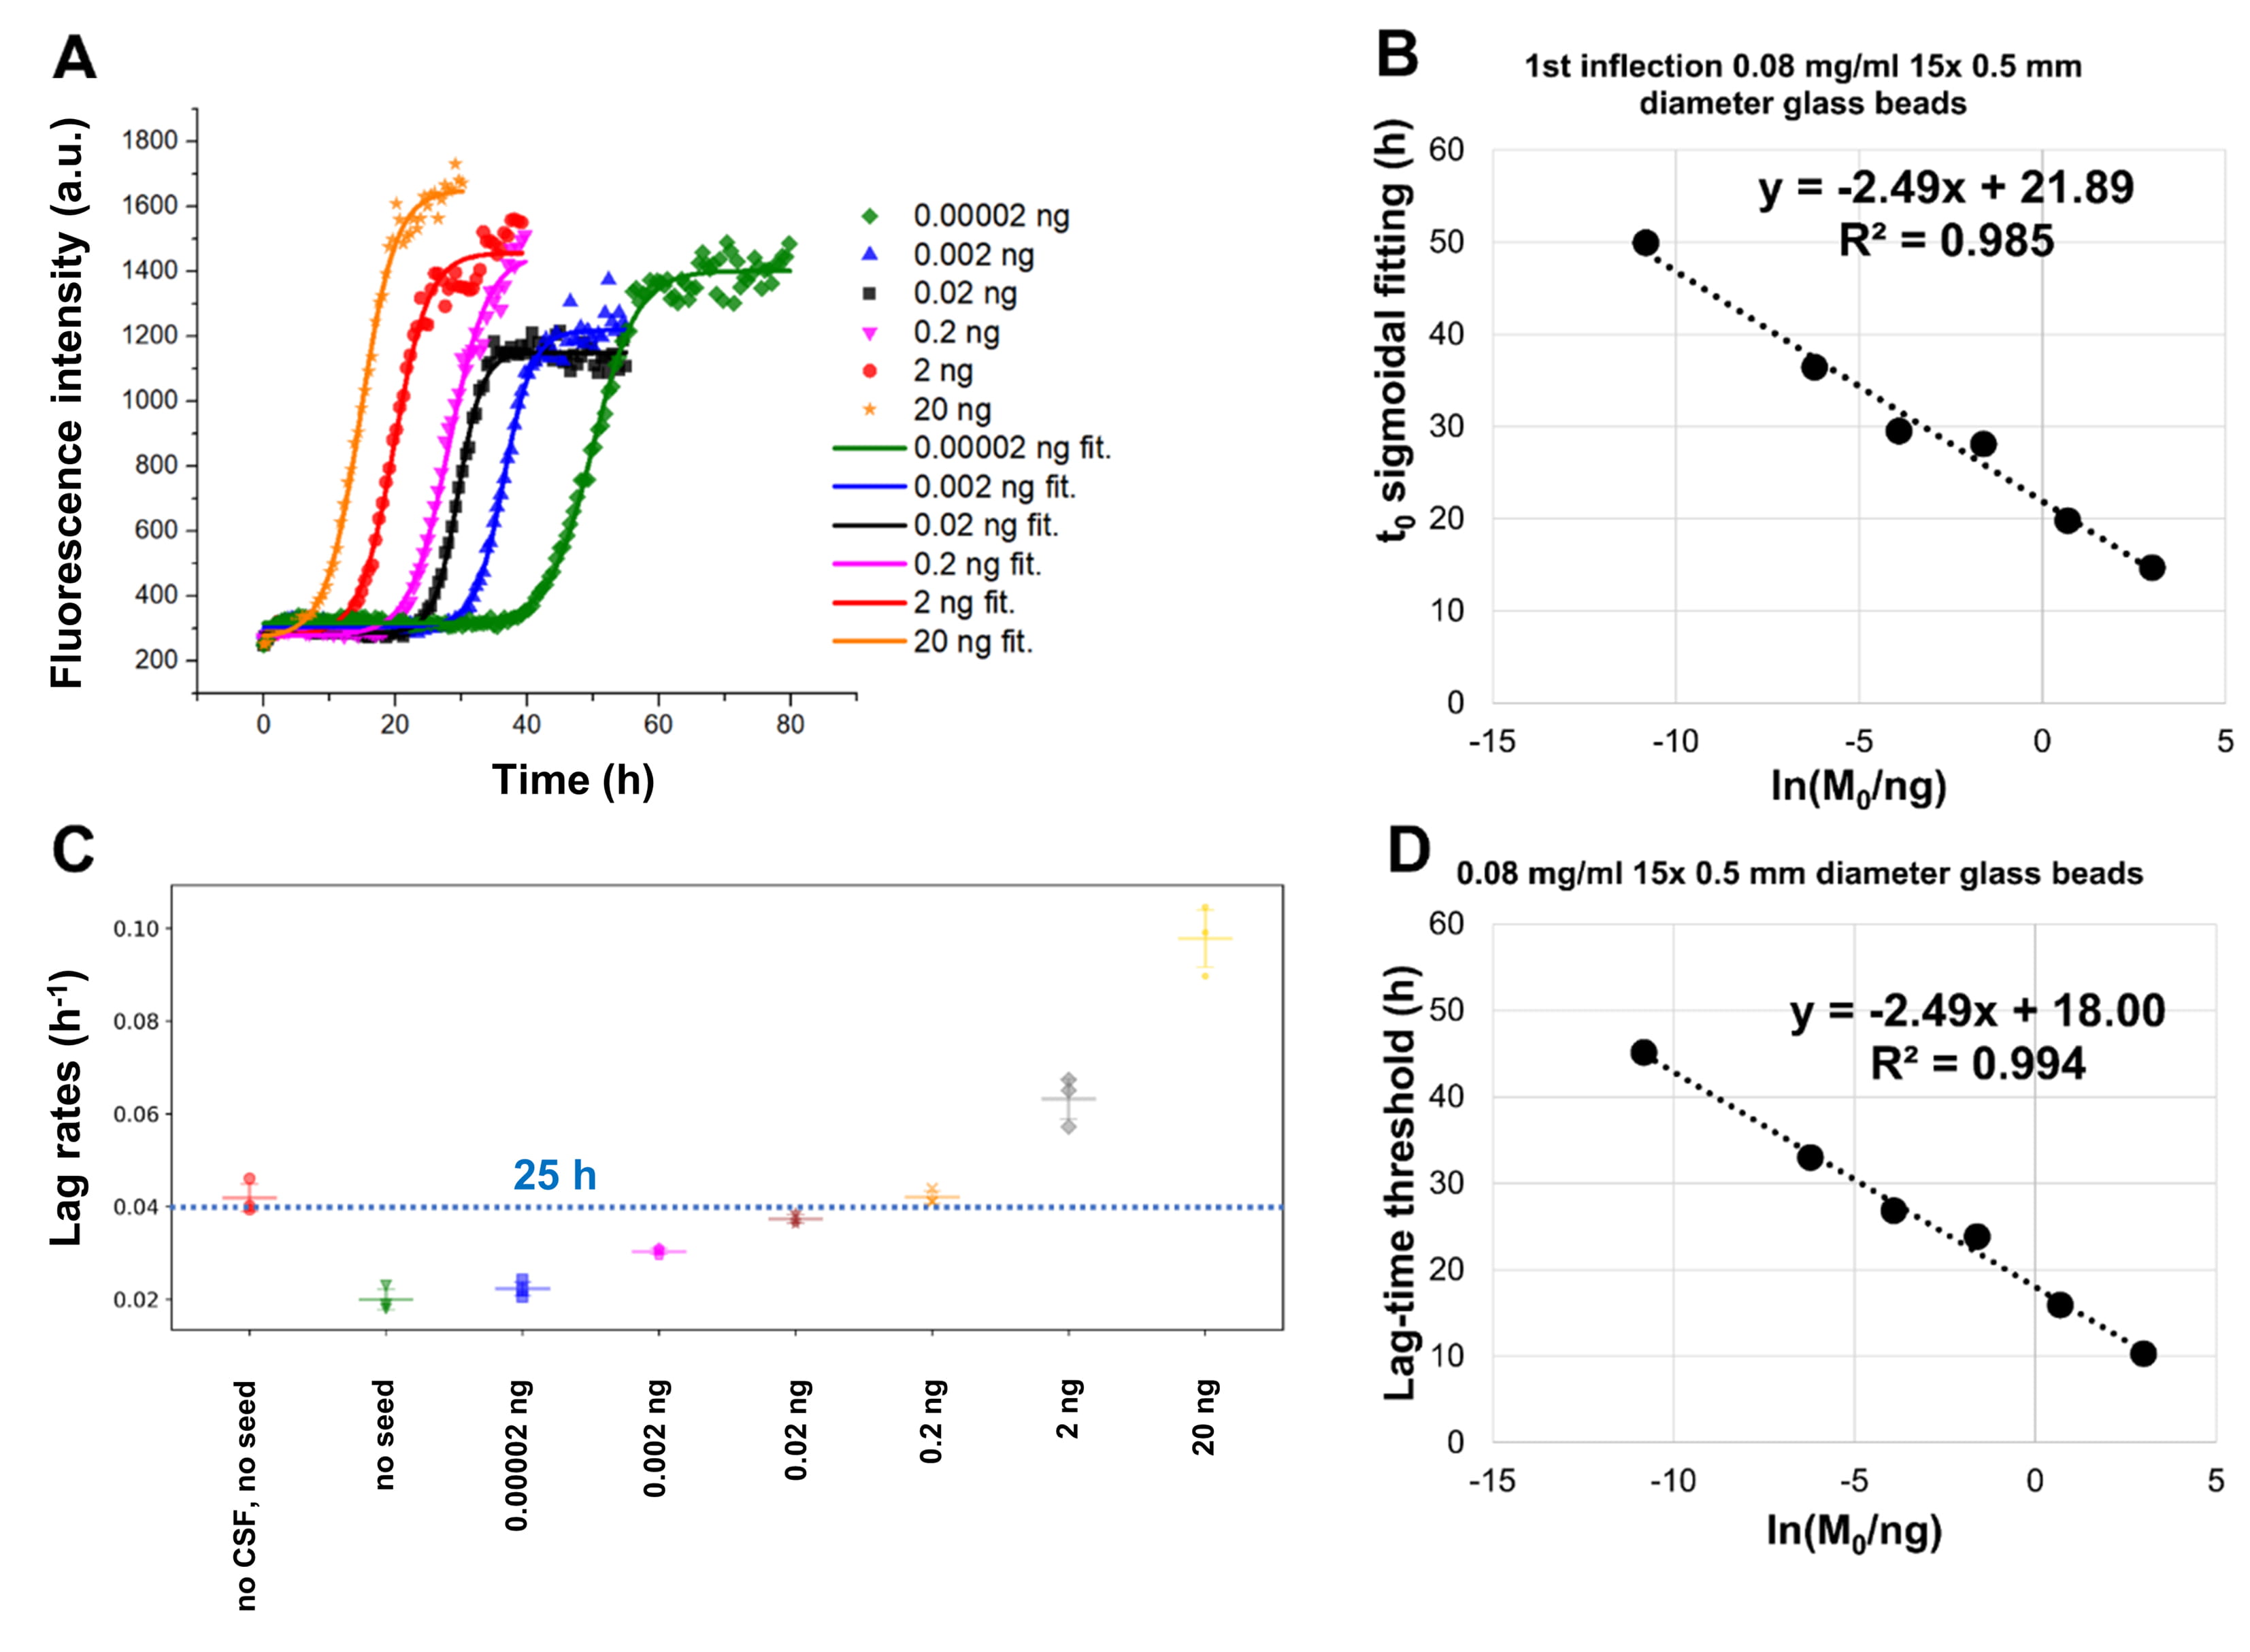 Fig. 6.
Performance of fitted t
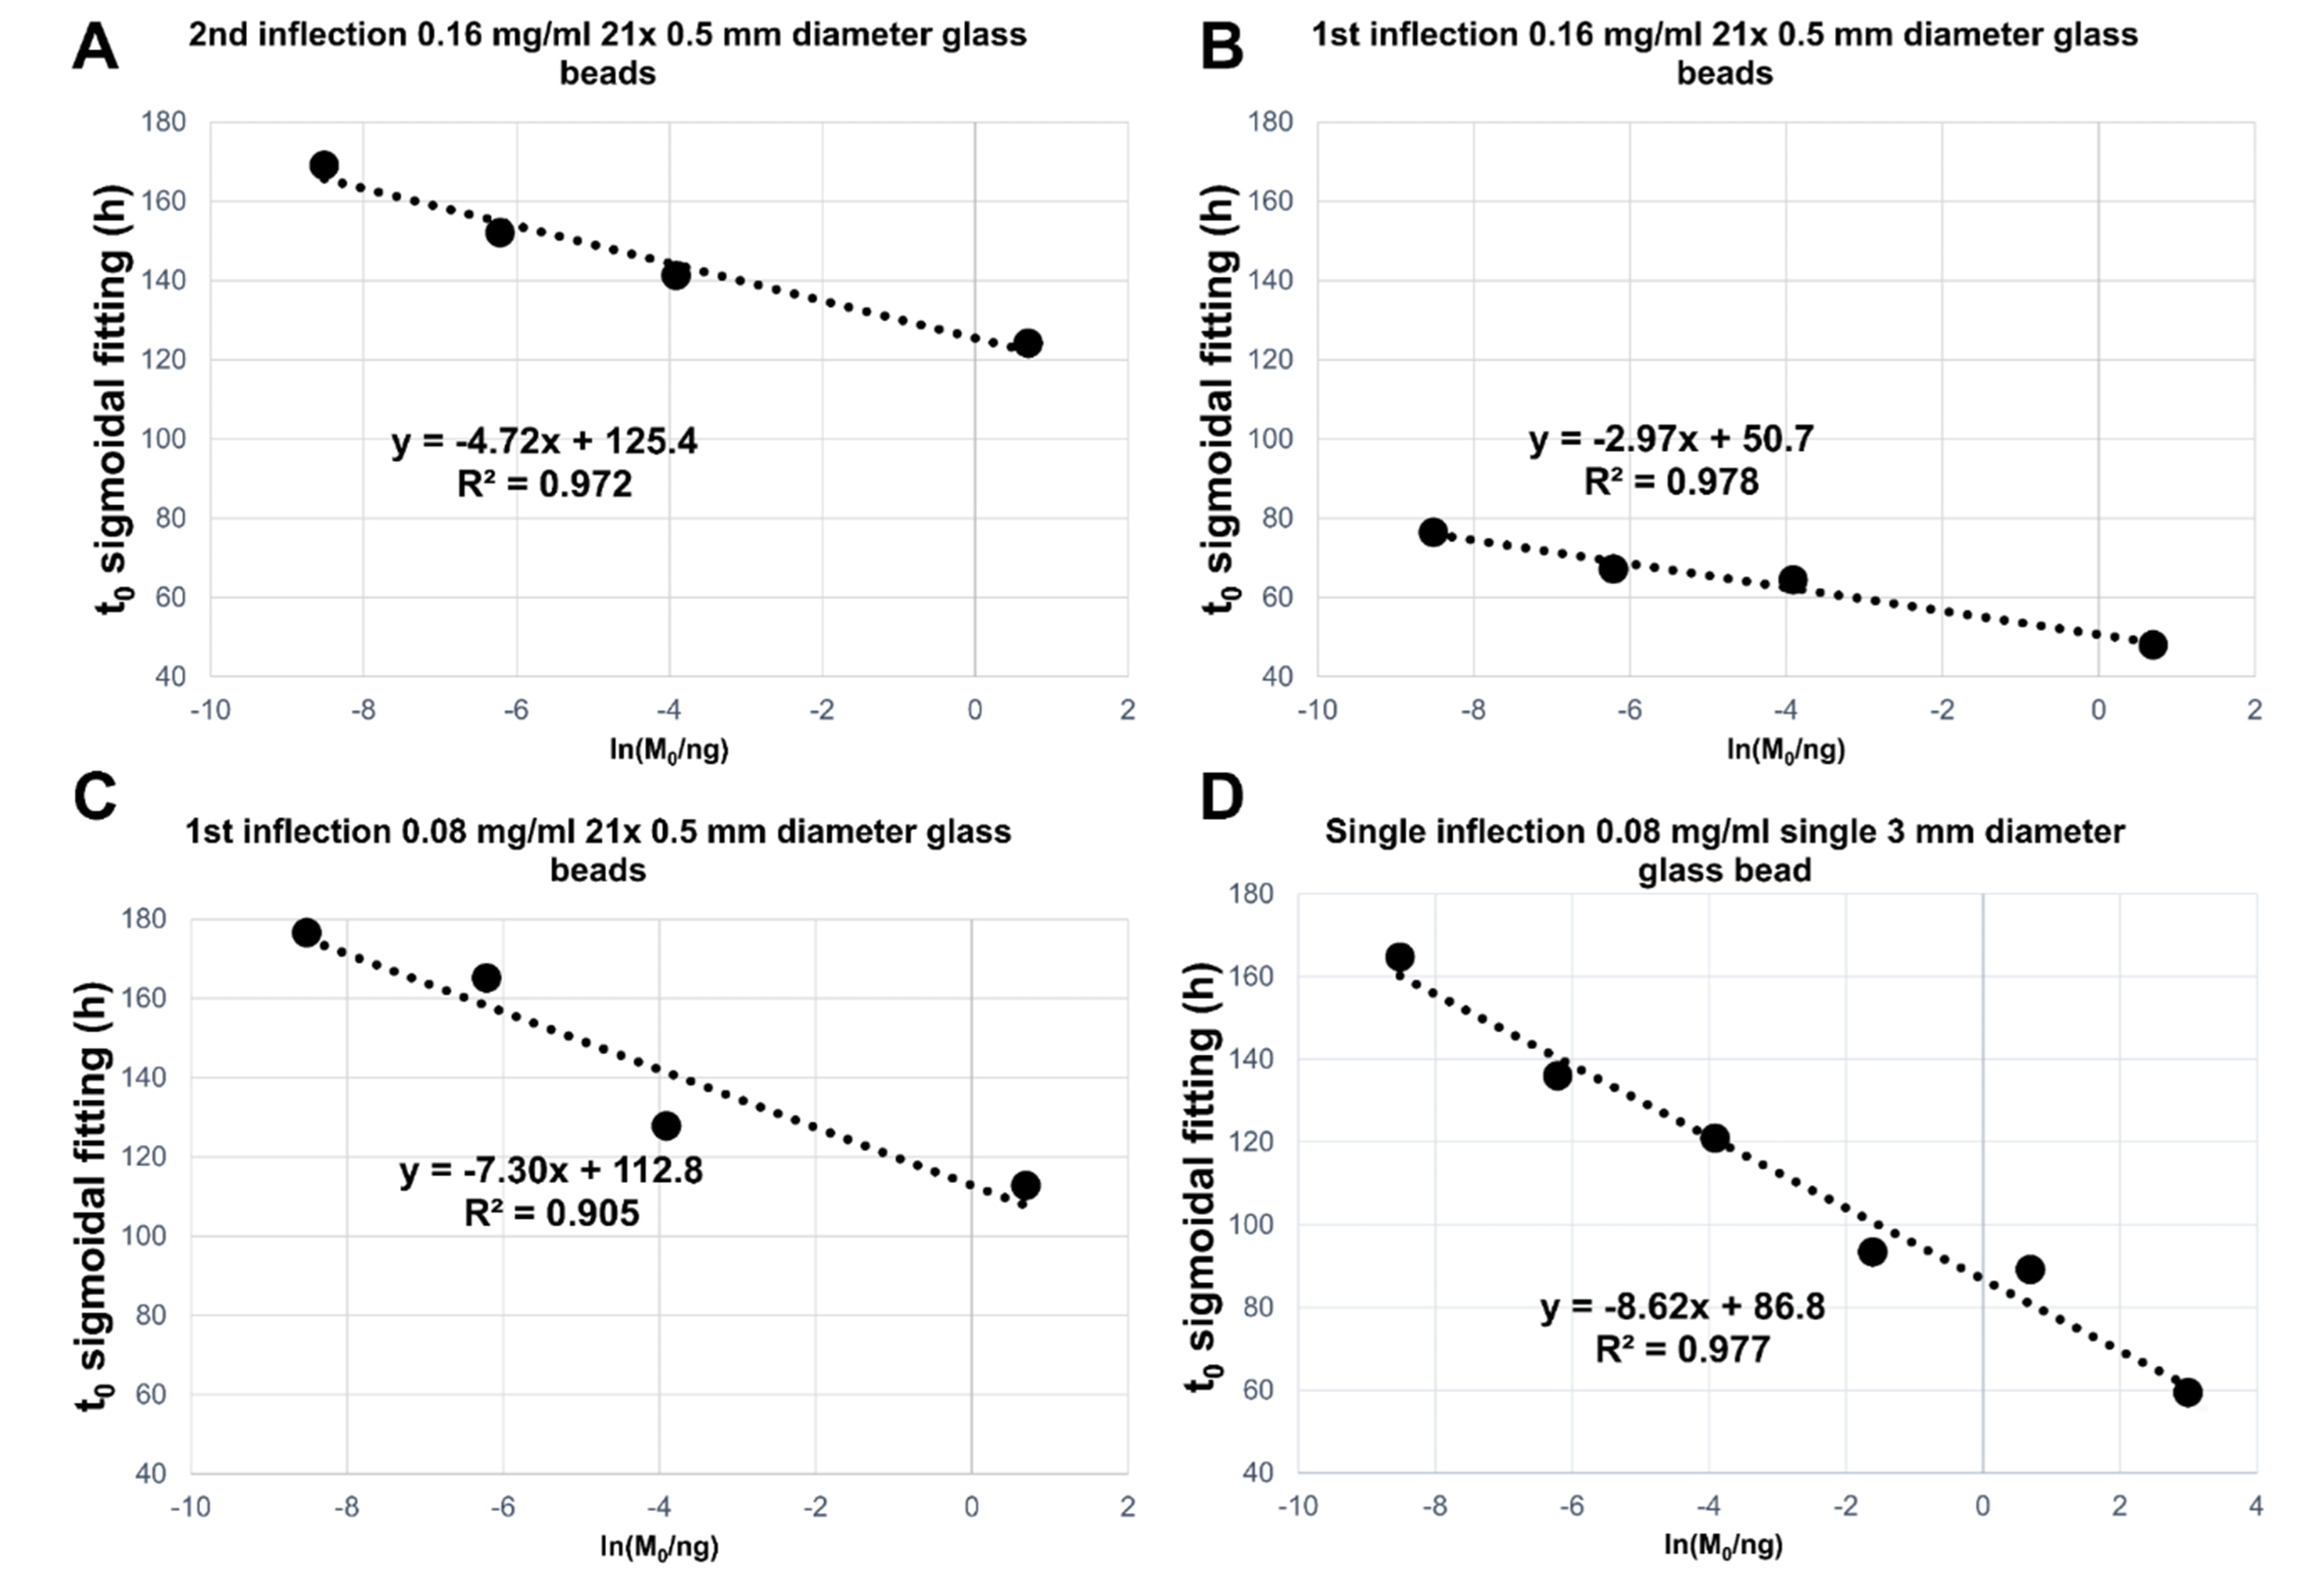 Fig. 7.
Summary of linear regression analyses performed of the average
(on three replicates) t
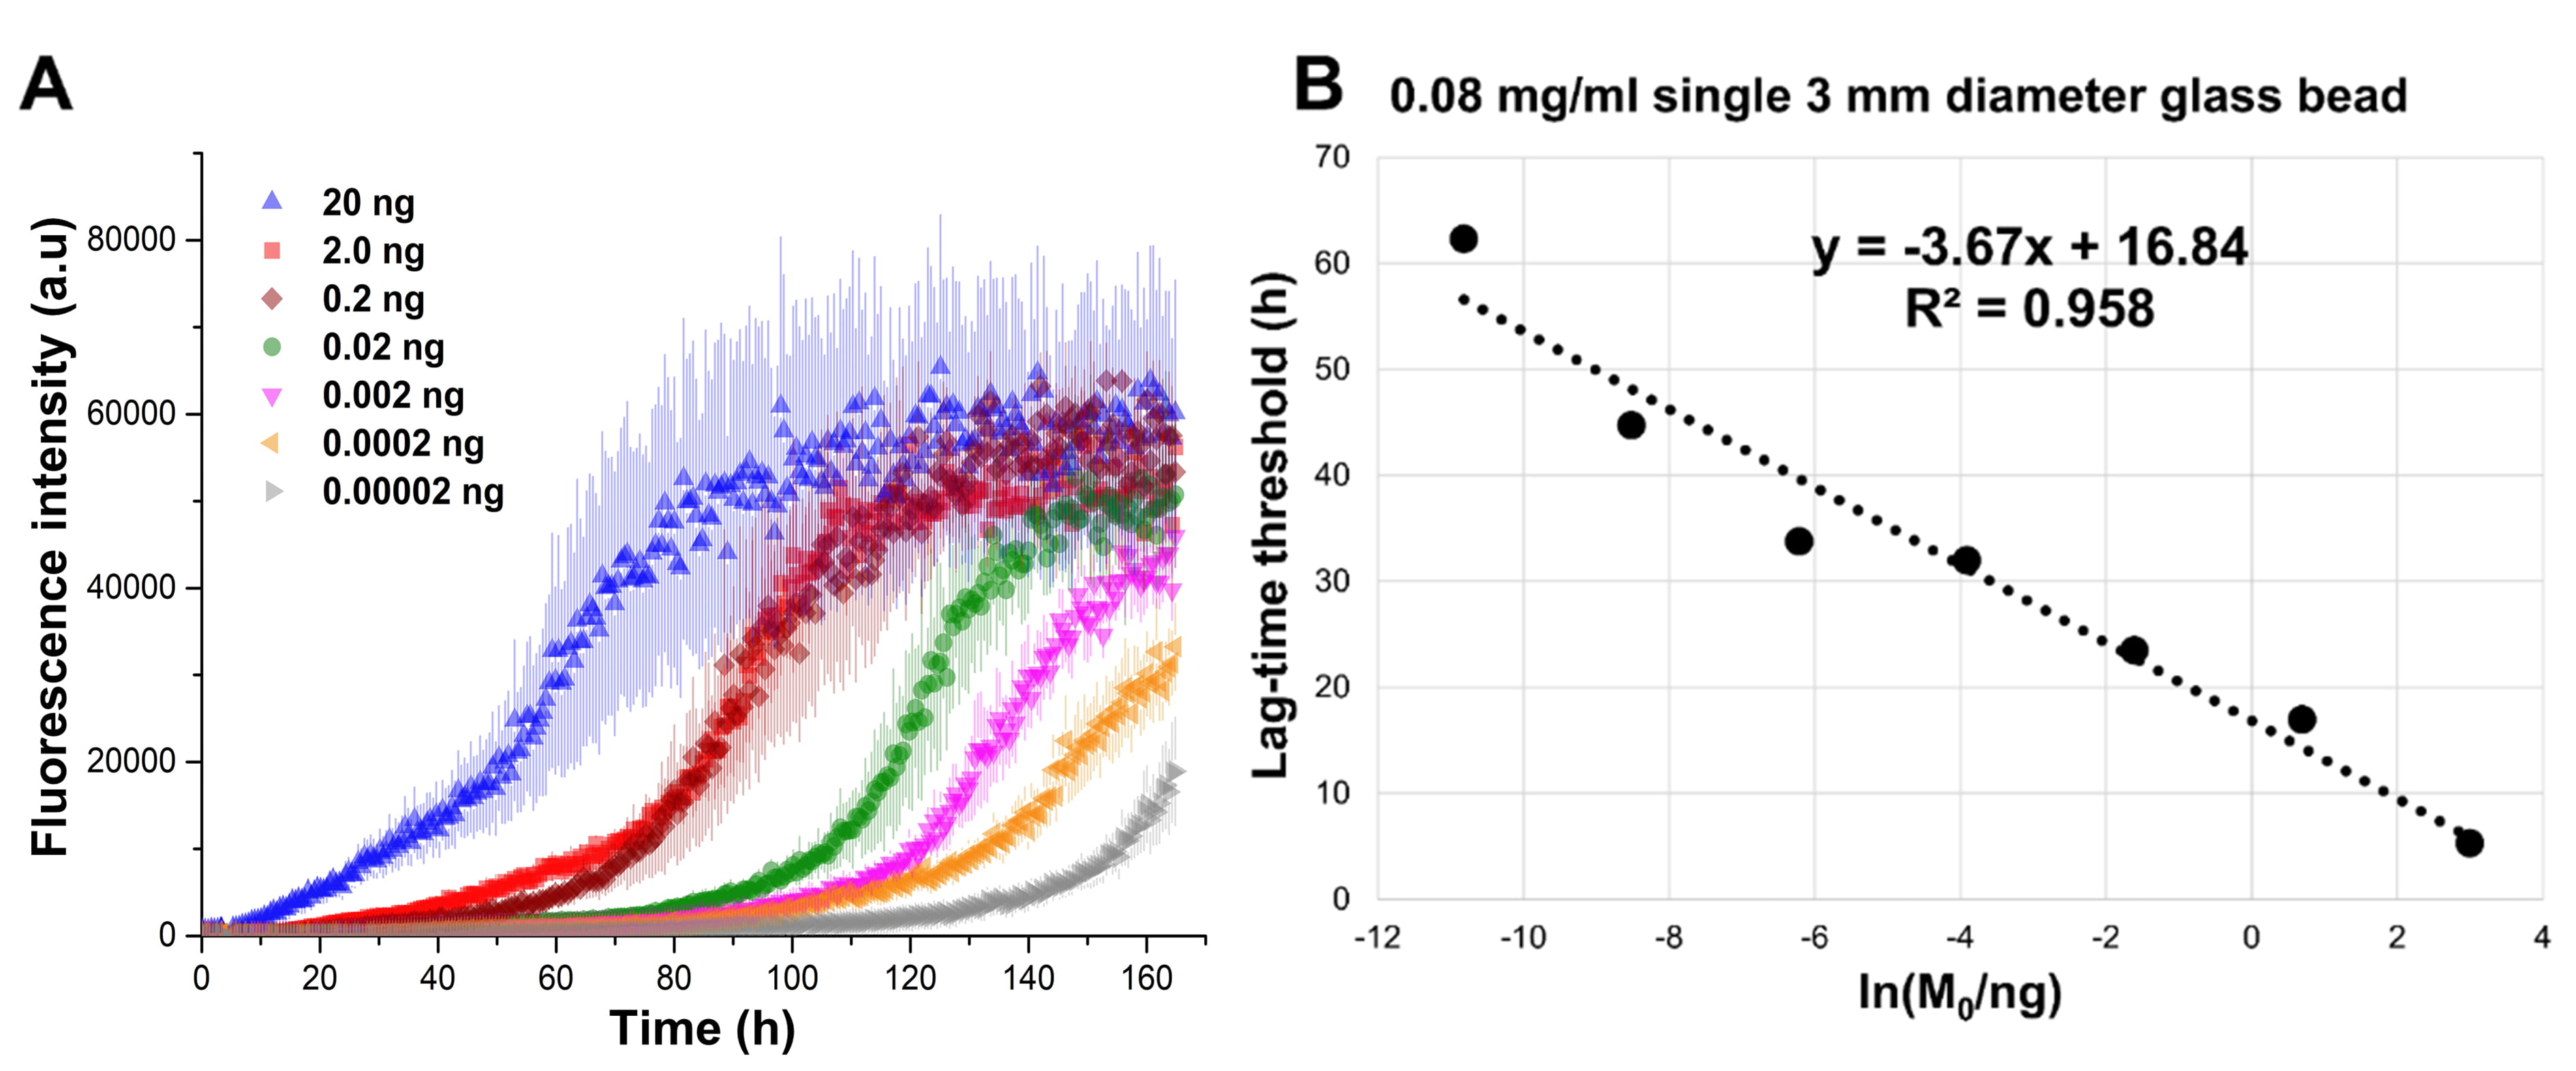 Fig. 8.
SAA performed using 0.08 mg/mL of recombinant
In Fig. 5A are reported the kinetic traces, averaged on three replicates for
each seed quantity, relative to a SAA performed with 17 glass beads (diameter of
0.5 mm) per well. Interestingly, the addition of human CSF produced a delay in
the aggregation of
To accurately measure the position of the first inflection point
(t
The results of the fitting are shown in Fig. 5B. The measured t
The assay optimization promoted the “seeded” aggregation and limited the
spontaneous aggregation of the free monomer to obtain the maximum possible
differentiation of the masses of the added seeds. From the linear regression of
Fig. 5C, it is possible to notice that, although the R2 coefficient is almost
equal to 1, the slope of the line was low, which represented the fact that the
first inflection point of the aggregation profiles laid in a short range of time
(5 h–20 h) for all the curves. In a second trial, we lowered the monomer
concentration from 0.125 mg/mL to 0.08 mg/mL. This choice was made to discourage
the primary nucleation kinetics, which, according to the model described in Fig. 1,
depends on the square of the monomer concentration while the polymerization
kinetics of the fibrils depends linearly on that. Also, the number of beads was
slightly reduced from 17 to 15 to ameliorate the signal to noise ratio of each
curve to allow a better fitting of the first plateau. As before, we analysed the
first part of the aggregation curves extracting the t
Where i
The R2 values and the slopes of the linear regressions for the t
All the tested conditions produced satisfactory differentiations between seed
masses with a good linear correlation between the measured t
Another variable that emerged in some protocols present in literature [28, 44, 58, 63] is the presence of detergents, such as Sodium Dodecyl Sulphate (SDS), which is commonly used in the RT-QuIC/PMCA protocols for the detection of PrPSc.
For these experiments, 2
| SDS (%) | Seeds (pg) | Lag-time (h) |
| 0.00 | 0.00 | |
| 0.001 | 0.00 | |
| 0.005 | 0.00 | 18 |
| 0.01 | 0.00 | 17 |
| 0.00 | 0.01 | |
| 0.001 | 0.01 | 39.0 |
| 0.005 | 0.01 | 10 |
| 0.01 | 0.01 | 7 |
| The measured lag-times are shown for different experiments
performed with and without seeds in the presence of SDS. In this table lag-times
are represented as mean | ||
The results of the experiments performed in this work showed the impact on SAAs of experimental variables like monomer concentration, addition of glass beads, size and number of glass beads, buffer pH, addition of human CSF and use of detergents. For most of the seeded experiments we usually observed the presence of two inflection points. The exact understanding of this behaviour requires further investigation. However, a possible explanation for these ThT fluorescence profiles is the transition from initially amplified oligomeric/proto-fibrillary into well-structured fibrils. Varying the starting monomer concentration affected the speed of both the seeded and unseeded aggregation. Decreasing the starting monomer concentration increased the experiment duration but produced a greater slope in seeded aggregation experiments, thus increasing the differentiation between the masses of the added seeds. By taking into account nucleated-polymerization kinetic models for protein aggregation [48, 49, 64], like the one described in Fig. 1, the monomer concentration dependence of the nucleation kinetics is of a higher order with respect of the growth of preformed aggregates. Consequently, the decrease of the monomer concentration affects more the unseeded aggregation than the seeded one.
The addition of glass beads increased both the aggregation speed and the homogeneity among replicates of seeded experiments, a result that is in accord with the results previously published by Giehm and Otzen [52]. The size and the number of the beads showed to play a major role also in the differentiation of added seeds. By increasing the number and size of the beads, we increased the reproducibility of the assay, decreased the experiment duration and increased the differentiation among different quantities of preformed aggregates in the presence of human CSF.
These findings can be explained by considering the fragmentation kinetics [48, 64] of prion-like proteins: preformed aggregates, when fragmented, produce more template units, which can then act as new seeds for the fibrillization process. It should be also mentioned that adding too many beads or apply a too vigorous shaking or sonication may also increase water-air interfaces, which may favour the unspecific formation of amyloidogenic aggregates [55, 65]. However, in the range of the tested conditions, SAAs appear to benefit from the use of beads.
Three reaction buffers were also tested: PIPES buffer 100 mM pH 6.5 with NaCl
500 mM, PBS buffer pH 7.4 and PBS buffer pH 8.2. We observed a decrease in the
aggregation speed by moving to higher pH in seeded conditions. This is in accord
to the fact that, at high pH, the negatively charged monomers of
The addition of SDS in the reaction buffer significantly accelerated the
aggregation of
Our study has some limitations. As a limitation, we must acknowledge the usage
of CSF samples coming from a single patient. This choice allowed us to minimize
the effects related to biological variability of CSF samples but at the same time
prevented us from characterizing possible interaction effects between the
biomatrix and
Overall, our investigation highlighted how optimization and standardization of
experimental procedures for
GB and SP conceived and designed the experiments; DR performed protein expression and purification; GB, SP and LG performed the experiments; GB analysed the data; GB wrote the first draft; FPP, LG, SP and LP critically reviewed the manuscript; MF and LP contributed reagents and materials; all authors read and revised the final version of the manuscript.
All the procedures involving human subjects were performed following the Helsinki Declaration. All patients and/or their legal representatives gave informed written consent for the lumbar puncture, CSF collection, assessment, analysis, and the inclusion in the study, that was approved by the local Ethics Committee (CEAS n 1287/08), University of Perugia. CSF samples were obtained with the informed consent of all participants.
We thank Dr. Sara Bologna for assistance in protein expression and purification procedures.
GB is currently supported by the JPND bPRIDE (blood Proteins for early Discrimination of dEmentias) project. The Project leading this result has received funding under the call “JPco-fuND-2: Multinational research projects on Personalised Medicine for Neurodegenerative Diseases” (CUP number J99C18000210005).
The authors declare no conflict of interest.
Supplementary material associated with this article can be found, in the online version, at https://www.fbscience.com/Landmark/articles/10.52586/5010.