


Frontiers in Bioscience-Landmark (FBL) is published by IMR Press from Volume 26 Issue 5 (2021). Previous articles were published by another publisher on a subscription basis, and they are hosted by IMR Press on imrpress.com as a courtesy and upon agreement with Frontiers in Bioscience.
 , Silahis S. Hontiveros 1
1 Department of Pharmacology and Neuroscience
2 Institute for Healthy Aging, UNT Health Science Center, 3500 Camp Bowie Boulevard, Fort Worth, TX 76107
Abstract
Presenilin-1 (PS1) is the catalytic subunit of gamma-secretase. PS1 cleaves beta-amyloid precursor protein (APP) to produce Abeta peptide and Notch 1 receptor to release Notch intracellular domain (NICD) in the cytoplasm. We have previously shown that rapamycin inhibits p-mTOR to repress PS1 transcription and Notch 1-signaling. But the exact mechanism by which rapamycin inhibits PS1 transcription is not known. We have also published that inhibition of basal activity of c-jun-NH2-terminal kinase (JNK) with JNK-specific inhibitor SP600125 represses PS1 transcription by reducing p-JNK and via p53 dependent mechanism. We now report that rapamycin inhibits the phosphorylation of both mTOR (p-mTOR) and JNK (p-JNK). It appears that rapamycin represses PS1 transcription by inhibiting the expression of p-JNK in SK-N-SH cells under non-stressed condition. Consequently, one of the mechanisms of inhibition of PS1 transcription by rapamycin is similar to the mechanism of repression of PS1 transcription by JNK-specific inhibitor SP600125. We also report that JNK-inhibitor SP6000125 decreases both p-JNK and p-mTOR protein levels. These results suggest that JNK and mTOR may potentially activate each other by mutual phosphorylation.
Keywords
- Alzheimer's disease
- mTOR signaling
- p-JNK
- PS1
Presenilin-1 (PS1) is the catalytic subunit of the gamma-secretase enzyme, and cleaves beta-amyloid precursor protein (APP) (1-4). Cleavage of APP by PS1/gamma-secretase enzymes generates Abeta42-peptides which form amyloid plaques and thus cause degeneration neurons in the brain during AD (5). On the other hand Notch 1 cleavage by PS1/gamma-secretase (6, 7) releases Notch intracellular domain (NICD) in the cytoplasm. NICD subsequently migrates to the nucleus and causes Notch signaling by increasing the expression of the Hes1 gene (8, 9). We have published that repression of PS1 transcription inhibits PS1/gamma-secretase activity and ERCa2+ leak channels in SK-N-SH cell (10, 11). Therefore, various functions of PS1 protein are important in many aspects of cellular functions.
The mammalian target of rapamycin (mTOR) is a Ser/Thr kinase (12). We have recently published (13) that rapamycin efficiently suppressed phosphorylation of mTOR (p-mTOR), and decreased expression of PS1-mRNA as well as p-p70S6K1, 4EBP1, PS1, NICD, and Hes1 protein levels in SK-N-SH cells (13). Therefore, rapamycin appears to decrease PS1 protein levels and Notch 1 processing by inhibiting PS1 transcription. But the exact mechanism by which rapamycin inhibits PS1 transcription is not known.
It has been reported that osmotic stress regulates mTOR via c-Jun N-terminal Kinase (JNK)-mediated mTOR protein phosphorylation (14). It appears that osmotic stress activates JNK by phosphorylation of JNK (p-JNK) and p-JNK subsequently activates mTOR by phosphorylation (p-mTOR) (14). JNK specific inhibitor SP600125 blocks p-JNK and p-mTOR upon osmotic stress suggesting that p-JNK activates mTOR (14).
We have previously published that inhibition of basal c-jun-NH2-terminal kinase (JNK) activity by JNK inhibitor SP600125 represses PS1 transcription in human neuroblastoma SK-N-SH cell line, mouse primary neurons (15), and mouse brains (16). We now investigate whether rapamycin may also reduce PS1 expression via JNK-mediated mechanism in non-stressed condition in SK-N-SH cells. We report that both rapamycin and SP600125 decrease the expression of p-mTOR, p-JNK, and PS1 in SK-N-SH cells under non-stressed condition. These results suggest that JNK and mTOR may potentially activate each other by mutual phosphorylation. Moreover, one of the mechanisms of inhibition of PS1 transcription by rapamycin may be similar to the mechanism of repression of PS1 transcription by JNK-specific inhibitor SP600125 as previously reported by us (15).
Human neuroblastoma SK-N-SH cell line (ATCC, Manassas, Virginia, Cat#HTB-11) was maintained in Dulbecco’s modified Eagle medium containing 10% fetal bovine serum, 1% penicillin/streptomycin (Gibco, CA, USA). Rapamycin and JNK-inhibitor SP600125 were purchased from (Calbiochem/EMD, CA, and USA).
Protein expression levels were measured using western blot analysis as mentioned previously. Briefly, cells were lysed with 1% protein lysis buffer (150 mM NaCl, 25 mM Tris-HCl pH 7.8, 1% NP-40, 10 mM NaF, 1 mM Na3VO4), and 50 µg of total proteins were separated in 12% sodium dodecyl sulfate–polyacrylamide gel electrophoresis. The blots were transferred to the polyvinylidene difluoride membranes and then blocked with SuperBlock T20 blocking buffer (Thermo Scientific, Rockford, IL). The membranes were incubated with SuperBlock T20 blocking buffer containing primary rabbit monoclonal against p-mTOR (Cell Signaling, Danvers, MA, Cat#5536S), mouse monoclonal p-JNK (Cell Signaling, Danvers, MA, Cat#9255), mouse monoclonal PS1 (Millipore, Bedford, MA, Cat#MAB5232), mouse monoclonal beta-Acting (Sigma, St Louis, MO, Cat#A5441) antibodies overnight at 40C. The blots were developed and visualized using enhanced chemiluminescence detection system (Pierce, Rockford, IL, USA).
Cells were plated and cultured in a 24-well plate containing poly-lysine-coated coverslips (Costar, Cambridge, MA). Following treatment with DMSO or rapamycin or SP600125 and culturing at 37 °C for 24 h, the cells were washed with ice-cold TBS (10 mM Tris pH7.5, 150 mM NaCl) at room temperature for 10 min, fixed in 10% formalin for 15 min, permeabilized in 0.5 % Triton X-100 in TBS (TBST) for 10 min, blocked with 5% Goat Serum in Superblock for 45 minutes at room temperature. Then cells were stained with a primary antibodies such as rabbit monoclonal against p-mTOR (Cell Signaling Technology, Danvers, MA, Cat#5536S), mouse monoclonal p-JNK (Cell Signaling Technology, Danvers, MA, Cat#9255), mouse monoclonal PS1 (Millipore, Bedford, MA, Cat#MAB5232). After staining with primary antibody, cells were stained with a secondary antibody donkey anti-rabbit Alexa Fluor F594 (abcam, Cambridge, MA, Cat#150076), or donkey anti-mouse goat Alexa Fluor 488 (abcam, Cambridge, MA, Cat#150105), all in 1:500 in Superblock. Antibody-stained immunofluorescent samples were mounted by anti-fading aqueous mounting medium containing 4′, 6-diamidino-2-phenylindole dihydrochloride (DAPI) for nuclei staining and covered by cover slips. Extensive washes with TBST (TBS + 0.05% Tween 20) were performed between each step. Omission of the primary antibody in parallel staining was included as a control to ensure no non-specific staining. Images were photographed using a Nikon EX300 microscope. Magnifications are shown in figures with scale bar.
All data was analyzed using prism software (Graphpad software Inc., La Jolla, CA, USA) and presented as means ± SEM. Comparison was made between groups by one-way ANOVA and Student–Newman–Keuls (SNK) test. A probability was considered to be significant with less than 0.05.
We have previously shown that rapamycin was effective at 50 ng/mL, 100 ng/mL and 200 ng/mL concentrations to inhibit p-mTOR in SK-N-SH cells (13). To determine whether rapamycin controls p-JNK levels, SK-N-SH cells were treated with DMSO two different concentrations of rapamycin for 24 h. Cell extracts were prepared and assayed for p-mTOR and p-JNK protein levels by Western blot analysis. Rapamycin was effective at 100 ng/mL and 200 ng/mL concentrations to inhibit p-mTOR as reported by us previously (13). We have previously reported that there was no significant variation of total mTOR protein levels with 100 ng/mL and 200 ng/mL increasing concentration of rapamycin (13). As shown in Figure 1A and Figure 1B, rapamycin decreased phosphorylation of JNK to p-JNK (p54, p46) in a concentration dependent manner.
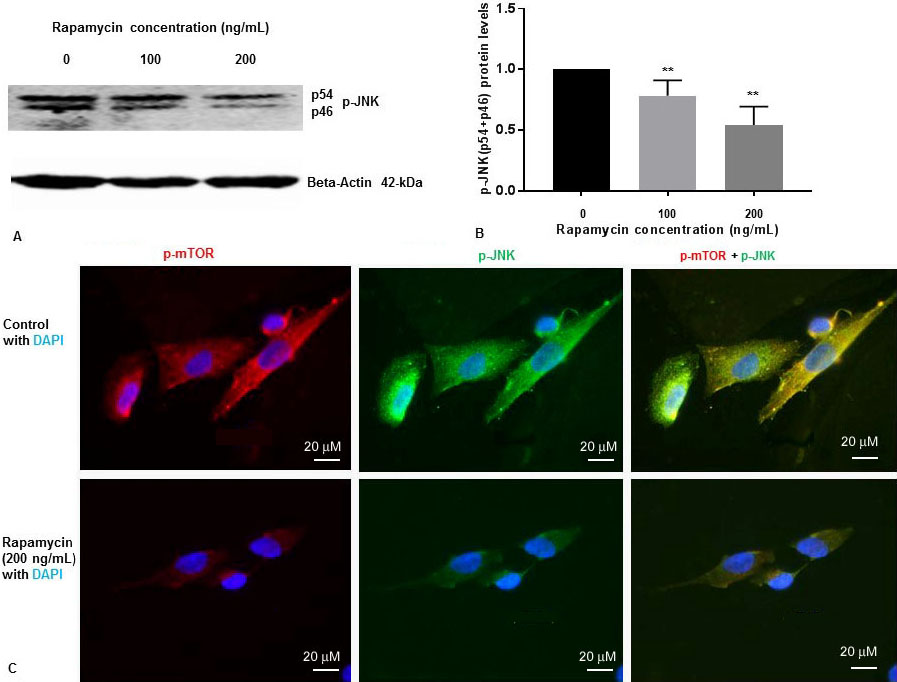 Figure 1
Rapamycin inhibits phosphorylation of mTOR and phosphorylation of JNK in SK-N-SH cells. (A) SK-N-SH cells were treated with indicated concentrations of rapamycin for 24 h. Then 50 mg of the total cell lysates were subjected to Western blot analysis with antibodies directed against phosphor- JNK (p-JNK). Blots were developed by chemiluminescence and protein gel bands were quantified using Labworks Image Analysis Software. Positions of beta-actin (42-kDa), and p-JNK (54-kDa and 46-kDa subunits) protein bands are marked. (B) The graphs represent means±SEM of p-JNK (p54+p46) expression levels from 4 independent determinations (n=4) normalized against beta-actin. Statistical significance was denoted by asterisks. **P<0.01. (C) Immunostaining of p-mTOR (red), PS1 (green), and nucleus (blue) in SK-N-SH cells after treatment with DMSO (top panel) or 200 ng/mL rapamycin (bottom panel) for 24 h. Yellow signifies colocalization of p-mTOR and p-JNK in the merge (p-mTOR + p-JNK + DAPI) image. Immunofluorescent staining results show a significant decrease of p-mTOR (red) and p-JNK (green) in rapamycin treated cells. Scale bar =20 μm.
We examined the levels of p-JNK, and p-mTOR in SK-N-SH cells after treatment with rapamycin (200 ng/mL) for 24 h. We performed IFS with p-mTOR, and p-JNK antibodies. As shown in Figure 1C, p-mTOR and p-JNK protein levels were drastically reduced in SK-N-SH cells after treatment with rapamycin. These results suggest that rapamycin inhibits both p-mTOR and p-JNK in SK-N-SH cells under non-stressed condition.
It was previously reported that inhibition of p-JNK abolished the phosphorylation of mTOR (p-mTOR) induced by osmotic stress in cells (14). It was also demonstrated that p-JNK was responsible for phosphorylation of mTOR (p-mTOR) in vitro during osmotic stress (14). We have published previously that p-JNK (p54, p46) levels are reduced progressively in concentration dependent manner with 5 µM, 10 µM, 20 µM, 40 µM, and 60 µM concentrations of JNK-inhibitor SP600125 in SK-N-SH cells (15). We observed that 60 µM concentration of JNK-inhibitor SP600125 drastically reduced p-JNK levels in SK-N-SH cells (15). To confirm whether JNK-inhibitor also inhibits the phosphorylation of mTOR, we treated SK-N-SH cells with 60 µM concentration of SP600125 for 24 h. Cell extracts were prepared and assayed for p-mTOR and p-JNK protein levels by Western blot analysis. As shown in Figure 2A and Figure 2B, p-mTOR levels were drastically reduced by JNK-specific inhibitor SP6000125. As expected, p-JNK (p54, p46) levels were drastically reduced by SP600125 (Figure 2A, Figure 2C). Results presented in Figure 1 and Figure 2 appear to suggest that JNK and mTOR may activate each other by mutual phosphorylation in SK-N-SH cells under non-stressed condition.
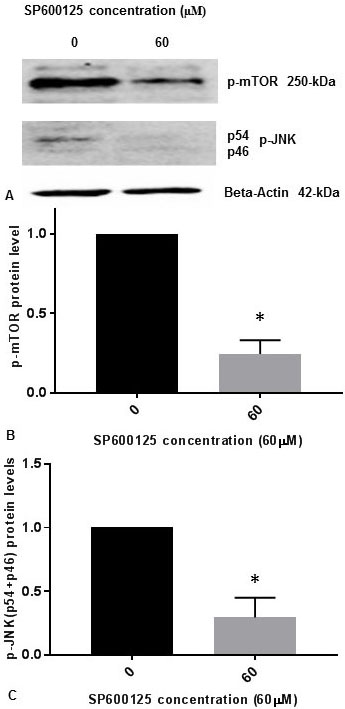 Figure 2
JNK-inhibitor SP600125 inhibits phosphorylation of mTOR and phosphorylation of JNK in SK-N-SH cells. SK-NSH cells were treated with DMSO or 60 µM concentration of SP600125 in DMSO at ~80% confluence. (A) The effect of SP600125 on p-mTOR and p-JNK (p54 and p46 subunits) protein expression was tested by Western blotting using beta-actin, p-mTOR and p-JNK antibodies. 50 µg of protein were used for Western blot analysis. The blots were visualized using ECL detection system. Positions of beta-actin (42-kDa), p-JNK (54-kDa and 46-kDa subunits), and p-mTOR (250-kDa) protein bands are marked. (B) The band intensities for p-mTOR protein were quantified using Labworks Image Analysis Software. The levels of p-mTOR protein were normalized against actin protein levels and presented as means ± SEM from 2 different replicates with n=3 for each replicate. All data was analyzed using prism software (Graphpad software Inc., La Jolla, CA, USA). Comparison was made between two groups by Student–Newman–Keuls (SNK) test. Statistical significance was denoted by asterisks. * P<0.05. (C) The band intensities for two subunits p54 (54-kDa) and p46 (46-kDa) of p-JNK protein were quantified using Labworks Image Analysis Software. The levels of (p54+p46) protein were normalized against actin protein levels and presented as means ± SEM from 2 different replicates with n=3 for each replicate. Comparison was made between two groups by Student–Newman–Keuls (SNK) test. Statistical significance was denoted by asterisks. * P<0.05.
We have previously published that SP600125 reduced PS1 mRNA, PS1 protein level, and PS1/gamma-secretes activity drastically (10, 15, 16). We have also published that mTOR inhibitor rapamycin drastically inhibited PS1 mRNA, PS1 protein level, and PS1/gamma-secretes activity (13). We also performed immunofluorescent staining (IFS) of SH-N-SH cells with p-JNK and PS1 antibodies (Figure 3). We used 60 µM concentration SPS00125 for our IFS staining experiments because we have published that p-JNK, PS1mRNA, and PS1 protein were reduced drastically with 60 µM concentration of SPS00125 (15). Therefore, results presented in Figure 1, Figure 2, and Figure 3 appear to suggest that PS1 transcription and PS1 protein expression are regulated by both mTOR and JNK signaling pathways under non-stressed condition.
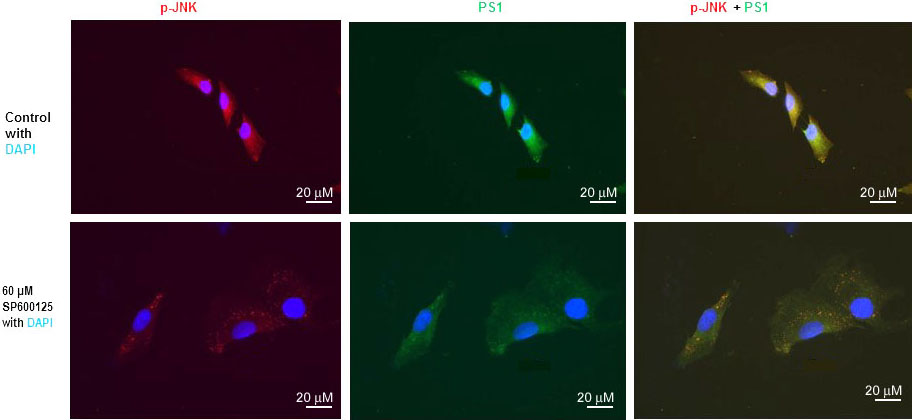 Figure 3
JNK-inhibitor SP600125 inhibits both p-JNK and PS1 expression in SK-N-SH cells. Immunofluorescent staining results show a significant decrease of p-JNK and PS1 in SP600125-treated SK-N-SH cells. Immunostaining of p-JNK (red), PS1 (green), and nucleus (blue) in SK-N-SH cells after treatment with DSMO (top panel) or 60 µM concentration of SP600125 (bottom panel) for 24 h. Yellow signifies colocalization of p-JNK and PS1 in the merge (PS1 + NICD + DAPI) image. Scale bar =20 μm.
The data presented here indicate that the transcription of the PS1 gene is regulated by both mTOR and JNK signaling pathways (Figure 4). We have previously shown that PS1 transcription can be controlled by JNK signaling pathway (15). We have also published that inhibition of basal c-jun-NH2-terminal kinase (JNK) activity by JNK inhibitor SP600125 represses PS1 transcription by reduction of p-JNK and by a p53-dependent mechanism resulting in the reduction of PS1 protein level in human neuroblastoma SK-N-SH cells (15). We showed that JNK inhibitor SP600125 suppressed PS1 expression by upregulating p53 protein levels (15). Transcriptional activator protein (Ets1/2) binds to the PS1 promoter (-25, +66) to activate PS1 transcription (15). p53-mediated repression of PS1 transcription is not due to direct interaction of p53 with the PS1 promoter region but due to decreased occupancy of transcriptional activator Ets1/2 into the PS1 promoter (-25, +66) because of p53-Ets1/2 interaction (15). We have previously reported that JNK inhibitor SP600125 enhances p53-Ets1/2 interaction and thus interferes with the DNA binding of Ets1/2 onto the PS1 promoter (15) leading to the repression of PS1 transcription, PS1 protein level, and PS1/gamma secretase activity (10, 15).
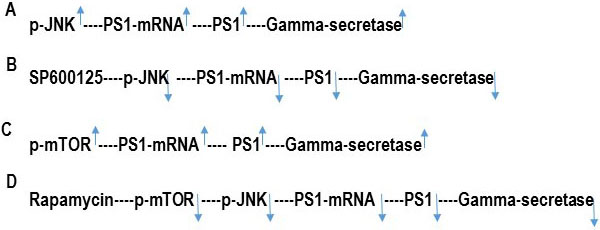 Figure 4
Hypothetical scheme of the inhibition of PS1/Gamma–secretase activity by JNK-inhibitor SP600125 and rapamycin. PS1 is the catalytic subunit of gamma-secretase enzyme. (A) p-JNK increases PS1transcription and PS1 protein expression. As a result, PS1 mediated gamma-secretase activity is increased. (B) JNK-inhibitor SP600125 inhibits p-JNK and consequently, decreases PS1 transcription, PS1 protein expression, and PS1/Gamma-secretase activity. (C) p-mTOR increases PS1transcription and PS1 protein expression. As a result, PS1 mediated gamma-secretase activity is increased. (D) Rapamycin inhibits p-mTOR which then decreases p-JNK. P-JNK consequently decreases PS1 transcription, PS1 protein expression, and PS1/Gamma-secretase activity.
The major pathways downstream of mTORC signaling include mRNA translation, metabolism, and protein turnover (17). The major pathway for protein turnover is the ubiquitin-proteasome system, through which proteins are selectively targeted for degradation by covalent modification with ubiquitin (18). We reported that rapamycin inhibited PS1 transcription (13). Therefore, repression of PS1 transcription appears to be a pathway downstream of mTORC signaling mechanism. But the precise molecular mechanisms by which rapamycin reduces PS1 transcription, and Abeta in AD is not well characterized. In our current study we set out to investigate the mechanism by which rapamycin inhibits PS1 transcription. We presented evidence that rapamycin decreased PS1 protein levels, PS1/gamma-secretase-mediated Notch 1 signaling by inhibiting PS1 transcription (13). In our current study we show that mTOR and JNK activate each other by mutual phosphorylation. It appears that reduction of p-mTOR by rapamycin decreases p-JNK resulting in suppression of PS1 transcription. It is also possible that inhibition of p-mTOR or p-JNK by rapamycin may inactivate transcriptional activator Ets1/2 and co-activator p300 of the PS1 gene (15, 19) to suppress PS1 transcription. In our future studies we will dissect the rapamycin response elements in the PS1 gene promoter and determine the direct roles of Ets1/2, p53 and p300 in the inhibition of PS1 transcription by rapamycin.
This research was partially supported by Institute for Healthy Aging of UNT Health Science Center. The authors have no conflict of interest to declare.
AD
Alzheimer's disease
β-amyloid precursor protein
4′-6 diamidino 2-phenylindole dihydrochloride
Ets transcription factor
Endoplasmic reticulum
eukaryotic initiation factor 4E (eIF4E)-binding protein-1
Hairy and enhancer of split-1
Immunofluorescent staining
c-jun-NH2-terminal kinase
Mammalian Target of Rapamycin
Notch intracellular domain
co-activator
Oncoprotein p53
Presenilin
p70 ribosomal S6 kinase 1
Sodium dodecyl sulfate polyacrylamide gel electrophoresis