


Frontiers in Bioscience-Landmark (FBL) is published by IMR Press from Volume 26 Issue 5 (2021). Previous articles were published by another publisher on a subscription basis, and they are hosted by IMR Press on imrpress.com as a courtesy and upon agreement with Frontiers in Bioscience.
 , Silahis S. Hontiveros 1
1 Department of Pharmacology and Neuroscience, UNT Health Science Center, 3500 Camp Bowie Boulevard, Fort Worth, TX 76107
2 Institute for Healthy Aging, UNT Health Science Center, 3500 Camp Bowie Boulevard, Fort Worth, TX 76107
Abstract
Presenilin-1 (PS1) protein is the catalytic subunit of the gamma-secretase, and participates in the processing of beta-amyloid precursor protein (APP) to produce Abeta peptide and Notch 1 receptor to release Notch intracellular domain (NICD) in the cytoplasm. NICD migrates to the nucleus and causes Notch signaling by increasing the expression of the Hes1 gene. The mammalian target of rapamycin (mTOR) controls cellular homeostasis, and its activity is inhibited by rapamycin. The buildup of Abeta increases the mTOR signaling, whereas decreasing mTOR signaling reduces Abeta levels suggesting an interrelationship between mTOR signaling and Abeta. Administration of rapamycin in 3XTg-AD mouse model of Alzheimer’s disease (AD) rescues cognitive deficits and ameliorates Abeta and Tau pathology. We have dissected the mechanisms by which rapamycin inhibits PS1 expression and Notch1 signaling. Our results demonstrated that rapamycin efficiently suppressed phosphorylation of mTOR (p-mTOR), and decreased expression of PS1-mRNA as well as p-p70S6K1, 4EBP1, PS1, NICD, and Hes1 protein levels. Therefore, rapamycin decreased PS1 protein levels and Notch 1 processing by inhibiting PS1 transcription.
Keywords
- Alzheimer's disease
- mTOR signaling
- PS1
- Notch signaling
- Hes1
Presenilin-1 (PS1) protein which is the catalytic subunit of the gamma-secretase enzyme is involved in the transmembrane cleavage of beta-amyloid precursor protein (APP) (1-4) and Notch 1 receptor (5, 6) to generate Abeta42-peptide fragments and Notch intracellular domain (NICD) respectively in the cytoplasm. Abeta42-peptide fragments form amyloid plaques, and accumulation of amyloid plaques causes degeneration of neurons in the brain during AD (7). On the other hand, NICD migrates to the nucleus and causes Notch signaling by increasing the expression of the Hes1 gene (8, 9). Excessive amount of NICD and increased Notch signaling exacerbate AD pathology. PS1 has been shown to function as passive endoplasmic reticulum Ca2+ (ERCa2+) leak channels (10, 11). We have previously reported that inhibition of PS1 transcription abrogates PS1/gamma-secretase activity and PS1/gamma-secretase independent ERCa2+ leak channels (10, 12). Mutated PS1-M146V has been shown by other investigator to decrease ERCa2+ leak, increase ERCa2+ pool, decrease cytosolic Ca2+ and deranged neuronal Ca2+-signaling resulting in neuronal cell death (11). Therefore, PS1 is important in many aspects of cellular functions.
The mammalian target of rapamycin (mTOR) is a Ser/Thr kinase (13). mTOR controls cellular homeostasis, and mTOR activity is inhibited by a FDA approved drug rapamycin. mTOR plays a key role in controlling protein homeostasis and mTOR activity is linked to learning and memory (14-17). It is reported that the buildup of Abeta increases the mTOR signaling, whereas decreasing mTOR signaling reduces Abeta levels (18). These results indicate a crucial relationship between mTOR signaling and Abeta (18). Administration of rapamycin in 3XTg-AD mouse model rescues cognitive deficits and ameliorates Abeta and Tau pathology by increasing autophagy (18).
We have published that inhibition of basal c-jun-NH2-terminal kinase (JNK) activity by JNK inhibitor SP600125 represses PS1 transcription resulting in the reduction of PS1 protein level in human neuroblastoma SK-N-SH cell line, mouse primary neurons (19), and mouse brains (20). In this report, we investigated whether rapamycin may also reduce PS1 expression by regulating PS1 transcription. We report that rapamycin decreases the expression of p-mTOR, p-p70S6K1, 4EBP1, PS1, NICD, and Hes1 proteins as well as PS1-mRNA in SK-N-SH cells.
Human neuroblastoma SK-N-SH cell line (ATCC, Manassas, Virginia, Cat#HTB-11) was maintained in Dulbecco’s modified Eagle medium containing 10% fetal bovine serum, 1% penicillin/streptomycin (Gibco, CA, USA). Rapamycin were purchased from (Calbiochem/EMD, CA, and USA).
Protein expression levels were measured using western blot analysis as mentioned previously. Briefly, cells were lysed with 1% protein lysis buffer (150 mM NaCl, 25 mM Tris-HCl pH 7.8, 1% NP-40, 10 mM NaF, 1 mM Na3VO4), and 50 µg of total proteins were separated in 12% sodium dodecyl sulfate–polyacrylamide gel electrophoresis. The blots were transferred to the polyvinylidene difluoride membranes and then blocked with SuperBlock T20 blocking buffer (Thermo Scientific, Rockford, IL). The membranes were incubated with SuperBlock T20 blocking buffer containing primary rabbit monoclonal against mTOR (Cell Signaling, Danvers, MA, Cat#2983S), p-mTORSer248 (Cell Signaling, Danvers, MA, Cat#5536S), mouse monoclonal 4EBP1 (Santa Cruz Biotechnology, Santa Cruz, CA, Cat#sc-81149), mouse monoclonal p-p70S6K1Thr389 (Santa Cruz Biotechnology, Santa Cruz, CA, Cat#sc-377529), mouse monoclonal p70S6K1 (Santa Cruz Biotechnology, Santa Cruz, CA, Cat#sc-393967), mouse monoclonal PS1 (Millipore, Bedford, MA, Cat#MAB5232), rabbit polyclonal antibody to activated Notch1 (abcam, Cambridge, MA, Cat#ab8925), rabbit polyclonal Hes1 (abcam, Cambridge, MA, Cat#ab71559), mouse monoclonal beta-Actin (Sigma, St Louis, MO, Cat#A5441) antibodies overnight at 40C. The dilution of primary antibodies were used for Western blot analysis as suggested by manufacturers. The blots were developed and visualized using enhanced chemiluminescence detection system (Pierce, Rockford, IL, USA).
Total RNA was extracted from the cells treated with DMSO or rapamycin (100 ng/mL, 200 ng/mL) for 24 h using trizol reagent (Invitrogen, CA). cDNA was synthesized synthesis with oligo-dT primers using SuperScript III-First-Strand synthesis system (Invitrogen, Carlsbad, CA, Cat#8080-051) according to manufacturer protocol. QPCR was performed by standard methods using SYBR Advantage QRT-PCR premix (Clontech, Mountain View, CA, and Cat #638321). Relative mRNA enrichment was calculated using the 2-ΔΔCT method by normalizing the quantity of GAPDH. QRT-PCR assays were run on a Bio-Rad CFX system (Bio-Rad, Hercules, and CA). QRT-PCR primers are listed in Table 1
| Gene | Forward primer (5′- -3′) | Reverse primer (5′- -3′) |
|---|---|---|
| PS1 | GGA GCC TGC AAG TGA CAA CAG C | GTC ACA GGG ACA AAG AGC ATG ATCA |
| GAPDH | AGG TCG GAG TCA ACG GAT TTG GTC G | GCA GAG ATG ATG ACC CTT TTG |
Cells were plated and cultured in a 24-well plate containing poly-lysine-coated coverslips (Costar, Cambridge, MA). Following treatment with DMSO or rapamycin and culturing at 37 °C for 24 h, the cells were washed with ice-cold TBS (10 mM Tris pH7.5, 150 mM NaCl) at room temperature for 10 min, fixed in 10% formalin for 15 min, permeabilized in 0.5 % Triton X-100 in TBS (TBST) for 10 min, blocked with 5% Goat Serum in Superblock for 45 minutes at room temperature. Then cells were stained with a primary antibodies such as rabbit monoclonal against p-mTOR (Cell Signaling Technology, Danvers, MA, Cat#5536S), mouse monoclonal PS1 (Millipore, Bedford, MA, Cat#MAB5232), rabbit polyclonal Notch 1 (abcam, Cambridge, MA, Cat#ab8925). After staining with primary antibody, cells were stained with a secondary antibody donkey anti-rabbit Alexa Fluor F594 (abcam, Cambridge, MA, Cat#150076), or donkey anti-mouse goat Alexa Fluor 488 (abcam, Cambridge, MA, Cat#150105), all in 1:500 in Superblock. Antibody-stained immunofluorescent samples were mounted by anti-fading aqueous mounting medium containing 4′, 6-diamidino-2-phenylindole dihydrochloride (DAPI) for nuclei staining and covered by cover slips. Extensive washes with TBST (TBS + 0.05% Tween 20) were performed between each step. Omission of the primary antibody in parallel staining was included as a control to ensure no non-specific staining. Images were taken using a Nikon EX300 microscope. The magnification indicated in each Figure shows that of the objective lens in Nikon EX300 fluorescent microscope.
All data was analyzed using prism software (Graphpad software Inc., La Jolla, CA, USA) and presented as means ± SEM. Comparison was made between groups by one-way ANOVA and Student–Newman–Keuls (SNK) test. A probability was considered to be significant with less than 0.05.
It was previously reported that the buildup of Abeta increased mTOR signaling, whereas decreasing mTOR signaling reduced Abeta, thereby highlighting an interrelationship between mTOR signaling and Abeta (18). These investigators used 0.5-50 µg/mL of rapamycin to demonstrate inhibition of mTOR signaling in 7PA2 cells. On the contrary, 100 ng/mL of rapamycin was used to inhibit m-TOR signaling in human neuroblastoma cell lines including SK-N-SH cells (21). To determine whether rapamycin controls PS1 expression, SK-N-SH cells were treated with DMSO or different concentrations of rapamycin for 24 h. Cell extracts were prepared and assayed for p-mTOR and PS1 protein levels by Western blot analysis. Rapamycin was effective at 50 ng/mL, 100 ng/mL and 200 ng/mL concentrations. There was no significant variation of total mTOR protein levels with increasing concentration of rapamycin (Figure 1A, Figure 1B). As shown in Figure 1A and Figure 1C, rapamycin decreased phosphorylation of mTOR (p-mTORSer248) in a concentration dependent manner whereas
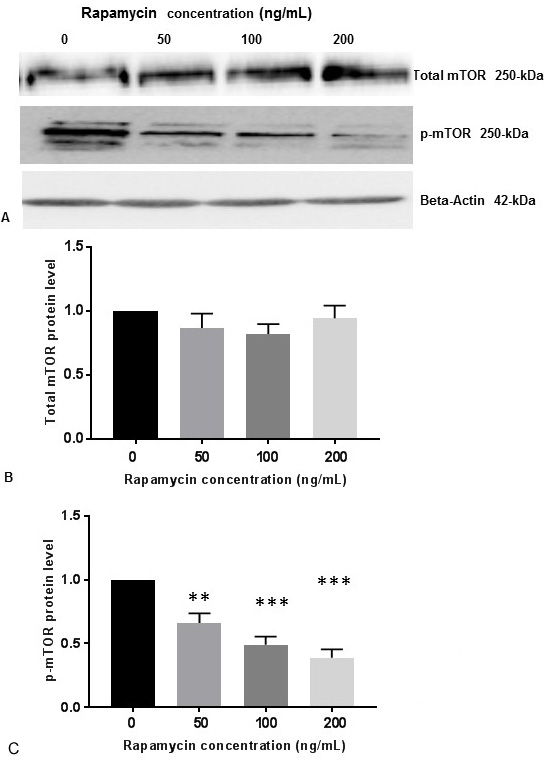 Figure 1
Rapamycin represses p-mTOR activity in SK-N-SH cells. (A) SK-N-SH cells were treated with indicated concentrations of rapamycin for 24 h. Then 50 mg of the total cell lysates were subjected to Western blot analysis with antibodies directed against phosphor- mTOR (p-mTOR) and mTOR. mTOR-specific band represents the total amount of phosphorylated and non-phosphorylated mTOR protein. Blots were developed by chemiluminescence and protein gel bands were quantified using Labworks Image Analysis Software. Positions of beta-actin (42-kDa), p-mTOR (250-kDa), and mTOR (250-kDa) protein bands are marked. (B) The graphs represent means±SEM of mTOR expression levels from 3 independent determinations (n=3) normalized against beta-actin. No statistical significance (ns) was observed between control and rapamycin treated cells with P =0.4823. (C)The graphs represent means±SEM of p-mTOR expression levels from 8 independent determinations (n=8) normalized against beta-actin. Statistical significance was denoted by asterisks. **P<0.01. ***P<0.001.
p70S6K1 is a downstream substrate for p-mTOR. Therefore, phosphorylation of p70S6K1 to p-p70S6K1-Thr389 is a measure for p-mTOR activity (18). We also determined the p-p70S6K1 levels by Western blot analysis in SK-N-SH cells with 50 ng/mL, 100 ng/mL and 200 ng/mL concentrations of rapamycin. There were no significant changes of total p70S6K1protein levels with increasing concentration of rapamycin (Figure 2A, Figure 2B). It appears that rapamycin was very effective at these concentrations to reduce p-p70S6K1 protein levels (Figure 2A, Figure 2C).
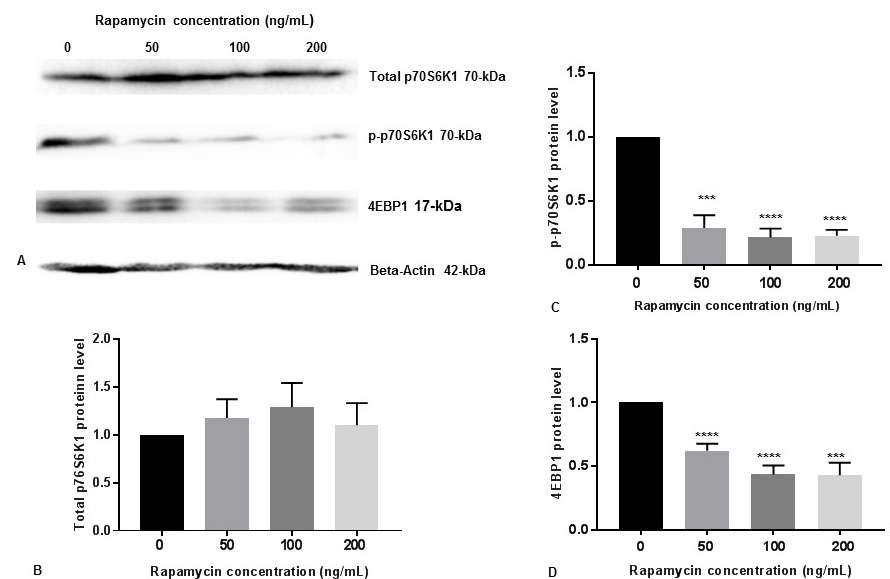 Figure 2
Rapamycin represses p-p70S6K1 activity and 4EBP1 in SK-N-SH cells. (A) SK-N-SH cells were treated with indicated concentrations of rapamycin for 24 h. Then 50 mg of the total cell lysates were subjected to Western blot analysis with antibodies directed against phosphor-p70S6K1 (p-p70S6K1), p70S6K1, and 4EBP1. p70S6K1-specific band represents the total amount of phosphorylated and non-phosphorylated p70S6K1 protein. Blots were developed by chemiluminescence and protein gel bands were quantified using Labworks Image Analysis Software. Positions of beta-actin (42-kDa), p-p70S6K1 (70-kDa), and p70S6K1 (70-kDa) protein bands are marked. (B) The graphs represent means±SEM of p70S6K1 expression levels from 3 independent determinations (n=3) normalized against beta-actin. No statistical significance (ns) was observed between controls and rapamycin treated cells with P =0.7752. (C) The graphs represent means±SEM of p-p70S6K1 expression levels from 6 independent determinations (n=6) normalized against beta-actin. Statistical significance was denoted by asterisks. ***P =0.0004. ****P<0.0001. (D) The graphs represent means±SEM of 4EBP1 expression levels from 6 independent determinations (n=6) normalized against beta-actin. Statistical significance was denoted by asterisks. ***P=0.0001. ****P<0.0001.
The eukaryotic initiation factor 4E (eIF4E)-binding protein-1 (4EBP1)-eIF4E effector pathway is downstream of mTOR which regulates cap-dependent mRNA translation (22). We tested the effects of 50 ng/mL, 100 ng/mL and 200 ng/mL concentrations of rapamycin on 4EBP1 protein levels in SK-N-SH cells. We also observed that rapamycin effectively reduced 4EBP1 expression at these concentrations (Figure 2A, Figure 2D).
We measured PS1 protein levels in SK-N-SH cells by Western blot analysis with 100 ng/mL and 200 ng/mL concentrations of rapamycin. PS1 protein level was decreased (Figure 3A, Figure 3B) substantially in a concentration dependent manner with 100 ng/mL and 200 ng/mL concentrations of rapamycin.
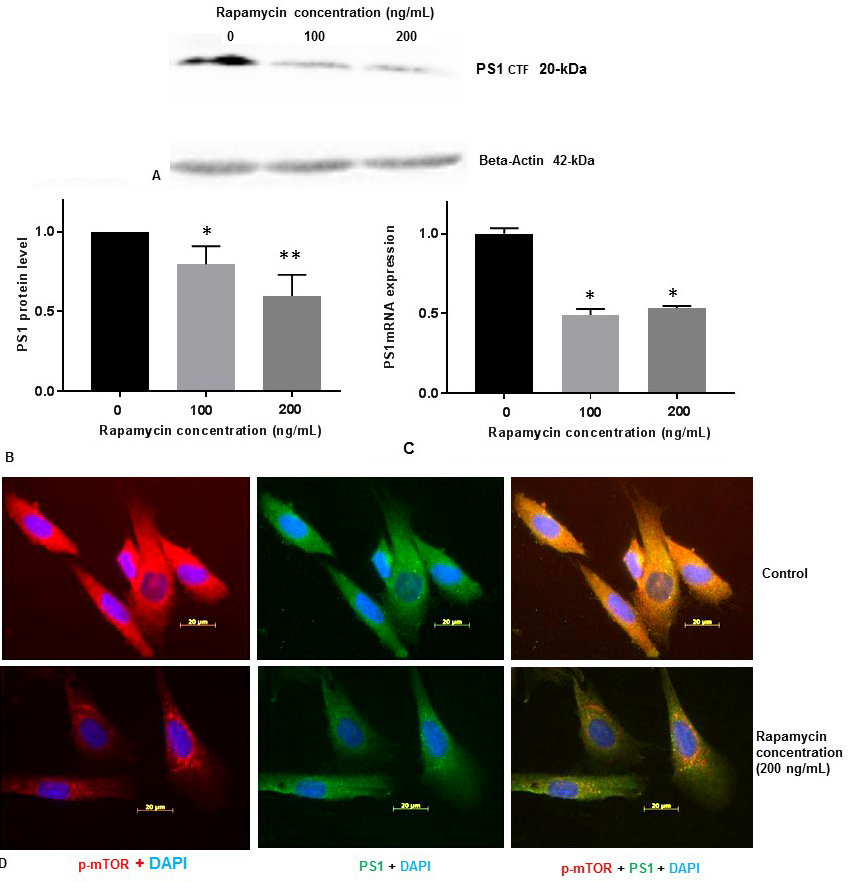 Figure 3
Rapamycin represses PS1 protein and PS1-mRNA expression in SK-N-SH cells. (A) SK-N-SH cells were treated with indicated concentrations of rapamycin for 24 h and lysed for Western blotting with antibodies against PS1. Blots were detected by chemiluminescence (ECL). (B)The protein band for PS1 and beta-actin (42-kDa) were quantified using Labworks Image Analysis Software. PS1 protein (~20-kDa PS1CTF) levels were normalized against beta-actin protein levels and presented as means±SEM from 4 independent determinations (n=4). Statistical significance was denoted by asterisks. *P<0.05. **P<0.01. (C) PS1 mRNA level was measured from SK-N-SH cells treated with DMSO or 100 ng/mL or 200 ng/mL rapamycin for 24h by QPCR. PS1 mRNA level was normalized against GAPDH mRNA level and presented as means±SEM from 3 independent determinations (n=3). Statistical significance was denoted by asterisks. *P<0.05. (D) Immunostaining of p-mTOR (red), PS1 (green), and nucleus (blue) in SK-N-SH cells after treatment with DSMO (top panel) or 200 ng/mL rapamycin (bottom panel) for 24 h. Yellow signifies colocalization of p-mTOR and PS1 in the merge (p-mTOR + PS1 + DAPI) image. Immunofluorescent staining results show a significant decrease of p-mTOR (red) and PS1 (green) in rapamycin treated cells. Scale bar =20 μm.
To determine whether rapamycin promotes PS1 repression at the level of transcription, we treated SK-N-SH cells with 100 ng/mL and 200 ng/mL concentration of rapamycin. Total RNA was prepared from SK-N-SH cells after treatment of cells with DMSO or 100 ng/mL or 200 ng/mL concentration of rapamycin for 24 h. Total RNA was used to synthesize cDNA using oligo-dT primers and reverse transcriptase. QRT-PCR was performed with cDNA and human GAPDH and PS1-specific oligonucleotide primers to determine the levels of expression of GAPDH-mRNA and PS1mRNA respectively. Relative expression of PS1mRNA relative to GAPH-mRNA was determined. PS1mRNA level was decreased by ∼50% with 100 ng/mL and 200 ng/mL concentration of rapamycin (Figure 3C). This data suggests that mTOR signaling pathway may also be involved in the regulation of PS1mRNA expression in SK-N-SH cells.
We also performed immunofluorescent staining (IFS) of SH-N-SH cells with p-mTOR and PS1 antibodies (Figure 3D). We used 200 ng/mL of rapamycin for all our IFS staining experiments because both p-mTOR and PS1 were reduced drastically with 200 ng/mL concentration of rapamycin (Figure 1C, Figure 3B). Our IFS confirmed that reduction of p-mTOR by rapamycin decreased PS1 protein levels. Therefore, it appears that PS1 protein expression is regulated by mTOR signaling pathway
To confirm that inhibition of PS1 protein expression by rapamycin also inhibits Notch1 processing, we examined the levels of NICD in SK-N-SH cells after treatment with rapamycin (200 ng/mL) for 24 h. We performed IFS with PS1 and NICD antibodies. As shown in Figure 4, PS1 and NICD protein levels were drastically reduced in SK-N-SH cells after treatment with rapamycin. We observed the nuclear localization of NICD. The cytosolic staining observed could be due to full length Notch 1 which may be expressed in endoplasmic reticulum and detected by NICD antibody. These results suggest that PS1 expression and PS1-mediated Notch 1 processing are regulated by mTOR signaling pathway.
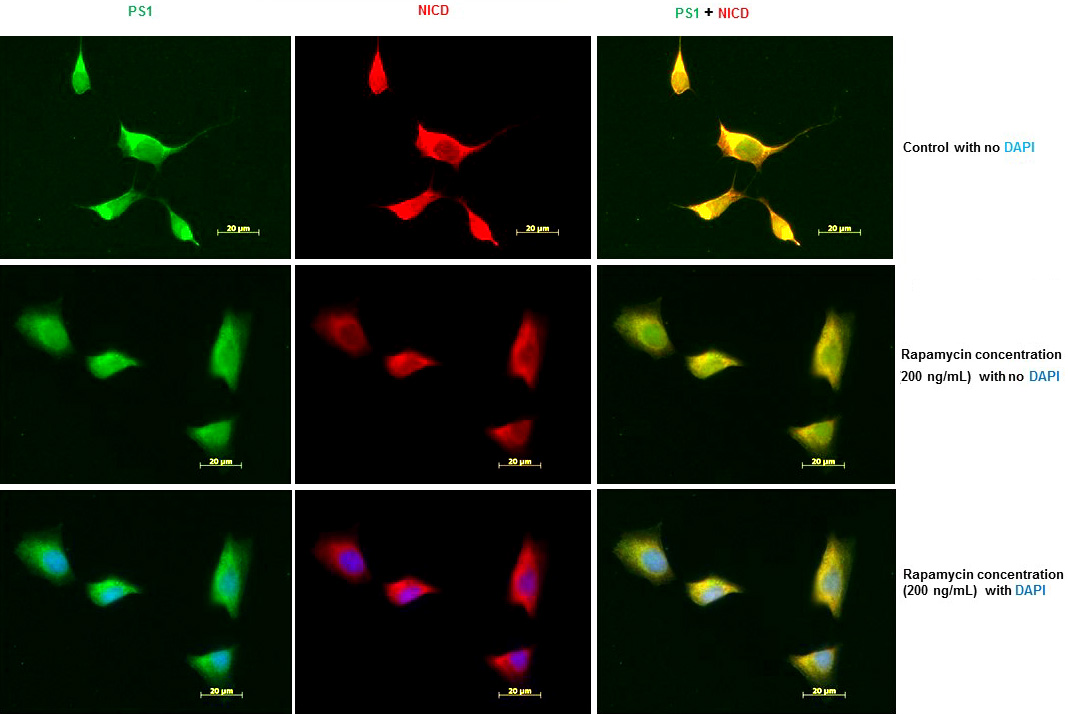 Figure 4
Rapamycin inhibits Notch 1 processing and Notch 1 signaling in SK-N-SH cells. (A) Immunofluorescent staining results show a significant decrease of PS1 and NICD in rapamycin-treated SK-N-SH cells. Immunostaining of PS1 (green), NICD (red), and nucleus (blue) in SK-N-SH cells after treatment with DSMO (top panel) or 200 ng/mL rapamycin (bottom panel) for 24 h. Yellow signifies colocalization of PS1 and NICD in the merge (PS1 + NICD + DAPI) image. Scale bar =20 μm.
PS1 is the catalytic subunit of gamma-secretase enzyme which cleaves Notch1 receptor on the plasma membrane to produce NICD. NICD subsequently migrates from cytoplasm to the nucleus and regulates transcription of many neuronal genes including Hes1. This pathway is referred as Notch 1 signaling. We performed Western blot analysis to show that inhibition of p-mTOR by rapamycin reduced the levels of Hes1 protein (Figure 5A, Figure 5B). This result suggests that rapamycin inhibits Notch 1 signaling by decreasing the downstream expression of Hes1.
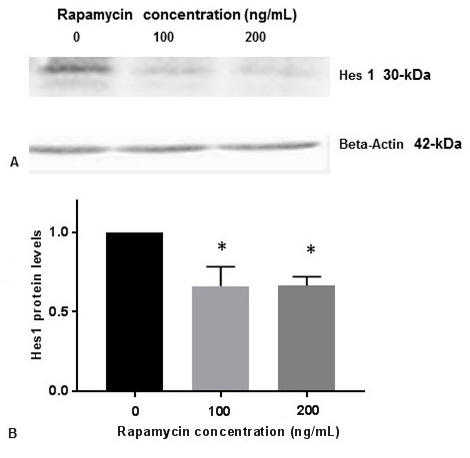 Figure 5
Rapamycin inhibits Hes1 protein expression. SK-N-SH cells were treated with indicated concentrations of rapamycin for 24 h and lysed for Western blotting with antibodies against Hes1. 50 µg of protein were used for Western blot analysis. Blots were detected by chemiluminescence (ECL). The blots were visualized using ECL detection system. Positions of Actin (42-kDa) and Hes1 (30-kDa) protein bands are marked. (B) The band intensities for Hes1 protein was quantified using Labworks Image Analysis Software. The levels of Hes1 protein were normalized against actin protein levels and presented as means ± SEM from 3 independent determinations (n=3). Statistical significance was denoted by asterisks.* P<0.05.
The data presented here indicate that the transcription of the PS1 gene is regulated by mTOR signaling pathway. We have previously shown that PS1 transcription can be controlled by a JNK signaling pathway. We have recently published that inhibition of c-jun-NH2-terminal kinase (JNK) activity by JNK inhibitor SP600125 decreases PS1 transcription by a p53 dependent mechanism in human neuroblastoma SK-N-SH cell line, mouse primary neurons (19), and mouse brains (20). We showed that JNK inhibitor SP600125 decreases PS1 transcription and PS1 protein levels by upregulating p53 (19). We have shown that p53-mediated repression of PS1 transcription is due to decreased occupancy of transcriptional activator Ets1/2 into the PS1 promoter as a result of p53-Ets1/2 interaction (19). JNK inhibitor SP600125 enhances p53-Ets1/2 interaction and thus interferes with the DNA binding of Ets1/2 transcription factor onto the PS1 promoter (19) leading to the repression of PS1 transcription, PS1 protein level, and PS1/gamma-secretase activity (12).
It has been reported that mTOR controls cellular homeostasis, and its activity is inhibited by rapamycin (22). It is to be noted that mRNA translation, metabolism, and protein turnover appear to be regulated by mTOR signaling (22). Therefore, mTOR plays a key role in controlling protein homeostasis through regulation of protein synthesis and degradation (14-17). Consequently, mTOR activity has been directly linked to learning and memory (14-17). The major pathway for protein turnover is the ubiquitylation of the proteins which are selectively targeted for degradation. It was reported that that mTOR inhibition increases proteasome-dependent proteolysis through increase in protein ubiquitylation (23), or an increased abundance of proteasomal chaperones via inhibition of Erk5 (24).
It has been reported that the buildup of Abeta increases the mTOR signaling (18). All these studies indicate the beneficial effect of mTOR inhibition to ameliorate cognitive dysfunction in neurodegenerative diseases including AD (18). But the precise molecular mechanisms by which rapamycin reduces Abeta in AD is not well characterized. In our current study we set out to investigate how rapamycin regulates PS1 protein expression and PS1/gamma-secretase mediated Notch 1 processing. We present evidence that rapamycin decreases PS1 protein levels, and PS1/gamma-secretase-mediated Notch 1 signaling by inhibiting PS1 transcription (Figure 6). It is possible that reduction of p-mTOR by rapamycin could inhibit PS1 transcription by a JNK signaling pathway as reported by us (19). In our future studies we will dissect the rapamycin response elements in the PS1 gene promoter to verify the potential mechanisms of PS1 transcription outlined above.
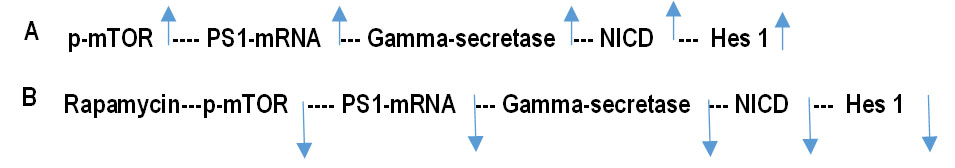 Figure 6
Hypothetical scheme of the inhibition of PS1/gamma–secretase activity and Notch1 signaling by rapamycin. PS1 is the catalytic subunit of gamma-secretase activity. (A) p-mTOR increases PS1transcription and PS1 protein expression. As a result, PS1 mediated gamma-secretase activity and production of NICD by gamma-secretase mediated transmembrane proteolytic cleavage of Notch 1 are increased. NICD migrates to the nucleus and increases Hes1 protein expression. (B) Rapamycin inhibits p-mTOR and consequently decreases PS1 transcripion, and protein expression of PS1, NICD, and Hes 1.
Rapamycin inhibits both p-p70S6K1, and 4EBP1 in SK-N-SH cells (Figure 2). Since the p-p70S6K1-4EBP1-eIF4E effector pathway exists downstream of mTOR, this effector pathway may potentially regulate PS1 protein translation (22). Therefore, inhibition of PS1 protein level by rapamycin may be also due to reduced rate of PS1-mRNA translation or increased catabolism of PS1 protein via PS1 degradation following covalent modification with ubiquitin (22). All these plausible mechanisms of PS1 inhibition need to be investigated to better understand how reduction of mTOR signaling may improve cognitive function in 3XTg-AD mouse model and AD patients.
This research was partially supported by Institute for Healthy Aging of UNT Health Science Center. The authors have no conflict of interest to declare.
AD
Alzheimer's disease
β-amyloid precursor protein
4′-6 diamidino 2-phenylindole dihydrochloride
Endoplasmic reticulum
Glyceraldehyde-3-phosphate dehydrogenase
eukaryotic initiation factor 4E (eIF4E)-binding protein-1
Hairy and enhancer of split-1
Immunofluorescent staining
c-jun-NH2-terminal kinase
Mammalian Target of Rapamycin
Notch intracellular domain p53
p53
Presenilin
Real time quantitative reverse transcription-polymerase chain reaction
p70 ribosomal S6 kinase 1
Sodium dodecyl sulfate polyacrylamide gel electrophoresis