


Frontiers in Bioscience-Landmark (FBL) is published by IMR Press from Volume 26 Issue 5 (2021). Previous articles were published by another publisher on a subscription basis, and they are hosted by IMR Press on imrpress.com as a courtesy and upon agreement with Frontiers in Bioscience.
Retraction published on 24 Mar 2025, see Frontiers in Bioscience-Landmark 2025, 30(3)

1 Department of Nephrology, The First people’s Hospital of Wenling and The Affiliated Wenling Hospital of Wenzhou Medical university. Wenling, 317500, Zhejiang, P. R. China
Abstract
Diabetes causes diabetic nephropathy (DN) which is associated with increased morbidity and mortality in diabetic patients. We tested whether Resveratrol (Res) reverses the systemic effect of Streptozotocin (STZ) induced diabetes and DN. Res treatment opposed the effect of STZ on kidney weight, 24 h urinary albumin excretion, blood urea nitrogen (BUN) and serum creatinine (Scr). Res also decreased DN induced mTOR/ULK1-mediated autophagy and apoptosis and significantly reduced STZ mediated lipid deposition in nephrons, likely by decreasing the levels of lipogenic related proteins (SREBP-1c, ACS) and increased lipidolysis related proteins (PPARα, CPT-1). Together, these findings show the potential of Res in prevention of diabetic nephropathy.
Keywords
- Resveratrol
- Renal dysfunction
- Diabetic nephropathy
- mTOR/ULK1 pathway
- Autophagy
Diabetic nephropathy (DN) is the leading cause of end-stage renal disease in diabetes mellitus (1). Current interventions for reducing the DN include preventing the increase the blood level of blood sugar and lipid, and blood pressure. However, such remedies have not decreased the risk and health burden of DN, requiring strategies that can directly reduce the impact of diabetes on kidney. In patients with type 2 diabetes, dyslipidemia is a reversible risk factor for the progression of kidney disease and hence its prevention can restore lost kidney function (2). In patients with type 2 diabetes, the serum level of lipids including total cholesterol (TC), triglyceride (TG), and free fatty acid (FFA) is increased. In these patients, the expression of lipid metabolism genes is dysregulated and lipids progressively accumulate in the DN kidneys (3-5). Another process involved in the pathogenesis of DN is autophagy, an intracellular degradation system that normally delivers cytoplasmic constituents to lysosome to maintain intracellular homeostasis (6-8). Among the Mechanistic Target of Rapamycin (mTOR) members, Mammalian Target of Rapamycin Complex 1 (mTORC1) suppresses autophagy by modulating ULK1 phosphorylation and has been reported to reduce type 1 and type 2 DNs (9, 10). Here, we tested the effects of Resveratrol (3,4’,5-trihydroxystlben (Res) in a Streptozotocin (STZ) induced DN. Res is a polyphenolic compound, derived from fruits with multiple bioactivities, including amelioration of renal insufficiency (11).
Male, 6-week-old Sprague–Dawley (SD) rats were obtained from Animal center of The First People’s Hospital of Wenling. All animal experiments were performed according to the guidelines of Institutional Animal Care and Use of Laboratory Animals and were approved by Animal Research Ethics Committee of The First People’s Hospital of Wenling. Rats were housed individually under controlled temperature (23 °C) and humidity (55%) with an artificial light cycle and had free access to food and water and. Streptozotocin (STZ, Sigma-Aldrich, St Louis, MO, USA) was used to induce DN in rats. Rats (n=10), were injected intraperitoneally with 55 mg/kg STZ for 2 weeks. Rats were considered to have diabetes when their blood glucose levels exceeded 16 mmol/L. The experimental rats received either 5 or 20 mg/kg of Res (Sigma Chemical Co. MO, USA) diluted in sterile saline. The Res was administered orally by daily gavage received for 8 weeks. The control animals (n=10), instead of receiving STZ, were administered with saline injection. Kidneys, urine and blood samples were collected at the times indicated in the text. One hour before modeling, rats were intraperitoneally given autophagy inhibitor 3-MA (10 mg/kg)
Renal function was assessed by determining the total body weight and weights of kidneys, the concentration of the albumin in the urine by ELISA (Nanjing Jiancheng Bioengineering Institute, Nanjing, China) according to the manufacturer’s instructions and by measuring the blood urea nitrogen (BUN) and serum creatinine (Scr) using an automatic biochemistry analyzer (Olympus AU2700, Japan).
Kidney tissues were fixed in 4% formaldehyde for 24 hours. After decalcification in 20% ethylenediamine tetra acetic acid (EDTA), the kidneys were cut into 5-μm slices, dehydrated in ascending series of alcohol and embedded in paraffin and sectioned into 4 mM thickness. After dewaxing in xylene, sections were stained in hematoxylin-eosin (H&E)-stained sections using an optical microscope (BX51; Olympus Corp., Tokyo, Japan). Morphologic changes, infiltration of the tissues by inflammatory cell and extent of fibrosis were examined in the H&E sections.
The concentrations of total cholesterol (TC), Triglyceride (TG), low density lipoprotein (LDL-C) and high-density lipoprotein (HDL-C) were measure by an automatic biochemistry analyzer (Olympus AU2700, Japan).
Cell proteins were extracted in RIPA Lysis Buffer (Beyotime Institute of Biotechnology, Shanghai, China). Proteins were quanitified by Bradford assay. Equal amounts of protein were separated in 10% SDS-PAGE gel and then transferred to PVDF membranes. After blocking in skim milk for 1 hour at room temperature, the membranes were incubated with primary antibody overnight at 4 °C. The antibodies to PPARα, CPT-1, ACS (Abcam, Cambridge, UK); SREBP-1c (Thermo Scientific, Rockford, IL, USA); Beclin1, LC3 I / II, mTOR, p-mTOR , ULK1, p-ULK1 (Cell Signaling Technology, Beverly, MA, USA) were used at 1:1000 dilution. Membranes were washed three times with TBST and then incubated with goat anti-rabbit or mouse IgG peroxidase (HP)-conjugated secondary antibody (Thermo Scientific, Rockford, IL, USA). The peroxidase was detected using enhanced chemiluminescence (ECL, PerkinElmer, Boston, MA, USA).
Renal tissues were cut into 5-μm slices, fixed in 4% paraformaldehyde, dehydrated in ascending series of alcohol and embedded in paraffin and sectioned into 4 mM thickness. After dewaxing in xylene, sections were rehydrated in increasing gradients of ethanol and hydrated in a citrate solution. Sections were blocked with a buffer with normal serum and then incubated with primary monoclonal antibodies (Caspase-3, #9662, 1:1000, CST, USA; LC3, #3868, 1:200, CST, USA) overnight at 4 °C and then they were washed with TBST three times. For IHC of Caspase-3, sections were incubated with peroxidase labeled secondary antibody at room temperature for 30 min. Peroxidase activity was revealed by staining with SignalStain® DAB (#8059, CST, USA). For immunofluorescence assessment of LC3, the sections were incubated with a rhodamine-conjugated secondary antibody. Sections were counterstained in DAPI (#8961, CST, USA) and covered with ProLong® Gold Antifade Reagent. Images were captured using a fluorescence microscope (Nikon Corporation, Tokyo, Japan).
Data was expressed as the mean ± standard deviation (SD) of at least three independent experiments. All statistical analysis were performed with SPSS 19.0. Group comparisons were conducted using Student’s t test or One-way ANOVA. The difference was considered statistically significant at P < 0.05.
As compared to the control group, there was a significant increase in body weights, 24 h urine protein (PRO), and serum BUN and creatinine in animals that received STZ (Figure 1A-C). While STZ induced DN was associated with higher serum levels of TC, TG, LDL-Chol and lower levels of HDL-Chol, treatment with Res prevented such changes (Figure 1D-G).
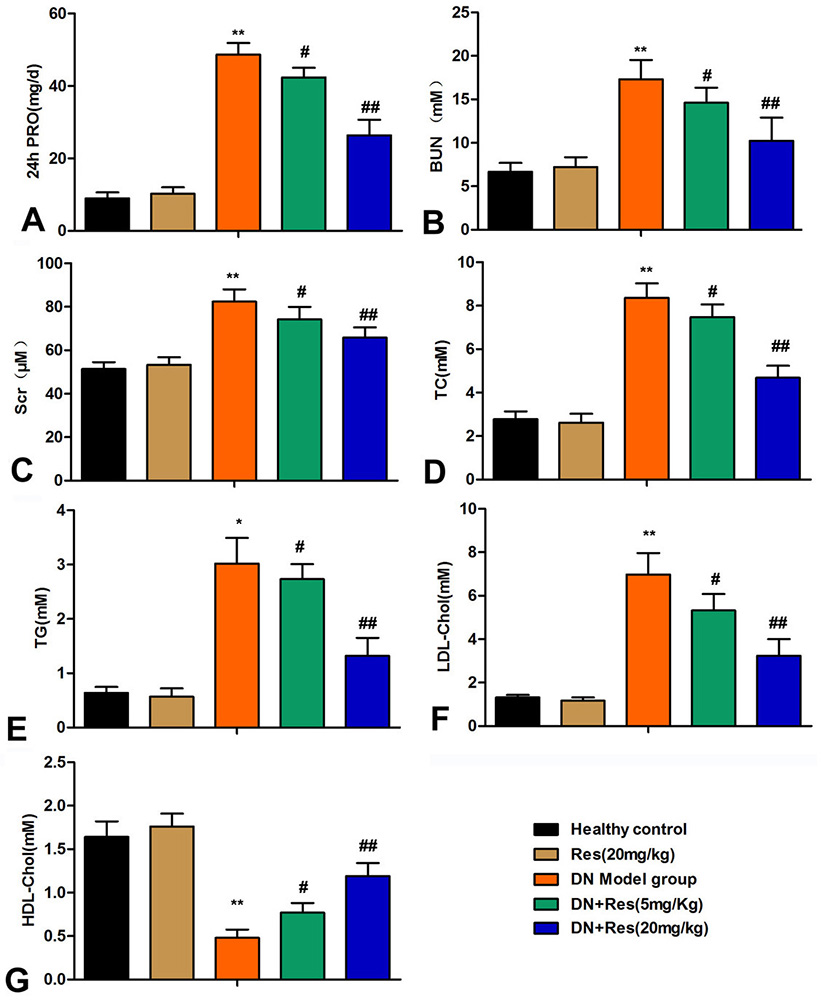 Figure 1
Res reverts physical and biochemical alterations in the serum inducible by STZ. (A) Level of 24h PRO in each group. (B) Level of BUN in each group. (C) Level of Scr in each group. (D-G) Levels of TC, TG, LDL-Chol and HDL-Chol in each group.Bars showed means ± SD of three independent experiments. **P < 0.01 vs. Healthy control group, #P < 0.05, ##P < 0.01 vs. DN model group.
As compared to the control group, there was a significant increase in kidney in animals that received STZ. However, treatment with Res, in a dose dependent manner, inhibited a such change (Figure 2A). Consistent with increase in kidney weight, histologically, sections of the kidneys of STZ treated animals revealed evidence of edema, necrosis and apoptosis, inflammatory infiltrate, glomerular sclerosis, increased mesangial matrix and fibrosis, and thickening of the basement membranes. These pathologic features including apoptosis all subsided, in a dose-dependent manner, by the treatment with Res (Figure 2B-C).
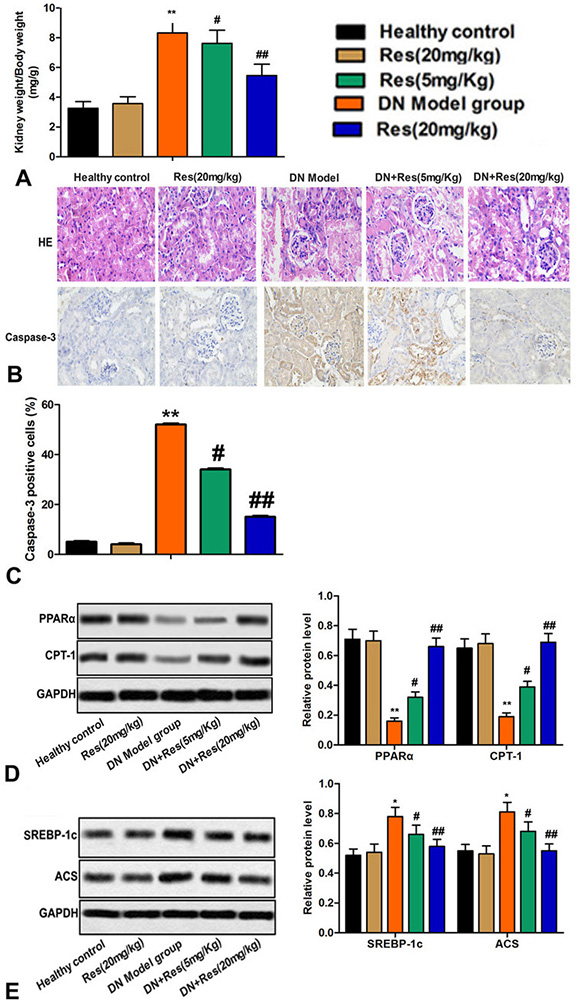 Figure 2
Res reverts alterations in kidney inducible by STZ. (A) Kidney weight/body weight in each group. (B) Pathological damage of kidney tissue was measured by HE staining in each group. (C) Expression of caspase-3 was measured by immunohistochemistry in each group. (D-E) Relative protein levels of PPARα, CPT-1, SREBP-1c and ACS were detected by western blot. Bars showed means ± SD of three independent experiments. **P < 0.01 vs. Healthy control group, #P < 0.05, ##P < 0.01 vs. DN model group.
The PPARs (PPARα, PPARβ, and PPARγ) are involved in the transport of TG in the blood, uptake of cellular fatty acid and oxidation of mitochondrial beta (12). PPARα plays an important role in regulating the oxidation of mitochondrial and peroxisomal fatty acid, including modulation of downstream targets, such as CPT-1 (13). SREBP-1c is a transcription factor that activates many genes involved in lipid synthesis and deposition (14). ACS is an enzyme involved in the metabolism of acetic acid. The expression of several key genes including lipogenic related proteins (SREBP-1c, ACS) was increased and expression of lipidolysis related proteins (PPARα, CPT-1) was diminished in the kidneys of STZ treated animals (Figure 2D-E). Res, a dose-dependent manner decreased the extent of such changes (Figure 2D-E).
Among members of mTOR, mTORC1, by stimulating biosynthetic pathways, promotes cell growth, while it inhibits cellular catabolism through repression of the autophagic pathway (15). It was suggested that Ulk1 is primarily responsible for induction of autophagy since the single knockdown of Ulk1 is able to inhibit this process (15, 16). To this end, we examined the role of mTORC1, ULK1 and autophagy-related proteins (Beclin1, LC3I/II). Res treatment also significantly down-regulated the p-mTOR/mTOR and up-regulated the p-ULK1/ULK1 (Figure 3A-B). While STZ diminished the number of cells in the kidneys that were stained positive for autophagy-related proteins (Beclin1, LC3I/II) Res treatment significantly increased the number of these cells in the kidneys (Figure 3C).
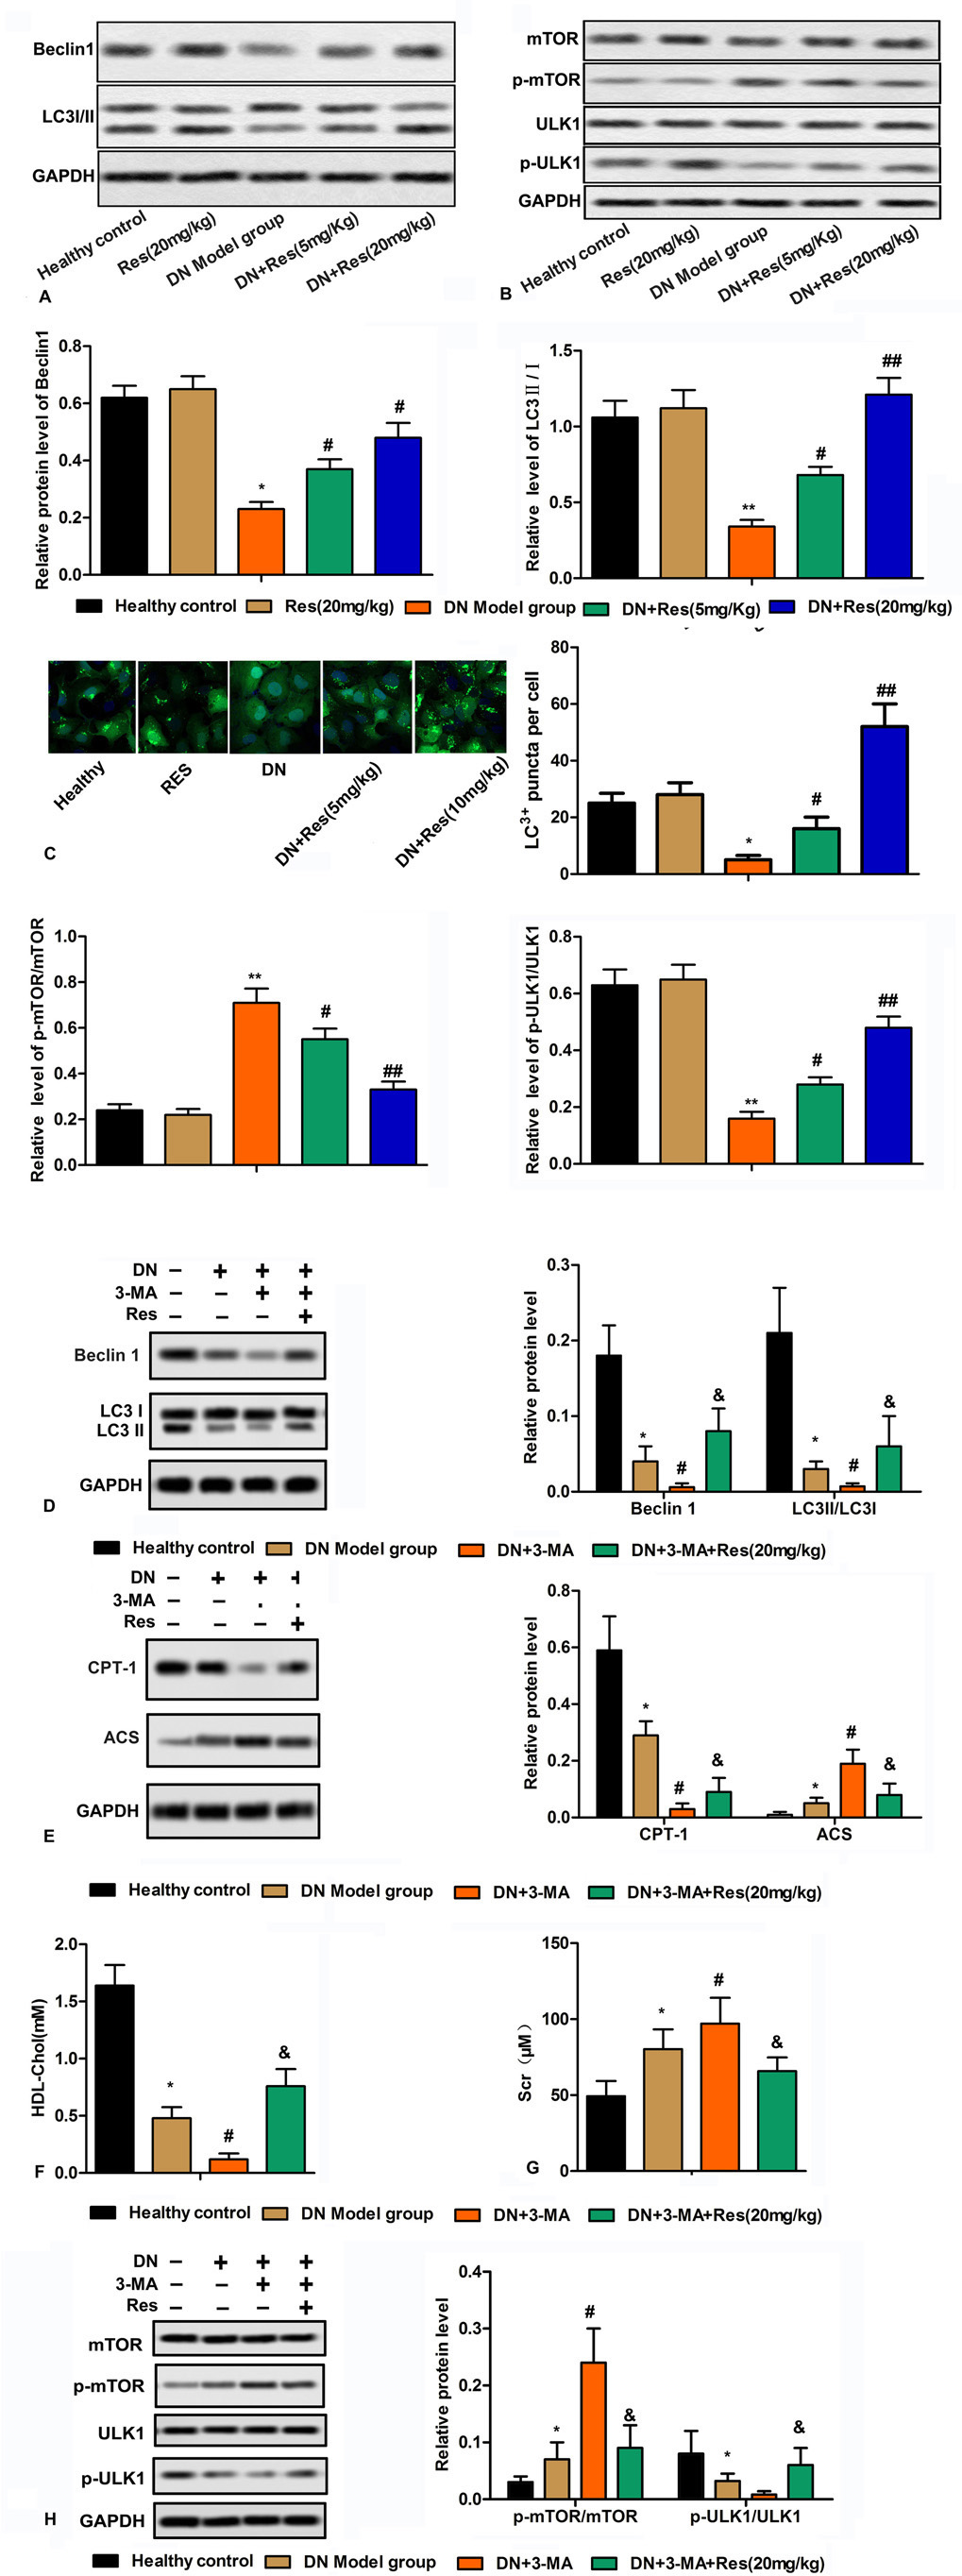 Figure 3
Res reverts alterations in kidney inducible by STZ by inhibiting autophagy. (A-B) Relative protein levels of Beclin1, LC3 I/II, mTOR, p-mTOR, ULK1 and p-ULK1 were detected by western blot. (C) LC3+ puncta were measured by immunofluorescence assay. Bars showed means ± SD of three independent experiments. *P < 0.05 vs. Healthy control group, #P < 0.05 vs. DN model group. (D) Relative protein levels of Beclin1 and LC3II/I were detected by western blot in each group. (E) Relative protein levels of CPT-1 and ACS were detected by western blot in each group. (F-G) Levels of Scr and HDL-Chol in each group. (H) Relative protein levels of mTOR, p-mTOR, ULK1 and p-ULK1 were detected by western blot in each group. Bars showed means ± SD of three independent experiments. *P < 0.05 vs. Healthy control group, #P < 0.05 vs. DN model group, &P < 0.05 vs. DN + 3-MA group.
To examine whether Res directly impacts DN through regulating autophagy, we used 3-Methyladenine (3-MA) which inhibits autophagy by the inhibition of phosphatidylinositol 3-kinases (PI3K) (17). The effect of STZ on the protein levels of Beclin1 and LC3II/I was reduced in the kidneys of the animals that were treated with 10 mg/kg 3-MA (Figure 3D). 3-MA (10 mg/kg) also reduced serum levels of creatinine, CPT-1, a downstream target of PPARα, and HDL-Chol while it increased the serum levels of lipogenic related protein in STZ treated animals (Figure 3E-G). Treatment of animals that received STZ and 3-MA was counteracted with Res (20 mg/kg) (Figure 3E-G). Res treatment (20 mg/kg) also reduced mTOR phosphorylation as compared to those that were treated with STZ and 3-MA, while it increased the phosphorylation level of ULK1. (Figure 3H).
Diabetes is a major cause of chronic kidney nephropathy (DN). STZ induces diabetes and we used this model to induce DN changes in the kidneys in rats. STZ induced DN is characterized by the enlargement of kidneys, proteinuria manifested by increase in 24 h urinary albumin excretion, and in increases in blood urea nitrogen (BUN) and serum creatinine (Scr) (18-20). STZ induced DN also leads to mTOR/ULK1-mediated autophagy and apoptosis in the kidneys and significantly reduces STZ induced lipid deposition in nephrons (21). In the present study, we demonstrated that Res treatment significantly improved the systemic effects of STZ induced DN, and reduces its impact on the weight, structural changes including apoptosis and fibrosis. Res also improves the kidney function involved by DN as evidenced by reduced albuminuria and reducing the serum level of creatinine and BUN. Consistent with such results, others have shown that Res treatment relieved albuminuria and alleviated oxidative stress and inflammation in the kidneys of db/db mice (22, 23).
DN induced disturbances in lipid metabolism are manifested by changes in serum lipid levels and heavy lipid deposition in tissues such as kidney, and lipotoxicity (5, 24). The lipid metabolism is disturbed in kidneys involved by DN and deposition of lipid in such kidneys leads to lipotoxicity which is displayed by cell dysfunction and tissue injury (25-28). As shown here, Res reduced the serum levels of TC, TG and LDL-Chol in DN animal models, while it increased the serum level of HDL-Chol. These findings suggest that Res alleviates lipid dysregulation by increasing the level of lipidolysis related proteins (PPARα, CPT-1), and by decreasing the level of lipogenic related proteins (SREBP-1c, ACS) in DN.
To maintain homeostasis, by the process of autophagy, cells eliminate the long-lived proteins and damaged organelles (29). Here, we showed data that support that Res normalizes lipid metabolism in STZ-induced DN by inducing AMPK/mTOR-mediated autophagy (30, 31). Res treatment significantly down-regulated the p-mTOR/mTOR and up-regulated the p-ULK1/ULK1. While STZ diminished the number of cells in the kidneys that were stained positive for autophagy-related proteins (Beclin1, LC3I/II), Res increased the expression of Beclin1, and also increased the ratio of LC3II/LC3I. Res alleviates STZ-induced DN by ameliorating lipid metabolism, inhibiting apoptosis and inducing autophagy in DN. Consistent with such results, others have shown that Res also improves the DN by increasing miRNA-18a-5p mediated autophagy (23). Together, these findings show the potential of Res in prevention of diabetic nephropathy and in its treatment.
Huiping Zhu, Sen Zhong contributed equally to this work and should be considered co-first authors. This research did not receive any specific grant from funding agencies in the public, commercial, or not-for-profit sectors.
DN
Diabetic nephropathy; Res, Resveratrol
Streptozotocin
blood urea nitrogen
serum creatinine
urinary protein
insulin tolerance tests
glucose tolerance tests
total cholesterol
triglyceride
free fatty acid
Type 2 diabetes mellitus
low density lipoprotein
hematoxylin-eosin
high-density lipoprotein
homeostasis model assessment index
hemoglobin A1c
Plasma insulin