


 , Ľubica Chrastinová 2,‡, Iveta Plachá 1, Valentína Focková 1, Natália Zábolyová 1, Eva Bino 1, Ľubomíra Grešáková 1, Rudolf Žitňan 2, Zuzana Formelová 2, Jana Ščerbová 1, Grzegorz Belzecki 3, Renata Miltko 3, Monika Pogány Simonová 1
1 Centre of Biosciences of the Slovak Academy of Sciences, Institute of Animal Physiology, 04001 Košice, Slovakia
2 Department of Animal Nutrition, National Agricultural and Food Centre, 95141 Nitra-Lužianky, Slovakia
3 Department of Animal Nutrition, The Kielanowski Institute of Animal Physiology and Nutrition, Polish Academy of Sciences, 05-110 Jabłonna, Poland
‡Deceased.
Abstract
Background: Using bacterial (probiotic) strains can influence
beneficial health statuses, e.g., through dairy products; however, they must be
assessed as safe before consumption; broiler rabbits represent a suitable model
for this purpose. This study evaluated the safety and effect (functionality) of
the dairy-derived, plantaricin-producing strain Lactiplantibacillus
plantarum LP17L/1 using broiler rabbits. The following parameters were assessed
to evaluate safety and functionality: microbiota, phagocytic activity
(non-specific immunity parameter), blood serum biochemistry, oxidative stress
enzyme, growth performance, cecal hydrolytic activity, and jejunal morphometry.
Methods: Previously validated methods were used for the analyses. The
appropriate administrations approved the experiments. Results: Although
only up to 1.0 colony forming unit (CFU)/g (log10) LP17L/1 reached the gastrointestinal tract of the
rabbits, the total lactic acid bacteria and amylolytic streptococci were
significantly increased (p
Keywords
- probiotic strain
- safety
- model
- food-derived animal
Ewes milk and its products, such as milk lump cheeses, have a high nutritional
value in the human diet [1]. Since sheep breeding is a tradition in Slovakia, ewe
milk products are popular among consumers and frequently consumed [2, 3].
Moreover, ewes milk lump cheese has received a traditional specialty guaranteed
label (TSG) [4]. Similarly, stored ewes milk lump cheese also belongs to the
popular products. These products possess naturally beneficial autochthonous
microbiota, especially lactic acid bacteria (LAB) from the phylum Firmicutes [5].
Some bacterial strains can be isolated from this source and studied for their
useful properties, leading to their potential application in dairy as a
functional food [3]. However, primary strains and/or strain safety and
functionality should be checked following the EFSA rules [6] to ensure their/its
application in the future. Lactiplantibacillus plantarum LP17L/1 strain
was isolated from stored ewes cheese [7]. It represents a non-hemolytic
(ɤ-hemolysis) strain that is susceptible to antibiotics. The LP17L/1
strain is deoxyribonuclease-negative and a non-biofilm-forming strain that
sufficiently tolerates lower pH and oxgall–bile [3]. The production of the
useful enzyme,
A total of 24 rabbits (meat lines M91 and P91) were weaned on day 35, including
both sexes (equal male-to-female ratio per treatment), were divided into the
experimental group (EG) and the control group (CG), 12 animals in each. The
average body weight of rabbits at the beginning of the experiment was 1472 g. The
experiment was conducted alongside colleagues in Nitra-Lužianky from the
National Agricultural and Food Centre (NAFC). The guidelines in the Guide for the
Care and Use of Laboratory Animals approved by the Slovak Veterinary and Food
Administration and Ethical Commissions of both institutions (permission code: SK
CH 17016 and SK U 18016) were accepted for care and experimental animal
procedures. The animals were fed a commercial diet for growing rabbits (total
energy value 10.99 MJ/Kg) using the following values: Dry matter content 895.38
g/kg, crude fiber 152.43 g/kg, fat 35.77 g/kg, N-free extract 153.64 g/kg,
organic matter 834.97 g/kg, ash 60.41 g/kg, starch 139.78 g/kg, calcium 11.74
g/kg, phosphorus 5.89 g/kg, magnesium 2.56 g/kg, sodium 1.80 g/kg, kalium 10.17
g/kg, iron 260.39 mg/kg, and zinc 122.90 mg/kg. Rabbits were maintained in
standard cages (type D-KV-72; 0.61 m
The strain was applied to the drinking water of the experimental rabbits at a dose of 500 µL per day per rabbit for 30 days. Feces for bacterial background control were sampled on day 0/1. Blood was also sampled for the appropriate analyses. Rabbits (n = 4) were culled on day 30, and four rabbits from each group (one rabbit/one replicate) were selected based on daily weight measurements to ensure similar animal weights. Animals were sacrificed electro-stunning (50 Hz, 0.3 A/rabbit/4 s) in an experimental slaughterhouse by dissecting the carotid and jugular veins, as previously described by Pogány Simonová et al. [9]. The caecum and appendix were removed and treated for microbiota enumeration, as described in Section 2.2. Cecal samples were also taken to analyze hydrolytic activities. Musculus longissimus thoracis et lumborum (MLTL) was separated by removing the skin, fat, and connective tissue before being chilled and stored at 4 °C for 24 h until analysis.
As previously introduced [3, 7], the strain Lactiplantibacillus
plantarum LP17L/1 was isolated from stored ewes cheese. LP17L/1 was marked by
rifampicin to differentiate it from the total lactic acid bacteria count. To
prepare its rifampicin variant for application, the same protocol was used as
previously reported for the strain Enterococcus faecium EK13 by
Strompfová et al. [16]. Briefly, LP17L/1 was grown overnight in MRS
broth (De Man Rogosa–Sharpe broth, pH, 6.0
Fecal samples (1 g, n = 6) from EG and CG were diluted in Ringer
solution (pH 7.0, Darmstadt, Merck, Germany) using the standard microbiological
dilution method (1:9 ratio [17]). The appropriate dilutions
(10
Blood (n = 8) from the marginal ear vein (vena auricularis) was sampled from rabbits into Eppendorf tubes with micro-spheric hydrophilic (MSH) particles and heparin to test phagocytic activity (PA), as previously described by Pogány Simonová et al. [9]. Sampling was performed on day 30 (end of the strain application). The 50 µL of MSH particle suspension (ARTIM, Prague, Czech Republic) was mixed with 100 µL of blood in Eppendorf tubes and incubated at 37 °C for 1 h. Blood smears were prepared and stained using May–Gruenwald and Giemsa–Romanowski. To validate PA, the direct microscopic counting procedure was performed to calculate the number of white cells containing at least three engulfed particles per 100 white cells (monocytes/granulocytes). PA was expressed as a percentage (%). Moreover, an index of phagocytic activity was included in the analysis (IFA).
Glutathione–peroxidase (GPx (n = 8)) was determined by the colorimetric method (Spectrophotometer UV-2550, Shimadzu, Tokyo, Japan) using the commercial kit Randox RS504 (Randox Laboratory, Hong Kong, China) after blood sampling with heparin.
Hydrolytic activities of amylolytic, cellulolytic, xylanolytic, pectinolytic, and inulolytic (expressed in µmol/g/DM/min, meaning in micromol per gram of dry matter per minute) were processed as previously described by Lauková et al. [18]. These enzymes were extracted using the procedure described by Huhtanen and Khalili [19] and measured according to the method by Miltko et al. [20].
Blood samples were transferred into Eppendorf tubes, centrifuged (3000
| n = 8 | Reference values | CG | EG | p-value |
| Total protein (g/L) | 53–85 | 55.16 |
56.25 |
0.444 |
| Albumin (g/L) | 26–46 | 39.10 |
39.49 |
0.662 |
| Creatinine (µmol/L) | 44–141 | 42.59 |
50.58 |
0.035* |
| Glucose (mmol/L) | 5.5–8.6 | 8.36 |
8.09 |
0.471 |
| Cholesterol (mmol/L) | 0.28–2.1 | 1.61 |
1.12 |
0.003** |
| Triglycerides (mmol/L) | Up to 1.44 | 0.98 |
0.74 |
0.124 |
| ALT (µkat/L) | 0.33–1.19 | 0.39 |
0.43 |
0.466 |
| AST (µkat/L) | 0.23–0.93 | 0.26 |
0.24 |
0.356 |
| ALP (µkat/L) | 0.3–2.13 | 2.95 |
2.65 |
0.329 |
| Na (sodium, mmol/L) | - | 142.1 |
140.3 |
0.284 |
| K (kalium, mmol/L) | - | 4.35 |
4.69 |
0.381 |
| Ca (calcium, mmol/L) | 2.2–4.2 | 3.56 |
3.66 |
0.315 |
| P (phosphorus, mmol/L) | 1.2–2.4 | 2.26 |
2.37 |
0.355 |
| Mg (magnesium, mmol/L) | 0.8–1.20 | 0.96 |
0.99 |
0.325 |
| Chloride (Cl, mmol/L) | 92–120 | 98.81 |
95.68 |
0.082 |
CG, the control group of rabbits; EG, the experimental group of rabbits;
creatinine, *p
Body weight (BW) was measured every week during the experiment.
Animals were sacrificed, as it is indicated in Section 2.1. Musculus longissimus thoracis et lumborum (MLTL) was removed from each rabbit and processed by removing the skin, fat, and connective tissue, chilled, and stored at 4 °C for 24 h until analysis. The FA composition in the MLTL samples was determined using the previously described method by Ouhayoun [21], using gas chromatography of fatty acid methyl ester (FAME) on GC 6890 N (Agilent technologies, Swiss, AG Basel). Results are expressed as a percentage of total FA content. Morphometry testing was performed as previously described by Žitňan et al. [22].
The treatment effect regarding the tested parameters was statistically analyzed
using a one-way analysis of variance (ANOVA) with Tukey’s posthoc test
(unpaired). Data are expressed as the mean and standard deviation SD of the mean.
Different superscript letters indicate a significant difference (p
On day 30, the LP17L/1 strain showed low colonization in feces, reaching up to
1.0 CFU/g (log10) (Table 2). However, the total LAB count in the EG increased
significantly (p
| Day 0/1, n = 10; day 30, n = 6 | Day 0/1 | Day 30 (CG) | Day 30 (EG) |
| LP 17L/1 | nt | nt | 0.9 |
| LAB | 2.34 |
3.61 |
4.00 |
| Enterococci | 2.18 |
3.58 |
3.89 |
| CoNS | 3.12 |
3.84 |
3.93 |
| CoPS | 2.44 |
4.17 |
3.86 |
| Amylolytic streptococci | 5.82 |
7.08 |
7.10 |
| Coliforms | 1.27 |
4.02 |
4.61 |
CFUs, colony forming units; LAB, lactic acid bacteria: day 0/1 vs. EG30, ***p
The LP17L/1 strain count in the caecum was the same as in the feces (Table 3).
Bacterial counts were mostly lower than in the feces. LAB, enterococci, and CoPS
were well-balanced in both groups on day 30, and CoNS and CoPS counts were even
similar to those in the feces. Amylolytic streptococci were decreased in the
caecum of the EG (p
| n = 4 | CG | EG |
| LP 17L/1 | nt | 0.9 |
| LAB | 2.49 |
2.72 |
| Enterococci | 1.7 |
1.00 |
| CoNS | 3.12 |
4.07 |
| CoPS | 3.56 |
3.89 |
| Amylolytic streptococci | 5.82 |
4.46 |
| Coliforms | 2.47 |
2.45 |
LAB, lactic acid bacteria; Enterococci; coagulase-negative staphylococci (CoNS);
coagulase-positive staphylococci (CoPS); Amylolytic streptococci,
EG30 vs. CG30, **p
Similarly, as in the feces and caecum, the LP17L/1 strain was found in the appendix at counts of up to 1.0 CFU/g log10 (Table 4). Notably, amylolytic streptococci were found at almost the same level in both groups and the caecum (Table 4). In general, bacterial counts in the appendix were not influenced. The counts of CoNS and CoPS were similar to those in caecum and feces.
| n = 4 | CG | EG |
| LP 17L/1 | nt | 0.9 |
| LAB | 2.23 |
2.03 |
| Enterococci | 0.95 |
0.98 |
| CoNS | 3.71 |
3.45 |
| CoPS | 3.23 |
3.29 |
| Amylolytic streptococci | 5.01 |
4.83 |
| Coliforms | 1.59 |
3.21 |
LAB, lactic acid bacteria; Enterococci; coagulase-negative staphylococci (CoNS); coagulase-positive staphylococci (CoPS); the counts of tested bacteria on day 30 comparing the EG and CG were not significant. nt, not tested; CG, the control group of rabbits; EG, the experimental group of rabbits; SD, standard deviation.
On day 30, the phagocytic activity (PA) values were nearly identical in both
groups (CG: 70.00
| n = 8 | Control group (CG) | Experimental group (EG) |
| Phagocytic activity (PA) on day 30 | 70.00 |
70.67 |
| Index of phagocytic activity (IPA) | 3.53 |
3.63 |
| GPx | 298.0 |
231.0 |
The PA and IPA values were not significant (NS). GPx, CG vs. EG,
*p
The GPx value was significantly lower in the EG (231.0
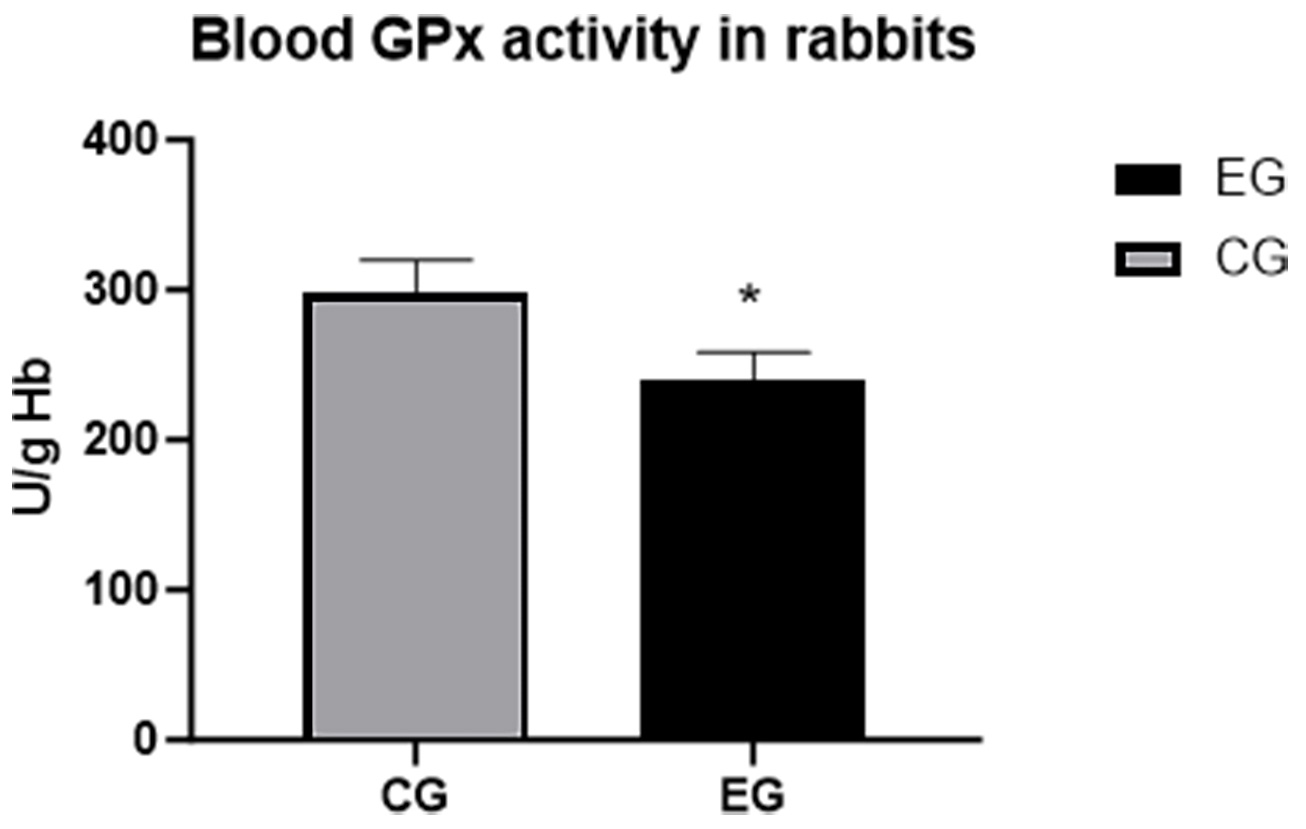 Fig. 1.
Glutathione-peroxidase (GPx) activity, *p
Regarding the biochemistry of the blood serum samples (see Table 1), the total
protein value was measured at the lower level of the reference range (RR) (55.16
| n = 4 | CG | EG |
| Amylolytic activity | 20.30 |
46.72 |
| Xylanolytic activity | 22.84 |
37.17 |
| Cellulolytic activity | 7.21 |
17.11 |
| Pectinolytic activity | 7.11 |
24.11 |
| Inulolytic activity | 3.26 |
3.86 |
Hydrolytic activity in µmoL of released product/g DM of caecum/min
Regarding the hydrolytic activity in the caecum on day 30 (Table 6), the EG
exhibited increased activity compared to the CG. Amylolytic activity reached the
highest value (p
| n = 4 | CG | EG |
| Villus circumference µm | 1580.0 |
1584.0 |
| Villus cut surface µm |
81546.0 |
81705.0 |
| Villus height µm | 684.0 |
686.0 |
| Crypt depth µm | 179.0 |
175.0 |
| Villus height vs. crypt depth | 3.83 | 3.92 |
CG, the control group of rabbits; EG, the experimental group of rabbits; SD, standard deviation. The values are not significantly influenced; vs., versus/comparing.
On day 30, the live body weight of rabbits reached an average of 2791.8 g
The total saturated fatty acids (SFAs) value reached 34.890
Thus, the strain LP17L/1 beneficially influenced all tested morphometry parameters. Only in crypt depth was a slight difference found in the CG. However, the final villus height to crypt depth ratio was slightly higher in the EG than in the CG (3.92 vs. 3.83, Table 7), although it was not significantly different.
Confirming the safety and functionality of bacterial strains, which could be
industrially applied for health benefits, is paramount. Lactobacilli do not
represent the predominant bacteria in the digestive tract of rabbits after
weaning; however, they are part of the gastrointestinal tract (GIT) microbiota.
This study confirms that although the LP17L/1 strain was not high, the GIT and
lactic acid bacteria (LAB) levels increased in the tested rabbits. The highest
amylolytic activity in the caecum of the EG rabbits is associated with detecting
high amylolytic activity. Following our aim to evaluate the safety of
the strain, it is beneficial to know that microbiota were not negatively
influenced. Regarding the antimicrobial activity evaluation after beneficial
strain application in rabbits, the influence on the microbiota using probiotics
and bacteriocin-producing enterococci as bacteria belonging to the lactic acid
bacteria group has been previously reported [9, 10]. After applying E.
faecium AL41, antimicrobial activity was noted against pseudomonads in feces and
caecum, and a significant decrease in coliforms was noted (p
Based on our previous results, phagocytic activity (PA) tended to increase after
beneficial strain application, e.g., after the application of beneficial strain
Enterococcus faecium EF9A (isolated from the Hungarian Pannon White
rabbit). A significantly higher PA value was noted in the EG (p
The beneficial effect on jejunal morphometry also supports the safety and
beneficial properties of the applied strain [24]. Lee et al. [24]
reported that two peptides, the expression of which requires cyclinJ, mediated
the recovery phase during which enterocytes (after their damage) regain their
original shape and volume. This study noted a tendency to improve the villus
height to crypt depth ratio in the EG compared to the CG, indicating a beneficial
effect after LP17L/1 strain application on enterocyte reparation (jejunal
morphometry). When the morphometry was improved, it showed better intestinal
functionality and nutrient absorption, leading to better health status and meat
quality in rabbits/animals [24]. In general, intestinal health (intestinal
morphology, microbial balance) belongs to the parameters that confirm host health
status. In our previous studies, following the beneficial application of
probiotic and bacteriocin (postbiotic) active strains with beneficial properties,
usually, jejunal morphometry was beneficially influenced as the villus height to
crypt depth ratio increased [9, 10]. When E. faecium AL41 =
CCM8558-producing Enterocin M was applied in rabbits, a significant increase in
PA (p
The intramuscular fat was characterized by the highest percentage of MUFAs (47.443% in the CG vs. 49.448% in the EG) and a lower % of PUFAs (CG: 12.368%; EG: 10.858%). Almost identical values of PUFAs were reported in the control rabbits by Pogány Simonová et al. [26]. Similarly, the control value of PUFAs was nearly the same at 12.480% in this study (12.368%). In this study, the total saturated fatty acids were the highest in the EG (LP17L/1 strain). A similar result was reported by Pogány Simonová et al. [27] in rabbits following the administration of the postbiotic—Enterocin M.
Serum biochemistry was not negatively influenced in rabbits, indicating the safety of the LP17L/1 strain. However, a higher glucose value could be associated with higher energy diet intake. Beneficial strains were previously reported to influence the biochemical parameters [28].
The strain L. plantarum LP17L/1 is a safe and functioning strain
previously applied in yogurts for its potential as a functional food [7]. Its
count in yogurt made from cow milk is not high, yet it remained stable during all
experimental evaluations with no negative impact on the pH of the yogurt [7].
Functional food can beneficially influence body functions, boosting health by
reducing the risk of diseases and/or by improving a specific physiological
response [5]. Moreover, Dvorožňáková et al. [29]
reported that the LP17L/1 strain showed high immune-modulatory potential on
CD4
Although the LP17L/1 strain was found in lower counts in the GIT of rabbits, the total LAB and amylolytic streptococci were increased with no negative influence on other microbiota, growth parameters, biochemistry, and/or jejunal morphometry; however, it promoted a beneficial impact on the cecal hydrolytic activity. Phagocytic activity was not negatively influenced. Moreover, the LP17L/1 strain did not promote oxidative stress, which provides further evidence of its safety. Assessing the safety of Lactiplantibacillus plantarum LP17L/1 using broiler rabbits, provides a chance for its future industrial application, although additional studies are still required.
Data are a part of the manuscript submitted. And/or they can be asked from the corresponding author.
AL designed the research study. AL, ĽCH, IP, VF, NZ, MPS, ĽG, RŽ, GB, and RM performed the research. ĽCH and ZF provided help and advice on animals. EB and JŠ provided help with microbiological samples treatment. AL, MPS, RM, IP, and ĽG analyzed the data. AL wrote the manuscript. All authors read and approved the final manuscript. All authors have participated sufficiently in the work to take public responsibility for appropriate portions of the content and agreed to be accountable for all aspects of the work in ensuring that questions related to its accuracy or integrity. All authors contributed to editorial changes in the manuscript.
The guidelines stated in the Guide for the Care and Use of Laboratory Animals approved by the Slovak Veterinary and Food Administration and Ethical Commissions of both institutions (permission code: SK CH 17016 and SK U 18016) were accepted for care and experimental procedures involving animals.
We would like to acknowledge our colleagues from Nitra-Lužianky, Dr. Ľubomír Ondruška, Dr. Rastislav Jurčík, and Ing. Pecho for their help with animals bleeding and slaughtering. We also thank our colleague Mr. Peter Jerga for his kindness to help us in slaughterhouse. And we also are thanksfull for our laboratory assistant Mrs. Dana Melišová for laboratory skills. We also thank to our colleague in Dairy Research Institute in Žilina for giving us LP17L/1 strain as isolate for study.
This research was funded by the Slovak Research and Development Agency, the projects APVV-02-204 and APVV-17-0028.
The authors declare no conflict of interest.
References
Publisher’s Note: IMR Press stays neutral with regard to jurisdictional claims in published maps and institutional affiliations.