


 , Chowdaiah Nickhil 3, Abhijit Kar 2, Yogesh Sharma 4, Sumedha S Deshpande 1, Manoj Kumar Tripathi 1, Sadvatha Ramanna Haromuchadi 5
1 Agro Produce processing Division, ICAR-Central Institute of Agricultural Engineering, 462038 Bhopal, India
2 Now with ICAR–National Institute of Secondary Agriculture, Namkum, 834010 Ranchi, India
3 Department of Food Engineering and Technology, Tezpur University (Central University), 784028 Assam, India
4 Waters India Private limited, 110025 New Delhi, India
5 Regional Center, ICAR-Central Institute of Agricultural Engineering, 641041 Coimbatore, India
Abstract
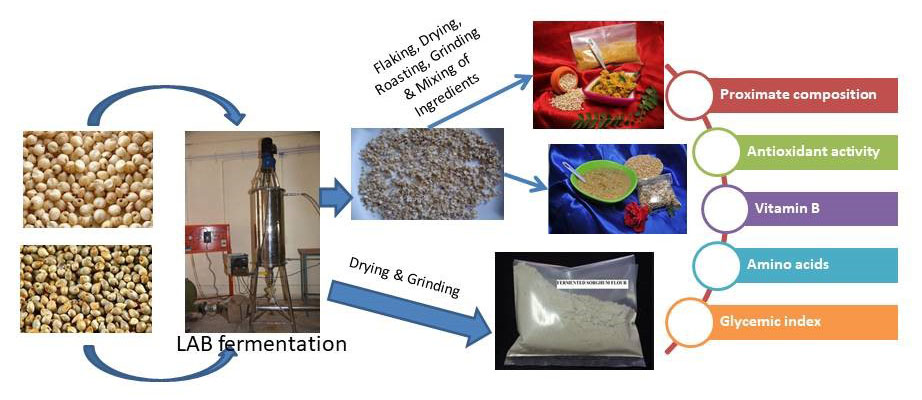
Introduction: Millets, owing to their rich nutritional and low-to-moderate glycemic index values, are termed superfoods; however, some anti-nutritional factors, such as tannins, limit the absorption of micro and macronutrients. Non-thermal processing technologies, such as fermentation, can improve nutrient content and reduce these anti-nutritional factors. Methods: The effect of a controlled submerged fermentation of whole grain sorghum, pearl millet, and dehusked Kodo millet using mixed lactic acid bacteria (LAB) culture in tofu whey-based media on the proximate, antioxidant, tannin content, vitamin B, amino acids profile and estimated glycemic index (eGI) of different millets were evaluated. Results: The protein content (2–12.5%), carbohydrate content (2–13.6%), antioxidant activity (3–49%), vitamin B complex, amino acid profile (89–90%), and eGI of whole grain sorghum, pearl millet, and dehusked Kodo millet improved due to LAB-assisted submerged fermentation. In contrast, fat (4–15%), ash (56–67%), crude fiber (5–34%), minerals, tannin and resistant starch content decreased due to LAB fermentation. Conclusion: Controlled LAB fermentation can improve the nutritional quality of sorghum and millets while reducing anti-nutritional factors. This non-thermal process can be adopted industrially to produce more palatable and nutritionally superior millet products.
Graphical Abstract
Keywords
- sorghum
- pearl millet
- Kodo millet
- LAB fermentation
- tannin
- vitamin B
- amino acid
- estimated glycemic index
Millets, known as ‘Nutri-cereals’, are gaining immense attention due to their active promotion worldwide. These minor cereals contain health-beneficial nutrients, dietary fibers, and complex sugars. The high content of dietary fibers is pivotal in promoting digestive health, regulating bowel movements, and fostering a balanced gut microbiota. Complex sugars further contribute to sustained energy release, aiding in maintaining stable blood sugar levels. Moreover, their role in preventing lifestyle diseases, such as heart conditions and diabetes, underscores their significance in promoting long-term health [1]. They are a means of sustenance for many African and Asian populations and are grown mainly in semi-arid zones with little input. The world production of sorghum (Sorghum bicolor L) and millets stands at 61.36 MT and 30.09 MT, respectively [2]. Millets have varied uses, from food to feed and fodder, from ethanol production to pharmaceutical industries. Of late, with the growing awareness of the health benefits of millets and ardent popularization, millets are gaining footholds as food in non-millet-consuming populations. However, the presence of anti-nutritional factors, such as tannins, not only causes malabsorption of protein but also imparts bitterness and an astringency taste to the foods [3], which is one of the plausible reasons for the unpopularity of these Nutri-cereals. Several thermal and non-thermal processing techniques are used to improve the nutritional value and bioaccessibility of macronutrients and micronutrients in millets, including fermentation, which is an age-old process. The millet-consuming populations of Asia and Africa traditionally follow natural or spontaneous fermentation, using the natural microflora in the grains. These processes can vary from a few hours to a few days to reduce the anti-nutritional factors and improve the flavor and taste [4]. Fermentation using a dedicated microflora/starter culture supplemented with a growth media provides better control of microbial dynamics to achieve requisite quality [5]. Submerged LAB fermentation has demonstrated improved antioxidant activity, vitamin B, fatty acid profile, flavor, bioaccessibility of amino acids, and mineral digestibility in different millets [6, 7, 8, 9].
The parameters under scrutiny, including proximate composition, minerals, antioxidant activity, vitamin B, amino acid profile, and estimated glycemic index (eGI), hold considerable significance for human nutrition. Proximate composition analysis provides insights into macronutrient levels, aiding dietary planning [10]. Minerals play a vital role in bone health and immune function. The antioxidant activity of the grains is associated with potential benefits in preventing chronic diseases [11]. Vitamin B content evaluation shows the grains’ contribution to energy metabolism and overall well-being. A comprehensive amino acid profile analysis helps assess protein quality, which is crucial for tissue repair and growth. Lastly, the estimated glycemic index offers insights into the potential impact on blood sugar levels, contributing to understanding the suitability of these grains for individuals at risk of type 2 diabetes [12]. A detailed analysis of the fermented millet can suffice to assess the nutritional superiority of these ‘Nutri-cereals’ to adapt these value-added products better.
The fermentation process is affected by the type of culture, growth medium, substrate, temperature, and pH [13]. Tofu whey, a good source of polysaccharides, proteins, and minerals, is a suitable and low-cost culture medium for the growth of yeasts and LAB [14]. The economical use of tofu whey can also solve the wastewater disposal problem associated with tofu industries. In this investigation, the effect of submerged fermentation using mixed LAB culture grown in tofu whey-based media on the proximate composition, minerals, antioxidant activity, vitamin B and amino acid profile, and estimated glycemic index (eGI) of whole grain sorghum, pearl millet, and dehusked Kodo millet were investigated.
Freshly harvested sorghum (Sorghum bicolor L) (commercial variety: Dadar) and pearl millet (Pennisetum glaucum) grains (commercial variety: Raj) sourced from Maharashtra, India, harvested in November 2016 were procured from the local grain market of Bhopal. Kodo millet (Paspalum scrobiculatum) harvested in January 2017 and sourced from the Mandla district of Madhya Pradesh, India, was procured from the farmer. The grains were cleaned, and any unwanted materials were removed and packed in 100 µm thick low-density polyethylene (LDPE) pouches. Each Kodo millet was dehusked using the millet mill developed at the Central Institute of Agricultural Engineering (CIAE). The dehusked Kodo grain was immediately packed in a double layer of 100 µm thick LDPE pouches. These grains were stored at 4 °C till required for further experimentation.
All the chemicals used in this experiment were of analytical grade and procured from Sigma Chemicals Co. (St. Louis, MO, USA). The amino acid kit was sourced from Waters India Pvt Ltd., India. The glycemic index enzyme kit was procured from Elabscience (Houston, TX, USA).
Tofu whey was collected from the soybean processing center, Indian Council of Agricultural Research-Central Institute of Agricultural Engineering (ICAR-CIAE), Bhopal, filtered using 60 mesh Whatman filter paper, and then autoclaved (Dafoss, Vertical autoclave, Clavex Plus, Nanjing, China) at 121 °C and 103 kPa pressure for 30 minutes. Sterilized filtered whey was used as media for the growth of LAB and the fermentation of millets.
Bovine milk, sourced from a local dairy, was boiled at 95
The mixed LAB culture (1%) was inoculated at 37 °C for 18 h in tofu whey-based media prepared using filtered and sterilized tofu whey and distilled water in a ratio of 1:3.
The whole sorghum grain was fermented using 1% culture at 37 °C for 17
h, while pearl millet grain was fermented using 2% culture for 8 h at the same
temperature. On the other hand, dehusked Kodo millet was fermented using 3%
culture at 37 °C for 4 h. The duration of fermentation for each crop
under investigation was previously standardized at our laboratory by measuring
the conductivity and pH of the medium with fermentation progress (data not
shown). The fermented sorghum, pearl millet, and dehusked Kodo millet were dried
at 50
Moisture analyses of the sorghum and millet flours were performed using Association of Official Agricultural Chemists (AOAC)method no. 935.29. The fat content of the samples was analyzed following AOAC method no 922.06, using petroleum ether as the solvent, in a Soxtron apparatus (Automatic SoxTRON FAT/OIL solvent extraction system, Model: Sox- 6, Version 0.1, Chennai, India). The protein content was determined according to the Kjeldahl method, following ISO-20483, using 5.4 as the conversion factor for pearl millet, Kodo millet, and sorghum [20]. The crude fiber was estimated using an automatic crude fiber analyzer (FIBRA PLUS, Pelican, India), which was used to wash and digest the samples using acid and alkali. Ash content, the indicator of mineral content, was determined gravimetrically by burning the samples in a muffle furnace at a temperature of 550 °C. Carbohydrate content was determined using the difference method. All the analyses were performed in triplicates.
The total mineral content was determined by ashing the samples and following the procedure of Bailey et al. [21]. Phosphorous was analyzed using the flame photometer (Corning 410, Corning Advanced Optics, Flintshire, UK)), while potassium (K), magnesium (Mg), manganese (Mn), zinc (Zn), iron (Fe), and copper (Cu) were determined using atomic absorption spectrophotometer (Perkin–Elmer, Model 2380, Waltham, MA, USA). The samples were analyzed in triplicate.
The antioxidant activity of the sorghum and millet samples was determined using DPPH% inhibition following the method by Mohapatra et al. [22]. A reagent volume (1 mL) of methanol-treated and incubated millet samples was centrifuged for this assay. The resulting supernatant was combined with a defined volume (3.9 mL) of DPPH solution. After a resting period of 30 minutes, the mixture underwent a second round of centrifugation. The absorbance of the resulting supernatant, after its reaction with 70% ethanol, was recorded at 517 nm. The percentage inhibition of DPPH was calculated using the following expression.
an average of 3 replicates is presented.
Tannins were estimated quantitatively using the method followed by Dwivedi et al. [23], where the sample was boiled and centrifuged, and the supernatant was allowed to react with Folin–Ciocalteu reagent and sodium carbonate. The absorbance of the solution was recorded at 700 nm to determine the tannin content and expressed in mg/g. The measurements were taken in triplicate.
Multiple vitamin B complex profiles were determined by following methods of Ren
et al. [24] at NIFTEM, Thanjavur, using a UHPLC system (Shimadzu
Corporation, Japan) equipped with Nexera Ultra High Performance Liquid Chromatography (UHPLC) system column: Shim-pack XR-ODS
III (100
Amino acid profiling of the sorghum and millet products containing at least 5 g of protein was determined following the method by Chavan, McKenzie, & Shahidi [25]. All samples were acid-digested with 6 N hydrochloric acid at 110 °C for 24 h and derivatized using AccQ Tag Ultra reagents; however, for determination of tryptophan, NaOH was used as the hydrolyzing agent [26]. Milk casein was used as the reference material. Data analysis was conducted using Water Empower™ Software (Waters empower 3, Milford, MA, USA), version 3 The ratio of the essential amino acid (EAA) to total amino acids (TAAs) and predicted biological value (BV) were calculated using the following expressions [27]. The sample was analyzed in duplicate.
(a) The ratio of essential amino acid to total amino acid was calculated using the following equation:

(b) The predicted biological value (BV) of the millet products was calculated following the equation [27].
where
a
(c) The predicted protein efficiency ratio (PER).
The predicted protein efficiency ratio (PER) was calculated using the equation developed by Alsmeyar, Cunningham, and Happich [28].
To determine in vitro starch digestibility, samples were initially defatted using petroleum ether. Then, they were oven-dried overnight (18 h) to remove the moisture completely. Next, the samples were cooked separately in 5 mL distilled water at boiling temperature for 20 minutes. Freshly prepared white bread was used as the control [29].
2.4.2.1 Free Glucose
The cooked samples were taken separately in 50 mL centrifuge tubes, and an aliquot of acetate buffer (25 mL, 0.1 M, pH 5.2) was added to each tube along with two glass beads. The tubes were mixed vigorously using a vortex mixer and incubated in a water bath at boiling temperature for 30 minutes. Then, samples were cooled to 37 °C, and invertase enzyme (3000 U/mL, 0.3 mL) was added, vortex mixed, and incubated at 37 °C for 30 minutes. In order to obtain free glucose, 0.2 mL of the processed sample was added to 4 mL of absolute ethanol with vigorous shaking.
2.4.2.2 G20 and G120
To determine the G20 and G120 values, initially cooked samples were dispersed in 10 mL pepsin solution, which was freshly prepared (5 g/L pepsin and 5 g/L guar gum in 0.05 mol/L HCl, 5 glass beads). It was then incubated with 10 mL acetate buffer (0.1 M, pH 5.5) at 37 °C for 30 minutes. An enzyme mixture containing 15 mL pancreatin supernatant, 0.75 mL amyloglucosidase (1200 U/mL), and 1 mL invertase (3000 U/mL) was prepared. Pancreatin supernatant was made by dissolving 3 g pancreatin in 20 mL distilled water with constant stirring for 10 min and then centrifuged at 1500 g for 10 minutes. The samples were digested with the enzyme mixture at 37 °C in a shaker at 160 rpm for 2 h. In order to obtain the G20 and G120 fractions, at exactly 20 minutes and 120 minutes, 0.2 mL of the samples was withdrawn and dissolved in 4 mL of absolute ethanol.
2.4.2.3 Total Glucose Fraction
Once the G120 samples were removed, the tubes were placed in a water bath at boiling temperature for 30 minutes and cooled to 0 °C. Then, they were mixed with potassium hydroxide (10 mL, 7 mol/L) and incubated in an ice water bath for 30 minutes. Total glucose fractions were obtained by extracting 0.2 mL of samples and adding acetic acid (1 mL, 1 mol/L) containing amyloglucosidase (100 U/mL). The whole aliquot was placed in a water bath at 70 °C for 30 minutes, followed by a water bath at 95 °C for 10 minutes. It was then cooled down to room temperature, and 20 mL of distilled water was added.
2.4.2.4 Glucose Content
The samples obtained from the above procedures (FG, G20, G120, and TG) were centrifuged at 1500 g for 5 minutes. The glucose content in each sample’s supernatant was determined by the glucose oxidase-peroxidase method using the diagnosis kit GOD-POD (Elabscience, USA). The absorbance was measured using a UV-Vis spectrometer (Shimadzu, Model no: UV1800ENG240V, SOFT, Tokyo, Japan). Standard glucose solutions at different concentrations were also used for the same tests to obtain a standard curve.
G
G
G
W: Sample weight (g).
All analyses were performed in triplicate.
Data analysis was carried out using Microsoft Office Excel 10.0 (Microsoft, Redmond, WA, USA). A paired comparison t-test was used to determine the significance between the control and fermented samples at a 95% significance level.
The approximate composition of the different millet products is presented in
Fig. 1. There were 2%, 12.5%, and 8% increases in the protein content of
sorghum, pearl millet, and dehusked Kodo millet, respectively, during
fermentation. The protein content of the fermented pearl millet flour was found
to be significantly (p
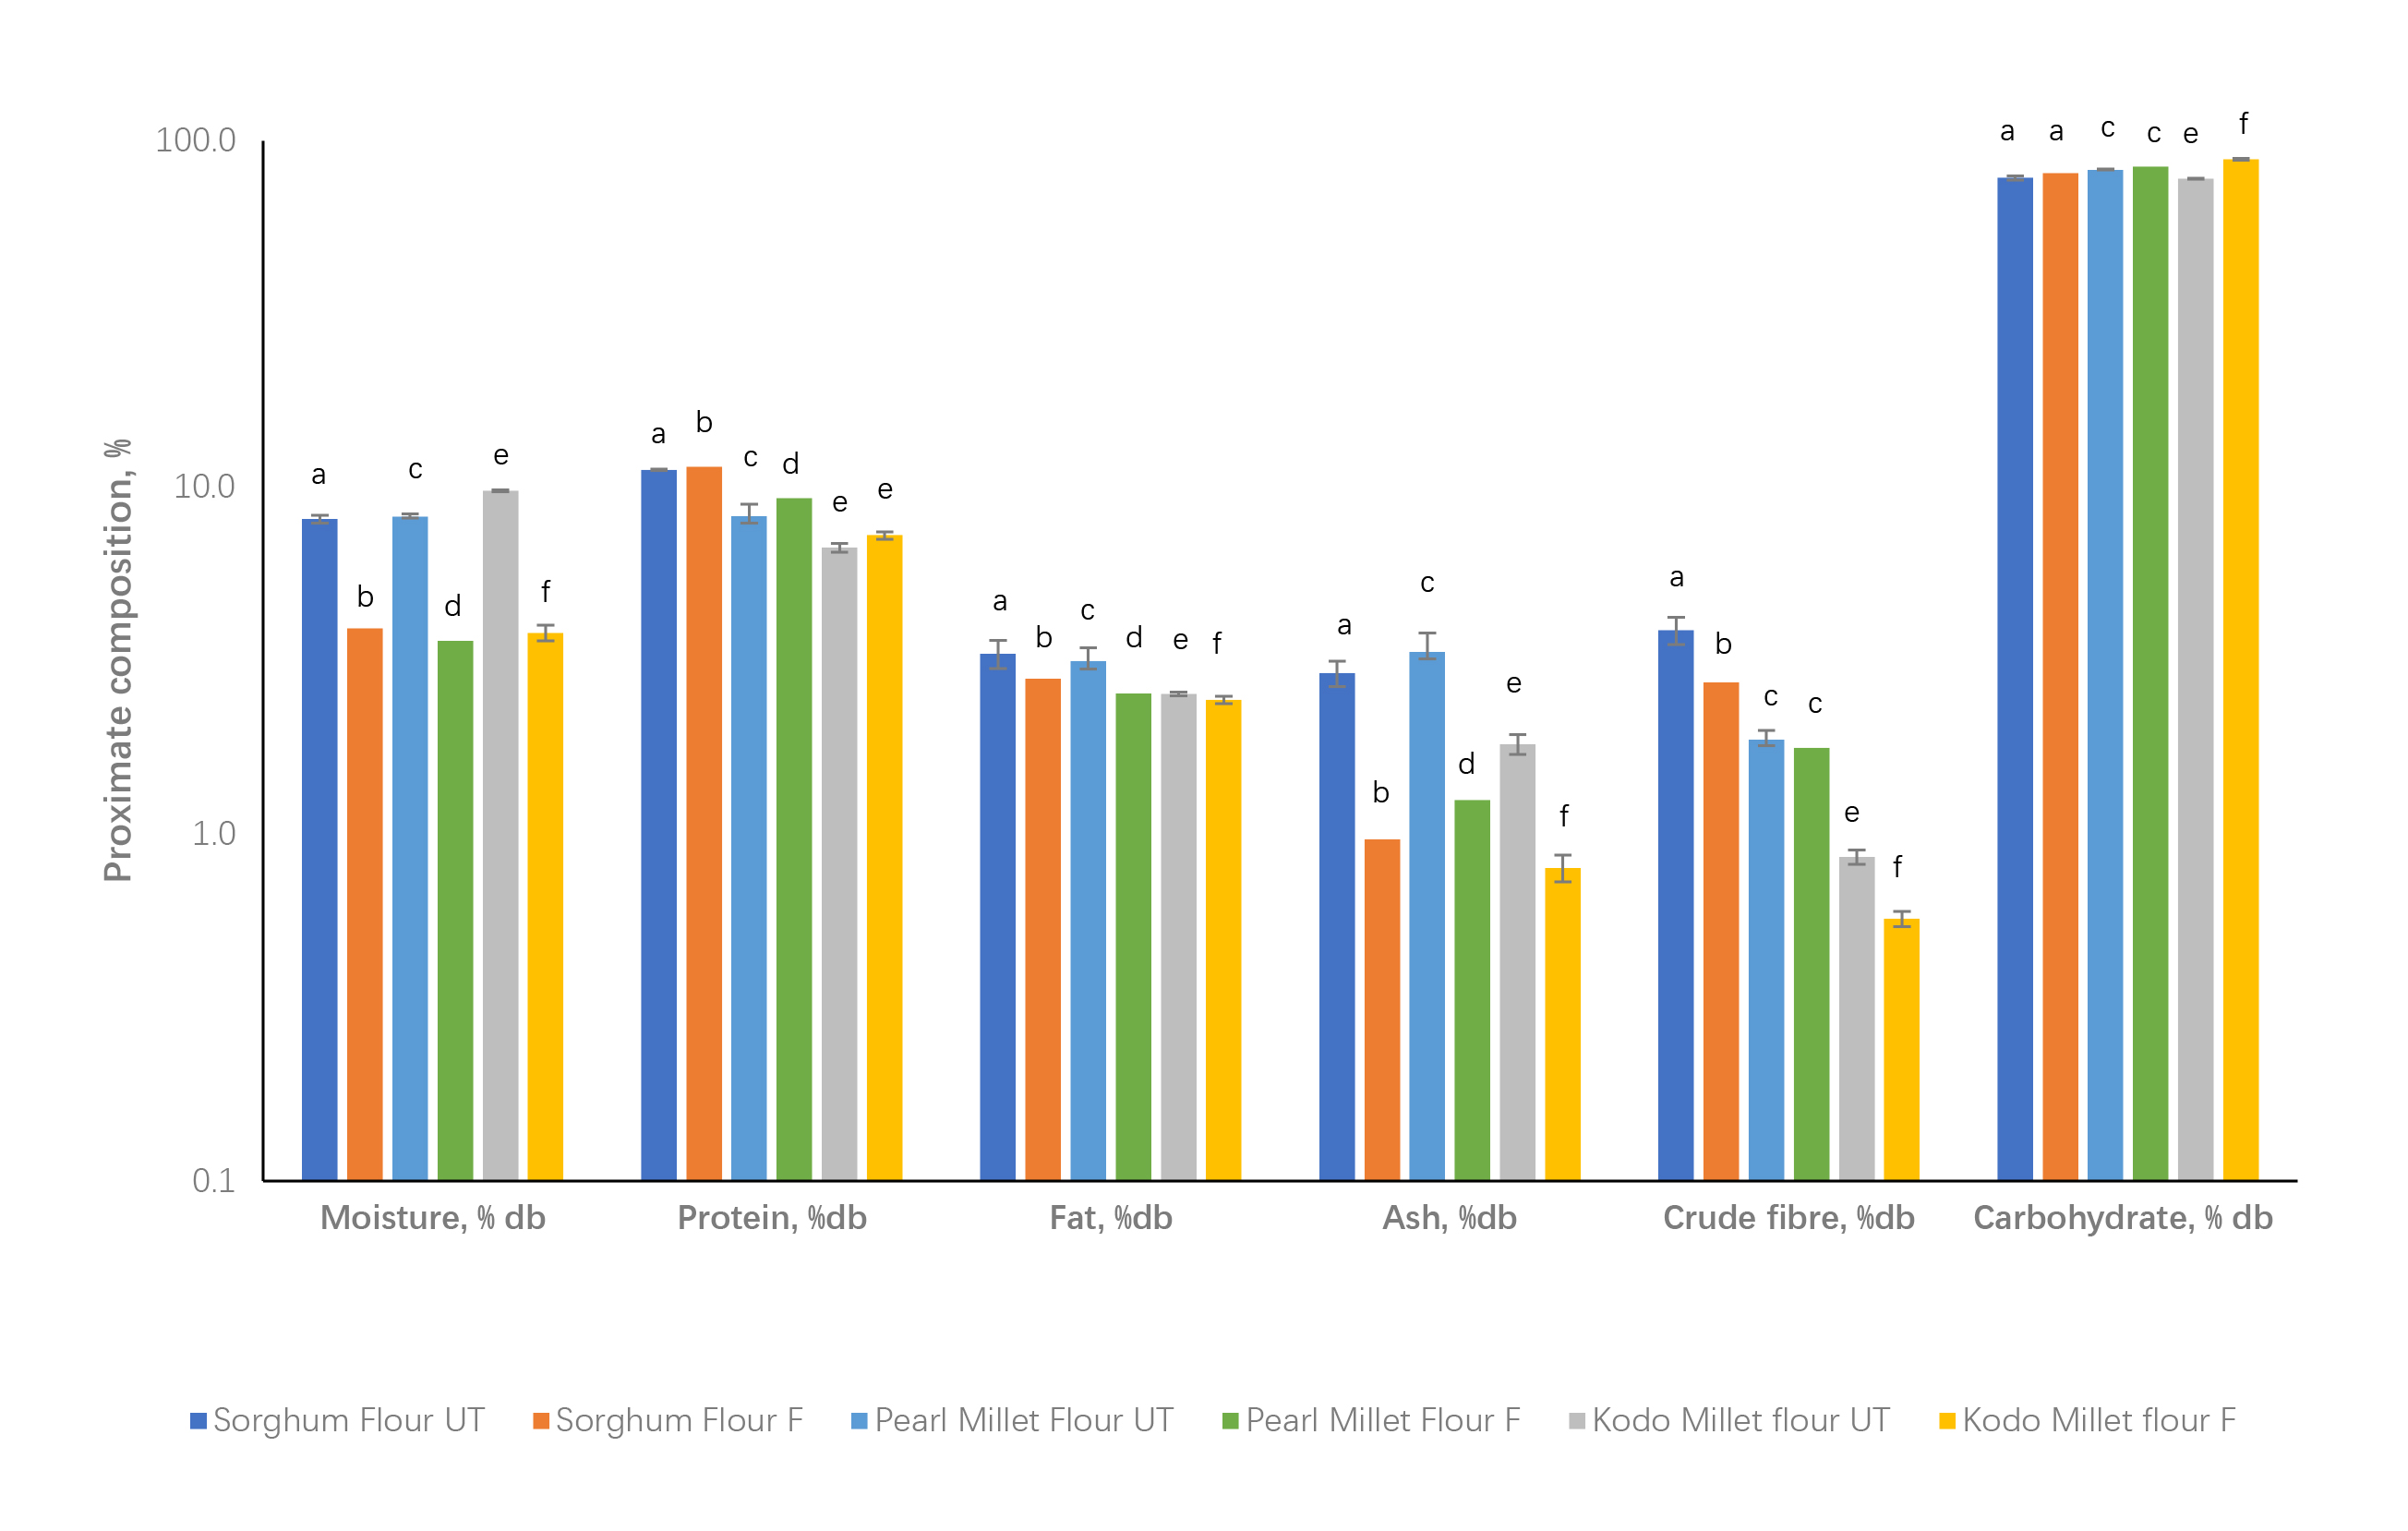 Fig. 1.
Approximate compositions of sorghum, pearl millet and dehusked Kodo millet. UT, untreated; F, fermented. a–b, c–d, and e–f denote comparisons between sorghum, pearl millet, and dehusked Kodo millet samples, respectively.
The fat content decreased to 15%, 19 %, and 4% for sorghum, pearl millet, and
dehusked Kodo millet, respectively. During fermentation, the ash content in the
sorghum, pearl millet, and dehusked Kodo millet decreased significantly (p
The loss of ash content, representing the mineral content, was in the range of 56–66% for the millets considered in this investigation. A decrease in the total ash content could be noticed; the same trend could be observed during the mineral analysis of the samples.
Crude fiber for fermented sorghum, pearl millet, and dehusked Kodo millet
decreased significantly (p
There was an increase in the carbohydrate content in the fermented millets to the tune of 2 to 13.6%, which was the highest for the dehusked Kodo millet.
The effect of fermentation on sorghum, pearl millet, and dehusked Kodo millet is shown in Table 1. It can be observed that minerals such as Mn (8–33%), Zn (20–48%), Cu (12–79%), K (2–29%), P (0.4–16%), and Ca (10–27%) decreased during submerged fermentation. In contrast, the iron (1–90%) and magnesium content (6.5–40%) increased in the fermented flours.
| Fermented millet products | Mn, mg/kg | Zn, mg/kg | Fe, mg/kg | Cu, mg/kg | K, mg/kg | P, mg/kg | Ca, mg/kg | Mg, mg/kg |
| Sorghum flour (UT) | 130 |
500 |
249 |
80 |
3751 |
246 |
41 |
200 |
| Sorghum flour (F) | 110 |
260 |
475 |
30 |
2653 |
245 |
48 |
280 |
| Pearl millet flour (UT) | 120 |
520 |
282 |
240 |
4000 |
384 |
44 |
310 |
| Pearl millet flour (F) | 110 |
320 |
290 |
50 |
3030 |
321 |
32 |
330 |
| Kodo rice (UT) | 180 |
300 |
232 |
80 |
947 |
117 |
55 |
200 |
| Kodo rice (F) | 120 |
240 |
235 |
70 |
921 |
120 |
49 |
190 |
Note: The values are averages of 3 replicates; letters in the same column denote a
significant difference (p
Table 2 presents the effect of LAB fermentation on different millet products. The DPPH scavenging activity of sorghum, pearl millet, and dehusked Kodo millet flour was improved by 2.8%, 49%, and 16.9%, respectively.
| Parameters | DPPH inhibition, % | Tannin, mg/mL | Thiamine, mg/kg | Pyridoxine, mg/kg | Folic acid, mg/kg | Pantothenic acid, mg/kg | Riboflavin, mg/kg |
| Pearl millet flour (UT) | 61.34 |
0.058 |
0.039 |
0.955 |
4.635 |
0.01 |
4.572 |
| Pearl millet flour (F) | 63.07 |
0.016 |
0.067 |
2.064 |
14.276 |
0.01 |
13.539 |
| Sorghum flour (UT) | 31.58 |
0.028 |
0.01 |
0.219 |
1.763 |
0.001 |
0.666 |
| Sorghum flour (F) | 47.14 |
0.011 |
0.053 |
0.418 |
6.451 |
0.001 |
6.039 |
| Kodo rice flour (UT) | 50.687 |
0.115 |
0.011 |
0.023 |
nd | nd | nd |
| Kodo rice flour (F) | 58.333 |
0.069 |
0.032 |
0.035 |
0.001 |
nd | nd |
Note: values are mean
(UT, untreated; F, fermented; nd, not detected; a–b, c–d, and e–f denote comparisons between sorghum, pearl millet, and dehusked Kodo millet samples, respectively).
During LAB fermentation, the tannin content of the sorghum, pearl millet, and dehusked Kodo millet flours decreased by 2.5 to 3.6 times, respectively (Table 2).
An increase in the vitamin B content in most of the fermented millet products can be observed in Table 2. A 1-fold increase in the thiamine content was noticed in fermented pearl millet flour and a 4-fold increase in the sorghum flour. Similarly, pyridoxine content increased by 1.5 to 2 times in fermented millets. A 2 to 4-fold increase in folic acid and riboflavin content can be observed in the fermented products. There was no difference in the pantothenic acid content in the fermented flour samples. Pantothenic acid and riboflavin were not detected in the dehusked Kodo millet.
Most of the amino acids almost doubled during fermentation (Table 3). Overall, during fermentation, the total amino acid content increased. Pearl millet exhibited a better amino acid profile than sorghum grain. The total essential and non-essential amino acids increased; however, the ratio of essential to total amino acids decreased in the case of fermented samples. The biological value increased in the case of pearl millet and dehusked Kodo millet proteins, while it decreased in the case of sorghum. Nevertheless, the protein efficiency ratio improved with fermentation for all the samples. Table 3 shows that cysteine, methionine, and tryptophan improved during fermentation for all the crops under investigation. The acidic amino acid content increased during fermentation due to the LAB action. Indeed, LAB creates an acidic environment that affects the grains. The amount of basic amino acids also increased. The increase in these fractions is due to the overall increase in the amino acid content during fermentation. The aromatic and aliphatic amino acids also improved. Both polar and non-polar amino acids increased due to an overall increase in the amino acid content.
| Amino acids, mg/100 g | ||||||||
| Class of side chain | Amino acid class | Pearl millet flour (UT) | Pearl millet flour (F) | Sorghum flour (UT) | Sorghum flour (F) | Kodo rice flour (UT) | Kodo rice flour (F) | |
| Histidine | Basic | Polar | 5.551 |
10.178 |
9.896 |
10.77 |
3.234 |
7.954 |
| Serine | Hydroxyl containing | Polar | 13.197 |
26.718 |
13.989 |
21.856 |
10.347 |
21.367 |
| Argine | Basic | Basic | 22.114 |
42.795 |
27.527 |
37.653 |
12.872 |
31.498 |
| Glycine | Aliphatic | Non-polar | 10.532 |
22.608 |
9.387 |
16.496 |
7.281 |
17.2 |
| Asparagine | Acid/amide | Polar | 24.884 |
44.785 |
9.794 |
34.814 |
16.567 |
44.217 |
| Glutamine | Acid/amide | Polar | 37.345 |
69.670 |
17.667 |
53.353 |
15.453 |
64.869 |
| Threonine | Aromatic | Polar | 9.508 |
19.288 |
11.406 |
15.6813 |
7.532 |
15.313 |
| Alanine | Aliphatic | Non-polar | 9.637 |
19.401 |
4.812 |
13.856 |
6.124 |
16.82 |
| Proline | Cyclic | Non-polar | 9.126 |
18.216 |
5.9843 |
14.556 |
5.276 |
15.585 |
| Cystine | Sulphur-containing | Non-polar | 0.116 |
1.073 |
0.246 |
1.236 |
0.133 |
0.724 |
| Lysine | Basic | Polar | 13.968 |
24.948 |
3.9343 |
20.757 |
4.872 |
24.97 |
| Tyrosine | Aromatic | Polar | 7.957 |
15.398 |
13.416 |
16.114 |
7.177 |
11.953 |
| Methionine | Sulphur-containing | Non-polar | 2.953 |
4.694 |
3.092 |
4.336 |
2.857 |
3.97 |
| Valine | Aliphatic | Non-polar | 9.278 |
18.692 |
7.278 |
15.375 |
6.083 |
15.915 |
| Isoleucine | Aliphatic | Non-polar | 9.454 |
18.92 |
7.522 |
16.038 |
7.653 |
16.199 |
| Leucine | Aliphatic | Non-polar | 17.596 |
34.4753 |
13.435 |
29.143 |
16.327 |
29.609 |
| Phenylamine | Aromatic | Non-polar | 15.363 |
23.325 |
23.467 |
27.81 |
19.891 |
22.29 |
| Tryptophan | Aromatic | Non-polar | 0.284 |
0.349 |
0.331 |
0.402 |
0.412 |
0.524 |
| Total AA | 218.859 | 415.537 | 183.167 | 350.34 | 150.091 | 360.980 | ||
| E/T | 42.048 | 41.219 | 51.381 | 44.947 | 50.750 | 41.393 | ||
| Total E | 92.025 | 171.342 | 94.005 | 157.306 | 76.171 | 149.421 | ||
| Total NE | 126.834 | 244.195 | 89.161 | 192.673 | 73.920 | 211.556 | ||
| BV | 55.321 | 57.346 | 83.225 | 32.775 | 38.284 | 50.443 | ||
| PER | 0.247 | 0.936 | 0.001 | 0.686 | 0.198 | 0.751 | ||
| Acidic AAs | 62.229 | 114.455 | 27.461 | 88.167 | 32.020 | 109.086 | ||
| Basic AAs | 41.633 | 77.921 | 41.3573 | 69.18 | 20.978 | 64.422 | ||
| Sulphur-containing AAs | 3.069 | 5.767 | 3.338 | 5.572 | 2.990 | 4.694 | ||
| Aromatic AAs | 33.112 | 58.36 | 48.62 | 60.0073 | 35.012 | 50.080 | ||
| Aliphatic AAs | 56.497 | 114.0963 | 42.434 | 90.908 | 43.468 | 95.743 | ||
| Polar AAs | 134.524 | 253.78 | 107.629 | 210.9983 | 65.182 | 190.643 | ||
Note: values are mean
(UT, untreated; F, fermented; AAs, amino acids; a–b, c–d, and e–f denote comparisons between sorghum, pearl millet, and dehusked Kodo millet samples, respectively).
The free glucose content increased significantly in pearl millet samples after LAB fermentation (Table 4). Pearl millet had a higher amount of dietary fiber, contributing to resistant starch, which, when hydrolyzed, could have resulted in higher free glucose content than sorghum. Nevertheless, the resistant starch content of all millets decreased significantly during LAB fermentation. Our result is in line with the work of Balli et al. [30] on pearl millet, where the microorganism presumably utilized resistant starch. The eGI of sorghum and pearl millet flours increased during fermentation, which can be related to a decrease in the resistant starch.
| Products | Free glucose (RDS), mg/dL | Total glucose, mg/dL | Slowly digestible starch (SDS) mg/dL | Resistant starch (RS), mg/dL | Estimated glycemic index (eGI) |
| Pearl millet flour (UT) | 3.00 |
26.33 |
19.39 |
3.94 |
57.36 |
| Pearl millet flour (F) | 4.38 |
6.62 |
–0.46 |
2.70 |
61.61 |
| Sorghum flour (UT) | 1.57 |
12.03 |
8.66 |
1.80 |
67.75 |
| Sorghum flour (F) | 2.01 |
6.52 |
3.1 |
1.41 |
77.31 |
| Kodo millet rice flour (UT) | 2.35 |
15.24 |
9.51 |
3.38 |
65.43 |
| Kodo millet rice flour (F) | 3.67 |
7.78 |
1.57 |
2.54 |
70.82 |
| White bread (control) | 4.34 |
13.64 |
5.4 |
3.90 |
66.22 |
Note: values are mean
(UT, untreated; F, fermented, a–b, c–d, and e–f, and g denote comparisons between sorghum, pearl millet, and dehusked Kodo millet samples and control bread sample, respectively).
Sorghum, the great millet, and other millet are traditionally consumed in India and other regions worldwide. Many of these local dishes are fermented using back-slopping or spontaneous fermentation processes ranging from a few hours to a few days.
The enhancement of protein content in sorghum grain during fermentation could be due to single-cell protein production by the LAB culture [31] during the 17 h fermentation period with 1% culture. In the case of pearl millet and Kodo millet, the increase in protein content was more pronounced, even if the fermentation period was only for 8 h and 4 h, respectively, albeit at a higher cell culture concentration (2% and 3%, respectively). The fermentation media used in this investigation was tofu whey, which is a rich source of polysaccharides, such as stachyose, raffinose, sucrose, fructose, glucose, and protein [32] and has been used previously as growth media for LAB cultures [33]. The nutrient-rich media might have played a crucial role in the growth of the LAB during the fermentation and contributed to the production of single-cell protein [34] in the peripheral region of the whole grains. Despite a 17 h fermentation period with a 1% LAB culture concentration, the non-significant change in protein content observed in sorghum suggests that factors other than culture concentration alone might contribute to this outcome. While it is common to associate protein synthesis with higher culture concentrations, the extended fermentation duration in sorghum might have allowed for sufficient time for the LAB to metabolize and influence protein content [35].
In contrast, the non-significant change in protein content in Kodo millet, fermented for only 4 hours, hints at the importance of fermentation duration. The limited time might have been insufficient for the LAB to exert its full proteolytic activity, potentially impacting protein synthesis [36]. This underscores that culture concentration and fermentation duration are integral factors influencing protein content modulation by LAB during fermentation.
LAB derive energy from the lipids and fatty acid components of the food materials to carry out fermentation and other biochemical processes, such as lipolysis, oxidation, hydrolysis, and enzyme production [6, 37], resulting in a decrease in the total lipid/fat content.
The decrease in mineral content in the fermented millets can be explained by the fact that the submerged fermentation process was adopted for preparing these products, and it involved draining the media once fermentation was over. Since most of the minerals are concentrated in the outer layer or aleuronic layer of the grains, during this process of draining, the aleuronic layer, which also has the polysaccharides, might have been acted upon by the LAB, thus breaking away the outer layer, which might have helped to leach out of minerals. Moreover, the water-soluble minerals got solubilized in the media and eventually leached out. Our earlier work witnessed similar phenomena [38]. However, in the present case, the extent of mineral loss during fermentation was greater than in our earlier work for sorghum, where only 8 h of fermentation was involved. In contrast, in the current case, a higher period (17 h) was involved for sorghum, which might be the reason for more mineral loss. It is postulated that there could be a structural breakdown in the cell wall of the whole grains during fermentation [39], contributing to higher leaching losses. Hence, the time of submerged fermentation, media, and the type and concentration of culture will be vital for the retention of minerals in the fermented foods. The increase in Fe and Mn in the fermented grains may be due to the mineral absorption from the fermentation media, as tofu whey is rich in minerals, which was also observed in our earlier work [38]. As discussed in the previous sections, the decreased ash content indicates a decrease in most minerals after submerged LAB fermentation. This result is significant, as traditionally, people consume millets in their fermented form. In most cases, submerged fermentation is practiced through black slopping, spontaneous, or fermentation using a specific microbial culture.
The decrease in crude fiber in the fermented millets is in line with reports for sorghum [40] and pearl millet [41]. The reduction in the crude fiber during fermentation could be attributed to the breakdown of the cellulosic and hemicellulosic materials by the enzymatic action accompanied by morphological and chemical changes [42].
A significant increase in the carbohydrate content, especially in the case of Kodo millet, could be the higher degradation of crude fiber and loss of minerals, which ultimately increased the total carbohydrate content in the absence of the hard pericarp. This phenomenon is supported by the work of Alvarez et al. [43], who witnessed a faster reaction rate in the decorticated sorghum, implying the role of pericarp.
The overall increase in the antioxidant activity of the fermented grains can be explained by the fact that when the grains undergo fermentation, the breakdown of cell walls and membranes may result in the liberation of previously encapsulated bioactive compounds, particularly antioxidant phytochemicals. Notably, anthocyanins, a class of flavonoids responsible for the vibrant colors in many grains, fruits, and vegetables, are known for their potent antioxidant properties. The fermentation-induced degradation of the grain matrix may facilitate the release of anthocyanins and other phytochemicals, enhancing their bioavailability. Consequently, the heightened presence of these antioxidants in the fermented grains contributes to an increased overall antioxidant activity [44].
The increase in the antioxidant activity was more pronounced in sorghum than pearl millet and dehusked Kodo millet, indicating that the longer the fermentation period, the higher the release of bioactive compounds from the cell matrix, thus influencing the antioxidant activity. Even though pearl millet had a higher antioxidant potential than that of sorghum grain, the release of bioactive compounds from the cellular matrix seems slower in pearl millet compared to the sorghum grains and dehusked Kodo millet. This may be due to the compact cellular matrix of pearl millet compared to sorghum [45] and the absence of the harder pericarp in the Kodo millet, where dehusking eased the process of releasing bioactive compounds. It indicates that the surface area, cell wall thickness, and cellular components are crucial in defining the fermentation process.
The decrease in tannin content in the fermented millets may be attributed to the activity of the tannase enzyme, which breaks down the complex tannins. The breaking down of tannins by the tannase enzyme is reported to be produced by the LAB culture [46]. Therefore, LAB fermentation can be one of the most effective ways to reduce anti-nutritional factors, such as tannins, in sorghum and millets.
The increase in the multivitamin B can be attributed to the action of Lactococcus lactis, which was part of the culture media used in this investigation. Sybesma et al. [47] have also observed multivitamin B synthesis by Lactococcus lactis. Ochanda et al. [48] could achieve a four- to seven-fold increase in vitamin B content during 8 days of fermentation, where natural LAB fermentation was practiced, whereas we could achieve the same within 4–17 hours using selected media and mixed LAB cultures for different millets.
A significant increase in the amino acid profile of the fermented millets (F) over untreated (UT) is attributed to the metabolism of the LAB. This could be the action of Lactococcus lactis, known for its proteolysis and peptidolysis behavior [36]. The enzymes produced by the LAB are instrumental in breaking down the peptide bonds, hydrolyzing the high molecular protein structure into smaller units, thus releasing the amino acids. This has resulted in the accessibility of essential and non-essential amino acids. This implies the better absorption of amino acids in the gut, as indicated by the improvement in the estimated protein efficiency ratio and biological value in the fermented millets. The decrease in the essential to non-essential amino acids ratio suggests producing more non-essential amino acids through peptidolysis. Additionally, the significant increase in aromatic amino acids such as THR, TYR, PHE, and TRP indicates a change in the flavor of the fermented millet products. The flavor production in stinky tofu is also reportedly associated with aromatic amino acids such as phenylalanine [49]. This indicates a better flavor of the fermented millet due to fermentation.
It is postulated that during LAB fermentation, the bacteria use glucose for their metabolism, further converting glucose into lactic acid [50], which may be a plausible explanation for the decrease in the total glucose content in the fermented millets; however, the increase in the free glucose in the fermented millets could be the result of starch hydrolysis and breakdown of complex sugars into simpler forms. The LAB also utilizes resistant starch, thus decreasing the slowly digestible sugars in fermented millets. Our results are in accordance with the work of Ihediohanma [51], who also observed an increase in the eGI values of cassava starch with fermentation. On the contrary, fermentation has increased the resistant starch and decreased the eGI in millets [52, 53].
A controlled submerged LAB fermentation process has been shown to enhance the nutrient content of various millets, including whole grain sorghum, pearl millet, and dehusked Kodo millet. The biological value of protein increased in the proteins derived from pearl millet and Kodo millet, whereas it decreased in the case of sorghum. Moreover, fermentation not only contributes to these improvements but also facilitates the release of bioactive compounds, enhancing the flavor and antioxidant potential of fermented millet-based foods. Fermentation using suitable media, such as tofu whey and LAB cultures, can be adapted to commercialize millet products with better nutrients. In the future, the use of probiotics or the best vitamin B-producing and tannin-reducing cultures can be explored to improve the quality of fermented millet products.
All the data has been presented, the raw data will be provided on request.
DM conceptualized and prepared the manuscript and the principal investigator of the project. CN, YS, SRH: biochemical evaluation of the products. MKT developed the fermentation process protocol and identification of LAB culture. SSD developed the fermented products. AK provided laboratory facility and carried out mineral analysis, edited and reviewed the manuscript. All authors contributed to editorial changes in the manuscript. All authors read and approved the final manuscript. All authors have participated sufficiently in the work and agreed to be accountable for all aspects of the work.
Freshly harvested sorghum (Sorghum bicolor L) (commercial variety: Dadar) and pearl millet (Pennisetum glaucum) grains (commercial variety: Raj) sourced from Maharashtra, India, harvested in November 2016 were procured from the local grain market of Bhopal. Kodo millet (Paspalum scrobiculatum) harvested in January 2017 and sourced from the Mandla district of Madhya Pradesh, India, was procured from the farmer.
Authors wish to acknowledge ICAR-CIAE for providing facilities to carry out the experiments.
This research received no external funding.
Author Yogesh Sharma is employed by Waters India Pvt. Ltd., New Delhi. The remaining authors declare that the research was conducted in the absence of any commercial or financial relationships that could be construed as a potential conflict of interest.
References
Publisher’s Note: IMR Press stays neutral with regard to jurisdictional claims in published maps and institutional affiliations.