

 , Dennis E. Jewell 1,2
1 Pet Nutrition Center, Hill’s Pet Nutrition, Inc., Topeka, KS 66617, USA
2 Department of Grain Science and Industry, Kansas State University, Manhattan, KS 66506, USA
Abstract
Background: Chronic kidney disease (CKD) is a common condition in cats and cachexia (loss of lean body mass) is a concern. A nutrition-based intervention was investigated in cats with CKD for its effects on body composition, the plasma metabolome, and possible implications on health. Methods: After a 4-week prefeed period with the control food, cats with CKD (N = 24) were randomized to one of six groups to consume a control food; a food supplemented with 0.5% betaine, 0.39% oat beta-glucan, and 0.27% short-chain fructooligosaccharides (scFOS, test food 1); and a food supplemented with 0.5% betaine, 0.59% oat beta-glucan, and 0.41% scFOS (test food 2) in a William’s Latin Square design, each for 10 weeks. Body composition was assessed via dual-energy X-ray absorptiometry measurements, and the plasma metabolome was characterized. Results: Despite no significant differences in daily intake among the three foods, significant increases in total body mass, lean body mass, and lean plus bone mineral composition were observed when cats with CKD consumed test food 1 compared with the control food; numerical increases were seen with test food 2 versus the control food. Plasma metabolomics indicated increased one-carbon metabolism following consumption of test food 1 and/or 2, with significant increases in sarcosine and numerical increases in methionine. Lower levels of plasma trans-4-hydroxyproline and N-methylproline following consumption of test foods 1 and 2 indicates reduced collagen breakdown and perhaps reduced fibrosis. Several acylcarnitines and branched-chain fatty acids associated with CKD were also reduced when cats ate test food 1 or 2 versus the control food. Higher plasma levels of sphingomyelins with consumption of test food 1 or 2 may reflect less severe CKD. Conclusions: Consumption of foods with supplemental betaine and fibers by cats with CKD led to improvements in body composition and changes in the plasma metabolome that correspond to better kidney health.
Keywords
- betaine
- fiber
- feline
- chronic kidney disease
- plasma
- metabolomics
- body composition
Chronic kidney disease (CKD) is common in cats, with a reported overall
prevalence in primary care practice estimated at 1.2%, with an increase to 3.6%
in cats aged
Treatment recommendations for the early stages of CKD in cats focus on slowing progression in order to retain the remaining kidney function [3, 4]. Renal diets low in phosphorus and protein are recommended for cats with CKD [3, 4] and are commonly used to treat CKD as seen in primary care practice [1].
The gut microbiome and its associated metabolites have been an area of extensive research in recent years, as they can affect and provide clues regarding the health of the host. In turn, the nutrition intake of the host as well as underlying health issues can alter the gut microbiome and/or its metabolites [5]. In the case of CKD, many uremic toxins are produced by the gut microbiota [6, 7]. Differences between cats with CKD and healthy controls have been observed in plasma and fecal metabolites and in the fecal microbiome [8, 9, 10, 11].
A nutritional approach to modifying the metabolites produced by the gut microbiota is an attractive method to decrease the effects and slow the progression of CKD. Although cats are carnivores, the microbial phylogeny and gene content of their gut microbiomes are similar to those of omnivores [12]. Fiber is added to commercial cat foods [12], and gut microbiome-mediated fiber fermentation likely confers benefits to cats [13]. In fact, increased dietary fiber is associated with lower odds of chronic renal failure in cats [14]. Healthy cats and those with CKD respond differently to dietary supplementation with fermentable fibers [8]. Short-chain fructooligosaccharides (scFOS) are a more readily fermentable fiber [15] and are thus preferred over apple pomace in cats with CKD [8]. Consumption of prebiotic fermentable fibers has shown favorable effects on oxidative stress, inflammation, gut barrier integrity, and gut-derived uremic toxins in rodent models of CKD [16].
Betaine, or trimethylglycine, serves many useful cellular functions. It is a methyl group donor for methylation reactions, an essential biochemical process across all life, and has anti-inflammatory and antioxidant properties [17]. In addition, betaine protects against osmotic stress, in part by stabilizing proteins [17]. In the kidney medulla, betaine is an osmoprotectant, where it preserves cell volume and function in the presence of the high osmolarity needed for urine concentration and water reabsorption [18]. Plasma levels of betaine decrease with CKD progression [19], but oral administration of betaine in hyperuricemic mice resulted in significantly reduced serum uric acid and increased markers of improved kidney function [20]. Foods high in betaine have been reported to increase the abundance of beneficial gut bacteria [21].
Some prior work has tested the effects of betaine and fiber on the metabolome. Several beneficial changes in the plasma metabolome, including decreases in uremic toxins, were observed following consumption of foods containing betaine, oat beta-glucan, and scFOS by dogs with early renal disease [22]. A small study of cats with CKD (N = 7) that consumed a food with betaine, oat beta-glucan, and scFOS for 8 weeks had higher levels of plasma metabolites involved in one-carbon metabolism compared with the control food [23].
The present study expands upon the results seen with the betaine, oat beta-glucan, and scFOS food in cats with CKD, here in a different base food and in a greater number of cats fed for 10 weeks. In addition, a food with added betaine but lower levels of oat beta-glucan and scFOS was tested, and body composition and plasma metabolites are reported.
The control food was a complete and balanced dry food designed to aid in the management of renal disease with no added betaine or fiber from scFOS or beta-glucan. The two test foods were of similar formulation to the control food except that each was supplemented with 0.5% betaine; the test food with a lower amount of added fiber (test food 1) also had 0.39% oat beta-glucan and 0.27% scFOS, and the test food with a greater amount of added fiber (test food 2) had 0.59% oat beta-glucan and 0.41% scFOS. To compensate for the increased fiber inclusion in test food 2, 0.34% whole red wheat was added to test food 1. All foods contained fiber from brown rice, whole wheat, and barley, with the amount of whole wheat adjusted to accommodate for the added betaine, scFOS, and oat beta-glucan. All foods were manufactured at Hill’s Pet Nutrition in dry form and met the Association of American Feed Control Officials (AAFCO) maintenance nutrition requirements for adult cats. Proximate analysis were carried out using AOAC methods as previously described [23].
Twenty-four spayed or neutered cats owned by Hill’s Pet Nutrition with
International Renal Interest Society stage 1 CKD (based on the results of annual
physical examinations, complete blood count, serum biochemistries, and
urinalysis; blood creatinine
The study protocol was approved by the Hill’s Institutional Animal Care and Use Committee (IACUC) (Permit number: 830) and Animal Welfare Committee. This study complied with the US National Research Council guide for the care and use of laboratory animals [24]. After a 4-week prefeed period on the control food, cats were assigned into six subgroups to receive the control food, test food 1, or test food 2, each for 10 weeks, in a Williams Latin Square design sequence [25] with age and sex balanced among groups (Fig. 1). The amounts of food given were to maintain body weight, and intake was recorded for each cat. Blood samples were collected from fasted cats midway and at the end of each treatment period.
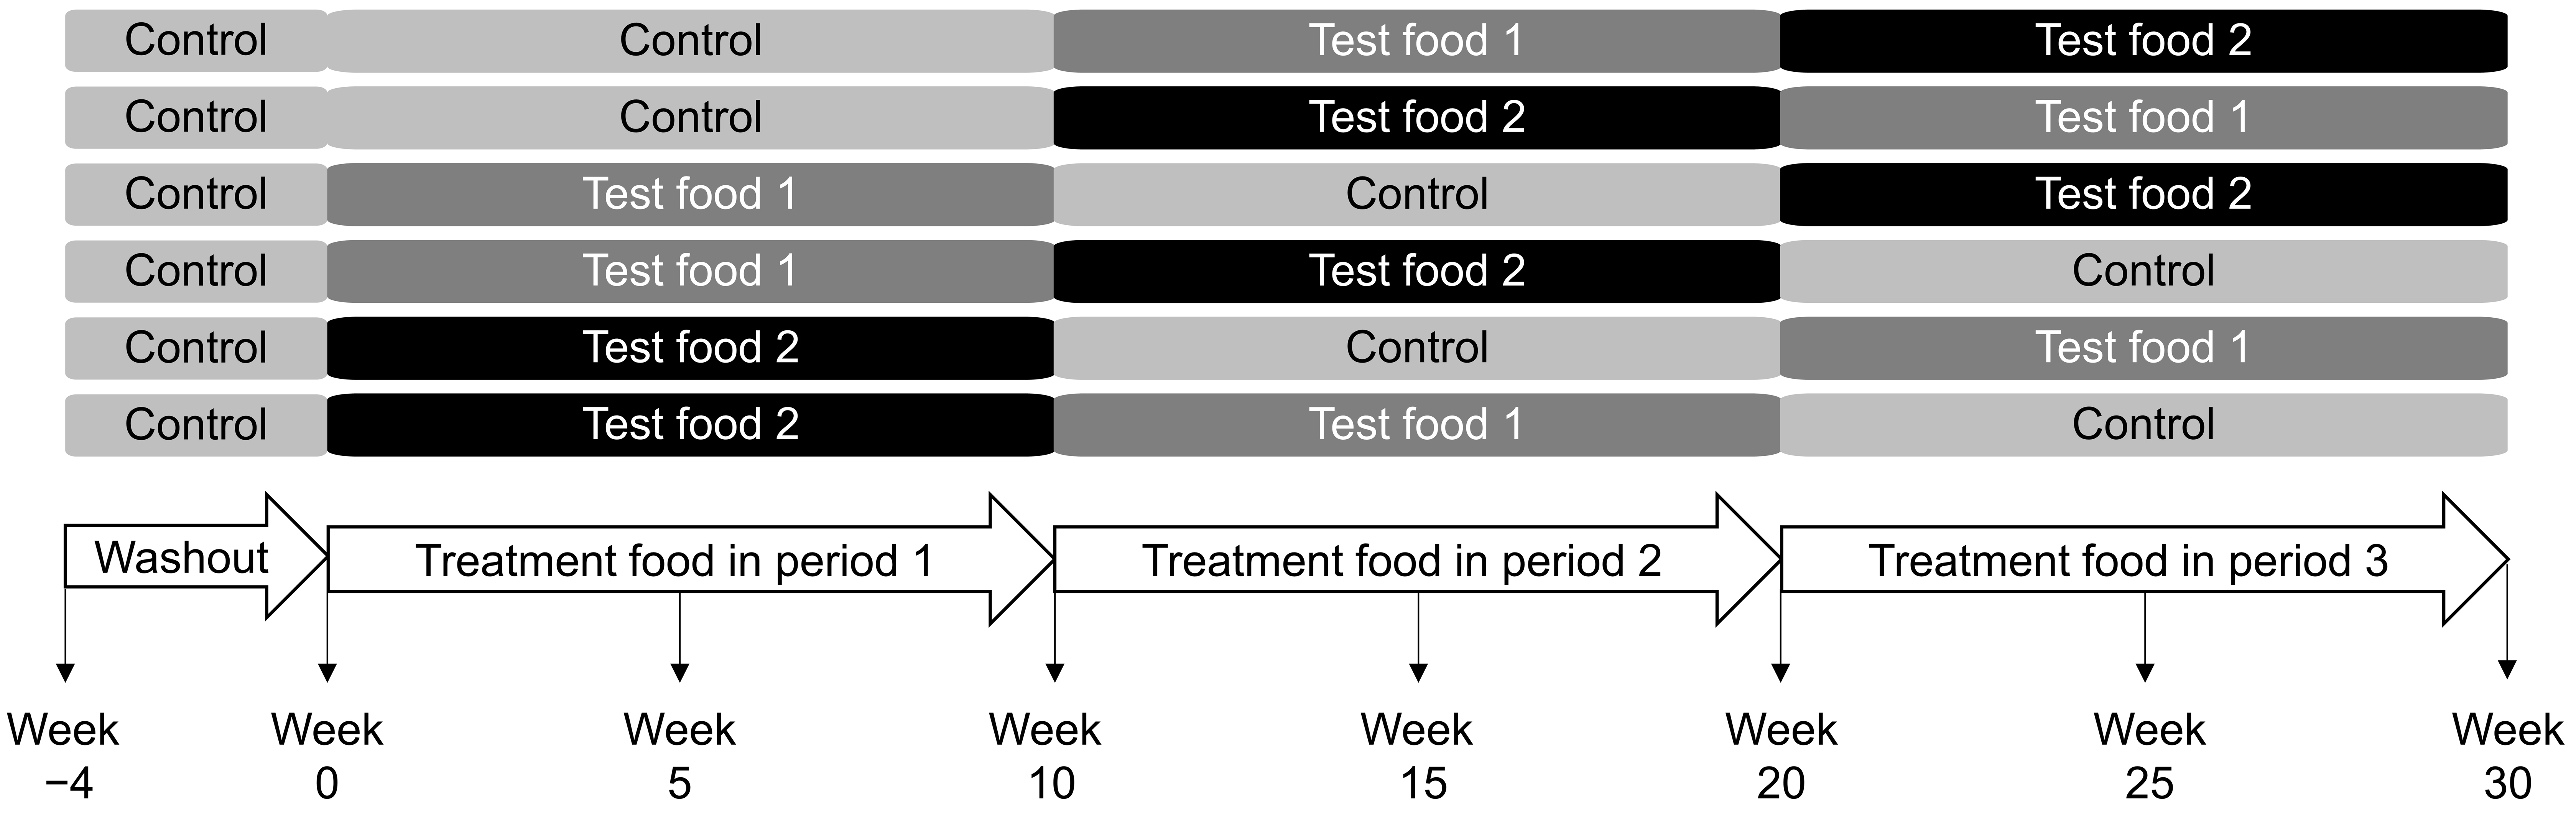 Fig. 1.
Study design. Sequence and timeline in which cats consumed the control and test foods in a Williams Latin Square design. Test food 1 contained 0.5% betaine, 0.39% oat beta-glucan, and 0.27% scFOS, and test food 2 contained 0.5% betaine, 0.59% oat beta-glucan and 0.41% scFOS. scFOS, short-chain fructooligosaccharides.
Dual-energy X-ray absorptiometry (DEXA) measurements were conducted using the DXA-QDR-4500 system (Hologic, Waltham, MA, USA) at baseline and the end of each treatment period. A chemistry screen was used to assess circulating blood creatinine and blood urea nitrogen (BUN) after fasting [26]. Analysis of plasma metabolomics was performed by Metabolon (Morrisville, NC) as previously described [27].
JMP Pro software (JMP® Pro 15S, AS Institute, Cary, NC, USA) was
used for data analyses. Metabolomics data was log-transformed before statistical
analysis. Mean units for metabolites were scaled to a median of 1. Mixed model
analysis was used to compare the treatment effect during the treatment period
using animal identification as the random designate. In all analyses, statistical
significance was considered to be p
Results of the proximate analysis of the foods are shown in Table 1. The three foods had similar nutrient profiles except that both test foods 1 and 2 contained higher amounts of soluble fiber than the control food. The concentration of soluble fiber in test food 1 was greater than that of test food 2 due to the added whole wheat.
| Proximate analysis parameter | Control food | Test food 1 | Test food 2 |
|---|---|---|---|
| Moisture | 5.76 | 5.83 | 5.74 |
| Ash | 4.5 | 4.6 | 4.6 |
| Crude protein | 29.1 | 29.6 | 29.7 |
| Crude fat | 20.7 | 22.3 | 21.4 |
| Crude fiber | 1.0 | 1.0 | 0.9 |
| Neutral detergent fiber | 2.8 | 3.1 | 2.9 |
| Soluble fiber | 1.0 | 2.4 | 1.7 |
| Total dietary fiber | 7.4 | 6.9 | 6.3 |
| Lysine | 1.45 | 1.45 | 1.42 |
| Methionine | 0.65 | 0.64 | 0.64 |
| Cystine | 0.44 | 0.45 | 0.45 |
| Phosphorus | 0.56 | 0.58 | 0.58 |
| Potassium | 0.78 | 0.79 | 0.79 |
| Chloride | 0.54 | 0.51 | 0.52 |
| Calcium | 0.72 | 0.73 | 0.72 |
| Magnesium | 0.08 | 0.09 | 0.09 |
| Betaine | 0.04 | 0.58 | 0.58 |
| Food (kcal/kg) | 4160.7 | 4158.8 | 4157.8 |
Reported values are percentages unless otherwise indicated. Test food 1 contained 0.5% betaine, 0.39% oat beta-glucan, and 0.27% scFOS, and test food 2 contained 0.5% betaine, 0.59% oat beta-glucan and 0.41% scFOS. scFOS, short-chain fructooligosaccharides.
Twenty-two of the 24 cats completed the study; one cat with kidney stones was removed due to low food intake, and another cat with renal failure was removed due to the severity of the disease.
The inclusion of fiber did not appear to affect average daily food intake since
there was no significant difference (p
| Parameter | Control food | Test food 1 | Test food 2 | p value, test food 1 vs control food | p value, test food 2 vs control food | p value, test food 1 vs test food 2 |
|---|---|---|---|---|---|---|
| Food intake, g/day | 34.7 |
37.6 |
38.3 |
0.620 | 0.498 | 0.834 |
| Total body mass, g | 4992.4 |
5097.7 |
5071.1 |
0.014 | 0.063 | 0.529 |
| Lean body mass, g | 3507.4 |
3549.6 |
3529.8 |
0.031 | 0.244 | 0.312 |
| Total fat mass, g | 1486.1 |
1550 |
1540 |
0.220 | 0.335 | 0.967 |
| Bone mineral composition, g | 137.7 |
138.5 |
138.9 |
0.483 | 0.242 | 0.882 |
| Lean body mass + bone mineral composition, g | 3645 |
3688.2 |
3668.7 |
0.027 | 0.216 | 0.317 |
Actual means are shown. Test food 1 contained 0.5% betaine, 0.39% oat beta-glucan, and 0.27% scFOS, and test food 2 contained 0.5% betaine, 0.59% oat beta-glucan and 0.41% scFOS. scFOS, short-chain fructooligosaccharides.
There was no treatment effect on the blood chemistry parameters of creatinine or BUN following consumption of each food, with respective values of 1.49, 1.49, and 1.57 mg/dL for the control food, test food 1, and test food 2 for creatinine (p = 0.806) and 23.4, 24.0, and 24.4 mg/dL for BUN (p = 0.879).
Consumption of both test foods led to significant increases in markers of methylation such as betaine and sarcosine (significantly changed metabolites are shown in Table 3). Methionine tended to be higher after cats ate the test food 1 (p = 0.070 vs control food), while S-methylmethionine was significantly increased by both test foods. The methylated amino acid N,N,-dimethylalanine, markers of collagen breakdown (trans-4-hydroxyproline and N-methylproline), the xenobiotics homostachydrine and stachydrine, and the branched-chain fatty acids 2-hydroxy-3-methylvalerate and 2-hydroxybutyrate/2-hydroxyisobutyrate were reduced after cats consumed either test food. In addition, branched-chain amino acids and dipeptides including isovalerylglycine, 2-hydroxy-3-methylvalerate, alpha-hydroxyisocaproate and gamma-glutamylalanine were significantly reduced after cats were fed test food 1 (Table 3). There were only a few metabolites that significantly differed between the two test foods; these included higher levels of betaine, N6-methyllysine, alpha-hydorxyisocaproate, and 3-hydroxyisobutyrate and lower levels of N,N-dimethylalanine with test food 2 compared with test food 1.
| Plasma metabolite | Control food | Test food 1 | Test food 2 | p value, test food 1 vs control food | p value, test food 2 vs control food | p value, test food 1 vs test food 2 | ||
|---|---|---|---|---|---|---|---|---|
| Increased following test foods | ||||||||
| Amino Acid Metabolism | ||||||||
| Betaine | 0.79 | 1.09 | 1.16 | 0.012 | ||||
| 2,3-dihydroxy-5-methylthio-4-pentenoate (DMTPA) | 0.98 | 1.05 | 1.09 | 0.031 | 0.003 | NS | ||
| 4-imidazoleacetate | 1.04 | 1.27 | 1.18 | 0.002 | 0.004 | NS | ||
| Imidazole lactate | 1.0 | 1.15 | 1.18 | NS | 0.007 | NS | ||
| Imidazole propionate | 0.95 | 1.14 | 1.18 | 0.002 | 0.002 | NS | ||
| 1-methyl-4-imidazoleacetate | 1.05 | 1.18 | 1.28 | NS | 0.009 | NS | ||
| N-acetylserine | 0.96 | 1.06 | 1.06 | 0.020 | 0.046 | NS | ||
| Sarcosine | 0.93 | 1.23 | 1.11 | 0.002 | NS | |||
| S-methylmethionine | 0.88 | 1.26 | 1.39 | 0.070 | ||||
| Succinoyltaurine | 1.05 | 1.11 | 1.11 | 0.035 | 0.022 | NS | ||
| Decreased following test foods | ||||||||
| Amino Acid Metabolism | ||||||||
| Alpha-hydroxyisocaproate | 1.16 | 1.03 | 1.13 | 0.007 | NS | 0.014 | ||
| Gamma-glutamylalanine | 1.1 | 1.0 | 1.0 | 0.047 | NS | NS | ||
| Glutamine | 1.04 | 0.99 | 1.0 | 0.043 | NS | NS | ||
| Glutarylcarnitine (C5-DC) | 1.04 | 0.94 | 0.97 | 0.015 | NS | NS | ||
| 2-hydroxybutyrate/2-hydroxyisobutyrate | 1.75 | 1.37 | 1.47 | 0.013 | 0.069 | |||
| 2-hydroxy-3-methylvalerate | 1.2 | 1.11 | 1.13 | 0.009 | NS | NS | ||
| 3-hydroxyisobutyrate | 1.08 | 1.0 | 1.12 | 0.066 | NS | 0.03 | ||
| Isovalerylglycine | 1.12 | 0.98 | 1.24 | 0.024 | NS | NS | ||
| N-acetylglutamate | 1.12 | 0.98 | 1.05 | 0.012 | NS | NS | ||
| N6-methyllysine | 1.14 | 1.03 | 1.12 | 0.004 | NS | 0.01 | ||
| N-methylproline | 1.13 | 0.96 | 0.91 | 0.016 | 0.001 | NS | ||
| N,N-dimethylananine | 1.41 | 0.81 | 0.55 | 0.002 | 0.028 | |||
| Trans-4-hydroxyproline | 1.18 | 0.90 | 0.93 | NS | ||||
| Vanillactate | 0.9 | 0.78 | 0.88 | 0.032 | NS | NS | ||
| Xenobiotics | ||||||||
| Homostachydrine | 1.43 | 0.84 | 0.81 | NS | ||||
| Stachydrine | 1.38 | 0.89 | 0.89 | NS | ||||
Values were rescaled to a median value of 1. There was no difference by sequence
of treatment (p
Certain sphingomyelins were increased while carnitine-conjugated lipids were reduced after cats ate both treatment foods (Table 4). Several long-chain mono/polyunsaturated fatty acids including myristoleate and docosatrienoate (22:3n6) were significantly increased after cats consumed test food 1 with non-significant increases in EPA and DHA. None of the lipid metabolites were statistically different between the two treatment foods (Table 4).
| Plasma metabolite | Control food | Test food 1 | Test food 2 | p value, test food 1 vs control food | p value, test food 2 vs control food | p value, test food 1 vs test food 2 | |
|---|---|---|---|---|---|---|---|
| Increased following test foods | |||||||
| Docosatrienoate (22:3n6) | 1.04 | 1.38 | 1.16 | 0.047 | NS | 0.059 | |
| Glycosyl-N-palmitoyl-sphingosine (d18:1/16:0) | 1.03 | 1.14 | 1.11 | 0.027 | 0.047 | NS | |
| Heptadecanedioate (C17-DC) | 0.93 | 1.11 | 0.97 | 0.003 | NS | 0.051 | |
| Hexadecanedioate (C16-DC) | 0.95 | 1.16 | 1.02 | 0.084 | 0.065 | ||
| Myristoleate (14:1n5) | 1.03 | 1.21 | 1.1 | 0.049 | NS | NS | |
| N-palmitoyl-sphinganine (d18:0/16:0) | 1.03 | 1.11 | 1.12 | 0.039 | 0.034 | NS | |
| Octadecadienedioate (C18:2-DC) | 0.95 | 1.09 | 1.02 | 0.010 | NS | NS | |
| Octadecanedioate (C18-DC) | 0.97 | 1.12 | 1.02 | 0.006 | NS | NS | |
| Octadecenedioate (C18:1-DC) | 0.89 | 1.22 | 1.04 | NS | NS | ||
| Sphingomyelin (d18:1/22:2, d18:2/22:1, d16:1/24:2) | 0.98 | 1.06 | 1.03 | 0.004 | 0.014 | NS | |
| Sphingomyelin (d18:2/24:1, d18:1/24:2) | 0.98 | 1.04 | 1.05 | 0.044 | 0.010 | NS | |
| Decreased following test foods | |||||||
| Adipoylcarnitine (C6-DC) | 1.11 | 0.94 | 1.04 | 0.011 | NS | NS | |
| Branched-chain, straight-chain, or Cyclopropyl 10:1 fatty acid (1) | 1.26 | 0.89 | 0.81 | NS | |||
| Cerotoylcarnitine (C26) | 1.11 | 0.91 | 0.92 | 0.001 | NS | ||
| Erucoylcarnitine (C22:1) | 1.0 | 0.86 | 0.92 | 0.033 | NS | 0.08 | |
| 3-hydroxyoleoylcarnitine | 1.14 | 1.04 | 0.98 | 0.028 | 0.013 | NS | |
| Lignoceroylcarnitine (C24) | 1.09 | 0.94 | 1.03 | 0.010 | NS | NS | |
| Nervonoylcarnitine (C24:1) | 1.10 | 0.95 | 0.96 | 0.005 | 0.021 | NS | |
| 1-palmitoyl-2-arachidonoyl-GPE (16:0/20:4) | 1.19 | 1.03 | 1.36 | 0.006 | NS | NS | |
| 1-palmitoyl-2-linoleoyl-GPI (16:0/18:2) | 1.12 | 0.98 | 1.02 | 0.035 | 0.070 | NS | |
| Pentadecanoylcarnitine (C15) | 1.15 | 1.09 | 0.93 | 0.032 | 0.09 | ||
| Stearoylcarnitine (C18) | 1.08 | 0.10 | 0.99 | 0.031 | 0.062 | NS | |
| Suberoylcarnitine (C8-DC) | 1.07 | 0.90 | 0.95 | 0.011 | NS | NS | |
| Ximenoylcarnitine (C26:1) | 1.17 | 0.94 | 0.92 | 0.002 | 0.001 | NS | |
Values were rescaled to a median value of 1. There was no difference by sequence
of treatment (p
In this study, body composition parameters of total body mass, lean body mass, and lean body mass plus bone mineral composition were significantly higher in cats with CKD following consumption of test food 1 versus the control food. Similarly, though not statistically significant, consumption of test food 2 also led to numerically higher values for these body composition parameters. This greater body composition was observed despite similar daily food intakes among the three study foods. These results are consistent with prior work that found that cats with CKD had a higher body mass after consuming a food similar to test food 2 compared with a control food even though food intakes were not significantly different [23]. Together, the data from that study and this one indicate that betaine and these fermentable fibers increase the ability of cats with CKD to utilize food. These results are especially noteworthy given that loss of body weight is a concern in cats with CKD since it is associated with a shorter survival time [28].
There is additional evidence that supplementation with betaine can increase body mass. In Huang Jiang mini-pigs, dietary supplementation with betaine for 60 days increased final body weight, average daily gain, and lean percentage while decreasing average backfat thickness compared with a control food [29]. Also, a study of men in a strength training program found that betaine supplementation for 6 weeks improved body composition by lowering body fat and fat mass and increasing lean body mass compared with placebo [30]. However, meta-analyses of clinical trials in humans found that dietary betaine supplementation did not affect body mass [31, 32], similar to healthy cats [23]. Body fat was lowered with betaine supplementation [32], so the effects of betaine on body mass may depend on the species, kidney function status, and/or high metabolic demand. Betaine may exert its effect on increasing body mass by increasing protein synthesis [33] and the cell proliferation rate in regulating the cellular response to hyperosmolarity [34].
In this study, the main difference between the nutrient profiles of the test foods and the control food was the inclusion of betaine, as the amounts of crude and total fiber were the same among all foods. The observation of improved body composition after cats with CKD consumed test food 1 warrants further research to understand the mechanism by which betaine and prebiotics deliver benefits toward preventing cachexia in cats with CKD. In addition, it would be useful to evaluate the independent effects of betaine and soluble fiber on body composition since test food 1 had the highest amounts of soluble fiber among the foods tested here.
Not surprisingly, supplementation of the test foods with betaine resulted in higher plasma concentrations of betaine relative to the control food. This allowed for increased one-carbon metabolism, as evidenced by the higher levels of sarcosine, a downstream metabolite of betaine, following consumption of either test food. Also consistent with the present study, higher levels of plasma sarcosine and betaine were observed following consumption of test food 2 compared with the control food [23]. Betaine supplementation significantly lowers plasma homocysteine levels in healthy adult humans, likely due to increased methionine formation due to betaine-mediated methylation of homocysteine [35]. Homocysteine, a normal product of the methionine cycle, is a known risk factor for the loss of cognitive function [36]. It is also a gut microbiota-derived, protein-bound uremic toxin [6], and high plasma homocysteine is a marker for increased risk of cardiovascular disease and stroke [37]. Although not significant, plasma methionine levels were numerically higher with the test foods in this study compared with the control food; homocysteine was not detected in the metabolite screen.
Betaine may be the ingredient responsible for the decrease in N-methylproline seen here with the test foods, as healthy dogs that consumed a food supplemented with only betaine exhibited lower levels of plasma N-methylproline compared with the control food [38]. In addition, cats with different single nucleotide polymorphisms in the gene encoding alanine-glyoxylate aminotransferase 2, which puts them at different risk levels for calcium oxalate kidney stone formation, showed lower levels of trans-4-hydroxyproline after consuming a food with added betaine and botanicals compared with the control food [39].
Renal fibrosis involves the remodelling and turnover of the extracellular matrix, specifically the degradation of collagen by matrix metalloproteases. Thus, collagen degradation reflects the extent of renal fibrosis in CKD [40]. Trans-4-hydroxyproline is a major component of collagen, with N-methylproline a more minor one. The lower levels of plasma N-methylproline and trans-4-hydroxyproline observed here with the test foods compared with the control food may indicate reduced collagen breakdown and by extension, reduce the likelihood of renal fibrosis. Levels of plasma N-methylproline and/or trans-4-hydroxyproline were decreased relative to baseline in healthy cats, cats with CKD, and in dogs with early renal disease that consumed foods with supplemental betaine, oat beta-glucan, and scFOS [8, 22, 23].
Sphingomyelins are found in animal cell membranes; in addition to providing structure to the membrane, some also participate in signalling functions. A number of sphingomyelin metabolites were at higher plasma levels in both dogs fed supplemental betaine [38] and in the present study in which cats with CKD consumed the foods with supplemental betaine, oat beta-glucan, and scFOS. Levels of plasma sphingomyelins were lower in humans on hemodialysis compared with patients with lower stages of CKD [41]. Thus, the significant increases in various sphingomyelins observed in cats that ate test food 1 or 2 compared with the control food may be more reflective of less severe CKD and are perhaps beneficial in delaying CKD progression.
Acylcarnitines transfer long-chain fatty acids from the cytoplasm to the mitochondria for fatty acid oxidation. Here, a number of acylcarnitines were found at lower levels following cats’ consumption of the test foods compared with the control food. Similarly, plasma levels of several types of carnitines were lower in both dogs fed supplemental betaine [38]. These observed decreases in circulating carnitines may be the result of their shift to the liver and muscle [42], also supported by the observation of the significant increase in lean body mass in the present study. Lower levels of carnitines may also be beneficial since glutarylcarnitine is inversely associated with eGFR in humans [43] and is at higher levels in plasma from people with diabetic kidney disease compared with those with type 2 diabetes alone [44]. Several acylcarnitines, including pentadecanoylcarnitine, stearoylcarnitine, and erucoylcarnitine, were at higher levels in the brains of aged mice compared with younger mice [45]. Accumulation of stearoylcarnitine also impairs the tricarboxylic acid cycle in beta cells, thus depleting these cells of energy during the progression of type 2 diabetes [46]. A subset of individuals with elevated levels of trimethylamine N-oxide (TMAO), a gut microbial metabolite that is elevated in CKD [47], also had elevated plasma levels of several carnitines, including glutarylcarnitine, stearoylcarnitine, ximenoylcarnitine, lignoceroylcarnitine, and nervonoylcarnitine [48], all of which were at lower plasma levels after cats consumed the test foods compared with the control food in the present study.
A few plasma metabolites containing imidazole moieties were increased compared with the control food following the consumption of the test foods. Imidazole lactate and imidazole propionate were also found to be increased in plasma with food similar to test food 2 in healthy cats [23]. These imidazole metabolites are found at higher levels in urine from patients with end-stage renal disease on hemodialysis compared with controls [49]. Despite this, imidazole propionate, a metabolite of histidine produced by the gut microbiota, has been found to protect against cardiopulmonary toxicity induced by radiation for cancer therapy [50]. In addition, several imidazole-containing compounds exhibit a variety of anticancer activities [51].
The branched-chain fatty acids 2-hydroxybutyrate/2-hydroxyisobutyrate and 2-hydroxy-3-methylvalerate were at lower levels in plasma following consumption of the test foods in this study compared with the control food. Prior work showed that BCFAs were at higher levels in feces of cats with CKD compared with healthy controls, and levels were even higher in cats with muscle atrophy [52]. Branched-chain fatty acids are also associated with type 2 diabetes, obesity, and some types of cancer [53]. Further, the reduction of branched-chain fatty acids was associated with an increase in saccharolytic metabolism and enhanced markers of renal health in cats [54]. Thus, lower circulating BCFA levels may be beneficial to health.
Several branched-chain or methylated amino acids that were at significantly lower plasma levels following consumption of test food 1 and/or 2 compared with the control food in this study have been associated with adverse health effects. Lower kidney clearance of isovalerylglycine was identified as one of six solutes associated with significantly higher risks of progression of CKD [55] and cognitive decline [56] in a large clinical study of over 3000 patients. In addition, N-methylproline and gamma-glutamylalanine were among the metabolites negatively associated with physical function in a clinical study of older adults [57]. Alpha-hydroxyisocaproate was one of a few serum metabolites that were predictive of acute ischemic stroke in males [58].
In summary, cats with CKD that consumed food supplemented with betaine, oat beta-glucan, and scFOS displayed benefits in lean body mass, likely due to enhanced energy use. A number of changes in plasma metabolites that likely indicate health benefits were also observed, including lower levels of collagen breakdown components, acylcarnitines associated with CKD, and branched-chain fatty acids as well as higher levels of sphingomyelins and sarcosine, the latter indicating increased one-carbon metabolism. Thus, supplemental betaine and fiber are an aid in the nutritional management of renal disease in cats.
CKD, chronic kidney disease; scFOS, short-chain fructooligosaccharides; TMAO, trimethylamine N-oxide.
The datasets analyzed during the study are available from the corresponding author on reasonable request.
These should be presented as follows: EE and DEJ designed the research study. EE performed the research, analyzed the data, and wrote the manuscript. Both authors contributed to editorial changes in the manuscript. Both authors read and approved the final manuscript.
The study protocol was approved by the Hill’s Institutional Animal Care and Use Committee (IACUC) (Permit number: 830) and Animal Welfare Committee.
Jennifer L. Giel, PhD, assisted with the writing and development of this manuscript.
This research was funded by Hill’s Pet Nutrition, Inc.
Although the funder (Hill’s Pet Nutrition, Inc.) provided support in the form of salaries for the authors, the funder had no role in the design of the study; in the collection, analyses, or interpretation of data; in the writing of the manuscript, or in the decision to publish the results. The research was performed at the Pet Nutrition Center, Topeka, Kansas, where these authors currently work (E.E.) or formerly worked (D.E.J.).
References
Publisher’s Note: IMR Press stays neutral with regard to jurisdictional claims in published maps and institutional affiliations.