IMR Press / FBE / Volume 14 / Issue 4 / DOI: 10.31083/j.fbe1404026
Open Access Original Research
Proximate Composition, Physicochemical and Microbiological Characterization of Edible Seaweeds Available in the Portuguese Market
Show Less
1 Associate Laboratory i4HB, Institute for Health and Bioeconomy, NOVA School of Science and Technology, NOVA University of Lisboa, Quinta da Torre, 2829-516 Caparica, Portugal
2 UCIBIO-REQUIMTE, Department of Chemistry, NOVA School of Science and Technology, NOVA University of Lisboa, Quinta da Torre, 2829-516 Caparica, Portugal
3 LAQV-REQUIMTE, Department of Chemistry, NOVA School of Science and Technology, NOVA University of Lisboa, Quinta da Torre, 2829-516 Caparica, Portugal
4 Division of Aquaculture, Seafood Upgrading and Bioprospection, Portuguese Institute for the Sea and Atmosphere, I.P. (IPMA), 1495-006 Lisboa, Portugal
5 Department of Natural Resources, Environment and Territory, Instituto Superior de Agronomia, School of Agriculture, University of Lisboa, Tapada da Ajuda, 1349-017 Lisboa, Portugal
*Correspondence: bm.campos@campus.fct.unl.pt (Bruno Miguel Campos); mesd@fct.unl.pt (Mário Sousa Diniz)
Academic Editor: Leonel Pereira
Front. Biosci. (Elite Ed) 2022, 14(4), 26; https://doi.org/10.31083/j.fbe1404026
Submitted: 22 June 2022 | Revised: 15 July 2022 | Accepted: 26 July 2022 | Published: 28 September 2022
(This article belongs to the Special Issue Seaweed Applications in Food and Biotechnology)
Copyright: © 2022 The Author(s). Published by IMR Press.
This is an open access article under the CC BY 4.0 license.
Abstract

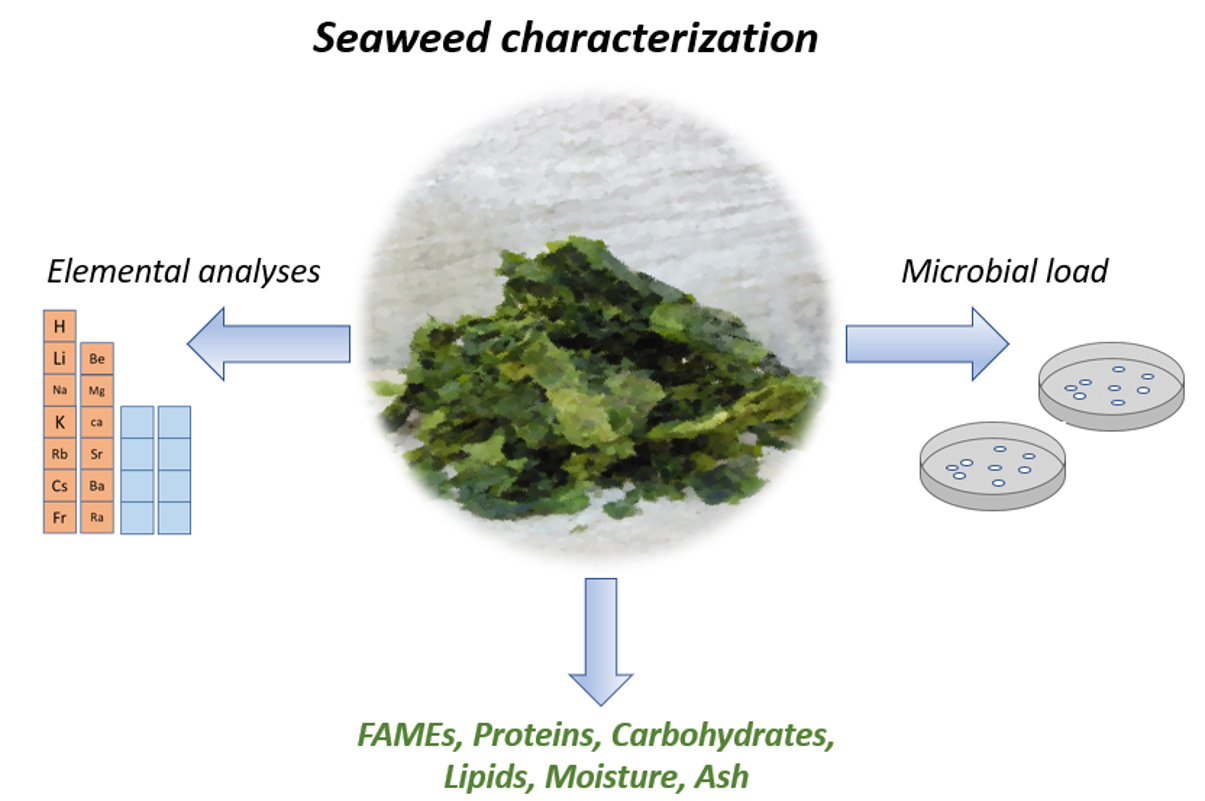
Background: The aim of this work was the study of the proximate composition and profile of fatty acids, minerals, and some microbiological aspects of four edible seaweed species (Chondrus crispus, Palmaria palmata, Porphyra sp., and Ulva sp.) available in the Portuguese market for food consumption, and produced in a national Integrated Multi-Trophic System (IMTA). Methods: Moisture, ash, and total lipids were determined gravimetrically. Crude protein was analysed by Duma’s combustion procedures. The total carbohydrate content was assayed by the phenol/sulphuric acid method. The assessment of the fatty acids methyl esters (FAMEs) was determined through GC-MS. Characterization of elemental analysis was performed by ICP-AES. Different standard microbiological methods were applied for microorganisms. Statistics were performed using the non-parametric Mann–Whitney U test to assess significant differences between samples. Results: Lipid contents (n = 3) were very low (1.6–2.3%), particularly in Palmaria palmata, and Chondrus crispus (1.6–1.7%). The protein content (n = 4) varied from 14.4% in P. palmata to 23.7% in Porphyra sp. Carbohydrates (n = 3) were the major constituent of most seaweeds (31–34%), except in Porphyra sp., with higher content in proteins than carbohydrates. Regarding the fatty acid content (n = 4), in general, saturated fatty acids (SFAs) were the most abundant followed by polyunsaturated fatty acids (PUFAs) and monounsaturated fatty acids (MUFAs). Among macro and trace elements (n = 3), Chondrus crispus shows the highest average content in Zn (71.1 mg kg - 1 D.W.), Palmaria palmata the highest average content in K (124.8 g kg - 1 D.W.), Porphyra sp. the highest average content in P (2.1 g kg - 1 D.W.), and Ulva sp. the highest average content of Ca (5.5 g kg - 1 D.W.), Mg (55.8 g kg - 1 D.W.), and Fe (336.3 mg kg - 1 D.W.). In general, Na and K were the most abundant elements among analysed seaweed. Additionally, the microbiological results (n = 4) comply with the Portuguese guidelines (subgroup 2D) on the application of general principles of food hygiene in ready-to-eat foods. Conclusions: Overall, the results highlight the potential of using these seaweeds as an alternative and sustainable source of elements and bioactive compounds to produce enriched food products with a beneficial potential for human nutrition.

Keywords
Edible seaweed species
proximal composition
chemical analysis
microbial load
1. Introduction

Seaweeds are considered a potential source of non-animal food ingredients of the future, being envisaged as a relevant alternative due to their ability to grow without using arable land or freshwater resources, thus not competing with traditional terrestrial crops [1]. Furthermore, seaweeds take advantage due to their higher growth rate, carbon-neutral emissions, and capability to synthesize a wide range of bioactive compounds [2] with potential health benefits [3].

In recent years, the culture and marketing of seaweeds and their products worldwide have attracted growing attention [4]. The global seaweed market size was valued at USD 16.6 billion in 2020 and is expected to show an estimated compound annual growth rate (CAGR) of 10.8% from 2021 to 2028 [5]. Currently, 97% of the world’s seaweed production correspond to seaweed from aquaculture, with only 3% resulting from harvesting/exploitation of wild populations [4, 6]. Among the diverse cultivation methods, Integrated Multi-Trophic Aquaculture (IMTA) offers many advantages. The IMTA system allows combining several species of different trophic levels (e.g., salmon with seaweeds), where the by-products of one species are recycled and become a source of nutrients for another species [7, 8, 9]. The efficiency of these systems is based on the assimilation of excreted ammonium, phosphates, and CO 2 by seaweeds, converting them into biomass [4, 10]. Currently, about 200 species are commercially interesting, of which only about 10 taxa are intensively cultured [10, 11], such as seaweeds from genera Saccharina and Undaria (brown algae); Porphyra/Pyropia, Eucheuma/Kappaphycus, and Gracilaria (red algae); and Monostroma and Enteromorpha/Ulva (green algae) [4, 10, 12]. The most suitable species for IMTA systems, due to their biofiltration capacity, combined with their commercial value, are Gracilaria spp., Palmaria palmata, Porphyra spp., and Ulva spp., among others [13, 14]. Moreover, several studies have shown that seaweeds grown in IMTA systems have higher contents of proteins [9, 14, 15], polysaccharides, pigments, and functional compounds, thereby contributing to the production of high-quality nutritional biomass [15]. The main aim of the present work is to assess the potential for food consumption of four edible dry seaweeds (Chondrus crispus, Palmaria palmata, Porphyra sp., Ulva sp.) available in the Portuguese market, and produced in IMTA systems. The seaweeds were analysed for the proximal composition, and some chemical and biochemical parameters, such as moisture, ash, carbohydrates, proteins, lipids, fatty acid profile, and minerals content, as well as to have evaluated the presence of human bacterial pathogens to obtain an overall view of the safety and nutritional quality of the analysed seaweeds.

2. Materials and Methods
2.1 Algal Biomass

The green seaweed (Chlorophyta), Ulva sp. (Linnaeus, 1753) (Sea lettuce; Ulvales, Ulvaceae), and red seaweeds (Rodophyta) Chondrus crispus (Stackhouse, 1797) (Irish moss; Gigartinales, Gigartinaceae), Palmaria palmata ((Linnaeus) F. Weber & D. Mohr, 1805) (Dulse; Palmariales, Palmariaceae) and Porphyra sp. (C.A. Agardh, 1824) (Nori; Bangiales, Bangiaceae) were purchased from ALGAplus, Ltd. (Ílhavo, Portugal), a company specialized in the production of seaweeds in a land-based Integrated Multi-Trophic Aquaculture (IMTA) (see Fig. 1). The dry algal biomass (Tok de Mar®) were lyophilized, without any other previous treatment or washing procedure, in a laboratory freeze-dryer (ScanVac Cool Safe 4 L, LaboGene, Denmark), operating at a working temperature of – 50 °C under a pressure of 0.0005–0.002 mBar, for 48 h. Then, seaweeds were milled to less than 1.0 mm particle size using a blender (Orbegozo BV 9600, Murcia, Spain), vacuum-packaged (Sammic SU-316G, Azkoitia, Spain) in labeled polypropylene bags (90
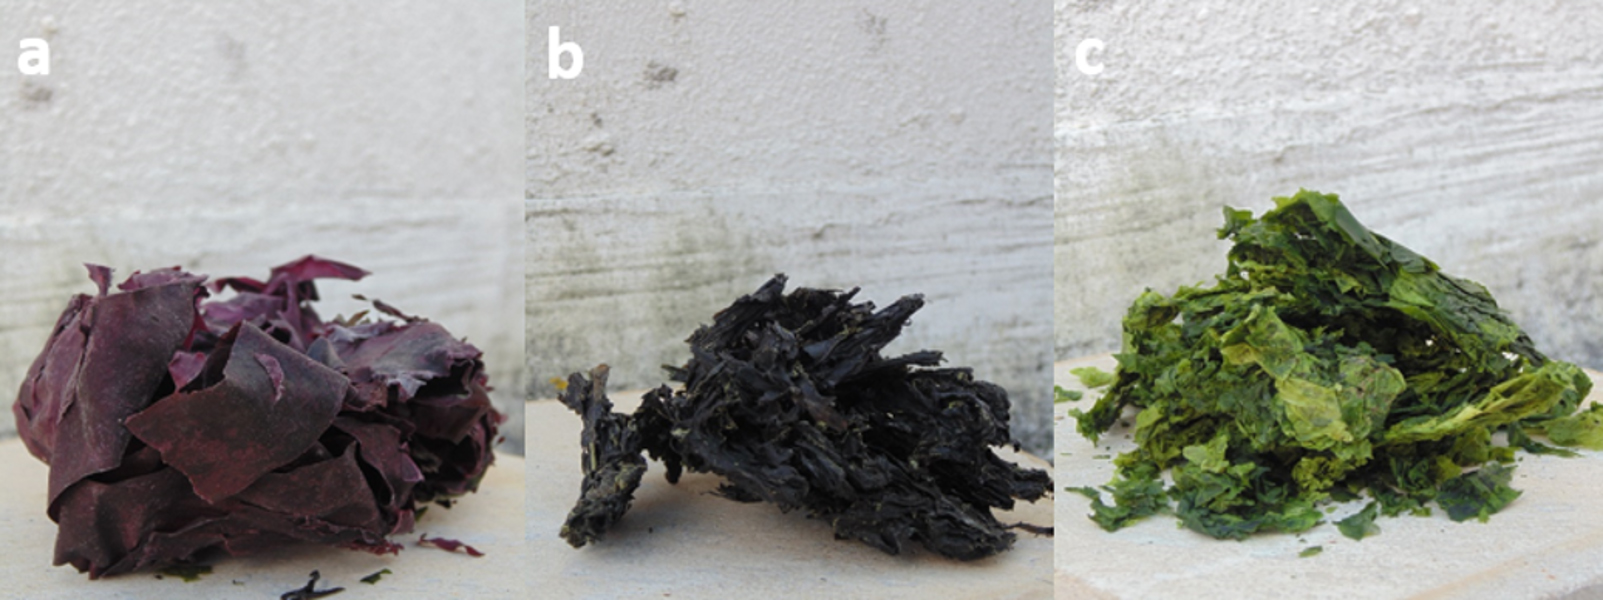
 μ , 180 × 300 mm, PA/PE, Azkoitia, Spain) and stored at –18 °C until further use.

Fig. 1.

Representative images of red seaweeds (Rodophyta) and green seaweed (Clorophyta). (a) Dehydrated seaweed Dulse (Palmaria palmata). (b) Dehydrated seaweed Nori (Porphyra sp.). (c) Dehydrated seaweed Sea lettuce (Ulva sp.).

2.2 Proximate Composition
2.2.1 Moisture Content

The moisture content (MC) was determined gravimetrically by measuring sample (3 g) weight loss at 105 °C in a drying oven (Termaks AS® TS 9135, Bergen, Norway) until constant weight (typically 24 h). Three measurements (replicates) were made on each sample. MC was calculated by using the Eqn. 1:

(1) MC = W 1-W 2 W 1 × 100

where W 1 is the weight (g) of the sample before drying, and W 2 is the weight (g) of the sample after drying. MC was expressed as a percentage of dry weight (% D.W.).

2.2.2 Ash Content

The ash content (AC) was assessed gravimetrically in triplicate by determining sample (3 g) weight loss in a laboratory muffle furnace (LV 15/11/P320, Nabertherm GmbH, Bremen, Germany), at 550 °C until constant weight. The AC was quantified as the residue from combustion expressed as a percentage of dry weight (% D.W.).

2.2.3 Total Lipids

The gravimetric assay was adapted from the method previously described by Kumari et al. [16]. Briefly, to 500 mg of dry seaweed powder 3.0 mL of a mixture of chloroform/methanol/50 mM phosphate buffer pH 7.4 (Honeywell, Germany; Fisher Scientific, UK) in the proportions of 2:1:0.8, v/v/v was added, vortexed for about 1 min and centrifuged (Domel, Centric 150, Slovenia) at 2057 × g for 15 min at room temperature. Next, the supernatants were collected and the residues were re-extracted three times with 2.0 mL of chloroform/methanol/buffer (1:1:0.8, v/v/v), and centrifuged as before. All the supernatants were combined, filtered, and washed with 2.0 mL of 50 mM phosphate buffer, and centrifuged at 2057 × g for 5 min. Finally, the lower organic phase was collected and dried under a regular nitrogen flow. The total lipids content was determined gravimetrically and expressed as % of dry weight. NIST Standard Reference Material® 3232 - Kelp powder (Thallus laminariae) was used to validate the methodology and results.

2.2.4 Crude Protein

Crude protein content was determined using an FP-528 combustion N analyser (LECO Corporation, St. Joseph, MI, USA). Briefly, 100 mg of each sample is placed into the loading head of the analyser, where it is sealed and purged of any atmospheric gases. Thereafter, the sample is dropped into a hot furnace and flushed with pure oxygen for very rapid combustion, being covalently bound nitrogen (N) converted into nitrogen gas (N 2 ). The N 2 content was detected by passing the gas through a thermal-conductivity cell. An air blank was carried out and the calibration standard curve was performed with ethylenediaminetetraacetic acid (EDTA) (LECO 502-896, St. Joseph, MI, USA). Protein values were calculated as N × 5.00 conversion factor [17], allowing estimating the protein content of seaweeds more accurately, based on the protein N fraction. Analyses were performed (n = 4) and the results were expressed as a percentage of dry weight (% D.W.).

2.2.5 Total Carbohydrates

The assay was carried out according to the procedure previously described by Kostas et al. [18]. In brief, 30 mg of each sample were added to 15 mL centrifugal tubes (Deltalab, Barcelona, Spain). Then, 1 mL of 11 M sulfuric acid (Honeywell International Inc., Germany) was added to each tube and incubated at 37 °C for 1 hour on a digital dry bath (AccuBlock™, Labnet International, Inc., NJ, USA). Next, 10 mL of deionized water was added to each tube to have a final acid concentration of 1 M, followed by new incubation (100 °C for 2 h). Afterward, 50 μ L of glucose standards (Merck, Germany), ranging from 0 to 1000 μ g/mL, or samples were transferred to new centrifuge tubes. Then, 500 μ L of 4% w/v phenol (TCI Europe N.V., Zwijndrecht, Belgium) followed by 2.5 mL of 96% sulfuric acid were added into each tube. Finally, 230 μ L of standard or sample were added into the wells of a 96-well microplate (Greiner Bio-One 96 well UV-Star®, Austria). The absorbance was measured at 490 nm in a microplate reader (BioTek Synergy™, HTX Multi-Mode Reader, USA). Results were expressed as % of dry weight.

2.3 Seaweeds Chemical Analysis
2.3.1 pH Determination

The seaweed samples (10 g each) were homogenized with 50 mL of distilled water and the pH was determined in triplicate using a digital pH meter (Nahita Model 903, Auxilab S.L., Beriáin, Spain) equipped with a glass electrode (XS Sensor Food S7, XS Instruments, Carpi, Italy) and each sample was measured in triplicate.

2.3.2 Fatty Acids Methyl Esters (FAMEs)

Seaweed fatty acids methyl esters (FAMEs) were prepared according to the methodology previously described by Kumari et al. [16]. Briefly, to 500 mg of powdered dried sample was added a mixture of 5 mL of acetyl chloride (Sigma-Aldrich®, Germany) and methanol (Fisher Scientific, UK) reagent in a ratio of 1:19 (v/v), spiked with 10 μ L of an internal standard solution (1 mg/mL, C11:0 FAME (Sigma-Aldrich®, Germany)/C13:0 TAG (Sigma-Aldrich®, USA) in n-hexane (Merck KGaA, Germany)). The solution was esterified at 80 °C for 1 hour and then left at room temperature for cooling. Next, 1 mL of water and 2 mL of n-hexane were added to the mixture, vortexed, and centrifuged at 2057 × g for 5 min. The organic phase was collected, filtered, and dried using anhydrous sodium sulfate (Honeywell, Germany). Finally, solvents were later removed under a nitrogen flow and methyl esters were solubilized in 190 μ L of n-hexane for GC-MS analysis.

2.3.3 GC-MS Analysis

Gas chromatography-mass spectrometry (GC-MS) analysis of FAMEs was carried out on a GC-MS 6850 coupled with 5975C VL MSD (Agilent Technologies, Santa Clara, EUA), equipped with an autosampler G45134A (Agilent Technologie, Santa Clara, USA), using a non-polar fused silica capillary column, 30 m, 0.25 mm ID, 0.25 μ m d f (Agilent J&W HP-5ms, Agilent Technologies, Santa Clara, USA). Helium (99.9% purity) was used as the carrier gas with a column flow rate of 1 mL/min. The initial column temperature regime was 80 °C, followed by a 4 °C/min ramp-up to 200 °C, followed by a 1 °C/min ramp-up to 215 °C for 5 min, followed by a 12 °C/min ramp to 308 °C for 0.25 min. The injection volumes were 1 μ L and the temperature was 290 °C. The split ratio was 1:15. FAME peaks were identified by comparison of their retention times (RT) with standard FAMEs (Supelco® 37 Component FAME Mix, Merck KGaA, Germany). The relative abundance was calculated through the peak areas, where the sum of areas represented 100%.

2.3.4 Elemental Analysis

The seaweed samples were digested and analysed according to a procedure previously described by US EPA [19]. Briefly, 250 mg was weighed and digested in 5 mL concentrated nitric acid 65% (Merck, KGaA, Germany) and 1 mL of hydrochloric acid 37% (Honeywell, Germany), for 48 h using 15 mL Falcon tubes (DeltaLab, Spain). Therefore, the mixture was placed in a fluoropolymer PFA (perfluoroalkoxy alkanes) microwave vessel, sealed, and heated in a microwave until complete digestion.

After cooling, 100 μ L of hydrogen peroxide 30% (Sigma-Aldrich®, Germany) were added to samples, which were next vortexed, filtered, and then diluted to a final volume of 10 mL before analysis. Serial blanks were prepared under the same digestion conditions.

Elemental analysis was performed by Inductively Coupled Plasma-Atomic Emission Spectrometry (ICP-AES) using an Ultima (Horiba Jobin Yvon, France) model. A calibration curve was made for each element. Major mineral elements were expressed as grams per kilogram of dry weight (g kg - 1 D.W.) and trace elements expressed as milligrams per kilogram of dry weight (mg kg - 1 D.W.). The methodology was validated by analysing certified reference materials (CRMs) from the National Institute of Standards and Technology (NIST) through Kelp powder (Thallus laminariae) Standard Reference Material® (CRM) 3232.

2.4 Seaweeds Microbial Load

Samples were prepared in a horizontal laminar airflow cabinet (Aeolus H, Telstar®, Terrasa, Spain) for the purposes of microbial analysis. Each sample (10 g or 25 g) was weighed (Radwag®, Model PS 450/X, Bracka, Poland), taken aseptically, and placed in a BagLight PolySilk sterile blender bag (Interscience, Saint-Nom-la-Bretèche, France) and homogenized with 90 mL of quarter-strength Ringer’s solution (Biokar Diagnostics, France) at room temperature. After 90 s in a stomacher apparatus (BagMixer® 400 P, Interscience, Saint-Nom-la-Bretèche, France), appropriate serial dilutions in sterile ¼ strength Ringer solution were spread-plated (100 μ L) or dispersed by pour plate method (1 mL) in Petri dishes Ø90 mm (Frilabo; Maia, Portugal).

Aerobic mesophilic bacteria (AMB) were determined on plate count agar (PCA; Biokar Diagnostics, France), and lactic acid bacteria (LAB) on De Man, Rogosa & Sharpe agar (MRS broth; Biokar Diagnostics, France), acidified to a final pH of 5.4 ± 0.1 with acetic acid (Sigma-Aldrich®, Germany). Both parameters were incubated at 30 °C for 72 h in a MIR-154-PE cooled incubator (Panasonic, Osaka, Japan). Enterococcus was determined on Compass® Enterococcus agar (Biokar Diagnostics, France) with plates incubated at 44 °C for 24 h. Coliforms and Esherichia coli were enumerated on Compass® ECC agar (ECC; Biokar Diagnostics, France), incubated at 37 °C and 44 °C, respectively, for 24 h, and coagulase-positive staphylococci (Staphylococcus aureus) were cultured on Baird-parker RPF agar (BP; Biokar Diagnostics, France) incubated at 37 °C for 48 h.

Yeasts and moulds were grown on chloramphenicol glucose agar (CGA; Biokar Diagnostics, France) after incubation at 25 °C for 5 days. Marine bacteria were determined on marine agar (Condalab, Madrid, Spain) and incubated at 20–25 °C for 72 h. Salmonella spp. was enumerated on Buffered Peptone Water (BPW), Rappaport-Vassiliadis Soja (RVS) Broth (RAP), Muller-Kauffmann Tetrathionate-Novobiocin (MKTTN) broth, Xylose Lysine Desoxycholate (XLD) agar, and Brilliant Green Agar (BGA) (Biokar Diagnostics, France). Listeria monocytogenes were enumerated on Half-Fraser Broth, Fraser Broth, and Palcam Agar (Biokar Diagnostics, France), both incubated at 37 °C for 5 days. The results were expressed as the logarithm of colony-forming unit per gram of sample (Log CFU . g - 1 ).

2.5 Statistical Analysis

Statistics were carried out using the non-parametric Mann–Whitney U test to assess for any significant differences, since statistical assumptions were not met to perform parametric tests. In all cases, the criterion for statistical significance was p < 0.05. All statistical analyses were carried out using the statistical software STATISTICA (STAT. version 8.0, StatSoft Inc. Tulsa, OK, USA). All data were expressed as mean ± standard deviation (SD) (n = 3) unless stated otherwise and reported on a dry matter basis.

3. Results and Discussion
3.1 Proximate Composition
3.1.1 Moisture Content

In the analysed seaweeds, MC ranged from 9.7 ± 0.02% in P. palmata, to 13.0 ± 1.95% in Porphyra sp. While, in C. crispus MC was 12.2 ± 0.04% and in Ulva sp. was 11.2 ± 0.04% (Table 1). The statistical analyses revealed significant differences (p = 0.0495) among all samples, except for C. crispus vs Porphyra sp. (p = 0.5127) (Supplementary Table 1). The findings are in close agreement with data previously reported by Mohammed et al. [20] on P. palmata (10.0 ± 0.41%). The same authors reported a lower value for Porphyra umbilicalis (8.9 ± 0.16% D.W.) when compared to this study, with both seaweeds obtained from a commercial supplier (Wild Irish Seaweed, Co., Clare, Ireland). In addition, some authors [21] reported a similar MC for Ulva lactuca (10.6 ± 1.14% freeze-dried sample) in the northeast of Hong Kong (A-Ma Wan), whereas others [22] reported a slightly higher content, (14.9% w/w on dry basis) for U. lactuca collected from the coastal waters of Monastir (Tunisia).

Table 1.Proximal composition (mean ± SD). Composition in edible seaweeds (Irish moss (Chondrus crispus), Dulse (Palmaria palmata) Nori (Porphyra sp.), and Sea lettuce (Ulva sp.).
Proximal composition Seaweeds
Chondrus crispus Palmaria palmata Porphyra sp. Ulva sp.
Moisture (% D.W.) 12.2 ± 0.04 9.7 ± 0.02 13.0 ± 1.95 11.2 ± 0.04
Ash (% D.W.) 26.0 ± 0.31 25.7 ± 0.12 13.9 ± 0.10 25.5 ± 0.09
Lipids (% D.W.) 1.7 ± 1.92 1.6 ± 1.81 1.8 ± 0.60 2.3 ± 3.22
Proteins (% D.W.) 15.7 ± 0.17 14.4 ± 0.87 23.7 ± 0.18 15.6 ± 0.13
Carbohydrates (% D.W.) 32.5 ± 1.18 34.0 ± 2.23 19.8 ± 0.92 31.0 ± 1.37
Values presented as mean ± SD (n = 3); except for proteins (n = 4).
3.1.2 Ash Content

The AC ranges from 13.9 to 26.0% D.W. (Table 1), showing a significant difference among all samples (p = 0.0495) except between C.crispus vs P. palmata (p = 0.2752) (Supplementary Table 1). Similar values to C. crispus (~26%) were found by Rupérez and Saura-Calixto [23] in samples from Algamar C.B., Redondela, Pontevedra, Spain (21.4 ± 0.14% D.W.), and by others [24] from samples collected in the Swedish west coast (27.2% D.W.). Other authors [20] reported a similar AC to P. palmata (25.6 ± 0.67% D.W.) harvested off the coast of Co. Clare in Ireland. However, Sánchez-Machado et al. [25] and Mæhre et al. [26] reported a higher AC of 34.0% D.W., and 42.2% D.W., respectively, to the same seaweed.

Concerning Porphyra sp., Cofrades et al. [27] found a similar value (11.7% D.W.) for the sample supplied by Algamar C.B. (Redondela, Pontevedra, Spain). While others showed slightly higher values of Porphyra sp. (P. tenera and P. umbilicalis) from different regions of Europe, ranging from 17.2 to 28.2% D.W. [20, 23, 25, 28].

The AC of Ulva sp. (25.5% D.W.) was higher than that reported by Wong and Cheung [21] and Yaich et al. [22] for U. lactuca, namely, 21.3% D.W., and 19.6 w/w % D.W., respectively. In addition, in this study, the AC content of the Ulva sp. was lower when compared to U. lactuca from the West Algerian coast (27.1% fresh alga) [29], and seaweeds off the coast of Norway (29.3% D.W.) [26]. As noted previously, the AC can vary widely between species, geographical regions, and even between seasons [30]. The high AC are an important feature of seaweeds, and generally are much higher than those observed in terrestrial plants [3, 25, 30, 31].

3.1.3 Total Lipids

The total lipid content of the seaweeds ranges from 1.6 to 2.3% D.W. (Table 1), showing significant differences (p = 0.0495) among samples (C. crispus vs Ulva sp., P. palmata vs Ulva sp., and Porphyra sp. vs Ulva sp.) (Supplementary Table 1). Most seaweeds show a very low lipid content ranging from 0.3–7.0% D.W. [30, 32, 33], thus being a low source of nutritional energy when compared with some plant vegetables such as soy or sunflower [34]. Similar results were reported for C. crispus (0.7–2% D.W.) and Porphyra spp. (1.3–2.3% D.W.) by Soares et al. [35]. Other researchers such as Mæhre et al. [26] reported 2.6% D.W. for Ulva lactuca, a value that is in agreement with those found in the present study. As described by Soares et al. [35], in most cases commercial seaweeds show higher values than wild seaweeds. According to some authors the lipid content of seaweeds can vary according to species, geographical location, climate, and environmental conditions such as temperature, light intensity, salinity, and nutrient content of the growth medium and either to species types and/or a combination of these factors [28, 36, 37].

3.1.4 Crude Protein

Protein is a major factor when assessing the health benefits of a food product [26]. It is an important source of sulfur (S) and nitrogen (N), essential components of organisms that are not produced in the human body, being also essential precursors for the synthesis of several biomolecules [38]. Given an N-to-protein conversion factor of 5, the total protein content in the samples studied was estimated between 14.4 and 23.7% D.W. (Table 1). Statistical analyses revealed significant differences among all seaweeds (p = 0.0180), except for C. crispus vs Ulva sp. (p = 0.2367) (Supplementary Table 1), which is within the range reported by Sánchez-Machado [25] for seaweeds collected on the northwest Iberian coast, and also by Paiva et al. [28] for seaweeds collected in the Azores Archipelago. Some authors reported higher values for C. crispus (20.9% D.W.) and Porphyra (29.8% D.W.) [23] for commercial seaweeds (Algamar C.B., Redondela, Pontevedra, Spain).

Concerning P. palmata, its total protein content is in the range of 8–35%, with most typical values around 20% [39]. In general, protein content differs widely across groups of seaweeds [40], and this can be explained through variances attributed to different species, environmental factors, or a combination of both [28, 30, 41], or even by methodological differences [26].

Seaweeds, especially the red seaweeds, appear to be an interesting potential source of food proteins as demonstrated by some authors [30, 42]. Some of them, especially Porphyra spp. have a protein content higher than those found in high-protein pulses such as soybean [20, 23, 25]. In general, specific seaweeds present higher protein contents than some grains such as rice (7.1%), corn (9.4%), oats (13.4%), or even wheat (13.8%) [28].

3.1.5 Total Carbohydrates

Carbohydrates comprise 50–60% of the dry weight of seaweeds [43]. The carbohydrate content (CC) of the seaweeds analysed in this study ranged from 19.8–34.0% D.W. (Table 1), making it the largest constituent on a dry weight basis, the only exception is Porphyra sp. In general, the values encountered for CC are out of the range of values reported by several authors in red seaweeds [24, 28, 43]. Statistical analyses showed significant differences between C. crispus vs Ulva sp., P. palmata vs Ulva sp., and Porphyra sp. vs Ulva sp. (p = 0.0495) (Supplementary Table 1). Concerning Ulva sp., the values observed were higher than those reported by El-Said and El-Sikaily [44] for seaweeds collected along the Egyptian Mediterranean coast, where concentrations in Ulva lactuca varied from 10.2–11.5% D.W. However, Olsson and Albers [24] reported a CC to U. lactuca (34.7% D.W.) and to U. intestinalis (36.7% D.W.) collected on the Swedish west coast comparable to those found in the present study. According to some authors, the seaweed’s carbohydrate synthesis is related to periods of maximum growth, increased rates of photosynthetic activity, and a reduction in protein contents [28, 45, 46].

In this study, only Porphyra sp. presents an inverse relationship between protein and carbohydrates; a pattern observed for several species of seaweeds [46]. The carbohydrate synthesis is favoured by light intensity, temperature, and decrease of nitrogen, while for the proteins these parameters are inversely related [46, 47].

3.2 Seaweeds Chemical Properties
3.2.1 pH Determination

The pH values ranged from 6.2 ± 0.02 in Porphyra sp. to 7.3 ± 0.04 in C. crispus (Table 1). Analyzed samples show significant differences (p = 0.0495) among them, except for P. palmata vs Ulva sp. and Porphyra sp. vs Ulva sp. (p = 0.5123) (Supplementary Table 2).

The variation in pH values can be important since pH is indicative of enzymatic or microbiological activity linked to quality, freshness and safety of foods [48]. It is also a factor of great importance for the storage of the product before further use [49]. For instance, pH linked to other parameters such as the percentage of exudate and changes in colour and texture indicate a loss of seaweed freshness associated with the increase in micro-organisms [48, 50]. The results obtained in the present study are close to neutral and, therefore, makes seaweeds potentially vulnerable to microorganisms [48].

3.2.2 Fatty Acid Methyl Esters (FAMEs)

The results of FAMEs are shown in Table 2. As can be seen, the species variability is quite evident in the FAMEs composition. These variations could be due to genetic differences among species, as well as other abiotic factors (e.g., light, salinity, and nutrients) [25, 31]. On other hand, variations can also be due to factors such as environmental and seasonal conditions at the time of planting and harvesting [51, 52].

Table 2.Fatty acid methyl esters (FAMEs). Composition in edible seaweeds (Iris moss (Chondrus crispus), Dulse (Palmaria palmata) Nori (Porphyra sp.) and Sea lettuce (Ulva sp.)).
Fatty acids (FAMEs) Group Abbrev. Seaweeds
Chondrus crispus Palmaria palmata Porphyra sp. Ulva sp.
C14:0 SFA MA 6.6 ± 0.01 18.3 ± 1.35 0.5 ± 0.08 0.9 ± 0.02
C16:0 SFA PA 43.9 ± 0.19 62.1 ± 0.22 41.9 ± 4.46 43.8 ± 0.85
C16:1 MUFA PLA 1.1 ± 0.00 0.7 ± 0.07 1.6 ± 0.24 3.9 ± 0.03
C18:0 SFA SA 1.2 ± 0.03 5.8 ± 0.28 0.8 ± 0.11 0.9 ± 0.10
C18:1 MUFA OL 1.0 ± 0.05 5.7 ± 0.40 1.4 ± 0.16 14.8 ± 0.22
C18:1 MUFA EA 9.9 ± 0.03 1.6 ± 0.18 4.3 ± 0.53 11.9 ± 0.25
C18:2 PUFA LA 1.3 ± 0.03 0.8 ± 0.01 2.8 ± 0.38 3.2 ± 0.06
C18:3 PUFA GLA n.d. n.d. 0.4 ± 0.07 0.4 ± 0.18
C18:4 PUFA SDA n.d. n.d. n.d. 14.9 ± 0.33
C20:0 SFA AA n.d. n.d. n.d. 0.3 ± 0.04
C20:3 PUFA DGLA 0.6 ± 0.08 n.d. 8.1 ± 1.89 n.d.
C20:4 PUFA ETA n.d. n.d. n.d. n.d.
C20:4 PUFA ARA 20.7 ± 0.05 0.97 ± 0.59 8.8 ± 4.43 0.6 ± 0.00
C20:5 PUFA EPA 13.8 ± 0.02 4.2 ± 1.32 29.4 ± 3.49 0.7 ± 0.01
C22:0 SFA BA n.d. n.d. n.d. 3.8 ± 0.04
ΣSFA 51.6 ± 0.16 86.2 ± 1.41 43.2 ± 4.65 49.7 ± 1.34
ΣMUFA 12.0 ± 0.12 7.9 ± 0.72 7.3 ± 0.94 30.6 ± 1.23
ΣPUFA 36.4 ± 0.11 5.9 ± 2.71 49.5 ± 7.90 19.7 ± 0.66
ΣUFA 48.4 ± 0.16 13.8 ± 1.41 56.8 ± 4.65 50.3 ± 1.34
PUFA/SFA 0.7 0.06 1.14 0.4
PUFA ω-6 22.63 ± 0.09 1.72 ± 0.85 20.08 ± 2.96 4.2 ± 0.33
PUFA ω-3 13.80 ± 0.02 4.19 ± 1.86 29.38 ± 4.94 15.6 ± 0.99
Ratio ω-6/ω-3 1.64 0.41 0.68 0.27
Results expressed as a percentage of total fatty acid analysed. Values are given as mean ± SD (n = 4). AA, Arachidic acid; ARA, Arachidonic acid; BA, Behenic acid; DGLA, Dihomo- γ -linolenic acid; EA, Elaidic acid; EPA, Eicosapentaenoic acid; ETA, Eicosatetraenoic acid; GLA, γ -linolenic acid; LA, Linoleic acid; MA, Myristic acid; MUFAs, Monounsaturated fatty acids; OL, Oleic acid; PA, Palmitic acid; PLA, Palmitoleic acid; PUFAs, Polyunsaturated fatty acids; SA, Stearic acid; SFAs, Saturated fatty acids; SDA, Stearidonic acid; TFAs, Trans fatty acids; n.d., not detectable.

The saturated fatty acids (SFAs) were the most abundant FA, ranging from 43.2 to 86.2% of the total FA for the Porphyra sp. and P. palmata, respectively. These results agree with studies previously reported by Mæhre et al. [26], who found that SFAs were the main FA in seaweeds. The statistical analyses revealed significant differences among all samples (p = 0.0180) (Supplementary Table 3).

Concerning unsaturated fatty acids (UFAs), significant differences were observed among all seaweeds (p < 0.05), except in C. crispus vs P. palmata and P. palmata vs Porphyra sp. (p = 0.0565) (Supplementary Table 3). The values ranged from 13.8% for P. palmata to 56.8% for Porphyra sp., with the highest average values belonging to eicosapentaenoic acid (EPA, C20:5, ω -3-cis) in Porphyra sp. (29.4%), followed by arachidonic acid (ARA, C20:4, ω -6-cis) in C. crispus (20.7%). In general, red seaweeds are particularly rich in FA with 20 carbon atoms [51] and contain essential fatty acids (EFA) pivotal for numerous metabolic processes [53]. MUFA’s and PUFA’s show significant differences among all seaweeds (p = 0.0180) (Supplementary Table 3). Therefore, the higher sum of MUFA content occurs in Ulva sp. (30.6% of total FA), while the highest PUFA content was determined in Porphyra sp. (49.5% of total FA). The most abundant PUFA in red seaweeds (P. palmata and Porphyra sp.) and green seaweeds (Ulva sp.) were found to be ω -3, which accounted for 71.0%, 59.4%, and 78.8% of total PUFAs, respectively. In fact, although the fat content is low among seaweeds, 20–50% of their total FA content consists of long-chain ω -3 PUFAs [51]. This is specially the case of red seaweeds, where lipid content is very low (1–5%) [52].

Concerning PUFA ω -3 and ω -6, significant differences were observed among all seaweeds (p = 0.0180). Stearidonic acid (SDA, C18:4, ω -3-cis) presents significant differences between C. crispus vs Ulva sp., P. palmata vs Ulva sp., and Porphyra sp. vs Ulva sp. (p = 0.0126) (Supplementary Table 3), since only the green seaweed Ulva sp. presents stearidonic acid (SDA, C18:4, ω -3-cis) (14.9%), which accounted for 95.5% of total ω -3 PUFAs bioactive compounds. Eicosapentaenoic acid (EPA) shows significant differences among all seaweeds (p = 0.0180) (Supplementary Table 3). The higher concentration was determined in Porphyra sp. (29.4%), accounting for 100% of total ω -3 PUFAs, which is in agreement with Cofrades et al. [3]. C. crispus also presents a considerable value of EPA (13.8%). P. palmata and Ulva sp. contain fewer proportions of EPA (4.2 and 0.7, respectively). No eicosatetraenoic acid (ETA, C20:4, ω -3, cis) was found in any of the specific seaweeds.

Concerning to ω -6 PUFAs, linoleic acid (LA, C18:2, ω -6, cis) show significant differences among all samples (p = 0.0180), except in Porphyra sp. vs Ulva sp. (p = 0.2367).

Unlike ω -3 PUFAs, proportions of ω -6 PUFAs were high in C. crispus (22.6%) and Porphyra sp. (20.1%), particularly in arachidonic acid (ARA, C20:4, ω -6, cis), totalling 91.6% and 43.8% of total ω -6 PUFAs, respectively. Pairwise ARA comparisons show significant differences among samples (p = 0.0180) except in P. palmata vs Ulva sp. (p = 1.0000). The seaweeds C. crispus and Porphyra sp. show a high concentration of EPA (C20:5, ω -3-cis) and low concentrations of linoleic acid (LA, C18:2, ω -6, cis). This outcome is in accordance with those reported by other authors [3, 54]. As mentioned by Cofrades et al. [3], the ratio of PUFA/SFA is one of the main parameters used to assess the nutritional quality of the lipid fraction of foods.

PUFA/SFA ratios presents significant differences among all seaweeds (p = 0.0180) (Supplementary Table 3), and values ranged from 0.4 to 1.14, which is in accordance with the nutritional guidelines recommendations ( > 0.4) [55]. The adequate balance of the two classes of PUFAs ( ω -3 and ω -6) is of major importance for normal growth and development [56]. In this regard, it is recommended to reduce their ratio to less than 4.0, which implies increasing the ω -3 fatty acids in the diet, mainly by consuming long-chain fatty acids and/or reducing ω -6 [3], to prevent inflammatory and cardiovascular diseases [35]. In this study, the ratio of ω -6/ ω -3 fatty acids show signigficant differences among all seaweeds (p = 0.0180) (Supplementary Table 3), ranging from 0.3 to 1.6, with the lowest ratio observed in Ulva sp. due to high amounts of stearidonic acid (SDA, C18:4, ω -3-cis), and the highest ratio observed in C. crispus due to high level of arachidonic acid (ARA, C20:4, ω -6-cis). A similar trend was reported by other authors [53]. This means that seaweeds can be useful to improve the lipid quality of foods [3], i.e., their introduction into diets may be beneficial from a nutraceutical viewpoint, since they provide EFA, and at the same time contribute to the lowering ratio of the ω -6/ ω -3 consumer’s diet [53].

3.2.3 Elemental Analysis

Seaweed content of macro minerals (calcium (Ca), potassium (K), magnesium (Mg), sodium (Na) and phosphorus (P)) and trace elements: (iron (Fe), and zinc (Zn)) are presented in Table 3 [57].

Table 3.Macro and trace elements and contribution to daily dietary intake and Reference Nutrient Intake (RNI). Contents for macrominerals and trace elements in each seaweed analysed (Irish moss (Chondrus crispus), Dulse (Palmaria palmata) Nori (Porphyra sp.), and Sea lettuce (Ulva sp.)).
Elements C. crispus P. palmata Porphyra sp. Ulva sp. C. crispus P. palmata Porphyra sp. Ulva sp.
Intake (g) RNI (%) Intake (g) RNI (%) Intake (g) RNI (%) Intake (g) RNI (%) Adults
Fe (mg kg - 1 DW) 143.3 ± 4.4 43.5 ± 8.4 86.4 ± 6.1 336.3 ± 15.5 1.2 8.1 0.4 2.7 0.7 4.7 2.7 18.2 1.7–14.8
Zn (mg kg - 1 DW) 71.1 ± 1.4 24.9 ± 2.1 46.1 ± 3.9 27.0 ± 1.5 0.6 6.3 0.2 2.1 0.4 4.2 0.2 2.1 7.0–9.5
P (g kg - 1 DW) 1.1 ± 0.0 1.2 ± 0.2 2.1 ± 0.1 1.8 ± 0.0 9.0 1.7 9.8 1.8 16.7 3.1 14.2 2.6 540
Ca (g kg - 1 DW) 4.2 ± 0.1 1.6 ± 0.4 1.6 ± 0.0 5.5 ± 0.2 33.8 4.8 12.4 1.8 12.8 1.8 43.7 6.2 700
K (g kg - 1 DW) 41.0 ± 2.4 124.8 ± 6.9 19.2 ± 0.5 21.8 ± 1.1 327.8 9.4 998.3 28.5 153.2 4.4 174.2 5.0 3500
Mg (g kg - 1 DW) 6.5 ± 0.1 2.5 ± 0.2 3.7 ± 0.2 55.8 ± 0.3 51.8 17.3 19.8 6.6 29.3 9.8 446.0 148.7 270–300
Na (g kg - 1 DW) 8.0 ± 0.0 4.5 ± 1.2 5.8 ± 0.1 5.4 ± 0.0 64.0 4.0 36.2 2.3 46.0 2.9 43.5 2.7 1600
Ratio Na/K 0.20 0.04 0.30 0.25 - - - - - - - - -
Ratio Ca/Mg 0.65 0.63 0.44 0.10 - - - - - - - - -
Values are presented as mean ± standard error (n = 3). Contribution to the dietary intake for the consumption of a usually consumed serving (8 g of dry seaweed) and RNI (Reference Nutrient Intake) in mg/day (Committee on Medical Aspects of Food and Nutrition Policy) [57].

In general, the mineral content of seaweeds is relatively higher than that of the most edible land plants [58]. C. crispus showed the higher content in Na (8.0 ± 0.03 g kg - 1 ) and Zn (71.1 ± 1.40 mg kg - 1 ), and P. palmata the higher content in K (124.8 ± 6.9 g kg - 1 ); whereas Ulva sp. presented the higher content in Ca (5.5 ± 0.22 g kg - 1 ), Mg (55.8 ± 0.31 g kg - 1 ) and Fe (336.4 ± 15.51 mg kg - 1 ).

Sodium (Na) and potassium (K) were the most abundant elements among seaweeds. According to some authors, the contents of Na and K in Chlorophyta Ulva spp. tend to be lower when compared with red and brown seaweeds [59, 60]. Likewise, P. palmata collected in Portugal presents high amounts of K [59]. Sodium (Na) results showed significant differences among all samples (p = 0.0495) (Supplementary Table 4), and are not in agreement with data previously reported by other authors. For example, the results are lower for C. crispus with values 4–6 times below the values reported by Olsson and Albers [24] and Parjikolaei et al. [61]. The same was determined by several authors for Porphyra sp. in different seawaters over the world [20, 28, 62]. However, results comparable to those obtained in this study were determined by Larrea-Martín et al. [63] in Eastern Porphyra purchased in the Spanish local market (but imported from Asian countries), which registered 2.3 g kg - 1 DM (Koyo Food Ltd.: Kunga and Mitoku) and 6.5 g kg - 1 DM (Wesbrag Ltd.: Yang-Tse). This can be partially explained by the treatment of seaweeds in Asian countries [62, 63]. At the same time, it is relevant that Na content in Porphyra from Spain and France was about 10 times higher than those from Japan and Korea as reported by Larrea-Martín et al. [63].

Concerning K, significant differences were observed among all seaweeds (p = 0.0495) (Supplementary Table 4). Seaweeds contain a high content of K (higher than fruits or vegetables), which has been reported to protect against high blood pressure and other cardiovascular diseases when intake levels are high [3, 64]. Some seaweed accumulates more K than Na [44], which is quite evident in the present results, especially in C. crispus (41.0:8.0 g kg - 1 ) and P. palmata (124.8:4.5 g kg - 1 ).

Na/K ratio show significant differences among all seaweeds (p = 0.0495) (Supplementary Table 4). Altough when compared with other reports they show lower ratios [65]. However, it has been reported that a molar Na/K ratio of 1.0 in the diet may be more significant than the amount of each mineral [20, 66]. In this study, the Na/K ratios ranged from 0.04 for P. palmata, to 0.30 for Porphyra sp., which can be interesting from a nutritional viewpoint, since intakes of high Na/K ratios are closely linked to a higher incidence of hypertension [31, 67]. Therefore, low ratios of Na/K help to fight fluid retention and high blood pressure without the risk of disturbing the K balance [3, 20]. Furthermore, according to Rodrigues et al. [68] seaweeds with low ratios of Na/K have a good potential to be used as a salt replacer.

The mean P content ranged from 1.1 to 2.1 g kg - 1 , showing significant differences among all seaweeds (p = 0.0495), except for C. crispus vs P. palmata (p = 0.5123) (Supplementary Table 4). The results of P concentrations in Porphyra sp. concurred with those reported by Larrea-Martín et al. [63] in species from French waters (1.49 g kg - 1 ). The same authors pointed out that values are particularly high in seaweeds from Spain (5.60 g kg - 1 ), Korea (8.59 g kg - 1 ), and Japan (8.47 g k - 1 ). Also, Cardoso et al. [69] reported very similar values for C. crispus (1.4 g k - 1 ), Porphyra umbilicalis (2.4 g k - 1 ), and to U. rigida (2.1 g k - 1 ) in the Iberian Peninsula.

The present results of Mg show significant differences among all samples (p = 0.0495). Values of red seaweeds range from 2.5 to 6.5 g kg - 1 . Notably, this mineral was particularly accumulated by green seaweed Ulva sp. (55.8 ± 0.31 g kg - 1 ), which is in agreement with results reported by Neto et al. [1] in Ulva rigida (37.6 g kg - 1 ) (ALGAplus Lda., Aveiro, Portugal). As reported by Milinovic et al. [65], usually the Mg content is high in Chlorophyta, most likely due to higher levels of chlorophylls. In fact, this great ability of green seaweeds to accumulate Mg is well known [59].

Even seaweeds with lower levels of Mg, such as Porphyra sp. (3.7 ± 0.15 g kg - 1 ) contain 33 times more Mg than whole milk, and up to 14 times more than Cheddar cheese [28]. This can be important since an Mg deficiency in humans is common and consequently linked to chronic diseases [20]. Therefore, seaweed can be a significant source of Mg for humans when incorporated into foods.

The seaweeds analysed in this study can contribute 6.6–17.3% of the Mg RNI (Reference Nutrient Intake) for adults. With the exception of Ulva sp. with a supra-high percentage of almost 150%.

Calcium (Ca) content differed significantly among all seaweeds (p = 0.0495), except in P. palmata vs Porphyra sp. (p = 0.5123) (Supplementary Table 4). The lowest mean Ca concentration (1.6 g kg - 1 ) was detected in P. palmata, while the highest mean Ca concentration was determined in Ulva sp. (5.5 g kg - 1 ). It is worth highlighting that the Ca/Mg ratio is also relevant with respect to Ca absorption since a deficient Mg intake can result in an immoderate accumulation of Ca in soft tissues, thus leading to some disorders such as the formation of kidney stones and the occurrence of arthritis [59]. Concentrations of Ca measured in the present work were close to those reported by MacArtain et al. [70] for P. palmata (1.5 g kg - 1 ) and C. crispus (3.7 g kg - 1 ) and higher than values determined in Porphyra umbilicalis (0.3 g kg - 1 ) and Ulva spp. (3.3 g kg - 1 ). Milinovic et al. [65] reported similar values in Ulva sp. (6.9 g kg - 1 ) and Porphyra sp. (2 g kg - 1 ). In fact, it is known that seaweeds accumulate higher levels of Ca than terrestrial foodstuffs [70].

Iron (Fe) was the trace element with the highest concentration detected in the analysed seaweeds, ranging from 43.5 to 336.4 mg kg - 1 . The statistical analyses revealed significant differences among all seaweeds (p = 0.0495) (Supplementary Table 4). Similar values were also reported by Milinovic et al. [65]. Interestingly, minerals such as Fe are present in seaweeds at higher levels than in some well-known terrestrial sources such as sirloin steak (1.6 mg/100 g), spinach (2.1 mg/100 g), or even brown rice (12.9 mg/100 g) [70]. Since a deficiency in Fe is one of the most prevalent nutritional disorders worldwide [71], seaweeds, namely the species from the present study, may contribute to 1.2–2.4% of iron RNI in adults.

The Zn concentrations show significant differences between all samples (p = 0.0495) except for P. palmata vs Ulva sp. (p = 0.2752) (Supplementary Table 4), with C. crispus (71.1 ± 1.40 mg kg - 1 ) and Porphyra sp. (46.1 ± 3.87 mg kg - 1 ) having the highest levels. In general, our values agree with those determined by Rupérez [57] for C. crispus (71.4 mg kg - 1 ), but not for Porphyra (22.1 mg kg - 1 ). The seaweed species analysed in this study can contribute up to 6% of the RNI, such as in the case of C. crispus (0.6 mg/8 g), which can be interesting since Zn plays many important functions in the human body.

3.3 Seaweeds Microbial Load

Seaweeds are a highly perishable foodstuff, and because of their high moisture level, apart from a richness content in nutrients, are an excellent promotor of microbial growth [72]. In addition, several bacterial species, including Salmonella spp., Escherichia coli, Listeria spp., or Staphylococcus aureus could pose significant hazards, since microbial contamination can occur during the growth cultivation, harvest environment, or further processing as post drying handling [73, 74]. Microbial growth (Log CFU g - 1 ) of specific seaweeds is shown in Table 4.

Table 4.Microbiological parameters. Levels of Enterococcus, lactic acid bacteria (LAB), aerobic mesophylic bacteria (AMB), marine agar counts (MAC), glucose-yeast-peptone (GYP) moulds and yeasts, Escherichia coli and total coliforms, Staphylococcus aureus, Salmonella spp., and Listeria monocytogenes for microbial load in edible seaweeds (Irish moss (Chondrus crispus), Dulse (Palmaria palmata) Nori (Porphyra sp.) and Sea lettuce (Ulva sp.)).
Microbiological parameters (Log CFU·g - 1 ) Seaweeds
C. crispus P. palmata Porphyra sp. Ulva sp.
Enterococcus < 2 < 2 < 2 < 2
LAB < 2 < 2 < 2 < 2
AMB 4.3 ± 0.93 4.9 ± 0.15 4.5 ± 0.33 3.0 ± 0.15
MAC 4.9 ± 0.63 5.2 ± 1.76 4.7 ± 1.28 3.7 ± 0.15
GYP (Moulds) < 2 < 2 < 2 < 2
GYP (Yeasts) < 2 < 2 < 2 < 2
Escherichia coli 2.5 ± 0.00 < 1 < 1 1.0 ± 0.00
Total coliforms 3.0 ± 0.00 2.5 ± 0.00 2.0 ± 0.00 2.2 ± 0.00
Staphylococcus aureus < 2 < 2 < 2 < 2
Salmonella spp. Absent in 25 g Absent in 25 g Absent in 25 g Absent in 25 g
Listeria monocytogenes Absent in 25 g Absent in 25 g Absent in 25 g Absent in 25 g
Counts, expressed as Log CFU g - 1 , mean ± SD (n = 4).

Salmonella spp., a non-spore-forming Gram-negative bacteria, was not detected on any sample (not present per 25 g), prompting the conclusion that these results fit in the Portuguese guidelines on the application of general principles of food hygiene to the control of Salmonella spp. in ready-to-eat foods by INSA (Instituto Nacional de Saúde Doutor Ricardo Jorge) [75]. Listeria monocytogenes were not detected through plating count (not present per 25 g), which is in line with results obtained by Blikra et al. [76].

No significant differences were observed for Enterococcus (p = 1.000) (Supplementary Table 5). Enterococcus can be used as indicators of faecal contamination [77]. This genus can be present in heterogeneous habitats due to its capacity to grow under low water activity (a w ) conditions and over a relatively wide range of temperatures [78]. The results obtained were below the detection limit for all specific seaweeds ( < 2 Log CFU g - 1 ), contrary to what has been reported by Byappanahalli et al. [79] for the macro-alga Cladophora (Chlorophyta) along the shorelines of Lake Michigan (USA). According to these authors, seaweeds constitute a favorable substrate for the growth of this faecal indicator bacteria.

Concerning LAB, moulds, yeasts, and S. aureus, the values obtained do not exceed the limits of the food quality standards summarized by INSA [75]. Positive values for AMB were encountered in all seaweeds, with P. palmata (4.9 Log CFU g - 1 ) > Porphyra sp. (4.5 Log CFU g - 1 ) > C. crispus (4.3 Log CFU g - 1 ) > Ulva sp. (3.0 Log CFU g - 1 ). However, this is in accordance with the satisfactory microbiological quality standards ( < 10 6 ) from Banach et al. [73]. In general, these results are in line with those obtained by other researchers; namely to cultivated P. palmata (~3 Log CFU g - 1 ) originating from Bristol, ME, USA [80, 81] and wild P. palmata (5.1 Log CFU g - 1 ) originating from Cushendall, County Antrim, Northern Ireland, and as well for cultivated Ulva lactuca (4.9 Log CFU g - 1 ) originated from Izmir, Turkey [81].

Marine agar counts (MAC) ranged from 3.7 Log CFU g - 1 for Ulva sp. to 5.2 Log CFU g - 1 for P. palmata. The statistical analyses revealed significant differences among all seaweeds (p = 0.0180) (Supplementary Table 5). Similar values for C. crispus (4.2 ± 0.12 Log CFU g - 1 ) and Ulva lactuca (3.2 ± 1.16 Log CFU g - 1 ) were reported by Del Olmo et al. [82] in Coruna Province, North-western Spain, and for P. palmata (3.1–5.3 Log CFU g - 1 ) by Løvdal et al. [81]. As described by Del Olmo et al. [82], the maximum population counts were obtained on MAC, slightly higher than the respective counts on AMB for all seaweeds; a result which can be explained by the composition of marine agar medium (specially developed for the isolation and enumeration of heterotrophic marine bacteria), and eventually closer to natural habitat conditions of seaweed microbiota than that of PCA medium. For this reason, the assessment of viable counts seems to be more suitable using MAC than AMB.

Concerning E. coli, significant differences were detected between C. crispus vs Ulva sp. (p = 0.0082), P. palmata vs Ulva sp. and Porphyra sp. vs Ulva sp. (p = 0.0126) (Supplementary Table 5). Results indicate the absence or very low numbers of colonies ( < 1 to 1 Log CFU g - 1 ) in all seaweeds, except for C. crispus (2.5 Log CFU g - 1 ) revealing an unsatisfactory ( > 10 2 CFU g - 1 ) microbiological quality according to INSA [75]. Total coliforms ranged from 2 to 3 Log CFU g - 1 , showing significant differences among all seaweeds (p = 0.0180) (Supplementary Table 5). The results are at a borderline level (10 2 10 4 CFU g - 1 ), according to INSA [75].

4. Conclusions

The results of the present study indicate that the analysed seaweed species can be used as functional foods or food ingredients in many healthy low-fat foods to improve the nutritional quality and functionality of foods products, in general, enhancing a healthy balanced human diet.

Although there are studies with some similar results, the present study suggests that the composition and content of seaweeds varies, possibly according to several factors (e.g., season, geography, geological nature of the site). Thus, this study shows seaweeds with some distinctive features, mainly because they provide amounts of some compounds and elements different from those reported in other studies.

C. crispus, P. palmata, and Ulva sp., showed to be a rich source of minerals and trace elements with potential for use in sodium chloride replacement. On the other hand, seaweeds can serve as a food supplement to help meet the recommended adult daily intake (RDI) of several macro and trace elements, contributing with some elements that are normally scarce or even absent in some terrestrial foodstuffs and reducing the impact of some pathologies associated with the modern lifestyle. All seaweeds showed a very low lipid content, thus being a low source of nutritional energy. In the other seaweeds analysed, they showed a high-quality fat, comprising a relatively higher level of SFAs. Porphyra sp. and Ulva sp. were rich sources of UFAs, suggesting that they can be used to reduce the risk of cardiovascular disease. In addition, seaweeds, especially Porphyra sp., can be a protein-rich species compared to terrestrial foods, may be useful as a complementary source of dietary proteins for human nutrition. Overall, the results highlight the potential of using seaweeds as an alternative and sustainable source of proteins, but also elements (e.g., Mg, Zn, Fe) with benefits for human nutrition and industrial food processing. The microbiology analyses revealed that analysed seaweeds can be used as a raw material for food for human consumption. As a concluding remark, this study contributes to a comprehensive understanding of the use of available edible seaweeds available in the Portuguese food market but also in the European and global market.

Abbreviations

AC, ash content; AMB, aerobic mesophilic bacteria; BGA, brilliant green agar; BP, Baird-Parker; BPW, buffered peptone water; CAGR, compound annual growth rate; CFU, colony-forming unit; CGA, chloramphenicol glucose agar; CRMs, certified reference materials; DM, dry matter; D.W., dry weight; EDTA, ethylenediaminetetraacetic acid; FA, fatty acid; FAMEs, fatty acids methyl esters; GC-MS, gas chromatography-mass spectrometry; GYP, glucose-yeast-peptone; ICP-AES, inductively coupled plasma-atomic emission spectrometry; ID, internal diameter; IMTA, integrated multi-trophic aquaculture; LAB, lactic acid bacteria; MAC, marine agar counts; MC, moisture content; MKTTN, Muller-Kauffmann tetrathionate-novobiocin; MRS, de Man, Rogosa & Sharpe; NIST, national institute of standards and technology; PCA, plate count agar; PFA, perfluoroalkoxy alkanes; RNI, reference nutrient intake; RPF, rabbit plasma fibrinogen; RVS, Rappaport-Vassiliadis soja; SD, standard deviation; SFA, saturated fatty acid; TAG, triacylglycerides; UFA, unsaturated fatty acid; USD, US dollar; XLD, xylose lysine desoxycholate.

Author Contributions

The idea of research was suggested by MSD and PM. ER provided help and advice on experimental analysis of carbohydrates, fatty acids, lipids, and elemental analysis. Protein analysis was done by IM. MM-F provided help in microbiological assays. Statistical analysis and the experimental process were guided by BMC. The writing of the manuscript was done by BMC, MSD, PM and JPN. All authors contributed to editorial changes in the manuscript. All authors read and approved the final manuscript.

Ethics Approval and Consent to Participate

Not applicable.

Acknowledgment

Not applicable.

Funding

This research was performed under the Alga4food project funded by the European Maritime and Fisheries Fund and co-financed by the Operational Program MAR2020 in the field of Sustainable Development of Aquaculture in the domains of Innovation, Advice and Productive Investment – Innovation and knowledge Action, grant number MAR-01.03.01-FEAMP-0016 – Alga4Food. This research was also supported by the Applied Molecular Biosciences Unit (UCIBIO) and the Associate Laboratory for Green Chemistry (LAQV), both funded by national funds from FCT/MCTES (UIDB/04378/2020) and (UID/50006/2020), respectively, and co-financed by the ERDF under the PT2020 Partnership Agreement (POCI-01-0145-FEDER - 007265).

Conflict of Interest

The authors declare no conflict of interest.

References
[1]
Neto RT, Marçal C, Queirós AS, Abreu H, Silva AMS, Cardoso SM. Screening of Ulva rigida, Gracilaria sp., Fucus vesiculosus and Saccharina latissima as Functional Ingredients. International Journal of Molecular Sciences. 2018; 19: 2987.
[2]
Geada P, Moreira C, Silva M, Nunes R, Madureira L, Rocha CMR, et al. Algal proteins: Production strategies and nutritional and functional properties. Bioresource Technology. 2021; 332: 125125.
[3]
Cofrades S, López-Lopez I, Bravo L, Ruiz-Capillas C, Bastida S, Larrea MT, et al. Nutritional and Antioxidant Properties of Different Brown and Red Spanish Edible Seaweeds. Food Science and Technology International. 2010; 16: 361–370.
[4]
Arias-Echeverri JP, Zapata-Ramírez PA, Ramírez-Carmona M, Rendón-Castrillón L, Ocampo-López C. Present and Future of Seaweed Cultivation and its Applications in Colombia. Journal of Marine Science and Engineering. 2022; 10: 243.
[5]
Grand View Research. Commercial Seaweed Market Size, Share & Trends Analysis Report By Product (Brown Seaweeds, Red Seaweeds, Green Seaweeds), By Form, By Application, By Region, and Segment Forecasts, 2021–2028. 2022. Available at: https://www.grandviewresearch.com/industry-analysis/commercial-seaweed-market (Accessed: 2 April 2022).
[6]
Cai J, Lovatelli A, Gamarro EG, Geehan J, Lucente D, Mair G, et al. Seaweeds and microalgae: an overview for unlocking their potential in global aquaculture development, FAO Fisheries and Aquaculture Circular No. 1229. FAO: Rome, Italy. 2021.
[7]
Kleitou P, Kletou D, David J. Is Europe ready for integrated multi-trophic aquaculture? A survey on the perspectives of European farmers and scientists with IMTA experience. Aquaculture. 2018; 490: 136–148.
[8]
Rosa J, Lemos MFL, Crespo D, Nunes M, Freitas A, Ramos F, et al. Integrated multitrophic aquaculture systems – Potential risks for food safety. Trends in Food Science & Technology. 2020; 96: 79–90.
[9]
Machado M, Machado S, Pimentel FB, Freitas V, Alves RC, Oliveira MB. Amino Acid Profile and Protein Quality Assessment of Macroalgae Produced in an Integrated Multi-Trophic Aquaculture System. Foods. 2020; 9: 1382.
[10]
García-Poza S, Leandro A, Cotas A, Cotas J, Marques JC, Pereira L, et al. The Evolution Road of Seaweed Aquaculture: Cultivation Technologies and the Industry 4.0. International Journal of Environmental Research Public Health. 2020; 17: 6528.
[11]
van den Burg SWK, Dagevos H, Helmes RJK. Towards sustainable European seaweed value chains: a triple P perspective. ICES Journal of Marine Science. 2021; 78: 443–450.
[12]
Buschmann AH, Camus C, Infante J, Neori A, Israel Á, Hernández-González MC, et al. Seaweed production: overview of the global state of exploitation, farming and emerging research activity. European Journal of Phycology. 2017; 52: 391–406.
[13]
Guerrero S, Cremades J. Integrated Multi-trophic Aquaculture (IMTA): A sustainable, pioneering alternative for marine cultures in Galicia. Regional Government of Galicia, Regional Council of the Rural and Regional Maritime Environment: Vilanova de Arousa (Pontevedra), Spain. 2012.
[14]
Grote B. Recent developments in aquaculture of Palmaria palmata (Linnaeus) (Weber & Mohr 1805): cultivation and uses. Reviews in Aquaculture. 2017; 11: 25–41.
[15]
Nardelli AE, Chiozzini VG, Braga ES, Chow F. Integrated multi-trophic farming system between the green seaweed Ulva lactuca, mussel, and fish: a production and bioremediation solution. Journal of Applied Phycology. 2019; 31: 847–856.
[16]
Kumari P, Reddy CRK, Jha B. Comparative evaluation and selection of a method for lipid and fatty acid extraction from macroalgae. Analytical Biochemistry. 2011; 415: 134–144.
[17]
Angell AR, Mata L, de Nys R, Paul NA. The protein content of seaweeds: a universal nitrogen-to-protein conversion factor of five. Journal of Applied Phycology. 2015; 28: 511–524.
[18]
Kostas ET, Wilkinson SJ, White DA, Cook DJ. Optimization of a total acid hydrolysis based protocol for the quantification of carbohydrate in macroalgae. Journal of Algal Biomass Utilization. 2016; 7: 21–36.
[19]
US EPA. Method 3051A (SW-846): Microwave Assisted Acid Digestion of Sediments, Sludges, and Oils. United States Environmental Protection Agency: Washington, DC, USA. 2007.
[20]
Mohammed HO, O’Grady MN, O’Sullivan MG, Hamill RM, Kilcawley KN, Kerry JP. An Assessment of Selected Nutritional, Bioactive, Thermal and Technological Properties of Brown and Red Irish Seaweed Species. Foods. 2021; 10: 2784.
[21]
Wong KH, Cheung PCK. Nutritional evaluation of some subtropical red and green seaweeds: Part I ― proximate composition, amino acid profiles and some physico-chemical properties. Food Chemistry. 2000; 71: 475–482.
[22]
Yaich H, Garna H, Besbes S, Paquot M, Blecker C, Attia H. Chemical composition and functional properties of Ulva lactuca seaweed collected in Tunisia. Food Chemistry. 2011; 128: 895–901.
[23]
Rupérez P, Saura-Calixto F. Dietary fibre and physicochemical properties of edible Spanish seaweeds. European Food Research and Technology. 2001; 212: 349–354.
[24]
Olsson J, Toth GB, Albers E. Biochemical composition of red, green and brown seaweeds on the Swedish west coast. Journal of Applied Phycology. 2020; 32: 3305–3317.
[25]
Sánchez-Machado DI, López-Cervantes J, López-Hernández J, Paseiro-Losada P. Fatty acids, total lipid, protein and ash contents of processed edible seaweeds. Food Chemistry. 2004; 85: 439–444.
[26]
Maehre HK, Malde MK, Eilertsen K, Elvevoll EO. Characterization of protein, lipid and mineral contents in common Norwegian seaweeds and evaluation of their potential as food and feed. Journal of the Science of Food and Agriculture. 2014; 94: 3281–3290.
[27]
Cofrades S, López-López I, Solas MT, Bravo L, Jiménez-Colmenero F. Influence of different types and proportions of added edible seaweeds on characteristics of low-salt gel/emulsion meat systems. Meat Science. 2008; 79: 767–776.
[28]
Paiva L, Lima E, Patarra RF, Neto AI, Baptista J. Edible Azorean macroalgae as source of rich nutrients with impact on human health. Food Chemistry. 2014; 164: 128–135.
[29]
Oucif H, Benaissa M, Ali Mehidi S, Prego R, Aubourg SP, Abi-Ayad SE. Chemical Composition and Nutritional Value of Different Seaweeds from the West Algerian Coast. Journal of Aquatic Food Product Technology. 2019; 29: 90–104.
[30]
Gómez-Ordóñez E, Jiménez-Escrig A, Rupérez P. Dietary fibre and physicochemical properties of several edible seaweeds from the northwestern Spanish coast. Food Research International. 2010; 43: 2289–2294.
[31]
Lorenzo JM, Agregán R, Munekata PES, Franco D, Carballo J, Sahin S, et al. Proximate Composition and Nutritional Value of Three Macroalgae: Ascophyllum nodosum, Fucus vesiculosus and Bifurcaria bifurcata. Marine Drugs. 2017; 15: 360.
[32]
Yuan YV. Marine algal constituents. In Barrow C, Shahidi F (eds.) Marine Nutraceuticals and Functional Foods. 1st ed. Boca Raton, CRC Press: New York, USA. 2007.
[33]
Sakthivel R, Devi P. Evaluation of Physiochemical properties, Proximate and Nutritional Composition of Gracilaria edulis Collected from Palk Bay. Food Chemistry. 2015; 174: 68–74.
[34]
Ortiz J, Romero N, Robert P, Araya J, Lopez-Hernández J, Bozzo C, et al. Dietary fiber, amino acid, fatty acid and tocopherol contents of the edible seaweeds Ulva lactuca and Durvillaea antarctica. Food Chemistry. 2006; 99: 98–104.
[35]
Soares C, Sousa S, Machado S, Vieira E, Carvalho AP, Ramalhosa MJ, et al. Bioactive Lipids of Seaweeds from the Portuguese North Coast: Health Benefits versus Potential Contamination. Foods. 2021; 10: 1366.
[36]
Kumar CS, Ganesan P, Suresh PV, Bhaskar N. Seaweeds as a source of nutritionally beneficial compounds – A review. Journal of Food Science and Technology. 2008; 45: 1–13.
[37]
Kumari P, Kumar M, Gupta V, Reddy CRK, Jha B. Tropical marine macroalgae as potential sources of nutritionally important PUFAs. Food Chemistry. 2010; 120: 749–757.
[38]
Wu G. Dietary protein intake and human health. Food & Function. 2016; 7: 1251–1265.
[39]
Mouritsen OG, Dawczynski C, Duelund L, Jahreis G, Vetter W, Schröde M. On the human consumption of the red seaweed dulse ( Palmaria palmata (L.) Weber & Mohr). Journal of Applied Phycology. 2013; 25: 1777–1791.
[40]
Wells ML, Potin P, Craigie JS, Raven JA, Merchant SS, Helliwell KE, et al. Algae as nutritional and functional food sources: revisiting our understanding. Journal of Applied Phycology. 2016; 29: 949–982.
[41]
Biancarosa I, Espe M, Bruckner CG, Heesch S, Liland N, Waagbø R, et al. Amino acid composition, protein content, and nitrogen-to-protein conversion factors of 21 seaweed species from Norwegian waters. Journal of Applied Phycology. 2016; 29: 1001–1009.
[42]
Fleurence J. Seaweed proteins: biochemical, nutritional aspects and potential uses. Trends in Food Science & Technology. 1999; 10: 25–28.
[43]
Gressler V, Fujii MT, Martins AP, Colepicolo P, Mancini-Filho J, Pinto E. Biochemical composition of two red seaweed species grown on the Brazilian coast. Journal of the Science of Food and Agriculture. 2011; 91: 1687–1692.
[44]
El-Said GF, El-Sikaily A. Chemical composition of some seaweed from Mediterranean Sea coast, Egypt. Environmental Monitoring and Assessment. 2013; 185: 6089–6099.
[45]
Rosenberg C, Ramus J. Ecological growth strategies in the seaweeds Gracilaria foliifera (Rhodophyceae) and Ulva sp. (Chlorophyceae): Soluble nitrogen and reserve carbohydrates. Marine Biology. 1982; 66: 251–259.
[46]
Marinho-Soriano E, Fonseca PC, Carneiro MAA, Moreira WSC. Seasonal variation in the chemical composition of two tropical seaweeds. Bioresource Technology. 2006; 97: 2402–2406.
[47]
Perfeto PNM. Relation between chemical composition of Grateloupia doryphora (Montagne) Howe, Gymnogongrus griffithsiae (Turner) Martius, and abiotic parameters. Acta Botanica Brasilica. 1998; 12: 77–88.
[48]
Sánchez-García F, Hernández I, Palacios VM, Roldán AM. Freshness Quality and Shelf Life Evaluation of the Seaweed Ulva rigida through Physical, Chemical, Microbiological, and Sensory Methods. Foods. 2021; 10: 181.
[49]
Garcia-Vaquero M, Lopez-Alonso M, Hayes M. Assessment of the functional properties of protein extracted from the brown seaweed Himanthalia elongata (Linnaeus) S. F. Gray. Food Research International. 2016; 99: 971–978.
[50]
Løvdal T, Skipnes D. Assessment of Food Quality and Safety of Cultivated Macroalgae. Foods. 2022; 11: 83.
[51]
Bocanegra A, Bastida S, Benedí J, Ródenas S, Sánchez-Muniz FJ. Characteristics and Nutritional and Cardiovascular-Health Properties of Seaweeds. Journal of Medicinal Food. 2009; 12: 236–258.
[52]
Ferrara L. Seaweeds: A Food for Our Future. Journal of Food Chemistry & Nanotechnology. 2020; 6: 56–64.
[53]
Rocha CP, Pacheco D, Cotas J, Marques JC, Pereira L, Gonçalves AM. Seaweeds as Valuable Sources of Essential Fatty Acids for Human Nutrition. International Journal of Environmental Research and Public Health. 2021; 18: 4968.
[54]
Fleurence J, Gutbier G, Mabeau S, Leray C. Fatty acids from 11 marine macroalgae of the French Brittany coast. Journal of Applied Phycology. 1994; 6: 527–532.
[55]
Wood JD, Richardson RI, Nute GR, Fisher AV, Campo MM, Kasapidou E, et al. Effects of fatty acids on meat quality: a review. Meat Science. 2003; 66: 21–32.
[56]
Dawczynski C, Schubert R, Jahreis G. Amino acids, fatty acids, and dietary fibre in edible seaweed products. Food Chemistry. 2007; 103: 891–899.
[57]
COMA (Committee on Medical Aspects of Food and Nutrition Policy). Dietary reference values for food energy and nutrients for the United Kingdom. Reports on public health and medical subjects (Lond.). 1991; 41: 1–210.
[58]
Ruperez P. Mineral content of edible marine seaweeds. Food Chemistry. 2002; 79: 23–26.
[59]
Circuncisão AR, Catarino MD, Cardoso SM, Silva AM. Minerals from Macroalgae Origin: Health Benefits and Risks for Consumers. Marine Drugs. 2018; 16: 400.
[60]
Lozano Muñoz I, Díaz NF. Minerals in edible seaweed: health benefits and food safety issues. Critical Reviews in Food Science and Nutrition. 2022; 62: 1592–1607.
[61]
Parjikolaei BR, Bruhn A, Eybye KL, Larsen MM, Rasmussen MB, Christensen KV, et al. Valuable Biomolecules from Nine North Atlantic Red Macroalgae: Amino Acids, Fatty Acids, Carotenoids, Minerals and Metals. Natural Resources. 2016; 07: 157–183.
[62]
Astorga-España MS, Rodríguez Galdón B, Rodríguez Rodríguez EM, Díaz Romero C. Mineral and trace element concentrations in seaweeds from the sub-Antarctic ecoregion of Magallanes (Chile). Journal of Food Composition and Analysis. 2015; 39: 69–76.
[63]
Larrea-Marín MT, Pomares-Alfonso MS, Gómez-Juaristi M, Sánchez-Muniz FJ, de la Rocha SR. Validation of an ICP-OES method for macro and trace element determination in Laminaria and Porphyra seaweeds from four different countries. Journal of Food Composition and Analysis. 2010; 23: 814–820.
[64]
Preuss HG. Sodio, cloruro y potássio. In Bowman BA, Russel RM (eds.) Conocimientos actuales sobre nutrición. 8th ed. Instituto Internacional de Ciencias de la Vida, Washington, DC, USA. 2003.
[65]
Milinovic J, Fernando AL, Campos B, Leite B, Mata P, Diniz M, et al. Nutritional Benefits of Edible Macroalgae from the Central Portuguese Coast: Inclusion of Low-Calorie ‘Sea Vegetables’ in Human Diet. International Journal of Environmental Science & Natural Research. 2021; 28: 556250.
[66]
Wijendran V, Bell SJ. Relationship of Dietary Sodium, Potassium and The Sodium-to-Potassium Ratio to Blood Pressure. Journal of Medical - Clinical Research & Reviews. 2019; 3:1–5.
[67]
Matanjun P, Mohamed S, Mustapha NM, Muhammad K. Nutrient content of tropical edible seaweeds, Eucheuma cottonii, Caulerpa lentillifera and Sargassum polycystum. Journal of Applied Phycology. 2009; 21: 75–80.
[68]
Rodrigues D, Freitas AC, Pereira L, Rocha-Santos TAP, Vasconcelos MW, Roriz M, et al. Chemical composition of red, brown and green macroalgae from Buarcos bay in Central West Coast of Portugal. Food Chemistry. 2015; 183: 197–207.
[69]
Cardoso S, Carvalho L, Silva P, Rodrigues M, Pereira O, Pereira L. Bioproducts from Seaweeds: a Review with Special Focus on the Iberian Peninsula. Current Organic Chemistry. 2014; 18: 896–917.
[70]
MacArtain P, Gill CI, Brooks M, Campbell R, Rowland IR. Nutritional Value of Edible Seaweeds. Nutrition Reviews. 2007; 65: 535–543.
[71]
Neumann C, Harris DM, Rogers LM. Contribution of animal source foods in improving diet quality and function in children in the developing world. Nutrition Research. 2002; 22: 193–220.
[72]
del Olmo A, Picon A, Nuñez M. Preservation of five edible seaweeds by high pressure processing: effect on microbiota, shelf life, colour, texture and antioxidant capacity. Algal Research. 2020; 49: 101938.
[73]
Banach JL, Hoek‐van den Hil EF, Fels‐Klerx HJ. Food safety hazards in the European seaweed chain. Comprehensive Reviews in Food Science and Food Safety. 2020; 19: 332–364.
[74]
Lytou AE, Schoina E, Liu Y, Michalek K, Stanley MS, Panagou EZ, et al. Quality and Safety Assessment of Edible Seaweeds Alaria esculenta and Saccharina latissima Cultivated in Scotland. Foods. 2021; 10: 2210.
[75]
INSA. Interpretação de resultados de ensaios microbiológicos em alimentos prontos para consumo e em superfícies do ambiente de preparação e distribuição alimentar: valores-guia (pp. 35). Instituto Nacional de Saúde Doutor Ricardo Jorge (INSA), Lisboa. 2019.
[76]
Blikra MJ, Løvdal T, Vaka MR, Roiha IS, Lunestad BT, Lindseth C, et al. Assessment of food quality and microbial safety of brown macroalgae (Alaria esculenta and Saccharina latissima). Journal of the Science of Food and Agriculture. 2019; 99: 1198–1206.
[77]
Franz CMAP, Holzapfel WH, Stiles ME. Enterococci at the crossroads of food safety? International Journal of Food Microbiology. 1999; 47: 1–24.
[78]
Picon A, del Olmo A, Nuñez M. Bacterial diversity in six species of fresh edible seaweeds submitted to high pressure processing and long-term refrigerated storage. Food Microbiology. 2021; 94: 103646.
[79]
Byappanahalli MN, Shively DA, Nevers MB, Sadowsky MJ, Whitman RL. Growth and survival of Escherichia coli and enterococci populations in the macro-alga Cladophora (Chlorophyta). FEMS Microbiology Ecology. 2003; 46: 203–211.
[80]
Nayyar D, Skonberg DI. Contrasting effects of two storage temperatures on the microbial, physicochemical, and sensory properties of two fresh red seaweeds, Palmaria palmata and Gracilaria tikvahiae. Journal of Applied Phycology. 2019; 31: 731–739.
[81]
Løvdal T, Lunestad BT, Myrmel M, Rosnes JT, Skipnes D. Microbiological Food Safety of Seaweeds. Foods. 2021; 10: 2719.
[82]
Del Olmo A, Picon A, Nuñez M. The microbiota of eight species of dehydrated edible seaweeds from North West Spain. Food Microbiology. 2018; 70: 224–231.
Share
Back to top