


 , Rattanaporn Somrit 5, Warut Koonnasoot 5, Sulawan Kaowphong 3,6, Titipun Thongtem 3,6, Somchai Thongtem 3,7, Surangkana Wannapop 8
1 Center of Excellence in Materials Science and Technology, Chiang Mai University, 50200 Chiang Mai, Thailand
2 Doctor of Philosophy Program in Nanoscience and Nanotechnology (International Program/Interdisciplinary), Faculty of Science, Chiang Mai University, 50200 Chiang Mai, Thailand
3 Materials Science Research Center, Faculty of Science, Chiang Mai University, 50200 Chiang Mai, Thailand
4 Physics Program, Faculty of Education, Buriram Rajabhat University, 31000 Buriram, Thailand
5 Division of Physics, Faculty of Science, Buriram Rajabhat University, 31000 Buriram, Thailand
6 Department of Chemistry, Faculty of Science, Chiang Mai University, 50200 Chiang Mai, Thailand
7 Department of Physics and Materials Science, Faculty of Science, Chiang Mai University, 50200 Chiang Mai, Thailand
8 Faculty of Science, Energy, and Environment, King Mongkut’s University of Technology North Bangkok, Rayong Campus, 21120 Rayong, Thailand
Abstract
Iron (Fe)-doped bismuth oxybromide (BiOBr) semiconductors were successfully synthesized via a microwave-assisted method with Fe concentrations of 0.25 mol %, 0.50 mol %, and 0.75 mol % to enhance visible-light-driven photocatalytic degradation of Rhodamine B (RhB). The structural, morphological, and optical properties of the composites were characterized using X-ray diffraction (XRD), scanning electron microscopy (SEM), transmission electron microscopy (TEM), energy-dispersive X-ray spectroscopy (EDX), Fourier-transform infrared spectroscopy (FT-IR), X-ray photoelectron spectroscopy (XPS), photoluminescence (PL), and ultraviolet-visible (UV-vis) spectroscopy. Among the composites, 0.50 mol % Fe-doped BiOBr exhibited the highest RhB degradation efficiency of 96.26% under visible light. The enhanced photocatalytic activity is attributed to more efficient charge carrier separation, improved light absorption, and the predominant roles of photogenerated holes (h⁺) and hydroxyl radicals (•OH) as the primary reactive species. These results demonstrate the potential of Fe-doped BiOBr as a promising solution for wastewater treatment.
Keywords
- microwave-assisted synthesis
- Rhodamine B
- Fe-doped BiOBr
- photocatalysis
- wastewater treatment
Industrial wastewater, particularly from the textile sector, has become a major environmental concern in recent decades, contributing significantly to global water pollution [1]. Polluted water typically contains complex mixtures of organic contaminants, heavy-metal ions, and synthetic dyes, which are hazardous for aquatic ecosystems and human health [2, 3]. Consequently, the development of environmentally friendly and highly efficient water treatment technologies has become a critical research priority. Among various approaches, semiconductor-based photocatalytic degradation has attracted considerable attention owing to its ability to harness light energy to drive redox reactions, mineralizing organic pollutants into non-toxic products while linking environmental remediation and renewable energy concepts [4, 5]. In recent years, photocatalytic degradation has been extensively investigated for wastewater treatment applications. In particular, bismuth oxyhalide compounds (BiOX, X = Cl, Br, I) have been recognized as promising photocatalysts due to their layered crystal structures, internal electric fields, and strong visible-light responses. Among them, bismuth oxybromide (BiOBr) has received increasing interest; however, its photocatalytic performance is often limited by rapid recombination of photogenerated electron–hole pairs [6, 7]. To overcome this limitation, band structure engineering through transition-metal doping, particularly with iron (Fe), has been explored. Fe doping can introduce defect states, enhance charge-carrier separation, and introduce additional catalytically active sites, resulting in improved photocatalytic performance [8, 9, 10]. For instance, Fe-doped BiOBr microspheres synthesized via solvothermal routes achieved approximately 75% Rhodamine B degradation under visible-light irradiation, demonstrating the beneficial effect of Fe incorporation [11].
In this study, Fe-doped BiOBr photocatalysts were synthesized using a microwave-assisted method. Compared with conventional synthetic routes, microwave-assisted synthesis provides shorter reaction times, improved energy efficiency, lower operating temperatures, and better control over reaction parameters. The effects of varying Fe concentrations on the structural, morphological, and photocatalytic properties of BiOBr were systematically evaluated. The results provide insights into how Fe incorporation enhances charge transport pathways and improves visible-light-driven photocatalytic activity.
High-purity chemicals were used throughout the study to ensure the reliability
and reproducibility of the synthesis and photocatalytic experiments. Bismuth
nitrate pentahydrate (Bi(NO3)3
Pure and Fe-doped BiOBr photocatalysts were synthesized via a microwave-assisted
method. In a typical procedure, 1 mmol of bismuth nitrate pentahydrate
(Bi(NO3)3
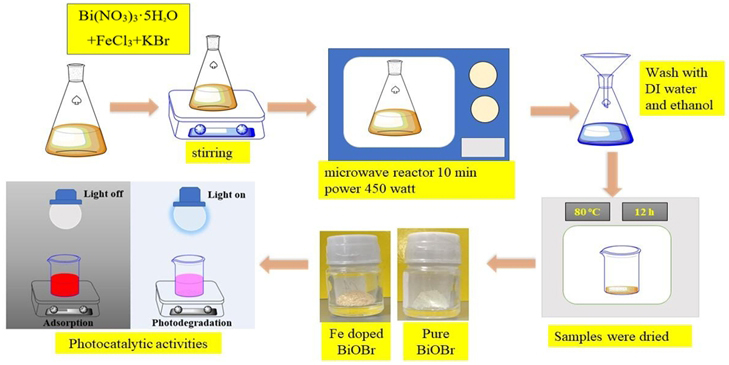 Fig. 1.
Microwave-assisted synthesis and photocatalytic evaluation of pure and Fe-doped BiOBr. BiOBr, bismuth oxybromide; DI water, Deionized water.
The structural and physicochemical properties of the synthesized samples were
systematically characterized using various analytical techniques. Phase
identification and crystallographic analysis were carried out by X-ray
diffraction (XRD, Bruker D8 Advance, Karlsruhe, Germany) using Cu K
For RhB degradation, 0.05 g of catalyst was added to 200 mL of 1.5
The XRD patterns of pure BiOBr and Fe-doped BiOBr samples
synthesized via the microwave-assisted method are shown in Fig. 2A. The undoped
BiOBr exhibits distinct diffraction peaks at 2
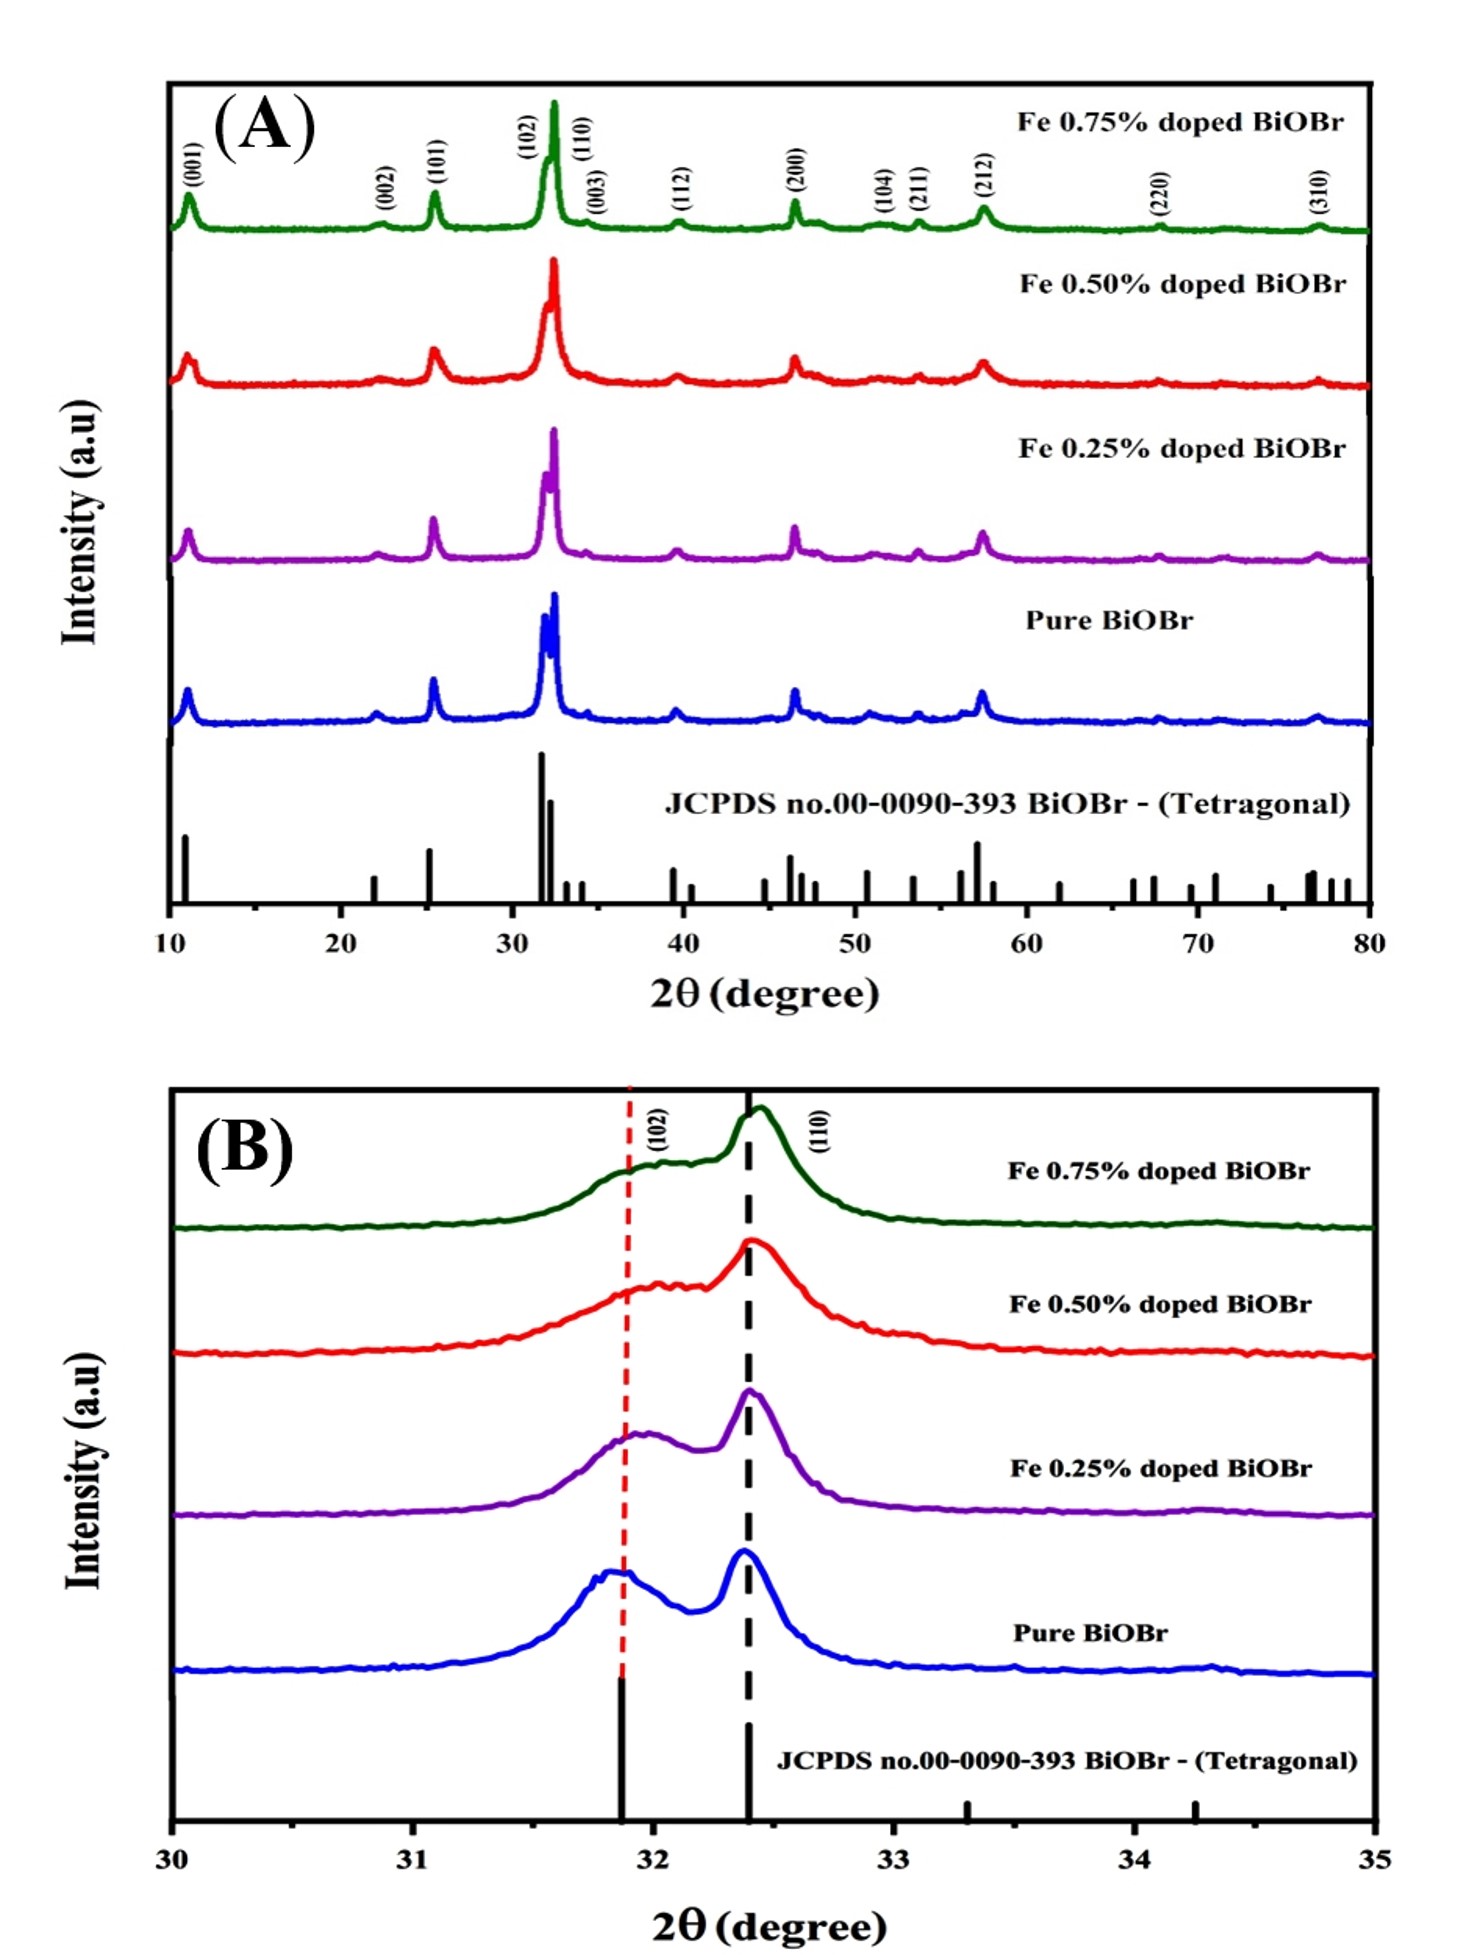 Fig. 2.
XRD patterns of pure and Fe-BiOBr. (A) XRD patterns of pure and
Fe-doped BiOBr, 2
FTIR spectroscopy (Fig. 3) was used to examine the functional groups of pure and Fe-doped BiOBr (0.25%, 0.50%, and 0.75% mole fractions) over 400–4000 cm-1, see Fig. 3. The FTIR spectrum of undoped BiOBr shows peaks at 525 and 1383 cm-1 corresponding to Bi-O stretching and Bi-Br asymmetric stretching vibrations, respectively. Additional peaks observed at 1459 cm-1 are associated with C-N stretching vibrations, while bands at 2921 and 2954 cm-1 correspond to C-H stretching vibrations, indicating the presence of residual organic contaminants adsorbed on the surface of undoped BiOBr. Moreover, absorption bands at 1622 and within the range of 3440–3533 cm-1 are assigned to the O-H bending and stretching vibrations of adsorbed water molecules, respectively. The presence of surface hydroxyl groups is beneficial for photocatalytic activity, as they can act as precursors for hydroxyl radical generation. In comparison with pure BiOBr, the FTIR spectra of Fe-doped BiOBr samples exhibit similar vibrational features, indicating that Fe incorporation does not alter the fundamental BiOBr structure. However, slight shifts in the Bi-O and Bi-Br vibrational bands suggest the presence of lattice distortions induced by Fe incorporation, likely due to Bi-O-Fe formation. Furthermore, the increased O-H intensities in Fe-doped samples imply potential enhancement of photocatalytic activity via increased hydroxyl radical formation [8, 14].
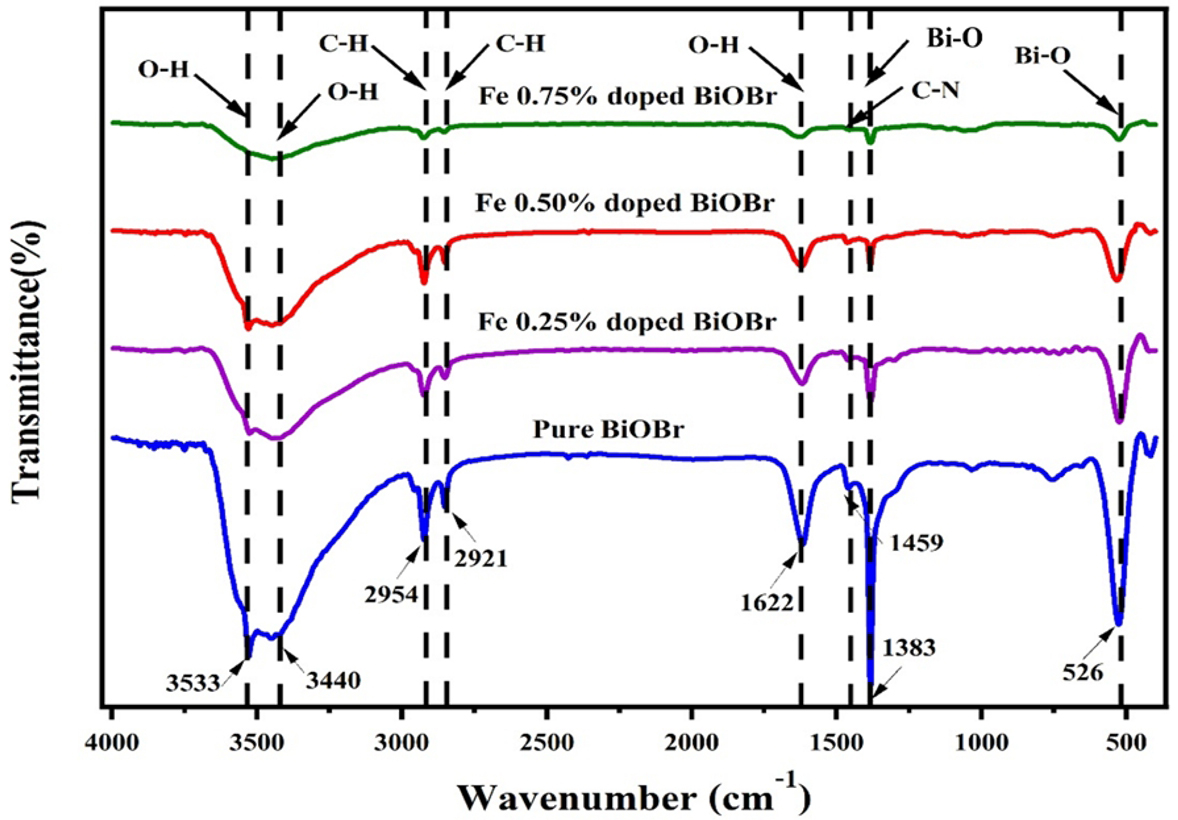 Fig. 3.
FT-IR spectra of pure and Fe-doped BiOBr. FT-IR, Fourier-transform infrared spectroscopy.
The surface morphology and microstructural evolution of pure BiOBr and Fe-doped
BiOBr synthesized via microwave-assisted methods were examined using
FE-SEM (Fig. 4). As observed in Fig. 4A,B, Pure BiOBr exhibits densely packed plate-like nanostructures with an
average thickness of 38.96
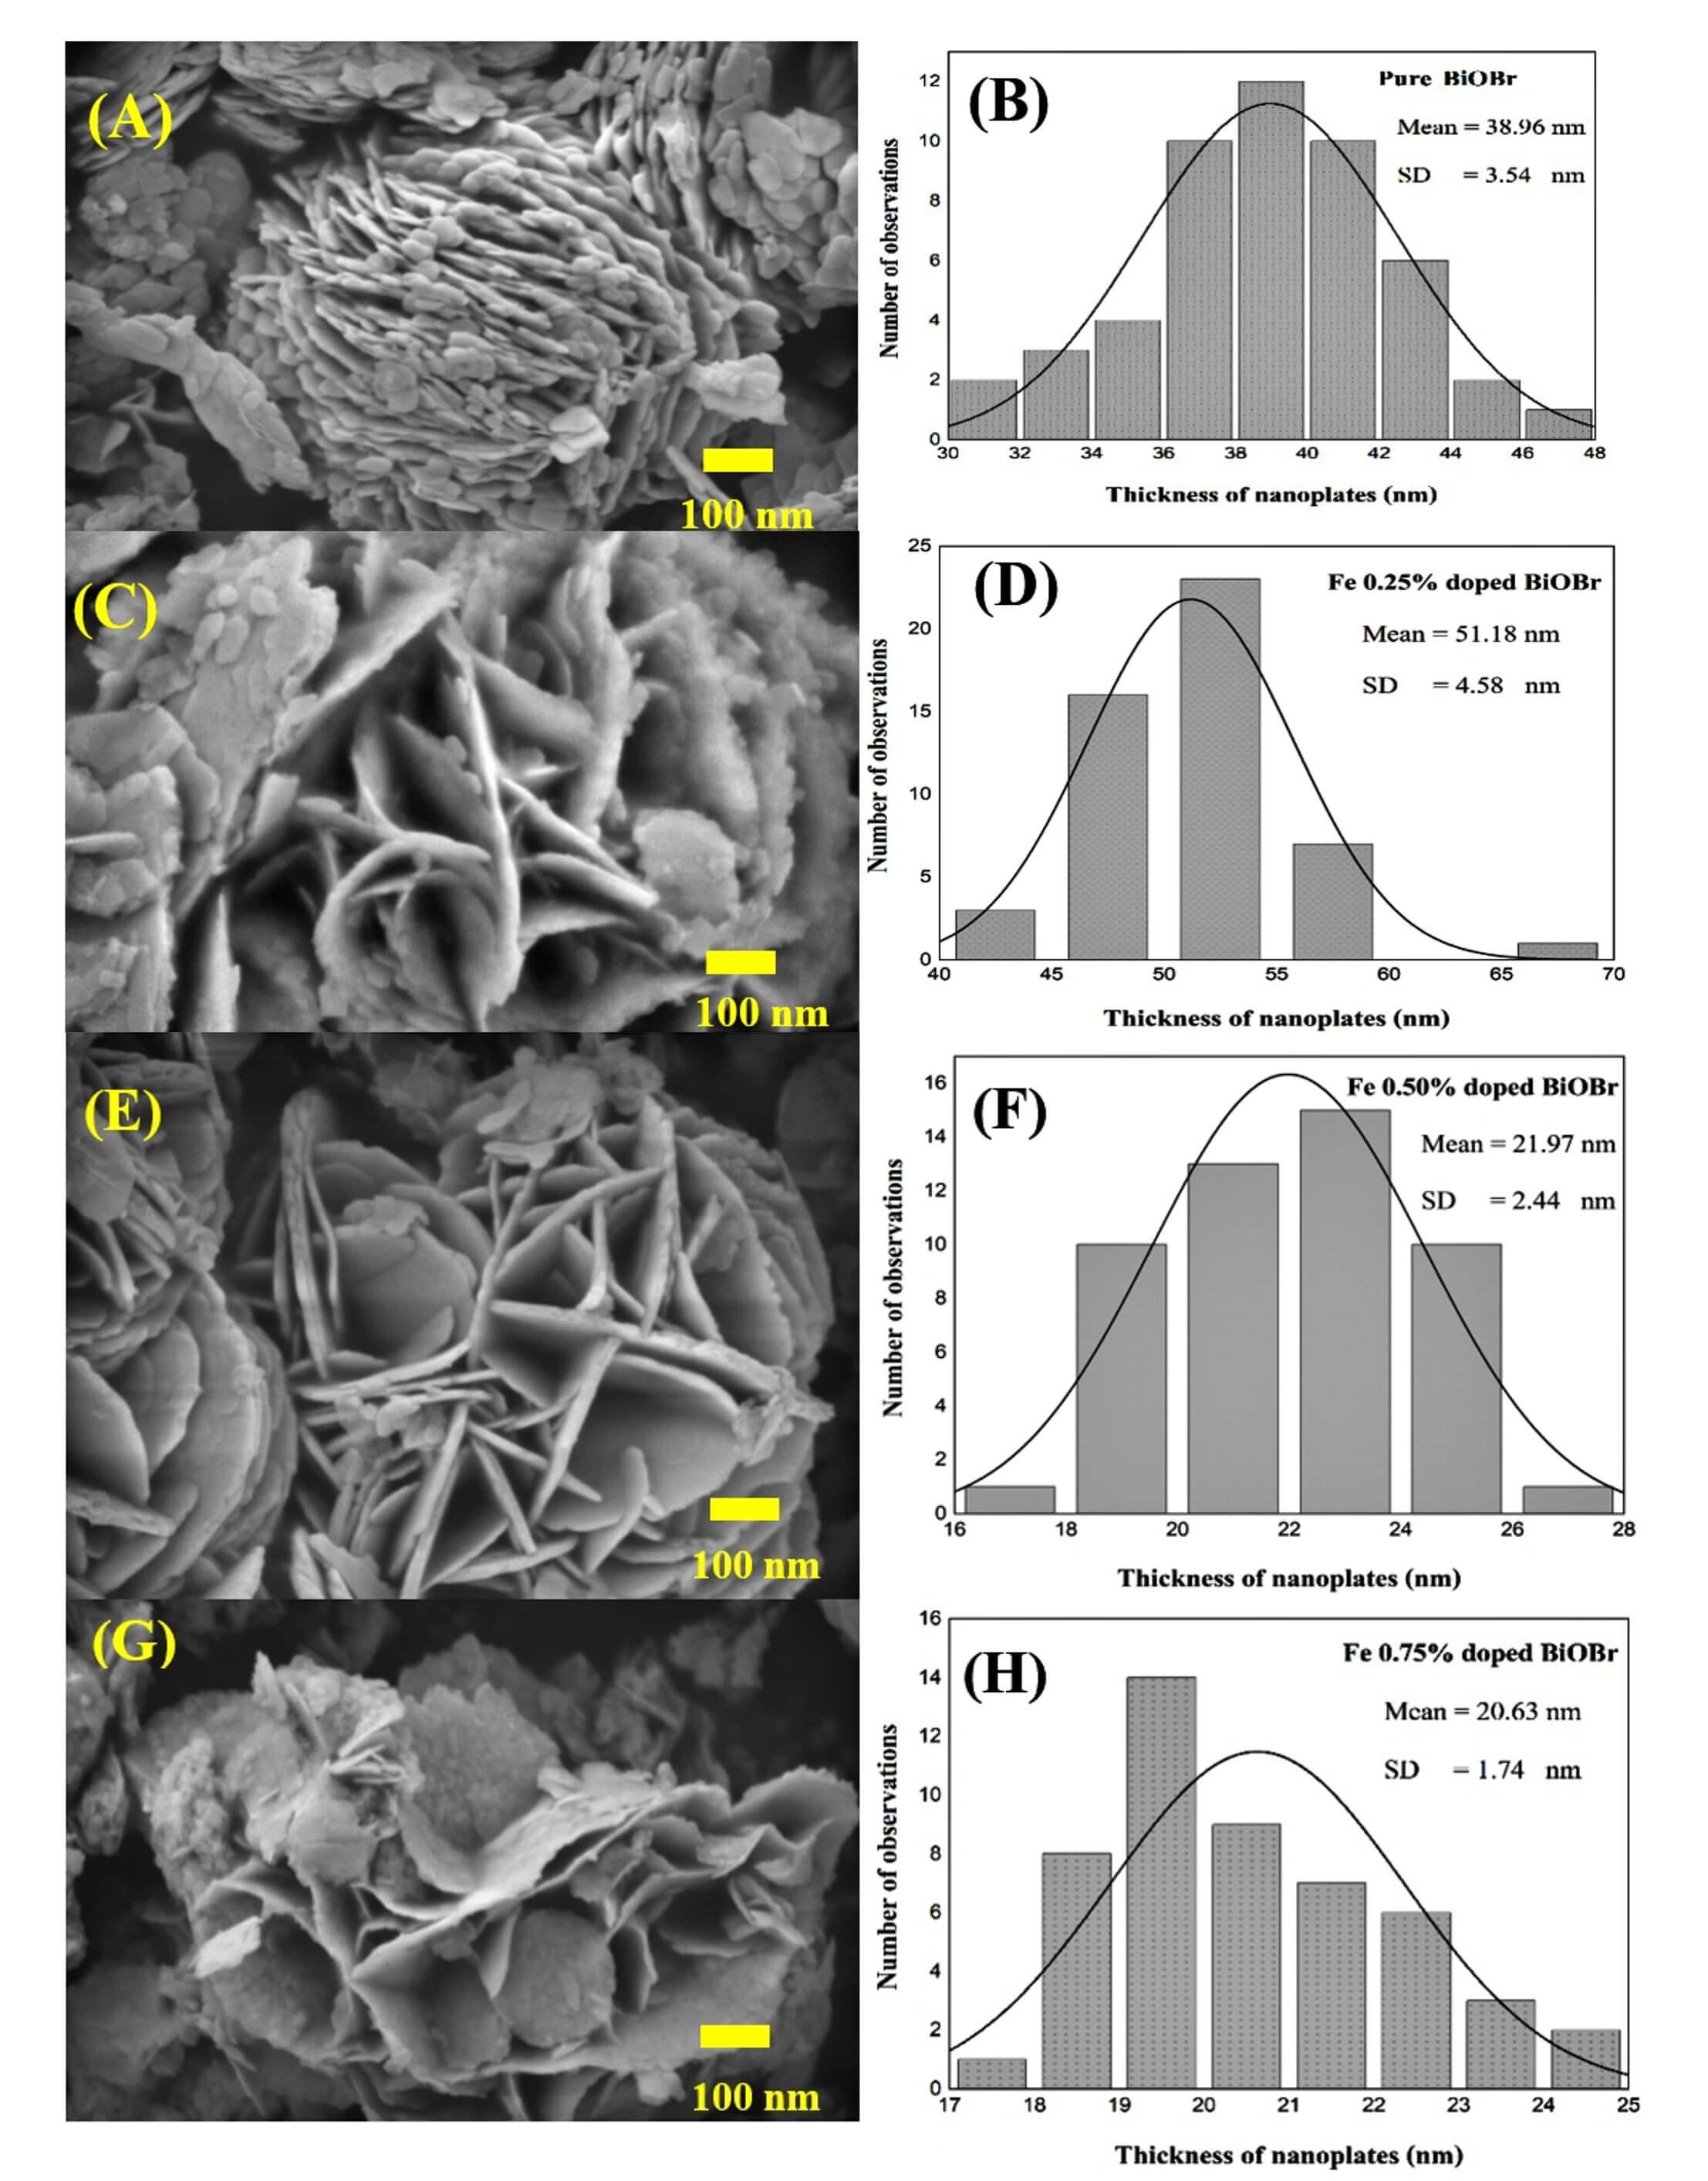 Fig. 4.
FE-SEM image and average thickness of nanoplates by histogram. (A,B) Pure BiOBr. (C,D) Fe 0.25% doped BiOBr. (E,F) Fe 0.5% doped BiOBr. (G,H) Fe 0.75% doped BiOBr. FE-SEM, field-emission scanning electron microscopy; SD, standard deviation. Scale bar = 100 nm.
TEM of 0.5% Fe-doped BiOBr (Fig. 5A) reveals nanoplate morphology with significant stacking and overlap. High-resolution transmission electron microscopy (HRTEM) of a single nanoplate (Fig. 5B) shows well-defined lattice fringes with an interplanar spacing of 0.41 nm, corresponding to the (002) plane of tetragonal BiOBr, indicating high crystallinity and minimal structural defects. Selected-area electron diffraction (SAED) (Fig. 5C) displays bright, well-defined diffraction rings corresponding to the (101), (111), (201), (203), (214), and (215) planes of the tetragonal BiOBr phase (JCPDS No. 90-0393) [12], confirming the high degree of crystallinity. These results indicate that Fe incorporation preserves the tetragonal BiOBr structure while modifying the morphology into open-pore flower-petal nanoplates, enhancing photocatalytic efficiency.
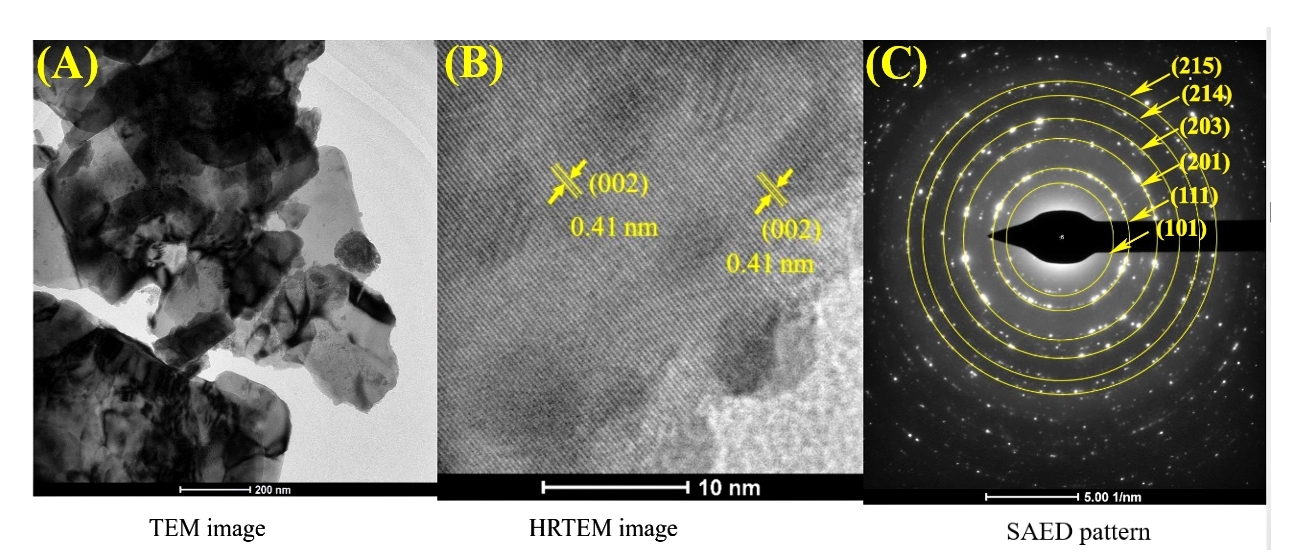 Fig. 5.
TEM/HRTEM and SAED characterization of 0.50% Fe-BiOBr. (A) TEM. (B) HRTEM. (C) SAED of 0.5% Fe-BiOBr. TEM, transmission electron microscopy; HRTEM, high-resolution transmission electron microscopy; SAED, selected-area electron diffraction. Fig. 5A scale bar = 200 nm; Fig. 5B scale bar = 10 nm; Fig. 5C scale bar = 5 nm.
Energy-dispersive X-ray spectroscopy (EDS) of the samples is shown in Fig. 6A–D. The undoped BiOBr exhibits prominent Bi, O, and Br peaks, whereas Fe-doped samples display additional weak Fe signals that increase with Fe loading. Elemental mapping of 0.50 mol % Fe-doped BiOBr (Fig. 6E) reveals uniform distributions of Bi, O, Br, and Fe, without observable Fe clustering or secondary phases, confirming successful lattice incorporation of Fe via the microwave-assisted route.
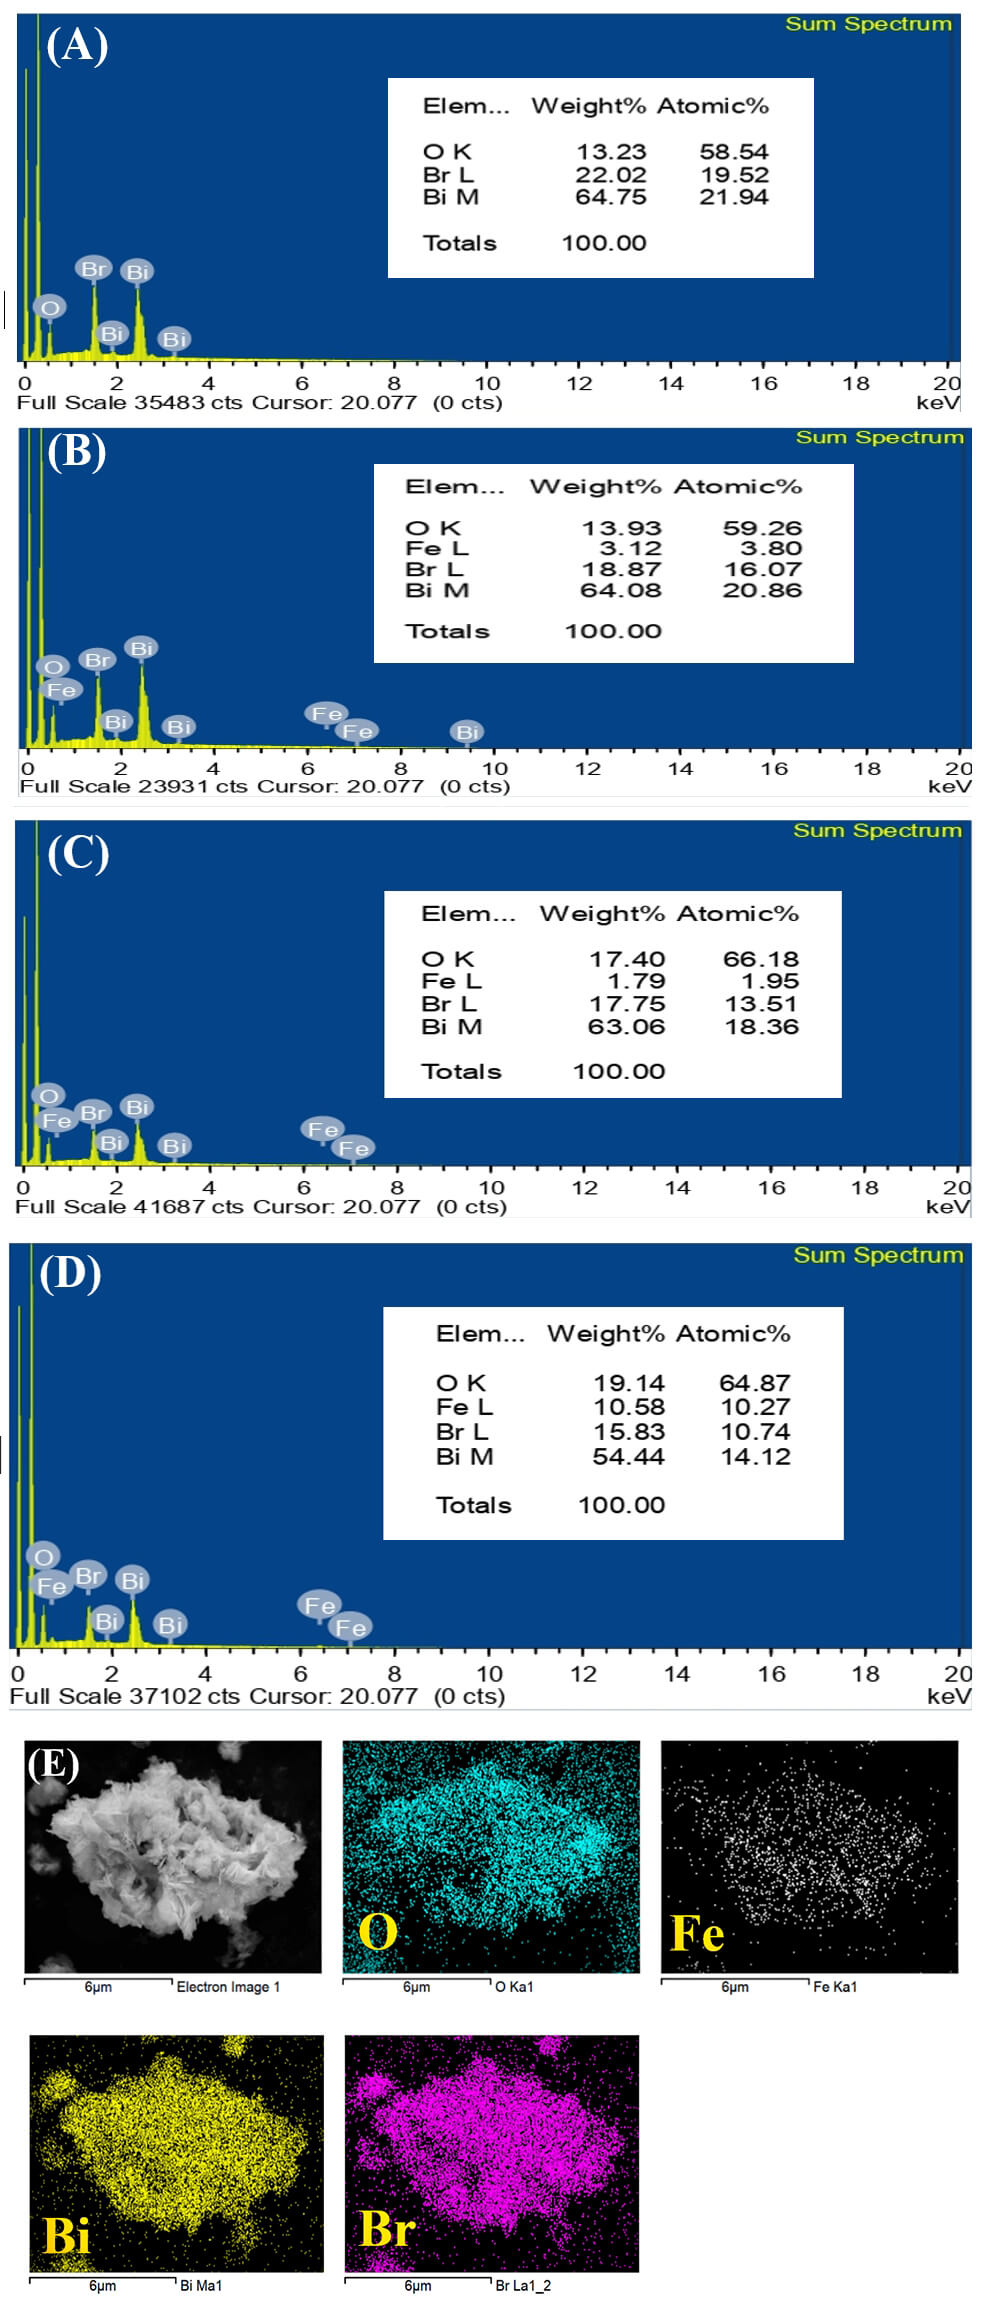 Fig. 6.
EDX spectra and elemental mapping of Fe–BiOBr. (A) EDX spectra of BiOBr. (B) 0.25% Fe-BiOBr. (C) 0.5% Fe-BiOBr. (D) 0.75% Fe-BiOBr. (E) Elemental maps for 0.5% Fe-BiOBr. EDX, energy-dispersive X-ray spectroscopy. Scale bar = 6 μm.
The chemical composition, oxidation states, and electronic structure of 0.50 mol % Fe-doped BiOBr were further analyzed using XPS (Fig. 7). The survey spectrum (Fig. 7A) confirms the presence of Bi, O, Br, Fe, and C, indicating successful incorporation of Fe ions into the BiOBr lattice without detectable impurities. The C 1s peak at 285.1 eV was used as a reference for binding energy calibration.
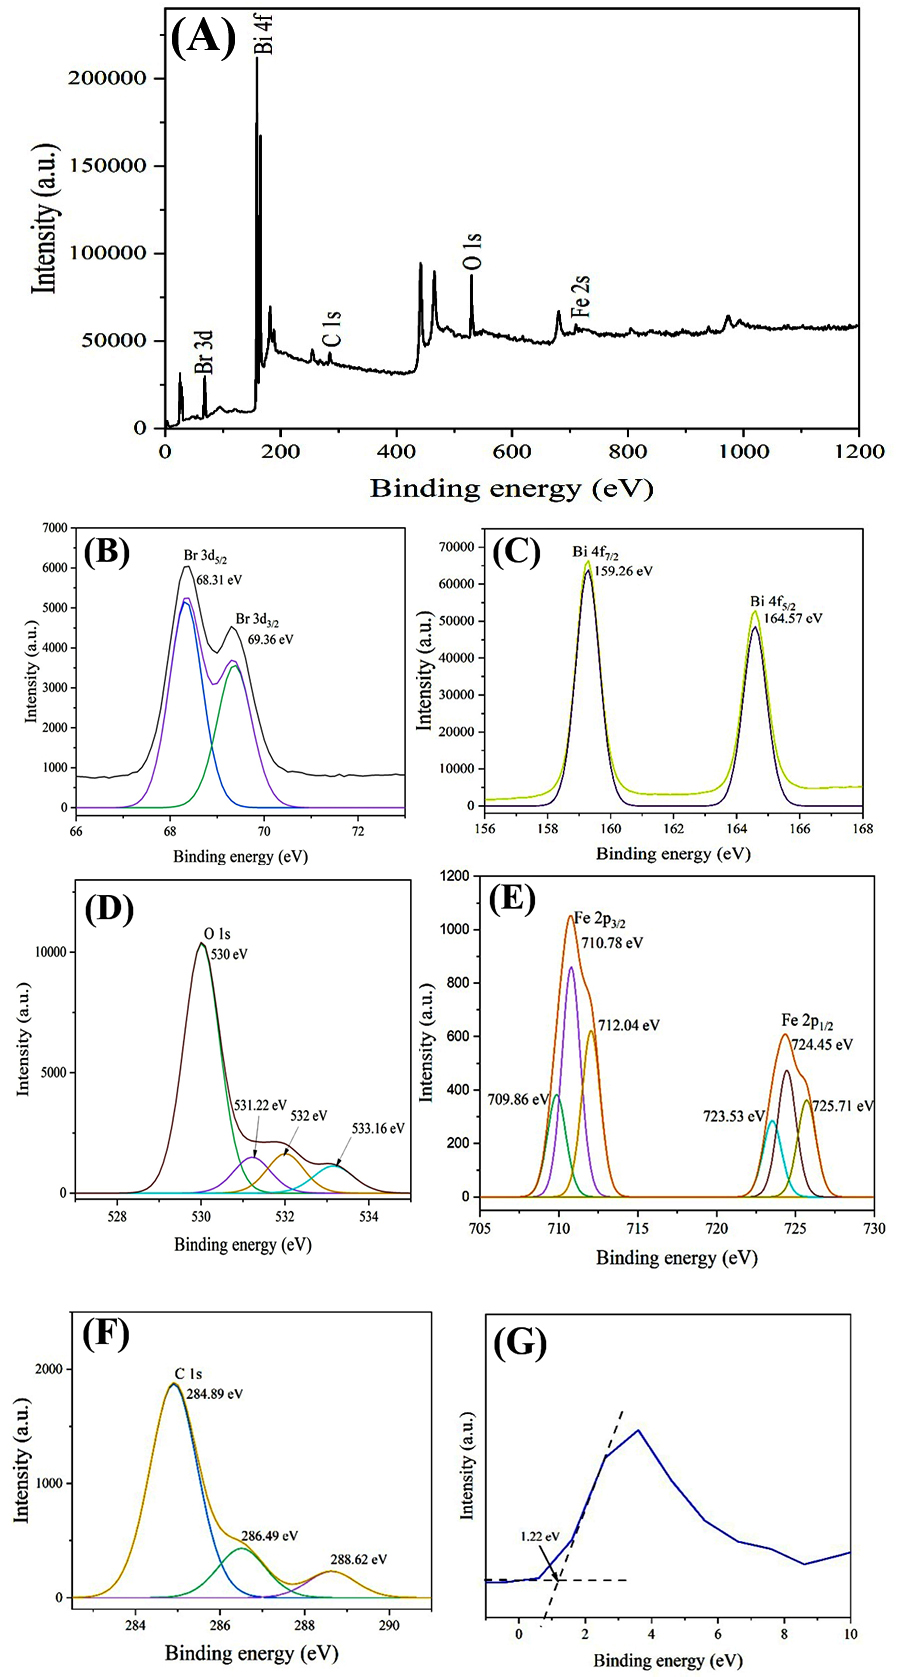 Fig. 7.
XPS of 0.5% Fe-BiOBr. (A) Survey. (B) Br 3d. (C) Bi 4f. (D) O 1s. (E) Fe 2p. (F) C 1s. (G) Valence-band edge. XPS, X-ray photoelectron spectroscopy.
High-resolution XPS spectra of Fe 2p, Bi 4f, O 1s, and Br 3d core levels are presented in Fig. 7B–E. The Fe 2p spectrum exhibits asymmetric peaks that, upon Gaussian deconvolution, yield three components for Fe 2p1/2 at 723.53, 724.45, and 725.71 eV, and three components for Fe 2p3/2 at 709.86, 710.78, and 712.04 eV. These binding energies correspond to Fe3+ oxidation states, confirming the successful incorporation of Fe3+ into the BiOBr lattice and its contribution to enhanced electron transport [15, 16, 17]. The Bi 4f spectrum shows spin-orbit doublets at 159.26 eV(4f7/2) and 164.57 eV (4f5/2) corresponding to Bi3+ ions in the BiOBr lattice. The Br 3d spectrum exhibits symmetric doublets at 68.31 eV (3d5/2) and 69.36eV (3d3/2), confirming the Br– oxidation state. The O 1s spectrum can be deconvoluted into four components at 530.00, 531.22, 532.00, and 533.16 eV. The dominant peak at 530.00 eV corresponds to lattice Bi-O bonds, while the minor peaks are attributed to surface oxygen species including OH–, H₂O, and adsorbed CO₂, respectively. The presence of hydroxyl groups on the surface of 0.50 mol % Fe-doped BiOBr nanoplates suggests an increased availability of reactive species, which is favorable for enhanced photocatalytic activity. The valence band edge (EVBE) of 0.50 mol % Fe-doped BiOBr was determined from the intersection of the XPS energy spectrum with the valence band (Fig. 7G), yielding a value of 1.22 eV [18, 19].
Fig. 8A exhibit strong UV-visible absorption, with Fe doping significantly
enhancing visible-light absorption and inducing a redshift of the absorption edge
(0.25 mol %, 0.50 mol %, 0.75 mol % Fe
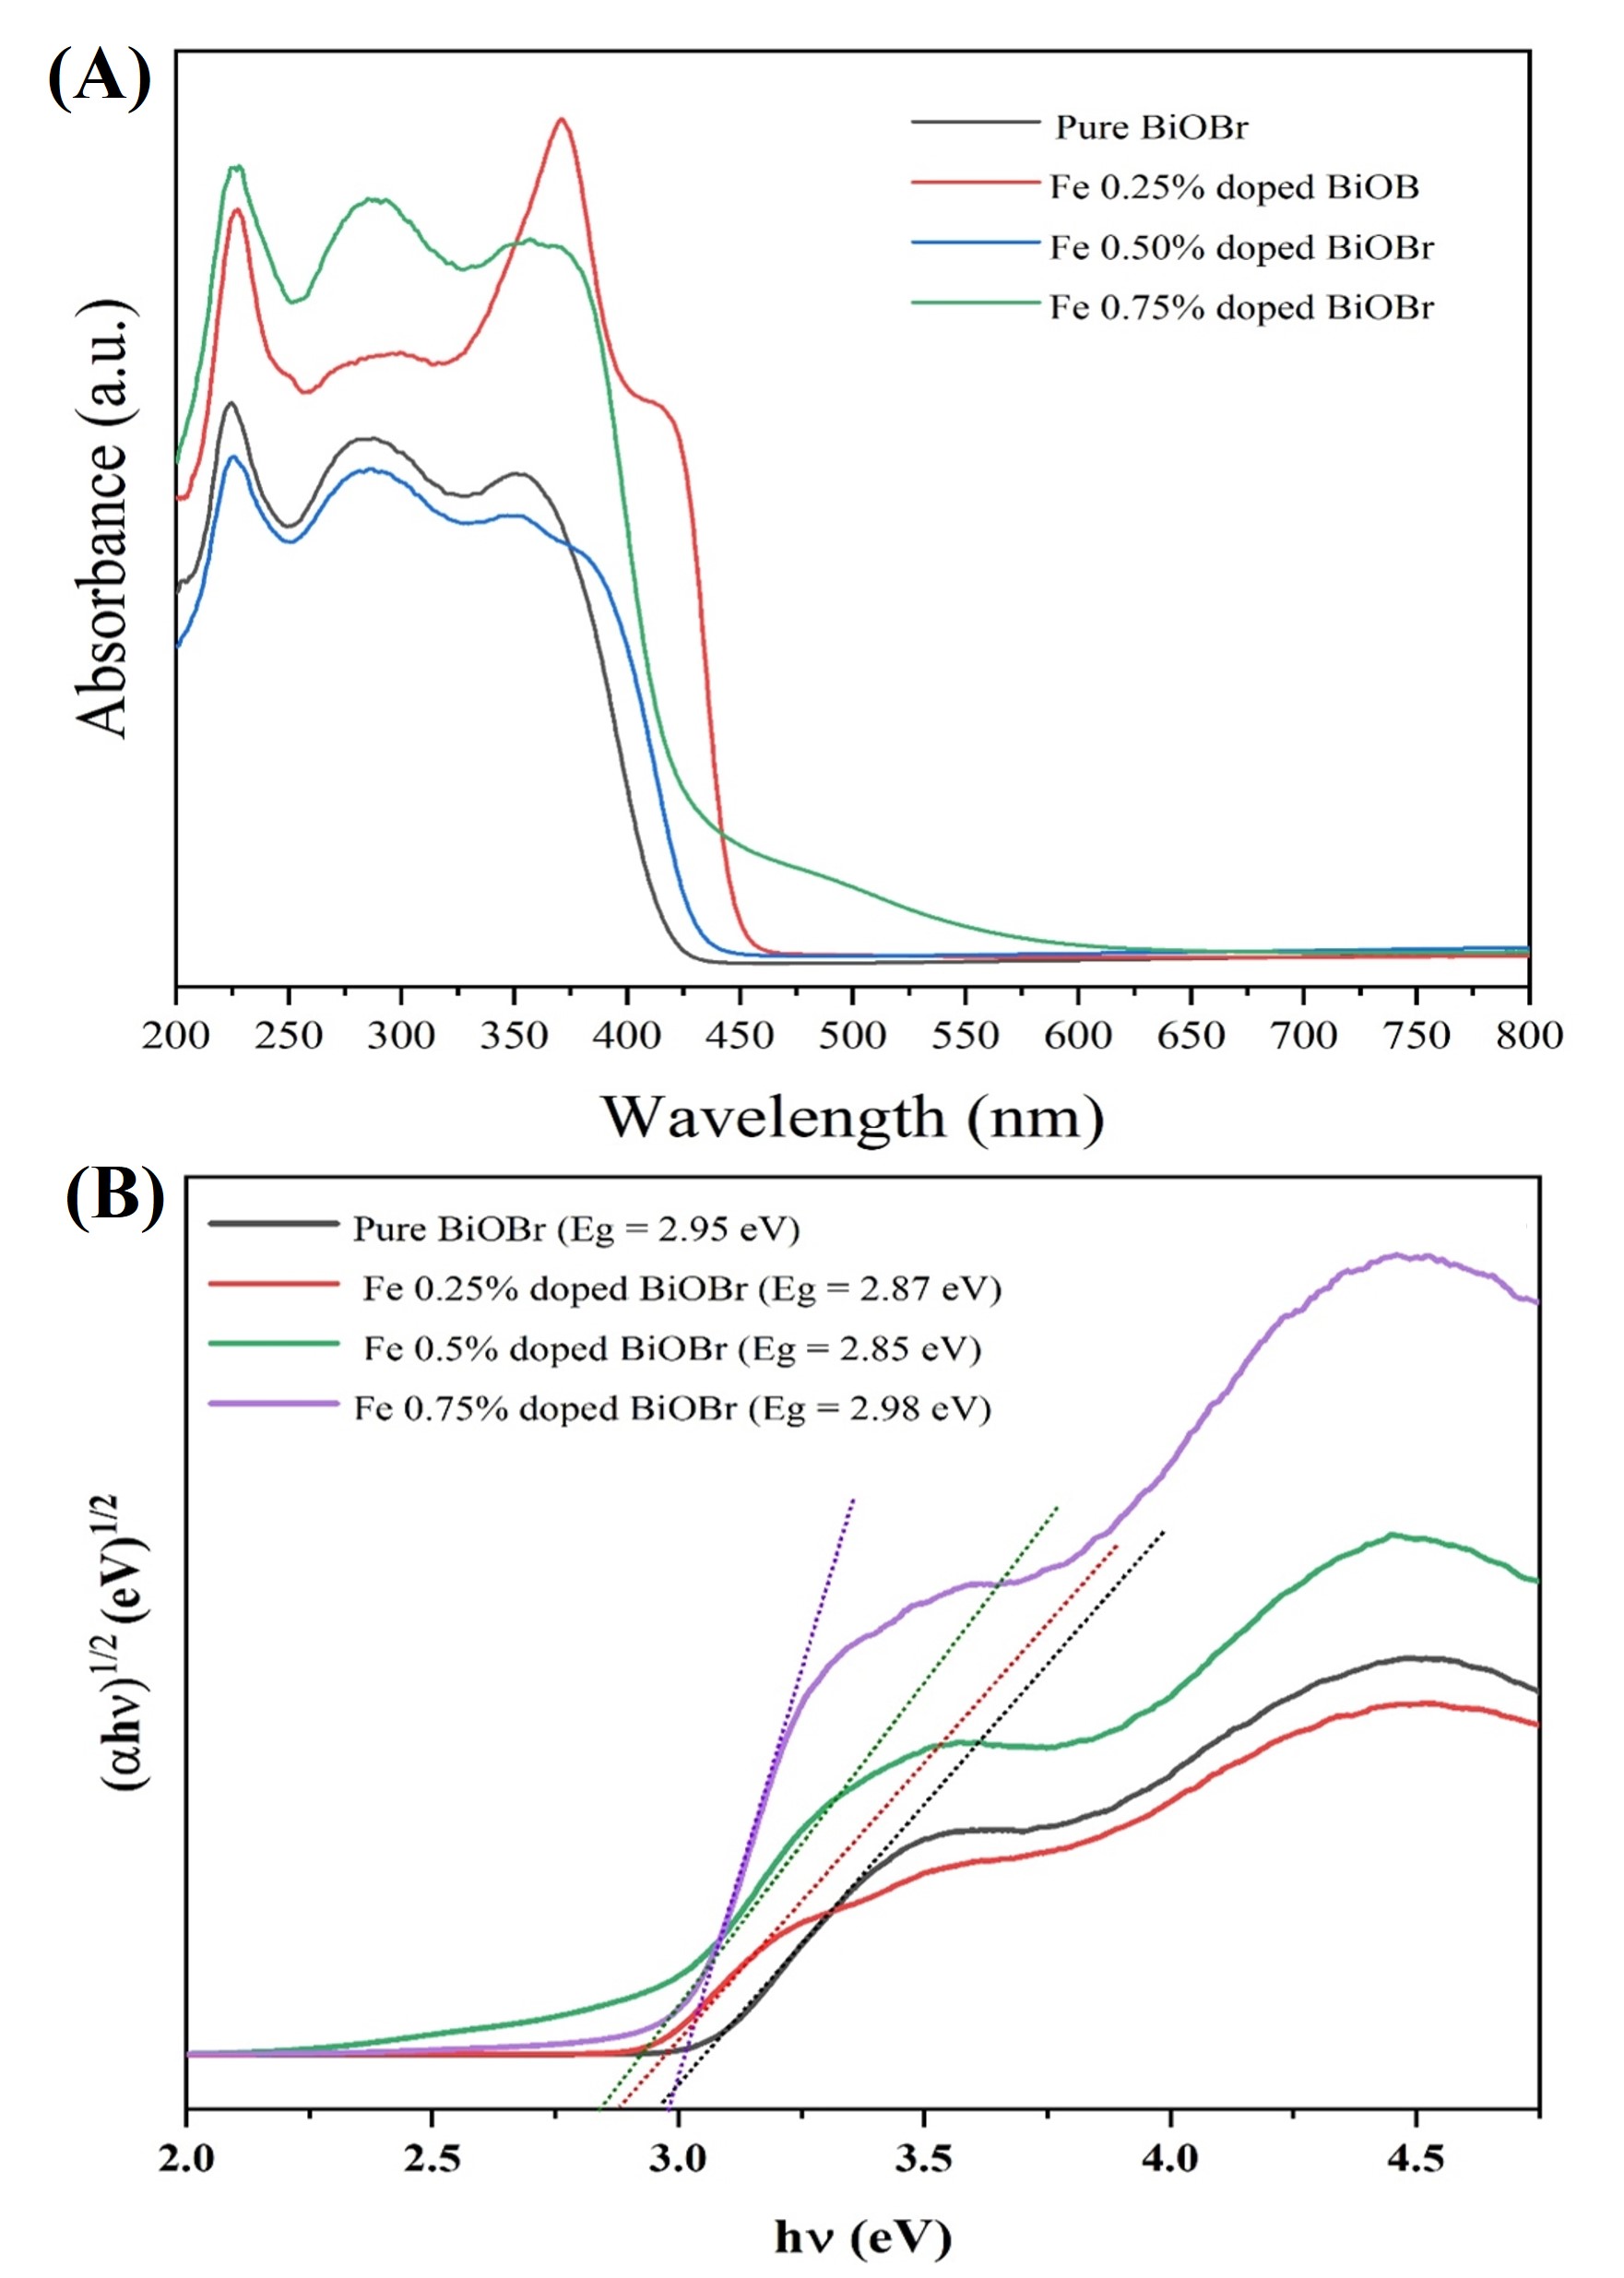 Fig. 8.
UV-Vis absorption and band-gap estimation of pure BiOBr and
Fe-BiOBr. (A) UV-Vis spectra. (B) Tauc plots (
where
The extrapolation of (
where EVBE and Eg represent the valence-band edge and optical band-gap energy, respectively. Based on EVBE = 1.22 eV, Eg = 2.85 eV, the ECBE was calculated to be –1.63 eV. This band alignment demonstrates that Fe incorporation effectively tailors the electronic structure of BiOBr, thereby enhancing its visible-light absorption capacity and charge-carrier separation efficiency, both of which are essential for enhanced photocatalytic performance.
Photoluminescence (PL) spectroscopy was used to investigate the recombination behavior of photogenerated charge carriers in the photocatalysts. In general, lower PL emission intensity reflects suppressed electron-hole recombination and more efficient charge separation, which are favorable for photocatalytic reactions. Fig. 9, presents the PL spectra of pure and Fe-doped BiOBr samples. All samples exhibit a dominant emission peak at approximately 336 nm, which is attributed to the radiative recombination of electron-hole pairs in the BiOBr lattice. Pure BiOBr displays the highest PL intensity, indicating rapid charge-carrier recombination. Upon Fe incorporation, the PL intensity decreases significantly and reaches a minimum at 0.50 mol % Fe doping, demonstrating the most effective suppression of charge recombination and the highest charge separation efficiency [21, 22, 23, 24, 25].
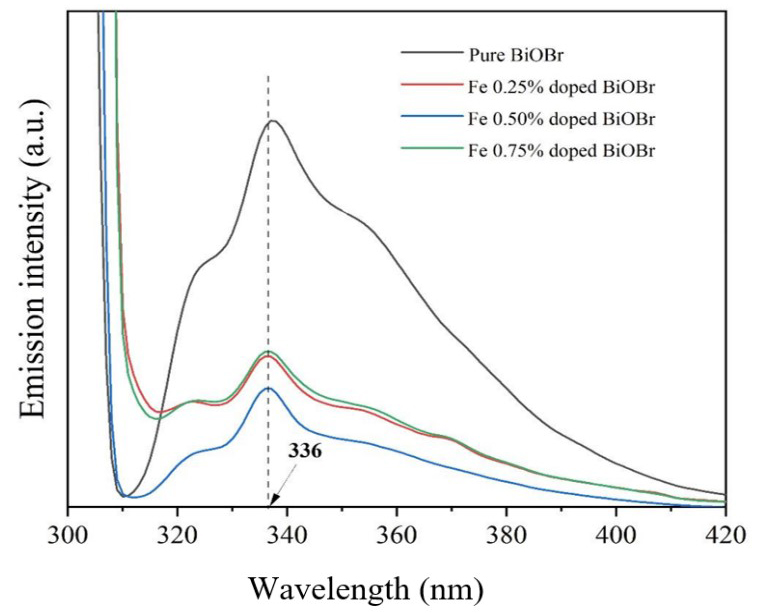 Fig. 9.
PL spectra. PL, photoluminescence.
This improvement is attributed to the Fe3+/Fe2+ redox cycle, in which Fe species act as electron-trapping and transfer centers, facilitating interfacial charge transport and prolonging charge-carrier lifetimes. However, at higher Fe content (0.75 mol %), a slight increase in PL intensity is observed, suggesting that excessive Fe introduces defect-related or non-radiative recombination centers that counteract the beneficial effects of doping. Overall, the PL results confirm that 0.50 mol % Fe-doped BiOBr exhibits the most favorable charge-carrier dynamics for visible-light-driven photocatalysis [26, 27].
The photocatalytic performance of the Fe-doped BiOBr system was evaluated through the degradation of RhB dye under visible light irradiation. The corresponding UV-Vis absorption spectra of the 0.50 mol % Fe-doped BiOBr sample recorded before and after irradiation are presented in Fig. 10. The RhB solution exhibits a distinct absorption maximum at approximately 554 nm, which is a characteristic of its chromophoric structure.
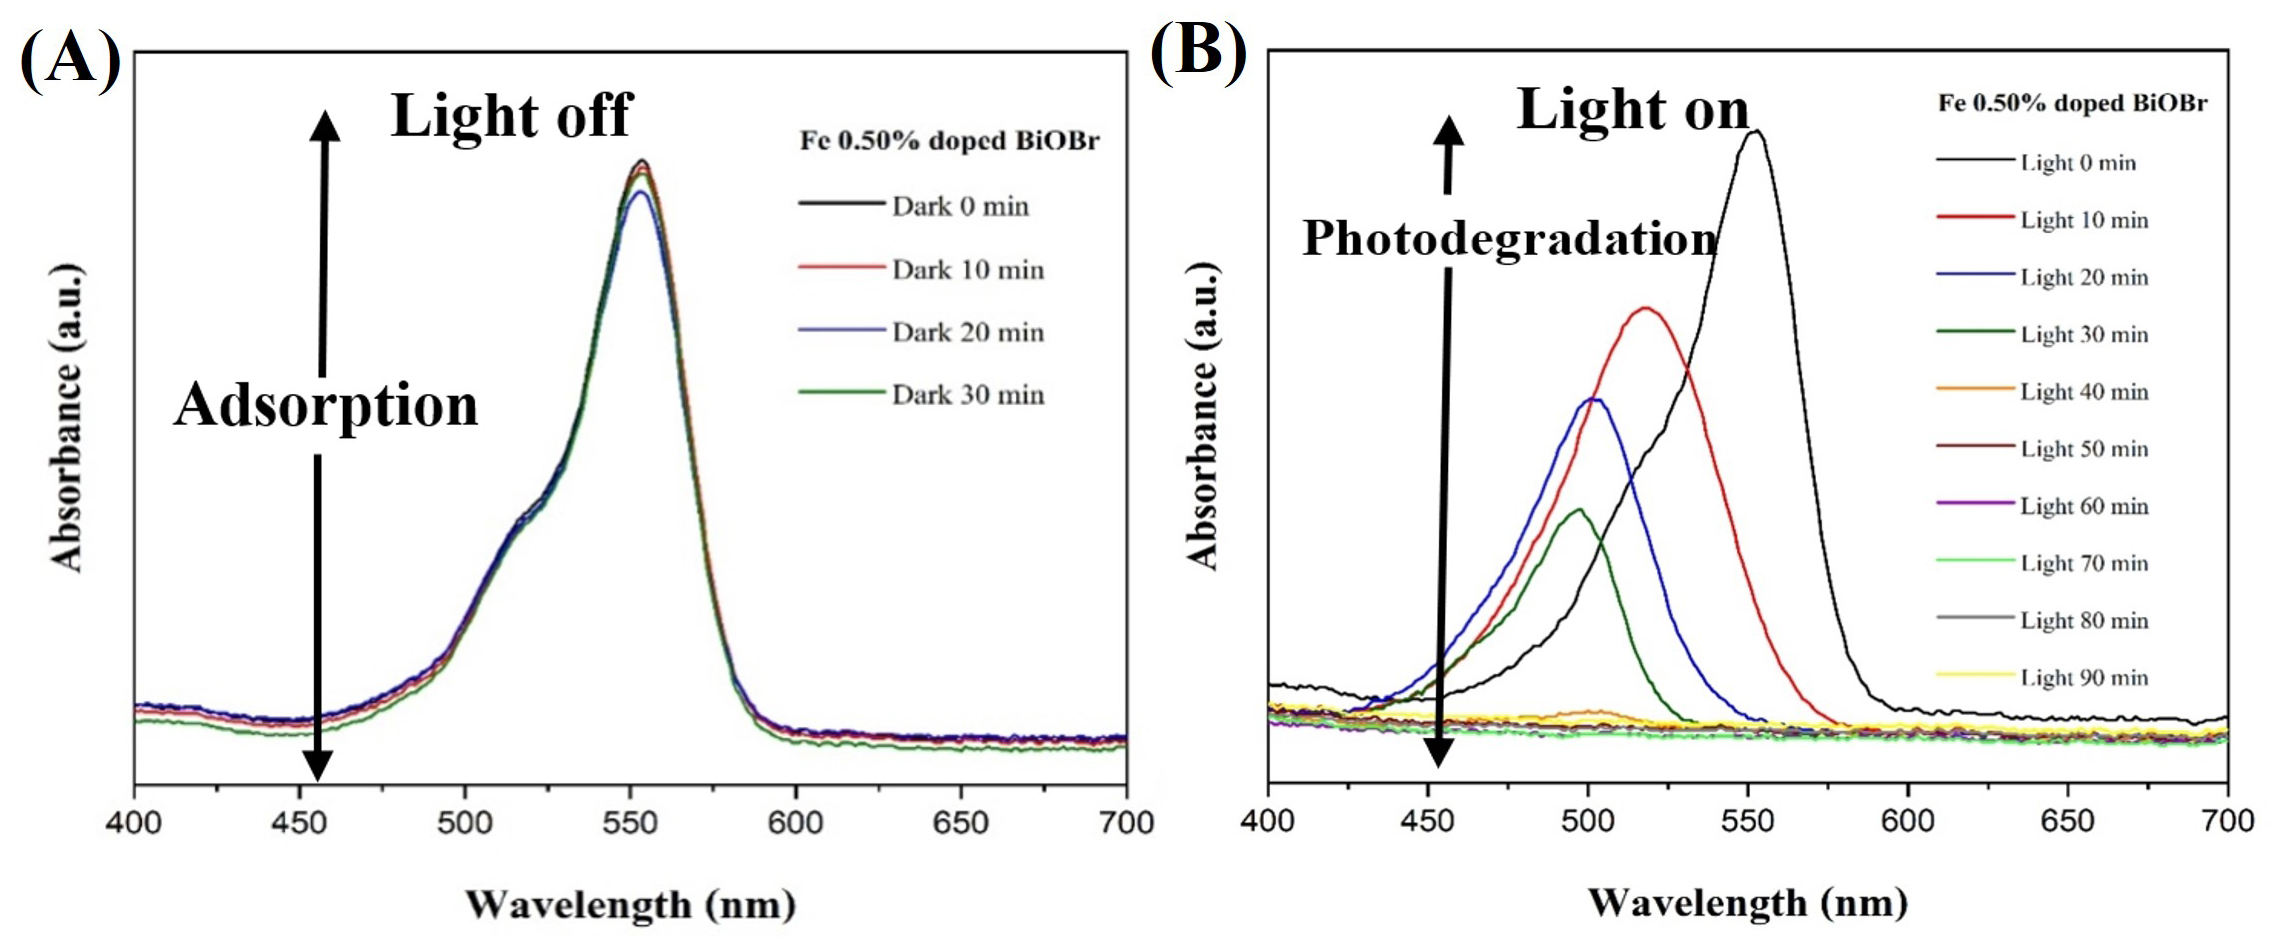 Fig. 10.
Time-dependent UV-Vis spectra of RhB during adsorption and photodegradation over 0.50% Fe-BiOBr. (A) RhB spectra in the dark. (B) Under visible light with 0.5% Fe-BiOBr for 90 min. RhB, Rhodamine B.
Prior to light irradiation, the suspension was kept in the dark for 30 min to achieve adsorption-desorption equilibrium between RhB molecules and the photocatalyst surface. During this period, only a slight decrease in absorbance was observed (Fig. 10A), indicating limited adsorption of dye molecules on the catalyst surface. This behavior suggests weak dark-phase interactions and slow molecular diffusion of RhB toward the BiOBr nanosheets in the absence of photoactivation [28, 29].
Upon visible light irradiation, the absorption intensity at 554 nm decreased progressively with increasing exposure time (Fig. 10B), indicating continuous photodegradation of RhB. A marked decline in intensity during the first 20 min reflects the rapid photoexcitation of charge carriers and efficient generation of reactive oxygen species on the Fe-doped BiOBr photocatalyst surface. Correspondingly, the color of the RhB solution gradually changed from deep pink to nearly colorless, confirming substantial dye decomposition. After approximately 70 min, the main absorption peak at 554 nm nearly disappeared and shifted toward 498 nm, which can be attributed to the stepwise de-ethylation of RhB into rhodamine intermediates [29, 30, 31]. The complete disappearance of absorption bands within the 400–700 nm range after 90 min indicates near-total mineralization of RhB into CO2, H2O, and other inorganic products [32, 33, 34]. These results clearly demonstrate that Fe doping notably enhances the visible-light photocatalytic efficiency of BiOBr, primarily by improving charge separation and accelerating the redox reactions involved in dye degradation. The 0.50 mol % Fe-doped BiOBr sample, in particular, exhibited rapid degradation kinetics, establishing it as an effective photocatalyst for organic pollutant removal under visible-light irradiation.
The decolorization efficiencies of RhB degradation over pure BiOBr and Fe-doped BiOBr under visible light illumination are presented in Fig. 11A. The incorporation of Fe effectively narrows the optical band gap and introduces shallow impurity states, thereby enhancing visible-light absorption and promoting charge-carrier separation. However, excessive Fe doping can introduce recombination centers that deteriorate photocatalytic performance. Pure BiOBr exhibits relatively low photocatalytic activity, with the reaction rate during the initial 50 min remaining slow and reaching a steady state decolorization efficiency of approximately 70%. When 0.25 mol % Fe is introduced, the degradation rate becomes slightly faster than that of pure BiOBr, resulting in a decolorization efficiency of about 75%. This limited improvement indicates that a small amount of dopant provides only a marginal enhancement in photocatalytic performance. In contrast, the 0.50 mol % Fe-doped BiOBr sample shows a pronounced enhancement in photocatalytic activity. A rapid decrease in RhB concentration occurs within the first 20 min of visible light irradiation, demonstrating significantly improved charge carrier separation and transport. This sample maintains high activity throughout the reaction period and achieves more than 95% decolorization. For the 0.75 mol % Fe-doped BiOBr sample, the photocatalytic efficiency decreases compared with the 0.50 mol % sample. Although the degradation performance remains higher than that of pure BiOBr, the decolorization efficiency reaches only about 80%. This decline is attributed to excessive Fe content, which introduces recombination sites and suppresses the beneficial effects of doping. Overall, these results indicate that moderate Fe incorporation provides an optimal balance between enhanced visible light absorption and reduced charge carrier recombination. The kinetic behavior of RhB photodegradation over pure and Fe-doped BiOBr under visible light irradiation was analyzed using a pseudo-first-order reaction model, as described by Eqn. 4.
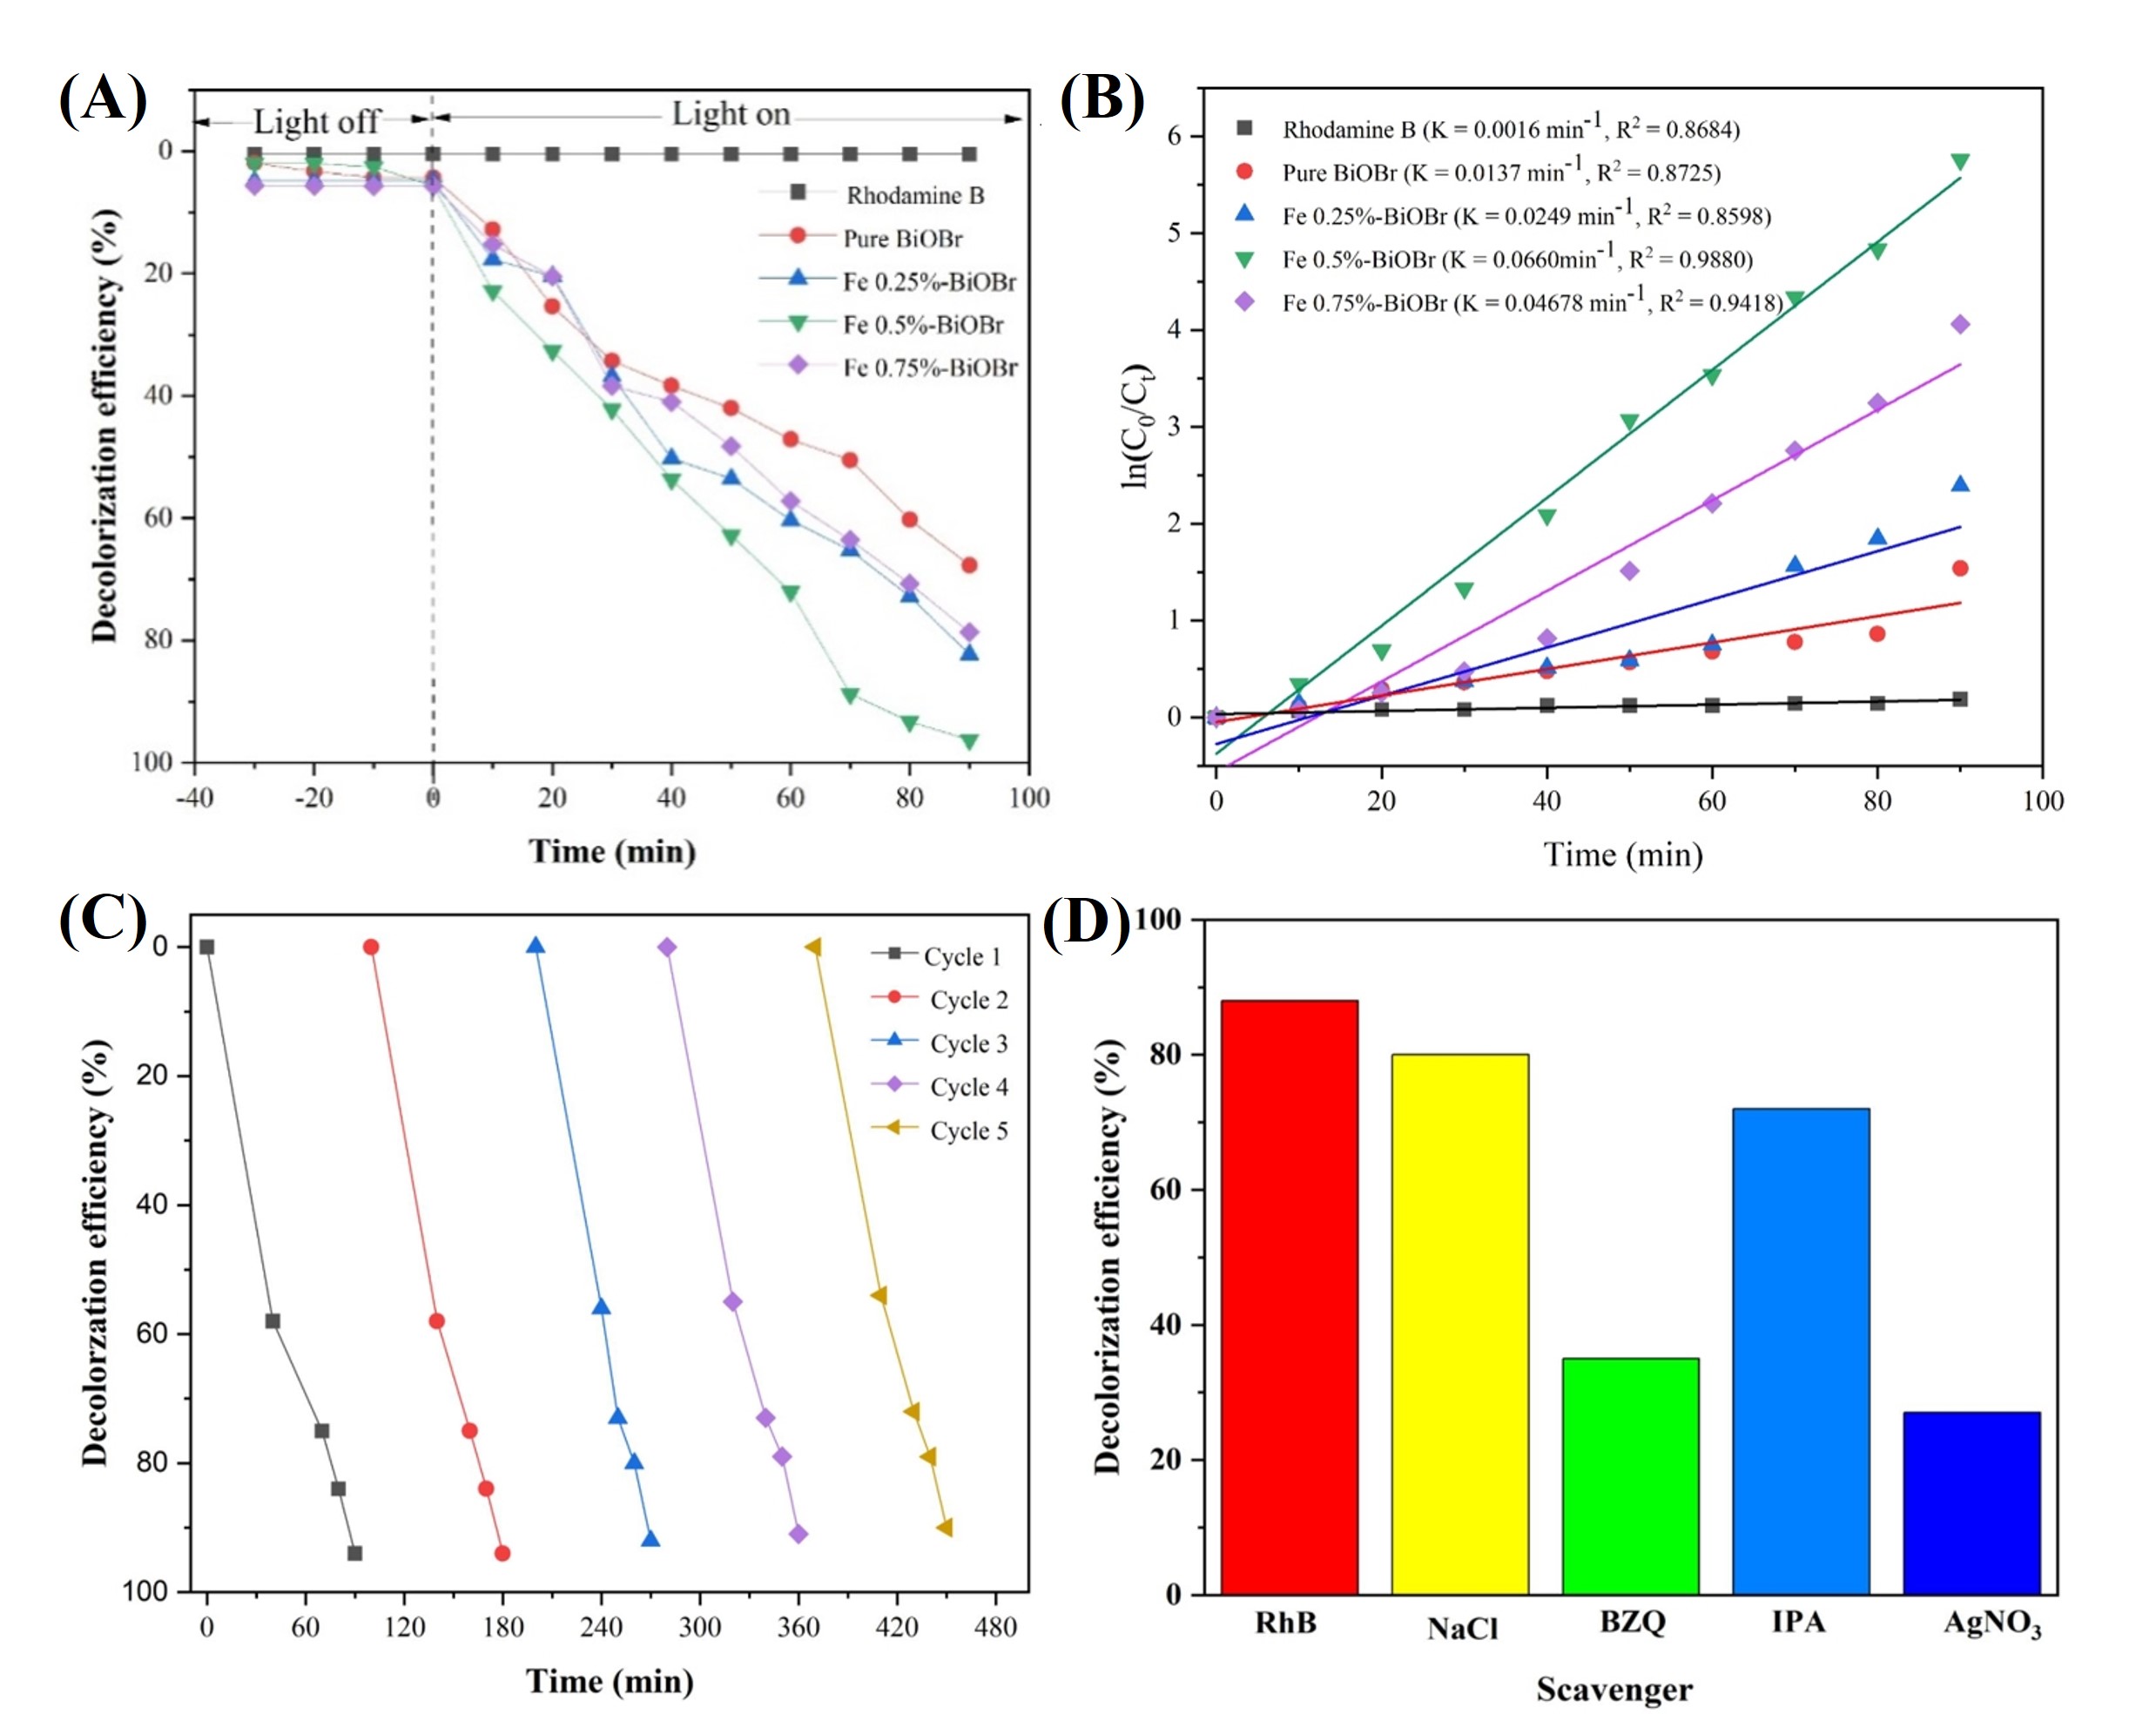 Fig. 11.
Photocatalytic performance and active-species identification for RhB degradation over Fe–BiOBr under visible-light irradiation. (A) Decolorization efficiency. (B) Pseudo-first-order kinetics. (C) Cycling stability. (D) Scavenger effects. BZQ, benzoquinone; IPA, isopropanol.
Where C0 and Ct represent the initial and time-dependent RhB concentrations, respectively, anddenotes the apparent rate constant. Fig. 11B presents the pseudo-first-order kinetic plots for RhB degradation over pure BiOBr and Fe-doped BiOBr photocatalysts under visible-light irradiation. The calculated apparent rate constants clearly demonstrate a strong dependence on Fe doping concentration. The 0.50 mol % Fe-doped BiOBr exhibits the highest rate constant (0.0660 min-1), which is significantly higher than those of 0.75 mol % Fe-doped BiOBr (0.0460 min-1), 0.25 mol % Fe-doped BiOBr (0.0249 min-1), and pure BiOBr (0.0137 min-1). This trend is consistent with the degradation efficiency results, confirming that optimized Fe doping significantly accelerates photocatalytic kinetics rather than merely increasing the final degradation percentage. The superior kinetic performance of the 0.50 mol % Fe-doped BiOBr is attributed to its optimized charge-carrier dynamics. As evidenced by PL analysis, this sample exhibits the lowest PL intensity, indicating the most effective suppression of electron-hole recombination and the highest charge separation efficiency. Enhanced charge separation allows a greater number of photogenerated carriers to participate in surface redox reactions, resulting in an increased reaction rate constant. In contrast, lower Fe content provides insufficient charge trapping sites, while excessive Fe doping (0.75 mol %) introduces defect states that act as recombination centers, thereby reducing kinetic efficiency despite relatively strong light absorption. The structural stability of the 0.50 mol % Fe-doped BiOBr photocatalyst was evaluated through XRD analysis.
As shown in Fig. 11C, the long-term stability and reusability of the 0.50 mol % Fe-doped BiOBr photocatalyst were evaluated through five successive photocatalytic cycles. After each cycle, the catalyst was separated, rinsed, and dried prior to reuse. A slight decrease in degradation efficiency was observed after the fifth cycle, with RhB removal remaining at approximately 90%–92% after about 450 min of irradiation. XRD analysis of the recycled photocatalyst confirmed the preservation of the tetragonal BiOBr crystal structure without the appearance of impurity phases, indicating that no phase transformation or structural degradation occurred during repeated photocatalytic cycles. Radical trapping experiments were conducted to identify the dominant reactive species involved in RhB degradation (Fig. 11D). The addition of p-benzoquinone (BQ) and AgNO3 produced only minor changes in photocatalytic efficiency, suggesting that superoxide radicals (•O2–) and electrons play a limited role in the degradation process. In contrast, the presence of NaCl and isopropanol (IPA) resulted in a significant reduction in degradation efficiency, indicating that photogenerated holes (h+) and hydroxyl radicals (•OH) are the dominant active species in the process. These results confirm that the 0.50 mol % Fe-doped BiOBr photocatalyst has strong reusability and operates primarily through h+ and •OH radicals, highlighting its potential for efficient and sustainable photocatalytic remediation.
The photocatalytic mechanism of Fe-doped BiOBr under visible light irradiation is presented in Fig. 12. The CBE and VBE positions of 0.50 mol % Fe-doped BiOBr were determined to be ECB = –1.63 eV and EVB = 1.22 eV, respectively, with a band gap energy of 2.85 eV. Under visible light irradiation, Fe-doped BiOBr undergoes photoexcitation, generating electron-hole pairs (e–/h+) within its band structure [35]. The photoexcited electrons (e–) in the conduction band (CB) react with dissolved O₂ molecules to generate superoxide radicals (•O2–), because the standard redox potential of O2/•O2– at –0.33 V is more positive than the CBE potential of 0.50 mol % Fe-doped BiOBr photocatalyst [29, 36]. These radicals subsequently transform into hydrogen peroxide (H2O2), which is further reduced to produce highly reactive •OH radicals. Simultaneously, the photogenerated holes (h+) in the valence band directly oxidize the RhB dye molecules to form RhB*. The oxidation of OH– and H2O to generate h+ does not occur because the standard redox potentials of OH–/•OH at +1.23 and H2O/•OH at +2.38 eV are higher than the valence band edge position of the 0.50 mol % Fe-doped BiOBr [26]. The incorporation of Fe3+/Fe2+ in the BiOBr lattice plays a major role in suppressing electron-hole recombination, enhancing charge transfer efficiency [37]. The Fe dopants act as electron mediators and facilitate the interfacial electron transfer through reversible Fe3+/Fe2+ redox cycling, thereby prolonging the lifetime of reactive species [38]. Ultimately, the generated h+ and •OH radicals break down RhB dye molecules into less harmful intermediates, which are further mineralized into CO2 and H2O, as summarized in the following equations [39, 40].
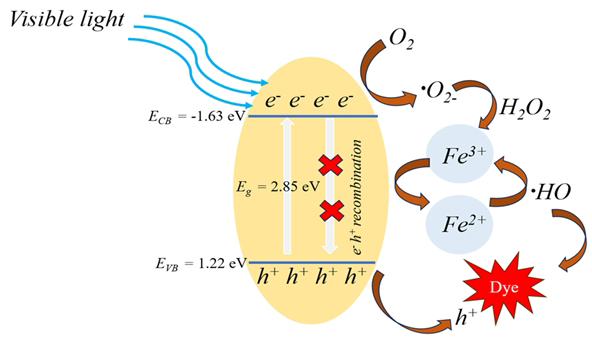 Fig. 12.
Proposed mechanism under visible light.
The structural stability of the 0.50 mol % Fe-doped BiOBr photocatalyst was evaluated through XRD analysis before and after five consecutive photocatalytic cycles, as presented in Fig. 13. The diffraction patterns of both fresh and reused samples exhibit identical characteristic peaks corresponding to the tetragonal BiOBr phase (JCPDS No. 90-0393), with no detectable secondary phases or impurity reflections. After repeated cycles, only a slight decrease in peak intensity is observed, while the peak positions remain unchanged, indicating that the crystal structure of Fe-doped BiOBr is well preserved. These results confirm that the photocatalyst maintains high phase stability and excellent structural integrity under visible-light irradiation. Overall, the negligible variation in XRD patterns after five cycles demonstrates the robustness and recyclability of Fe-doped BiOBr, highlighting its suitability as a durable photocatalyst for long-term visible-light-driven wastewater treatment applications.
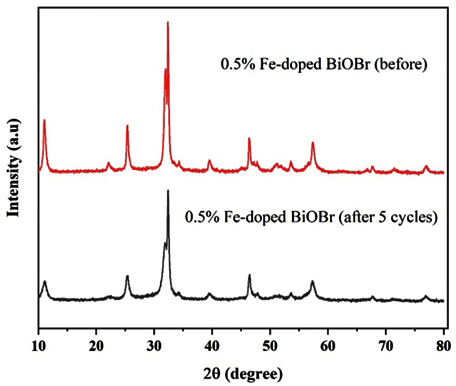 Fig. 13.
XRD of 0.5% Fe-BiOBr before/after five cycles.
Although Fe-doped BiOBr nanostructures exhibited enhanced visible-light-driven photocatalytic performance, several limitations should be acknowledged. First, the photocatalytic activity was evaluated using a single model organic dye (Rhodamine B) under controlled laboratory conditions, which may not fully represent the complexity of real wastewater systems containing mixed organic and inorganic pollutants. Second, although the proposed photocatalytic mechanism is supported by band structure analysis, photoluminescence results, and radical scavenging experiments, direct identification of intermediate species during the degradation process was not performed. In addition, long-term stability and large-scale applicability of the photocatalyst were not investigated within the scope of this study. Future work will focus on evaluating the photocatalytic performance under real wastewater conditions, assessing long-term durability, and exploring scalable synthesis routes for practical environmental remediation applications.
Fe-doped BiOBr photocatalysts with Fe concentrations ranging from 0 to 0.75 mol % were successfully synthesized via a microwave-assisted method at 450 W for 10 min. Among all samples, 0.50 mol % Fe-doped BiOBr exhibited the highest photocatalytic performance, achieving 96.26% degradation of Rhodamine B under visible-light irradiation. The enhanced performance is attributed to improved charge carrier separation, improved visible-light absorption, and effective suppression of electron–hole recombination induced by optimal Fe incorporation. In addition, the 0.50 mol % Fe-doped BiOBr photocatalyst demonstrated excellent structural stability and resistance to photocorrosion over repeated photocatalytic cycles. Radical scavenging experiments confirmed that photogenerated holes (h+) and hydroxyl radicals (•OH) are the dominant reactive species governing the degradation process. Overall, these results indicate that optimally Fe-doped BiOBr is a stable and efficient photocatalyst with strong potential for wastewater treatment applications.
The data supporting the findings and methodologies presented in this study are available from the corresponding author upon reasonable request. Any additional materials referenced in this article are publicly accessible.
TP conceived and designed the study. TP, RS, WK, and SK performed the experiments, including material synthesis and characterization. RS and WK carried out the photocatalytic tests and data collection. TP and SK analyzed and interpreted the data and prepared the figures. ST, TT, and SW provided supervision, resources, and critical advice. TP drafted the manuscript. All authors contributed to the critical revision of the manuscript for important intellectual content. All authors read and approved the final manuscript and agree to be accountable for all aspects of the work.
Not applicable.
The authors gratefully acknowledge the Materials Science Research Center, Faculty of Science, Chiang Mai University, for providing access to the facilities and resources used in this study.
This research received no external funding.
The authors declare no conflict of interest.
References
Publisher’s Note: IMR Press stays neutral with regard to jurisdictional claims in published maps and institutional affiliations.