


1 Institute of Biotechnology and Food Technology, Industrial University of Ho Chi Minh City, 700000 Ho Chi Minh City, Vietnam
Abstract
In this study, for the first time, anomalous properties of the nanosized potassium dihydrogen phosphate (KDP) introduced in nanochannels of bacterial cellulose (40–80 nm) produced by Acetobacter xylinum were investigated. The temperature range was established at different points ranging from 110 K to 250 K. Data for the pure conventional KDP were also analyzed for comparison. Scanning electron microscopy (SEM), X-ray diffraction (XRD) and Fourier-transform infrared spectroscopy (FTIR) techniques were used to explore structural changes under the nanoconfinement conditions of KDP. It was figured out that the nanosized KDP exhibited several anomalies in comparison with those of KDP crystals in normal size, including a significant increase in phase transition by approximately 13.8 K, the rise of relaxation times and activation energies in both polar and non-polar phases. The structural modifications related to hydrogen bonds formed between bacterial cellulose and KDP components were found to be responsible for the observed anomalies.
Keywords
- potassium dihydrogen phosphate
- bacterial cellulose
- Acetobacter xylinum
- phase transition
- hydrogen bonds
Bacterial cellulose (BC) exhibits several outstanding characteristics compared to conventional cellulose, including high purity, high crystallinity, and an exceptional holding capacity to retain hydrogen-bonding substances [1, 2, 3, 4, 5, 6, 7, 8]. In comparison with plant-derived cellulose, BC typically possesses higher purity and can be synthesized more readily. For plant-derived cellulose, the processing procedure is more complex, as it requires the removal of numerous impurities and the elimination of the amorphous phase. Commonly, BC is known as a stabilizer and a fat replacer in making foods [5], or as an ingredient in biomedical applications [6, 7]. Another less-addressed aspect is that BC also plays a crucial role as a green polymer for the fabrication of flexible devices [8, 9], in which the constituent materials predominantly exist in the form of BC-based composites. This poses a challenge for researchers, requiring continuous improvement of material properties to meet desired future functionalities.
Structurally, BC contains interconnected nanochannels formed by entangled nanofibers, creating a porous 3D network that facilitates molecular diffusion. As a result, substances can be embedded into cellulose nanochannels and confined at the nanoscale. Due to size effects and interactions with cellulose channel walls, useful anomalies may appear. For instance, in studies [10, 11], the authors used ferroelectrics of NaNO2 and KIO3 to confine within cellulose nanochannels. The results revealed that the phase transition in NaNO2 was shifted toward lower temperatures due to the size effects created by the enhanced mobility of ions at the nanoscale [10]. Conversely, once these interactions became dominant, the ferroelectric structure was reinforced, leading to an increase in the phase transition temperature [11]. The detected anomalies can be highly valuable for practical applications.
Potassium dihydrogen phosphate (KDP, KH2PO4) is an inorganic ferroelectric widely employed in various advanced technologies, where it is typically utilized in the conventional crystalline form [12, 13, 14]. The phase transition point of KDP from polar to non-polar phases is relatively low (Tc = 123 K) [15], and therefore its applications are mostly focused on the non-polar phase at room temperature. To date, the practical applications of bulk KDP have largely reached a plateau. In this context, downsizing it to the nanoscale is an effective approach that has been increasingly adopted by researchers to enable new functionalities. However, there has been very limited fundamental research addressing the properties of KDP at the nanoscale [16, 17]. Consequently, the nanoscale properties of KDP remain insufficiently understood. This represents a significant gap in both fundamental knowledge and the potential applications of nanosized KDP.
As far as we are concerned, the nanoconfinement of ferroelectrics in BC was reported in literature, where triglycine sulfate was used [18]. However, the ferroelectric material KDP has not been employed to fill in BC yet. The only study on the combination of KDP with cellulose can be found in the work [19] but the used cellulose was not BC. In addition, the KDP component in this composite grew to a size far larger than nanoscale. The present work aims to fill this gap by downsizing the size of KDP to the nanoscale within the nanochannels of BC. Beyond the novelty, the idea of incorporating KDP into BC is particularly intriguing because KDP contains hydrogen bonds and therefore, its interaction with a naturally hydrogen-bonded matrix, such as BC may create interesting anomalous behaviors. Specifically, a comparative study is conducted by simultaneously analyzing the data of structural characteristics, phase transition behavior, relaxation times and activation energies for both pure KDP at normal size and its nanosized form in BC nanochannels. The structural and property-related anomalies are discussed in detail.
The nanosized KDP was obtained by infiltrating it into cellulose nanochannels. The cellulose-containing nanochannels with diameters ranging from 40 to 80 nm were biosynthesized by the bacteria Acetobacter xylinum following a common procedure [20]. The pure KDP was purchased from Sigma-Aldrich and used as received without further purification. However, for this study, both KDP and Acetobacter xylinum cellulose (AxBC) were carefully characterized before preparation of the AxBC/KDP composite using scanning electron microscopy (SEM), X-ray diffraction (XRD) and Fourier-transform infrared spectroscopy (FTIR) techniques.
Because the as-prepared AxBC was stored in distilled water, it was
gradually solvent-exchanged into acetone prior to the filling process to achieve
more stable rafting porosity and to minimize the shrinkage of the cellulose
nanochannels. Subsequently, a room-temperature saturated KDP solution was
dropwise added to the AxBC/acetone mixture. The resulting
AxBC/acetone/KDP/water suspension was then placed in a vacuum chamber at
a low pressure of 100 kPa until acetone bubbles ceased to form. Finally, natural
evaporation yielded the AxBC/KDP composite. After partial drying, the
AxBC/KDP samples were immersed and gently agitated in ethanol for
approximately 10 seconds and subsequently blown with nitrogen gas to remove
residual KDP adhering to the surface. The obtained samples were dried at 105
°C for 1 h to remove excess moisture. To determine the filling level,
the samples were immersed in boiling water for 4 h to gradually remove KDP from
the BC matrix. The recovered BC was then completely dried and weighed again, and
the mass was compared with that of the composite sample. The results indicated
that the filling loading ranged from approximately 36–55 wt%. The sample
selected for the present study corresponds to a loading of 55 wt%. After
preparation, the samples were stored in a humidity-controlled chamber. For
electrophysical parameter measurements, the samples were cut into square pieces
with lateral dimensions of 3
The morphology was captured on a field emission scanning electron microscope (FE-SEM S-4800, Hitachi High-Tech Corporation, Tokyo, Japan). The crystalline structure and functional groups of materials were explored by an X-ray diffractometer (Rigaku Ultima IV, Rigaku Corporation, Tokyo, Japan) and an infrared spectrometer (Bruker Tensor 37, Bruker Corp., MA, USA). For the testing phase transition, a combined system consisting of an inductance-capacitance-resistance (LCR) meter (GW Instek LCR-821, Accusource Electronics Inc., Newark, DE, USA) with a cooling module using liquid nitrogen was employed. This module was also used to connect an impedance gain/phase analyzer (Solartron-1260A, Ametek Co., Ltd., Berwyn, PA, USA) to obtain frequency dependences of the permittivity at different temperatures. The experimental results shown in this study were measured at least three times with an error not exceeding 0.1%.
The morphology of AxBC and the AxBC/KDP samples is shown in Fig. 1. As described above, the residual KDP was removed from the surface of BC after filling and drying. Therefore, the SEM images do not reveal the confined KDP within the BC nanotubes. Due to the softness of cellulose, it is nearly impossible to capture images clearly showing the nanotube openings. For this reason, as reported in the preparation process, the KDP filling percentage was determined by comparing the mass of BC after KDP removal with that of the initial composite sample. What we can see in the surface pattern is the nanochannel shape, the diameter of which is estimated to be in the range of approximately 40–80 nm. Importantly, based on the mass difference and the characteristic phase transition for KDP as shown below in this study, we believe that KDP has been successfully incorporated into the nanotubes.
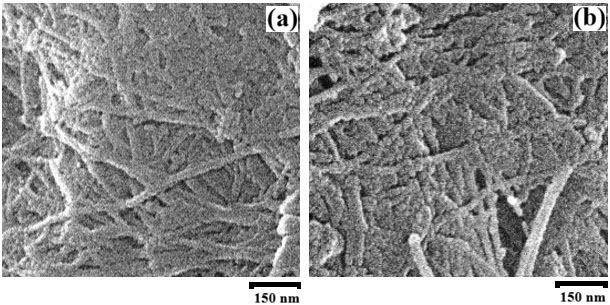 Fig. 1.
SEM images for the AxBC (a) and AxBC/KDP (b) samples. SEM, scanning electron microscopy; AxBC, Acetobacter xylinum cellulose; KDP, potassium dihydrogen phosphate. Scale bar = 150 nm.
The results for crystalline structures and functional groups of KDP,
AxBC and the composite of KDP confined in AxBC at 250 K are
shown in Fig. 2. As shown in Fig. 2a, the pure KDP contains characteristic XRD
peaks, including 2
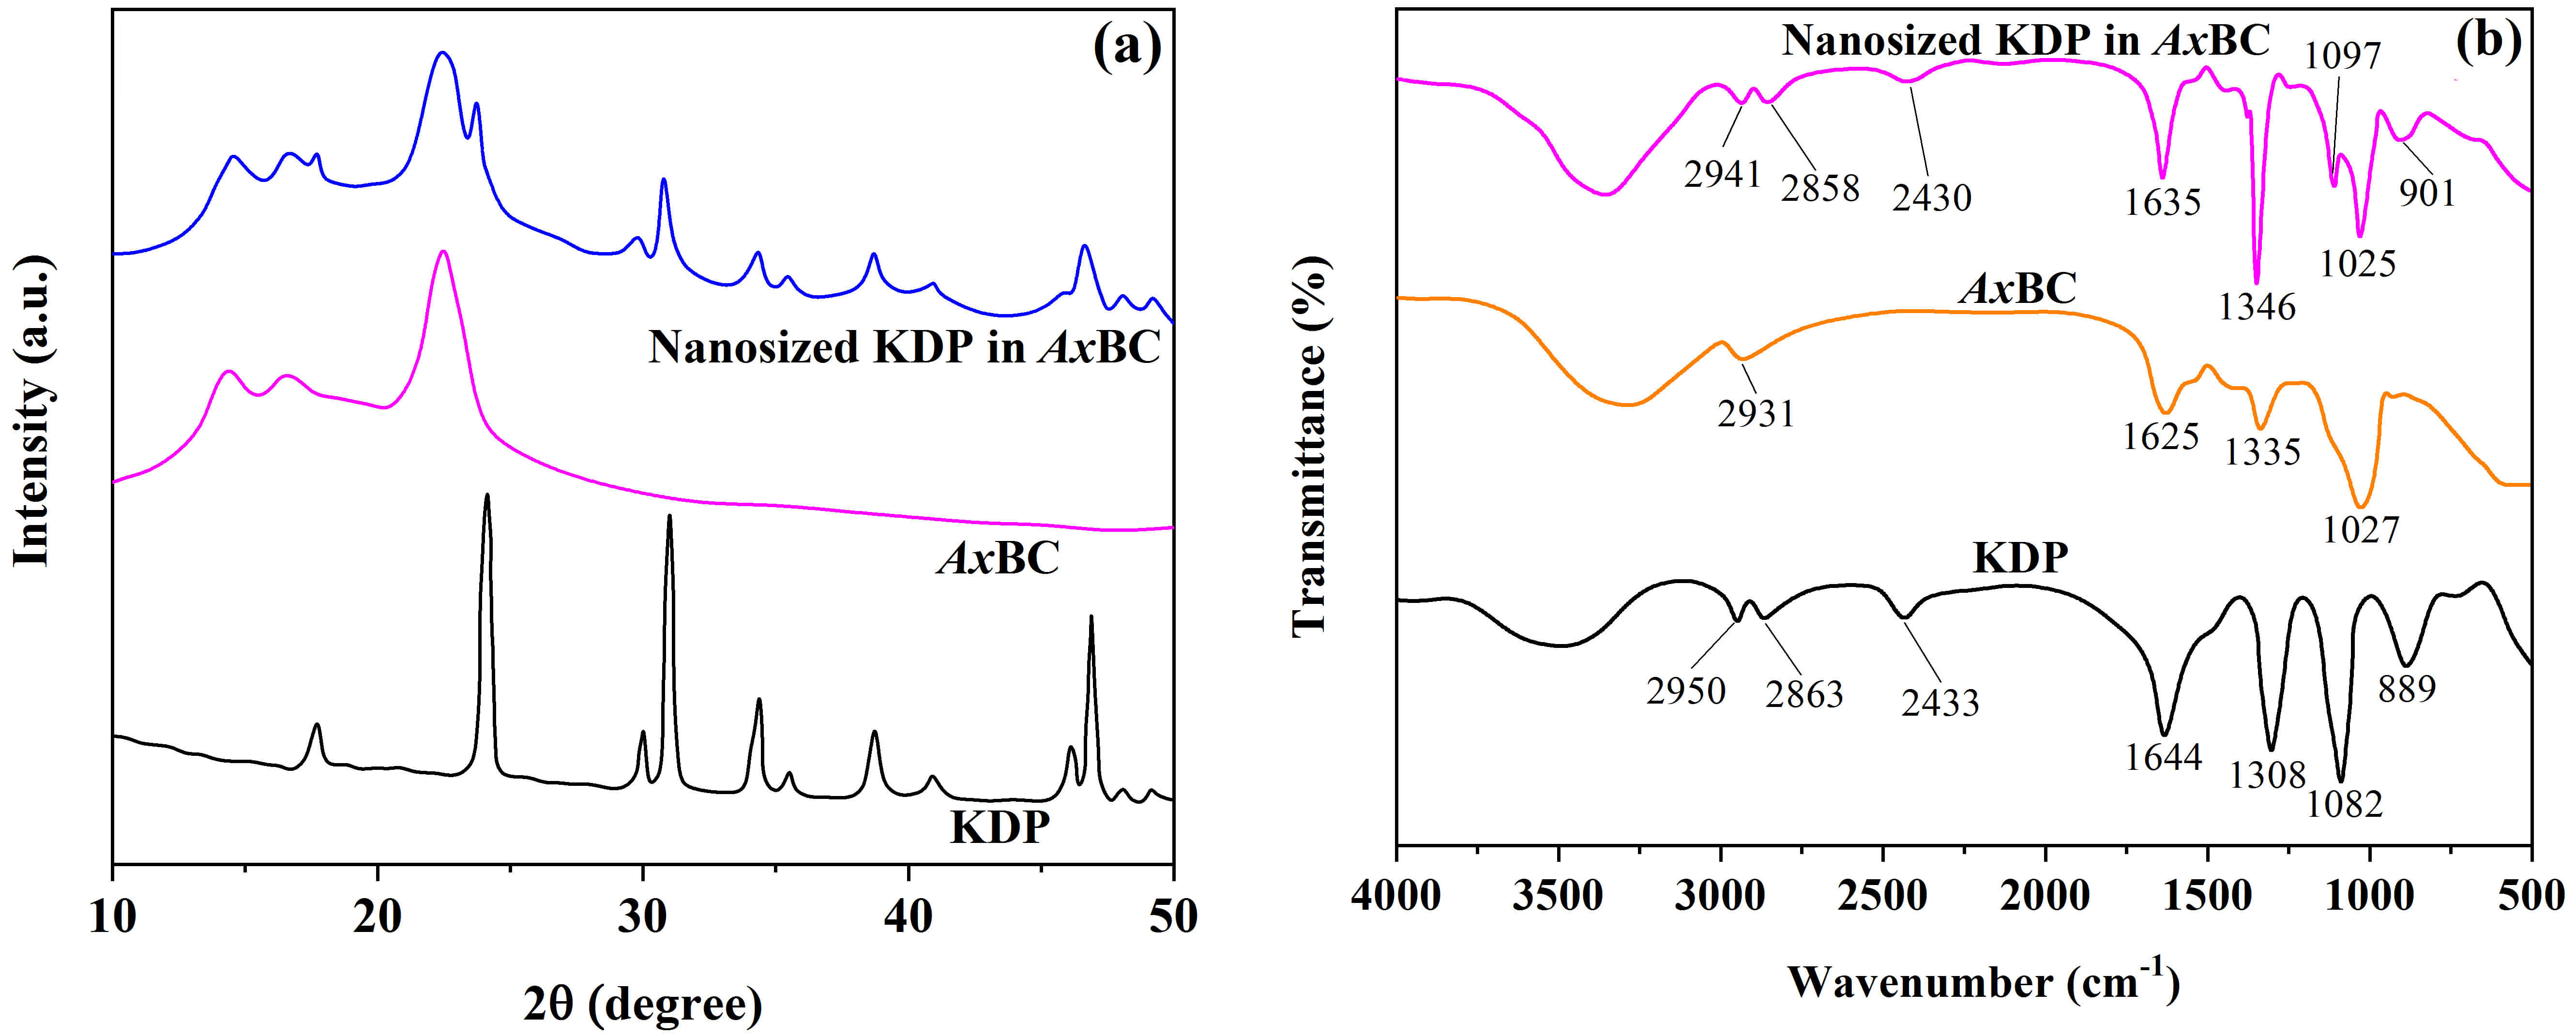 Fig. 2.
XRD (a) and FTIR (b) data for samples of KDP, AxBC and nanosized KDP in AxBC at the temperature of 250 K. FTIR, Fourier-transform infrared spectroscopy; XRD, X-ray diffraction.
Let us consider the structural changes in samples of KDP-filled in AxBC as compared to those of the pure AxBC and KDP. Based on the results obtained, several significant shifts of the AxBC and KDP components in the composite medium were detected in both XRD pattern (Fig. 2a) and FTIR spectrum (Fig. 2b). Firstly, under nanoconfinement conditions in AxBC nanochannels, two XRD peaks of KDP including 24.2° (200) and 30.9° (112) were found to move to 24.0° and 30.8°, respectively. This indicates that the crystalline structure of KDP was affected at the nanoscale. Meanwhile, the FTIR spectra of KDP-filled samples also demonstrated overlapping and movement. For instance, the peak of 1308 cm-1 ([H2PO4]–, KDP) overlapped with 1335 cm-1 (-OH in-plane bending, AxBC), moved to 1346 cm-1, and became deeper at the new position. Besides, the peak of 1632 cm-1 (P=O, KDP) overlapped with 1625 cm-1 (-COOH, AxBC) and moved to a new position of 1635 cm-1. Importantly, the valley of 3500–2800 cm-1 created by hydrogen bonds and possible residual water became deeper and wider in the case of AxBC/KDP composite. This anomaly was observed for all synthesized composite samples, proving the formation of new hydrogen bonds between cellulose and nanosized KDP. Other XRD and FTIR peaks of AxBC and KDP components retained their positions in the composite state.
At the nanoscale, an anomalous transition from polar to non-polar phases of KDP
was also detected when analyzing temperature-dependent permittivity
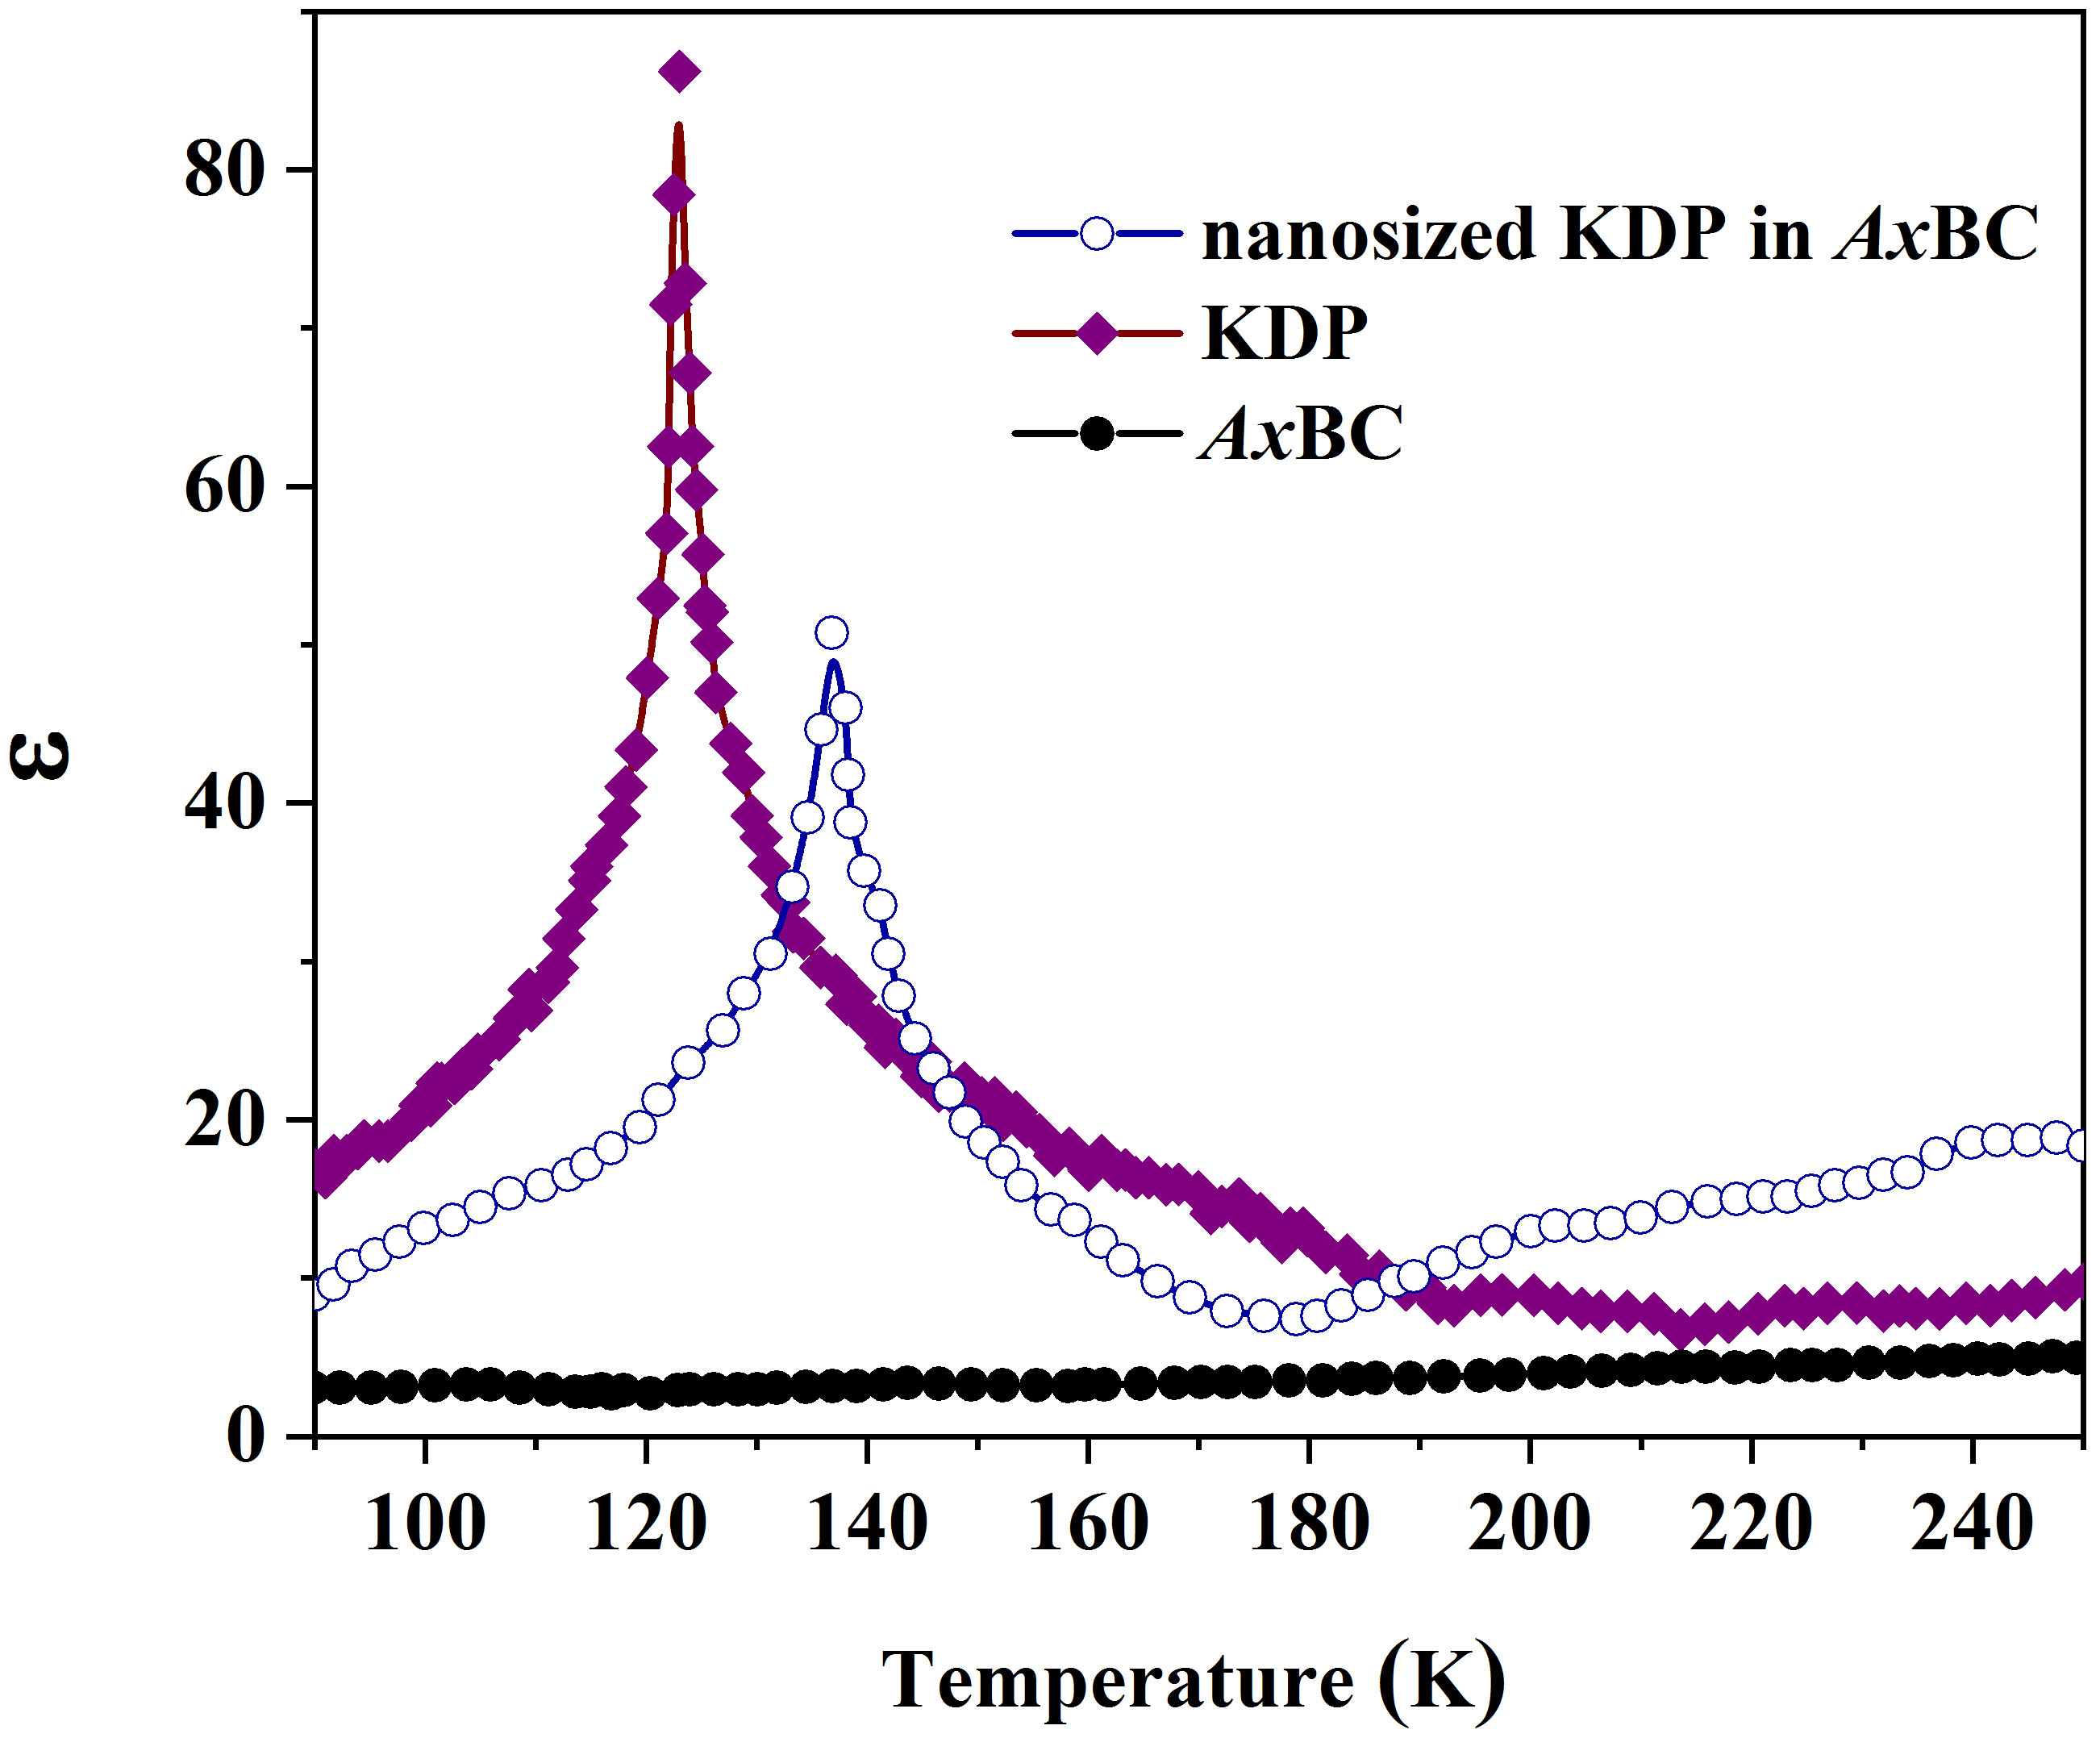 Fig. 3.
Temperature dependences of the real part of permittivity of AxBC, pure KDP and nanosized KDP in the AxBC matrix.
To further clarify the anomalies observed in the nanosized KDP, the relaxation
times and activation energies were also determined. To achieve this, the pure KDP
and AxBC/KDP samples were tested for the real
where
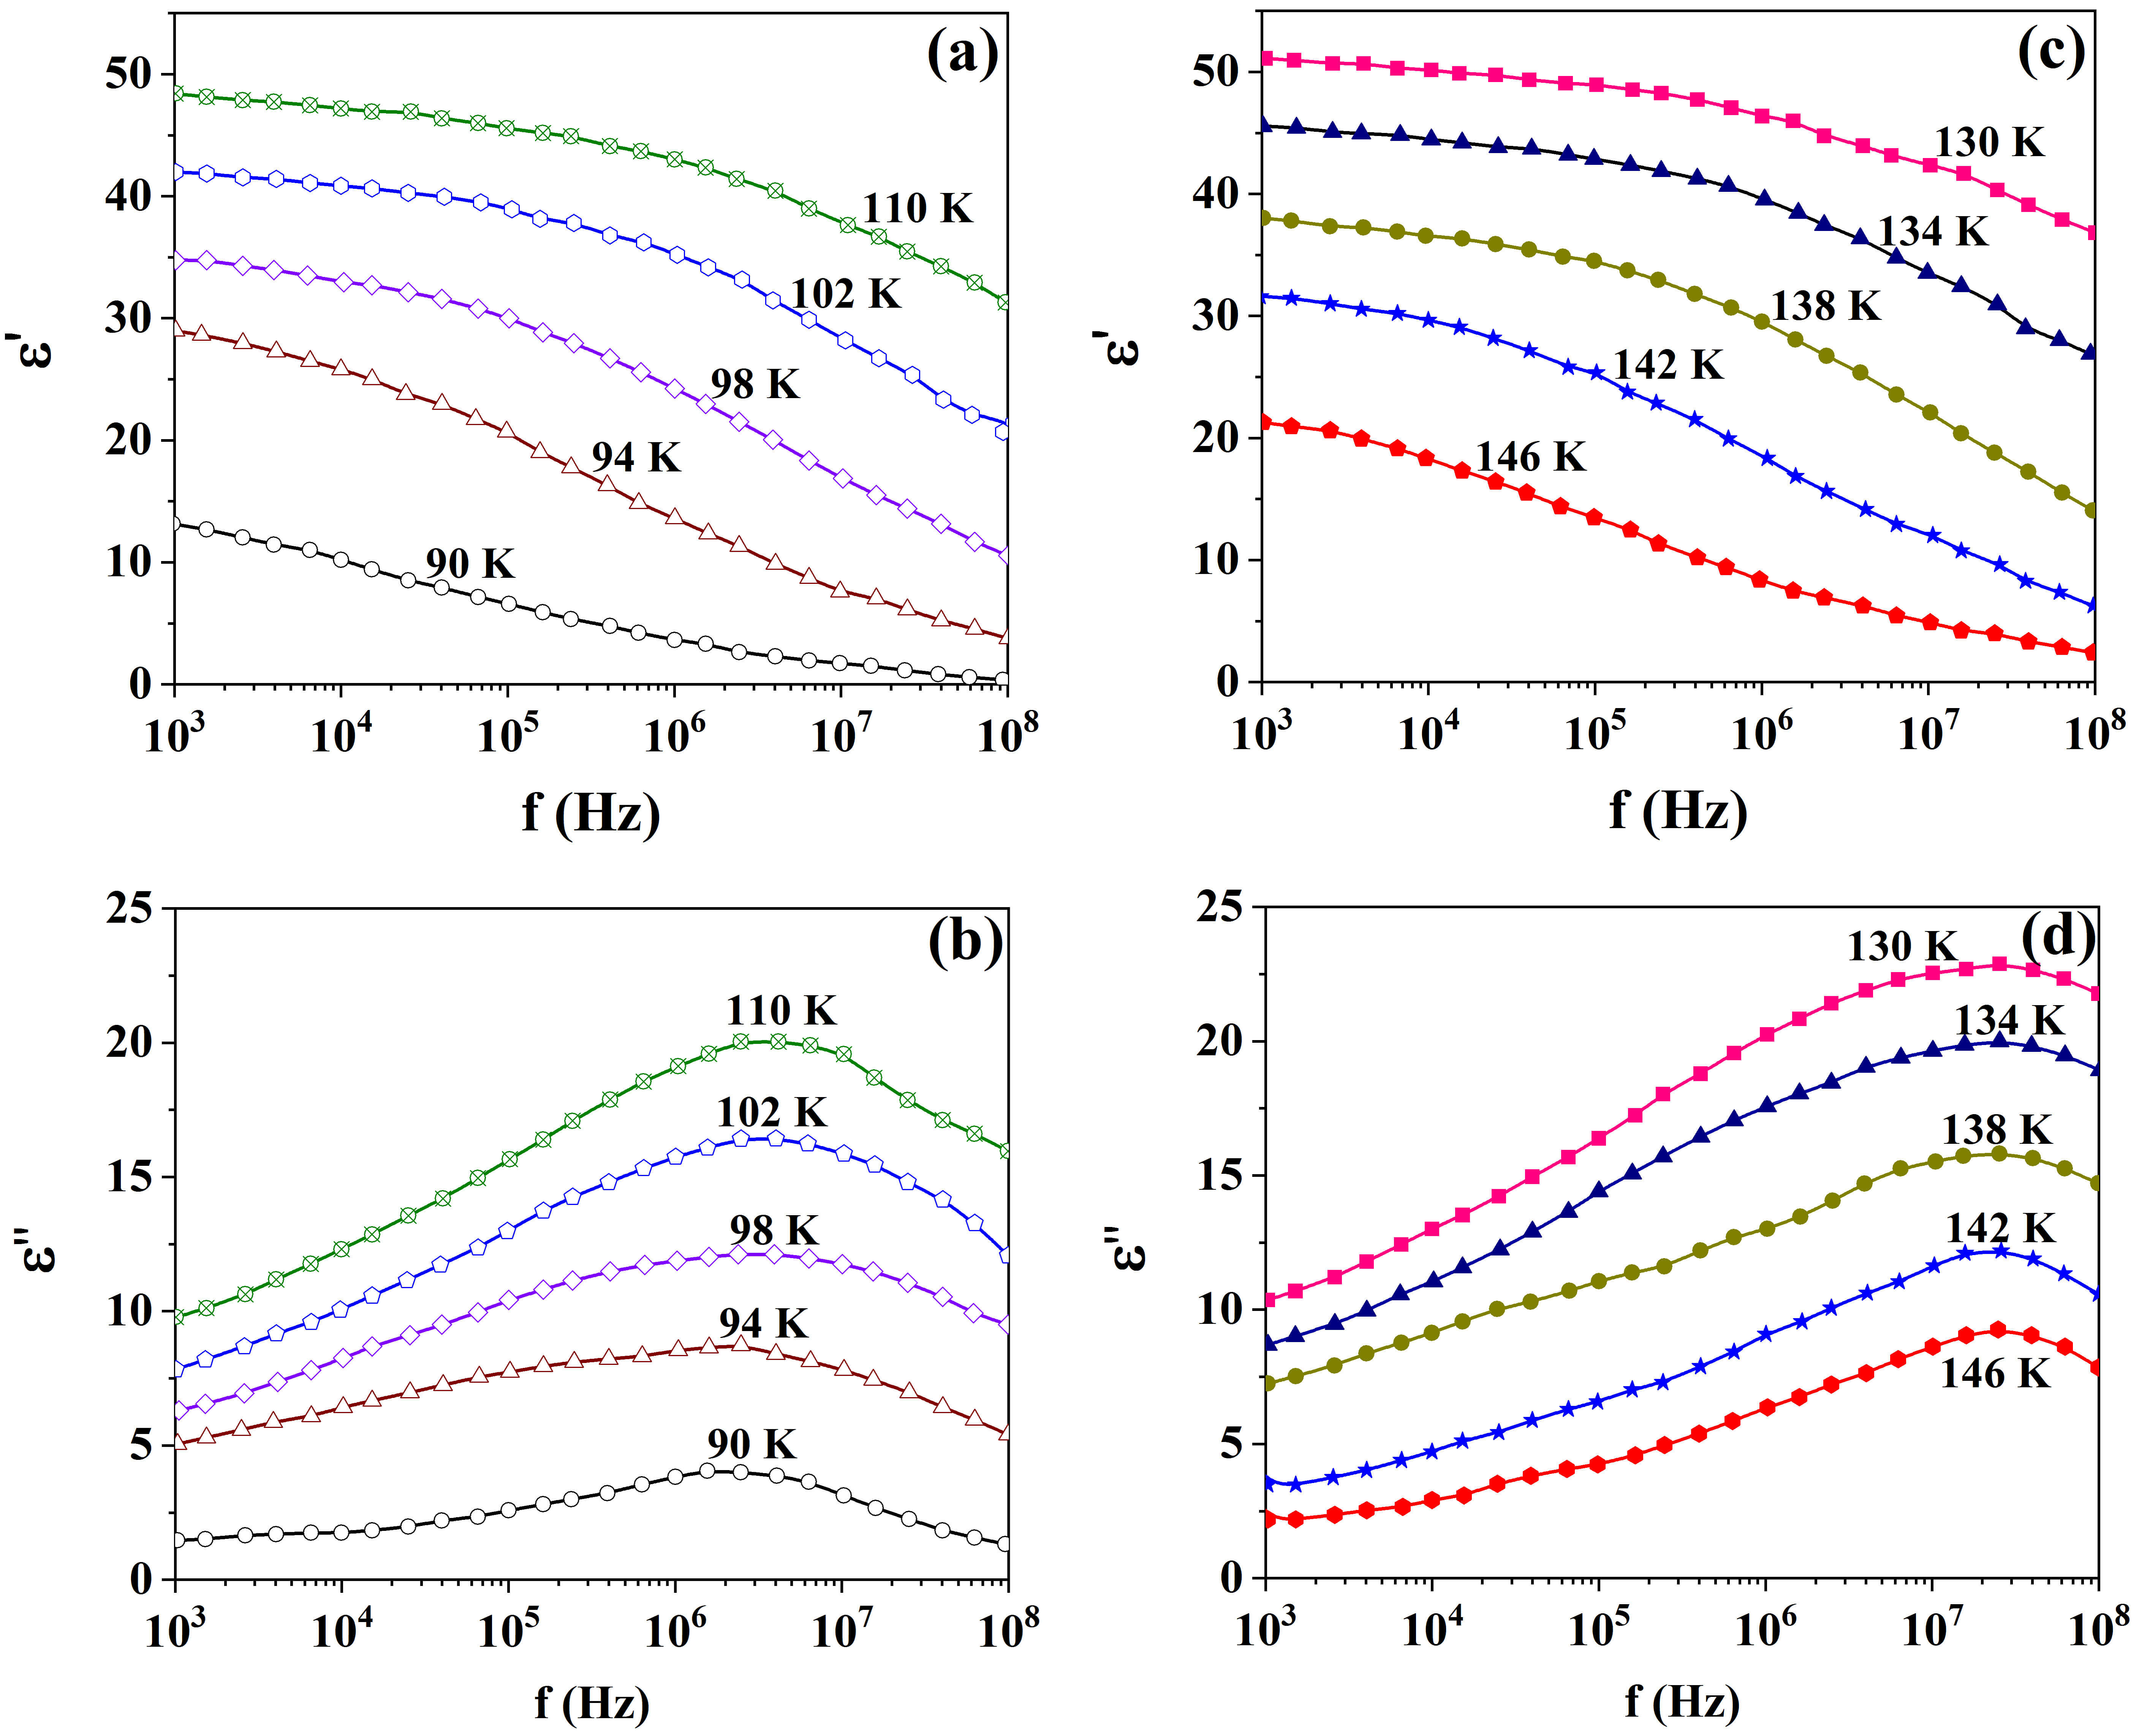 Fig. 4.
Frequency spectra of the real and imaginary permittivity for the pure KDP at different temperatures in polar (a,b) and non-polar (c,d) phases.
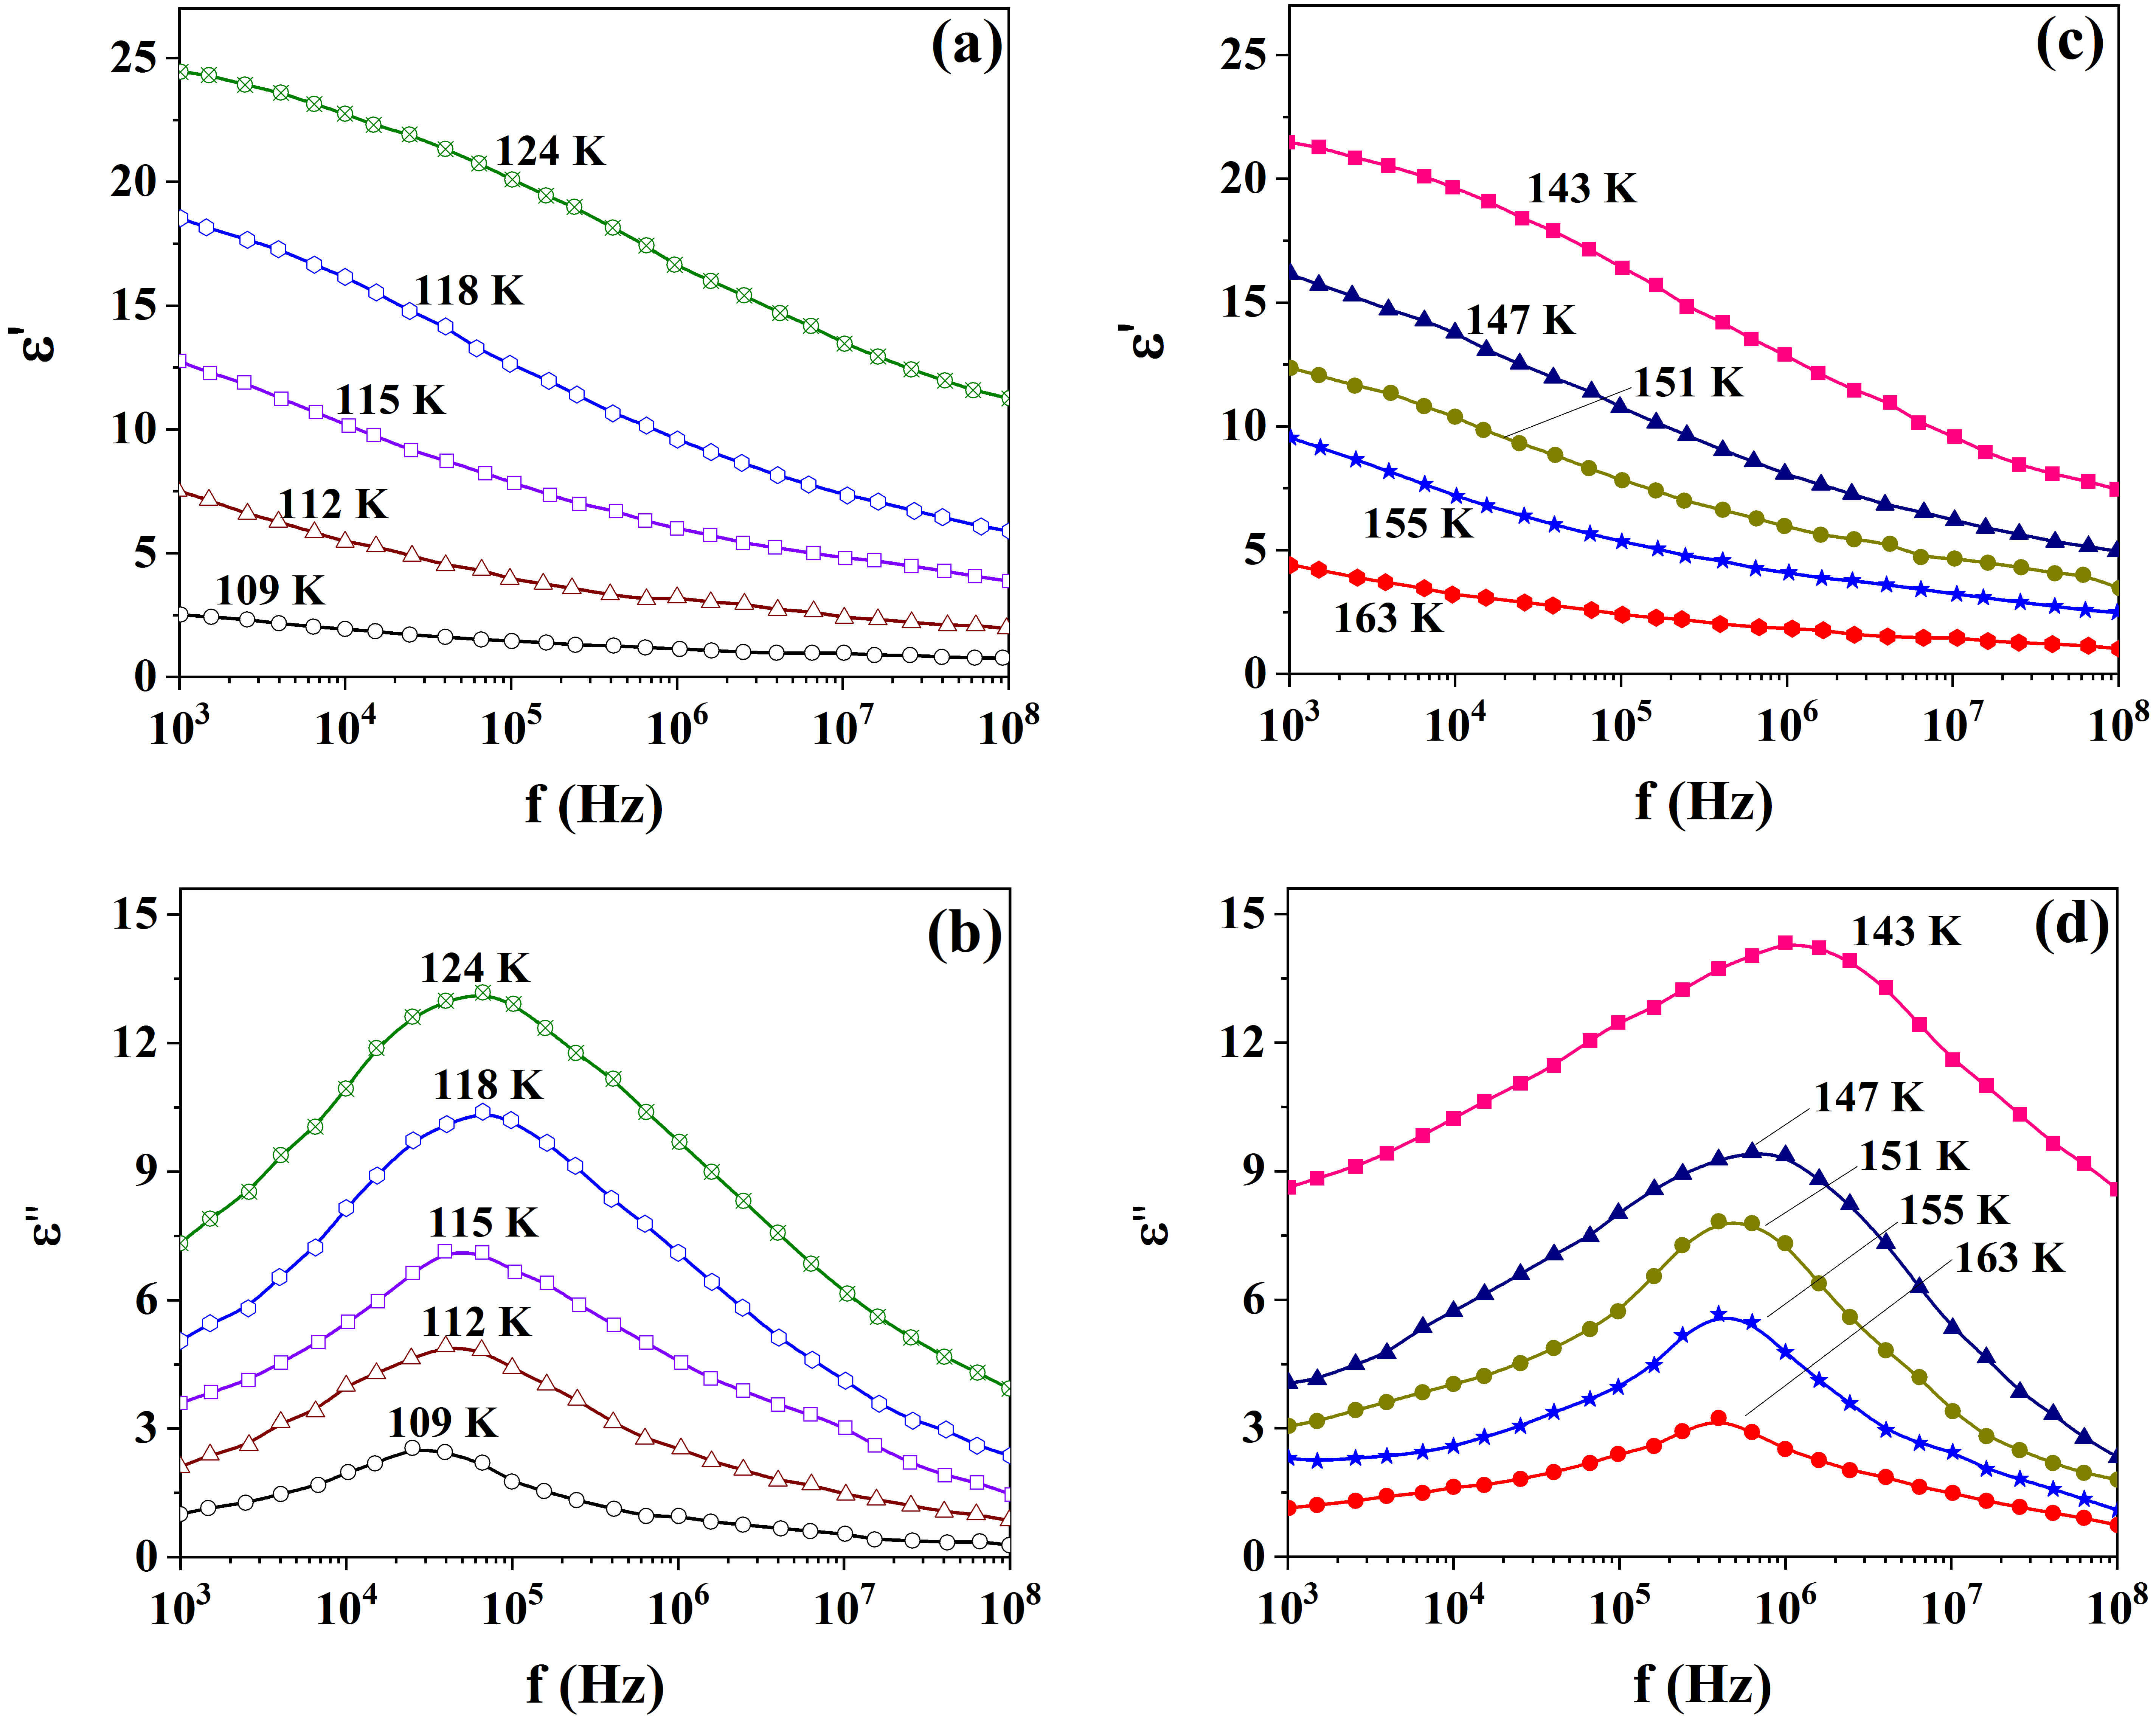 Fig. 5.
Frequency spectra of the real and imaginary permittivity for the nanosized KDP in AxBC at different temperatures in polar (a,b) and non-polar (c,d) phases.
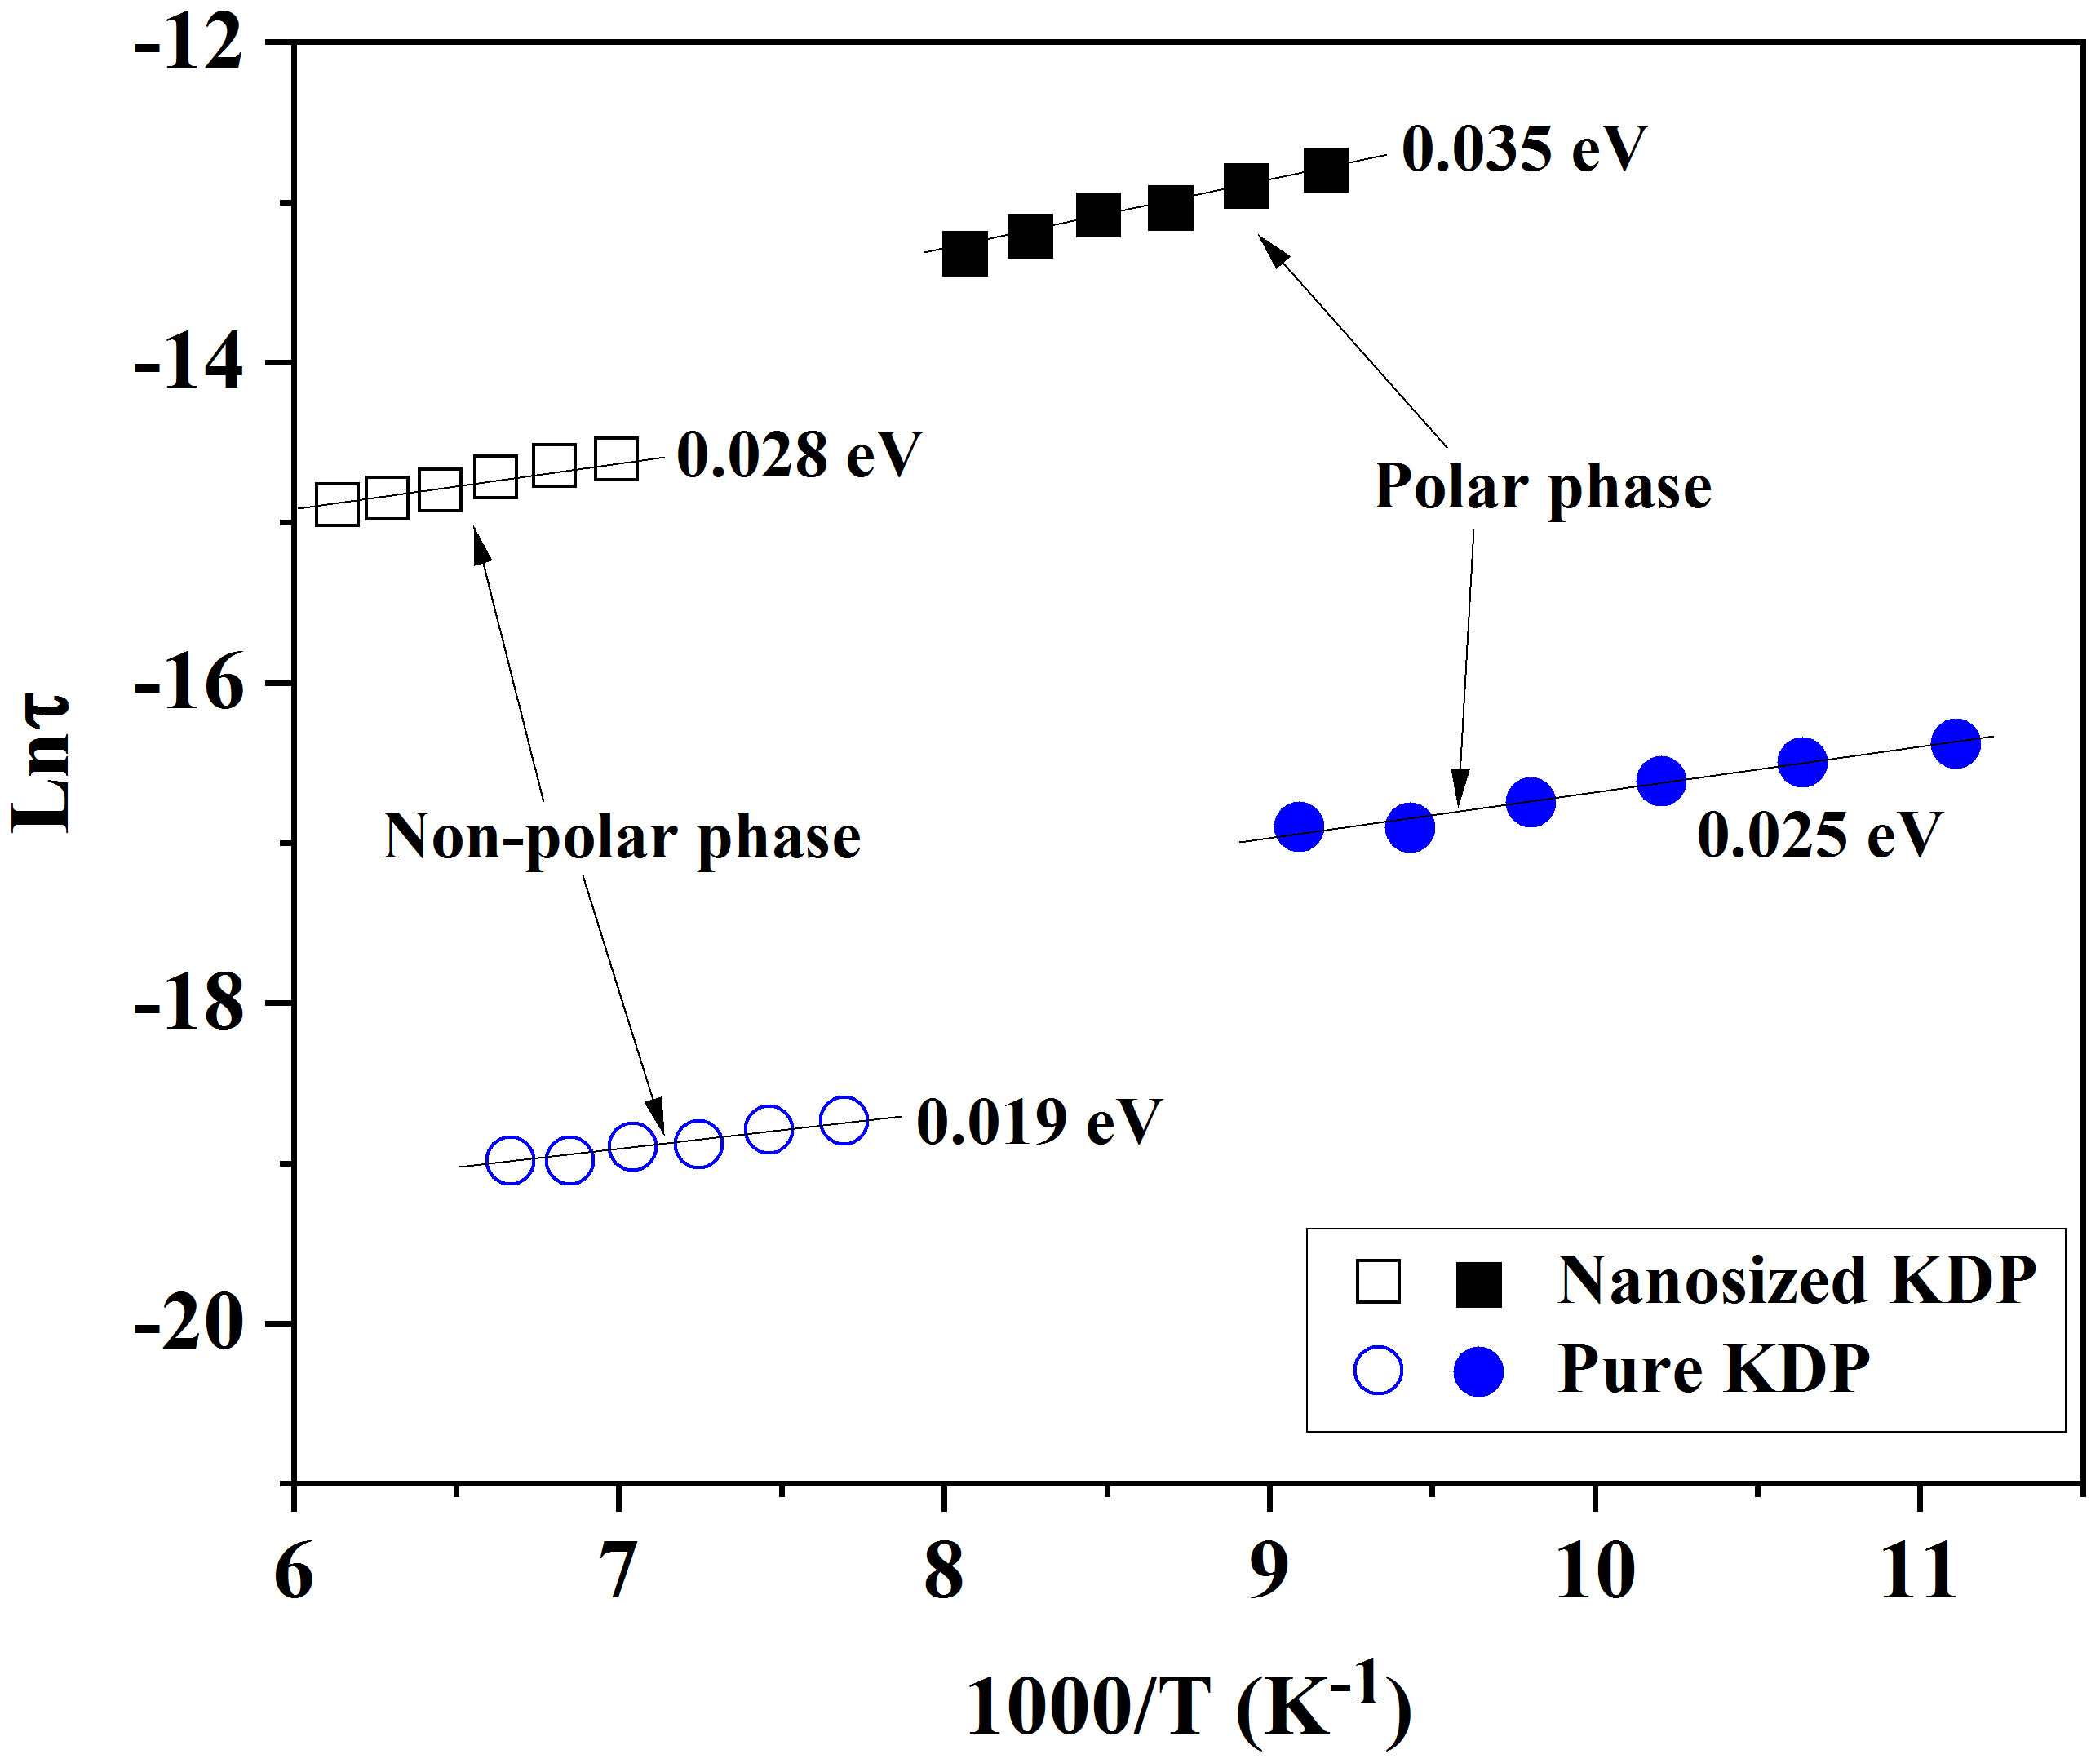 Fig. 6.
Dependences of relaxation times on the reciprocal temperature for the pure and the nanosized KDP in polar and non-polar phases.
To clarify the relationship between the structural changes and the above-mentioned anomalies, we analyzed the FTIR spectra of the pure KDP, AxBC, and AxBC/KDP samples at different temperatures decreasing from 250 K to 110 K (Fig. 7). The description of the adsorption peaks and corresponding functional groups is provided in Table 1. Obviously, when cooling down samples, the changes of FTIR spectra for the pure KDP and AxBC were insignificant. In this process, the -OH intra-/inter-chain hydrogen bonds and -COOH in AxBC, along with P=O and [H2SO4]– in the pure KDP were found to be slightly shifted (Table 1). Besides, their valleys located in 3500–2800 cm-1 originated from hydrogen bonds and possible residual water molecules became slightly deeper and wider (Fig. 7). Meanwhile, in the case of the nanosized KDP in AxBC, the observed valleys became strongly deeper and wider upon cooling (Fig. 7). Importantly, the described shifts were observed to move significantly toward higher wavenumbers (Table 1). Interestingly, a strong interaction between the KDP and AxBC components in the composite was detected, including P=O (KDP) and -COOH (AxBC); [H2SO4]– (KDP) and -OH in-plane bending (AxBC); -OH intra- and inter-chain hydrogen bonds (AxBC) and hydrogen bonds (KDP). In other words, the hydrogen bonds formed between KDP and AxBC played a leading role in their interactions.
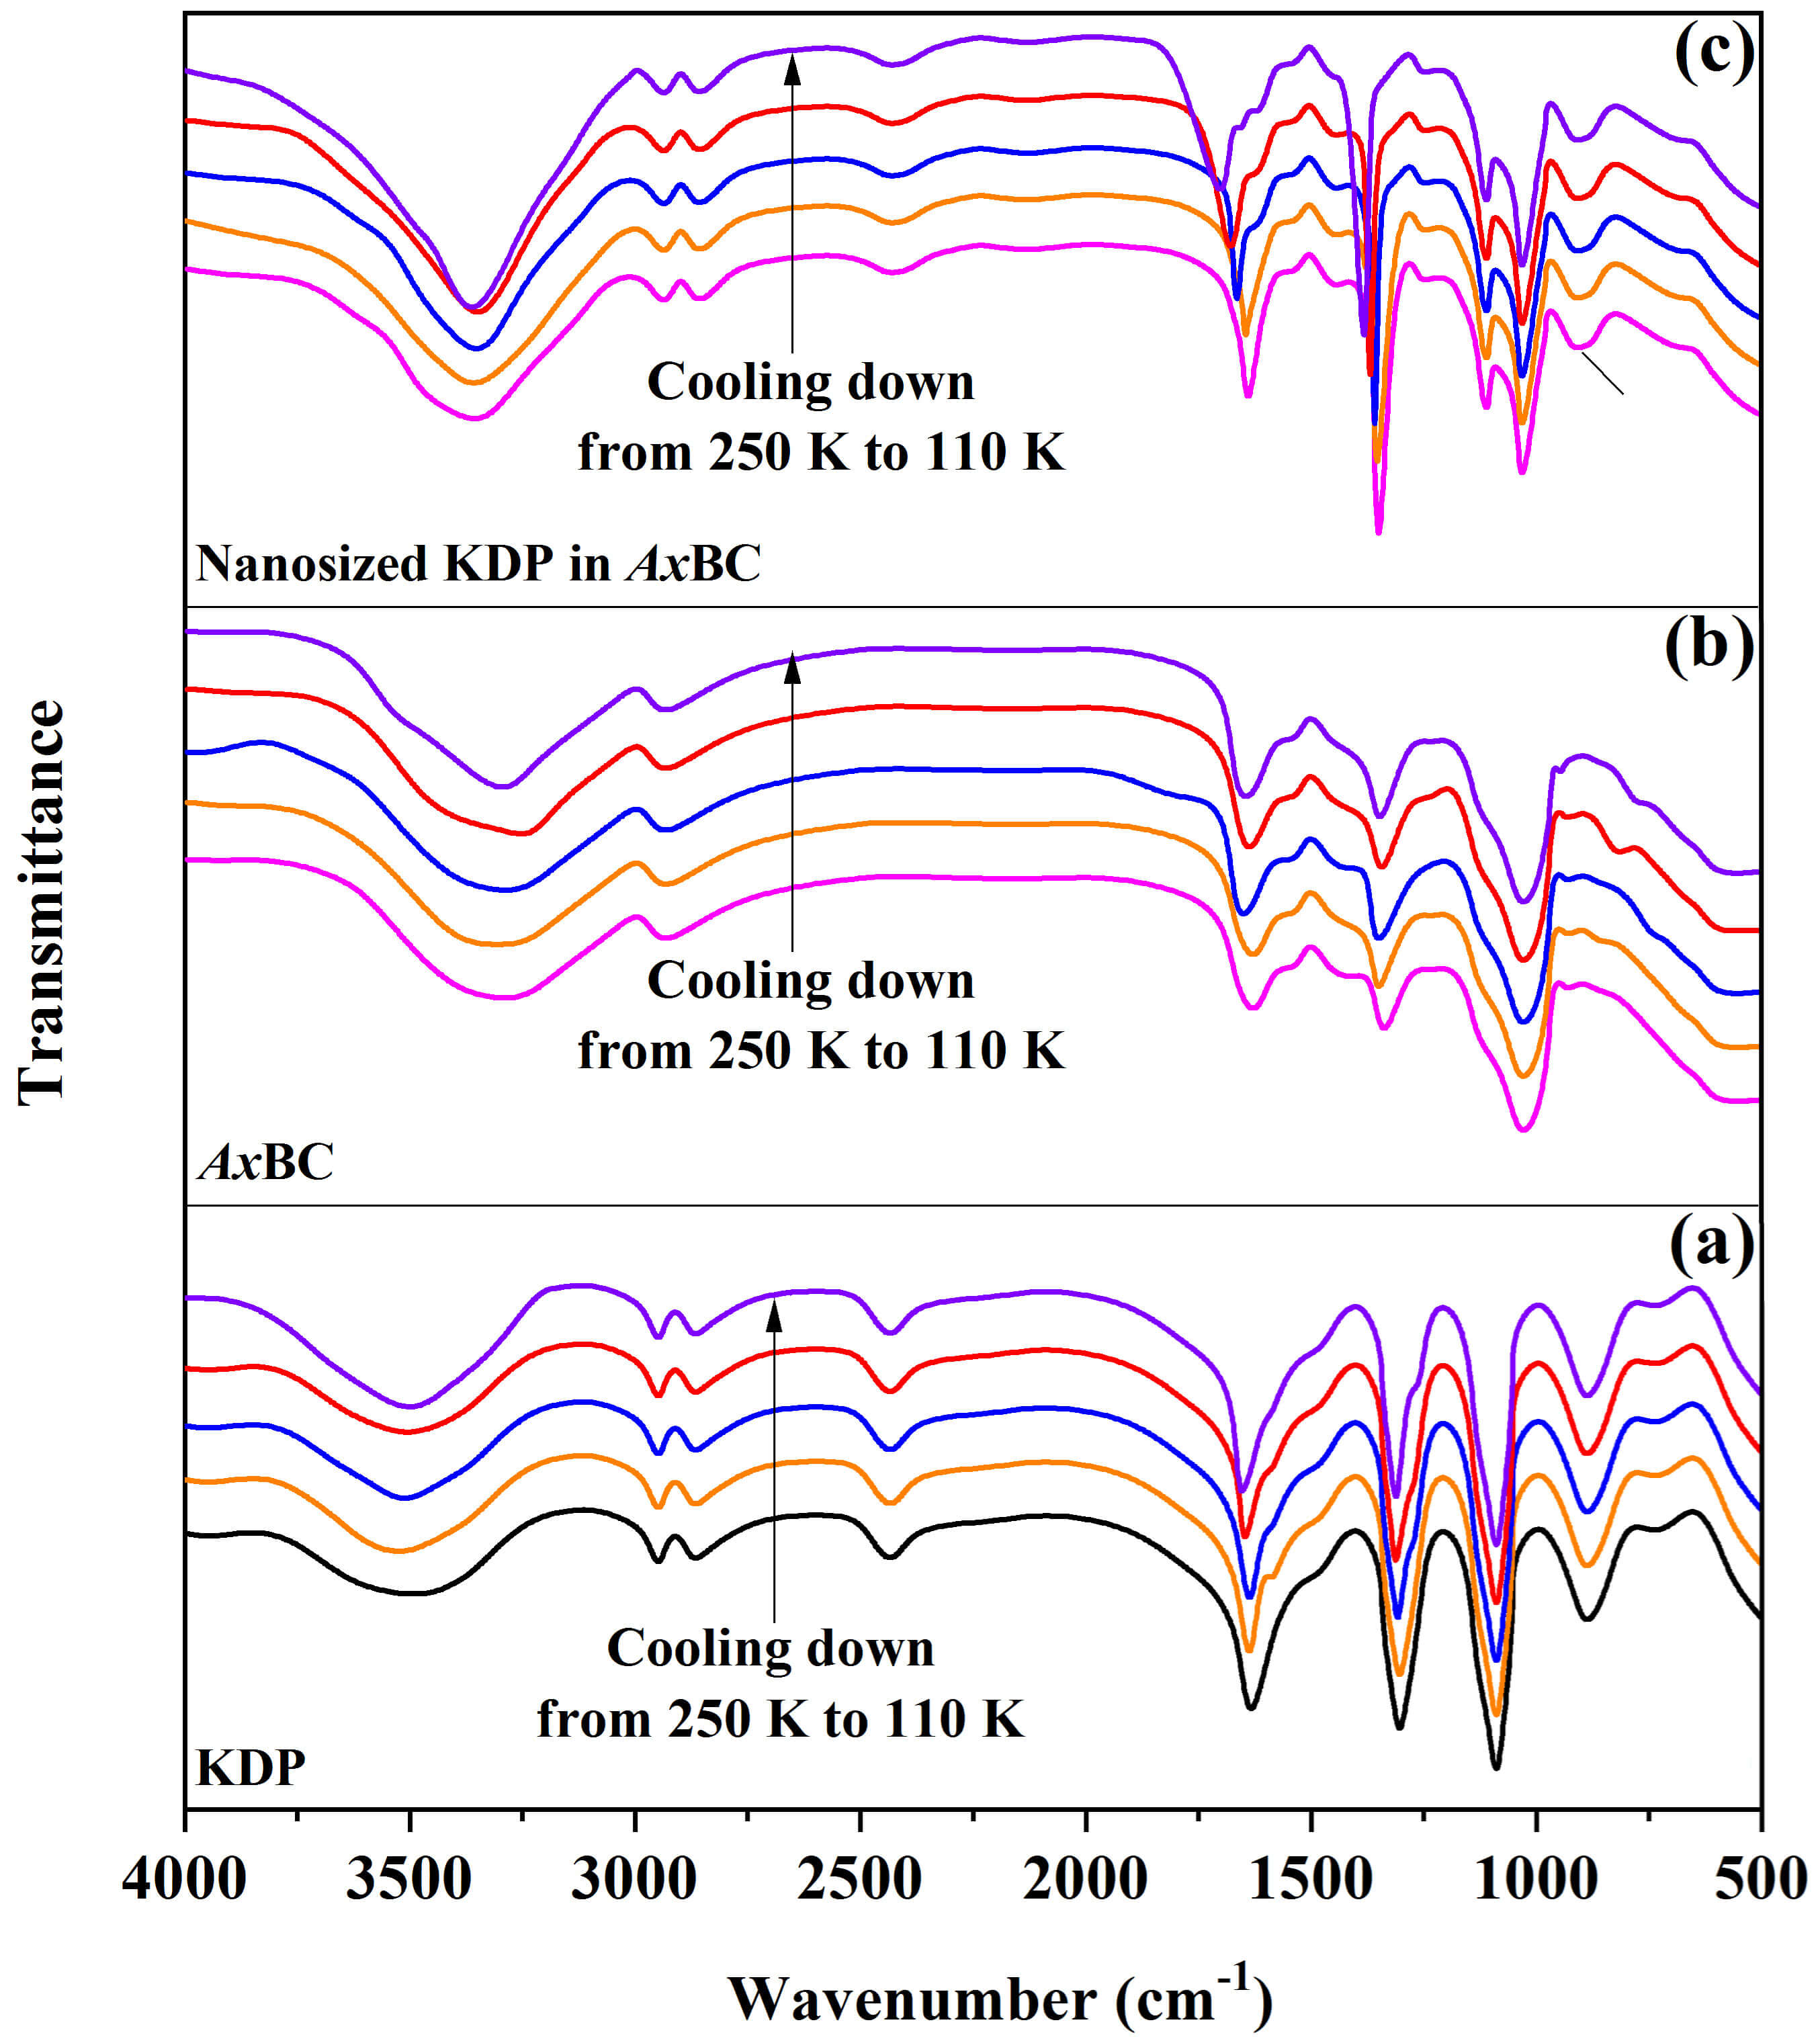 Fig. 7.
Changes of FTIR patterns with temperature for the pure KDP (a), AxBC (b) and nanosized KDP in AxBC (c).
| Materials | Functional groups | Peak position (cm-1) | Description | ||||
| 250 K | 240 K | 230 K | 118 K | 110 K | |||
| KDP | -OH (water) and hydrogen bonds | centered at 3500 cm-1 | centered at 3500 cm-1 | centered at 3500 cm-1 | centered at 3500 cm-1 | centered at 3500 cm-1 | Becoming slightly deeper and wider |
| P=O | 1632 | 1632 | 1638 | 1642 | 1646 | Slight shift | |
| [H2SO4]– | 1308 | 1308 | 1311 | 1316 | 1320 | Slight shift | |
| AxBC | -OH intra- and inter-chain hydrogen bonds | centered at 3300 cm-1 | centered at 3300 cm-1 | centered at 3300 cm-1 | centered at 3300 cm-1 | centered at 3300 cm-1 | Becoming slightly deeper |
| -COOH | 1625 | 1627 | 1630 | 1634 | 1639 | Slight shift | |
| -OH in-plane bending | 1335 | 1336 | 1340 | 1341 | 1345 | Slight shift | |
| Nanosized KDP in AxBC | -OH intra- and inter-chain hydrogen bonds (AxBC), water, hydrogen bonds (KDP) | centered at 3352 cm-1 | centered at 3352 cm-1 | centered at 3352 cm-1 | centered at 3352 cm-1 | centered at 3352 cm-1 | Becoming strongly deeper and wider |
| P=O (KDP) and -COOH (AxBC) | 1635 | 1642 | 1663 | 1677 | 1703 | Significant shift | |
| [H2SO4]– (KDP) and -OH in-plane bending (AxBC) | 1346 | 1350 | 1357 | 1365 | 1389 | Significant shift | |
From the above analyses, the relationship between the structural modifications
and the anomalous properties observed for the nanosized KDP under nanoconfinement
conditions became evident. The first question to address here is why introducing
KDP into the cellulose nanochannels led to an increase in the phase-transition
temperature (Fig. 3). According to Landau-Ginzburg-Devonshire theory [28], the
transition point Tc increased when the material structure became
more rigidly reinforced, which in turn enhanced the viscosity
In addition to the successful execution of experiments such as crystal structure characterization (XRD and FTIR) and the investigation of phase transitions and activation energies, the present study is subject to objective limitations related to the softness of cellulose:
Nevertheless, the trends in the variation of the parameters reported in this study, such as the increase in phase transition temperature, relaxation times, and activation energies, remain consistently valid for all samples, regardless of the filling level and the specific distribution of the nanochannels.
The comparative analyses of experimental data for the pure KDP and AxBC/KDP composite revealed an increase in phase transition temperature from 123 K to 136.8 K for nanosized KDP-filled in nanochannels of Acetobacter xylinum cellulose, as determined in the temperature dependences of permittivity. At the same time, the rise of activation energies from 0.025 eV to 0.035 eV in the polar phase, and 0.019 to 0.028 eV in the non-polar phase was detected, accompanied by longer relaxation times inferred from the shift of relaxation frequencies. Those anomalies were related to the interactions between KDP and cellulose components through hydrogen bonds at low temperatures, resulting in the enhancement of viscosity and, therefore consolidated KDP structures under thermal effects. This assumption was also evidenced by the shift of the functional groups in the FTIR spectra, which directly contributed to hydrogen bonds. Despite the limitations associated with the natural softness of cellulose, causing difficulties in filling and the random distribution of cellulose nanochannels after drying, the obtained results may be useful for researchers in the field of materials manufacturing at low temperatures, where hydrogen bonding plays a more dominant role in stabilizing hydrogen-bonded networks.
The datasets used and analyzed during the current study are available from the corresponding author on reasonable request.
BDM planned, conducted experiments, analyzed the experimental data and prepared the manuscript. The author read and approved the final manuscript. The author has participated sufficiently in the work and agreed to be accountable for all aspects of the work.
Not applicable.
I would like to express my gratitude to all those who helped us during the writing of this manuscript. Thanks to all the peer reviewers for their opinions and suggestions.
This research received no external funding.
The author declares no conflict of interest.
References
Publisher’s Note: IMR Press stays neutral with regard to jurisdictional claims in published maps and institutional affiliations.