


 , Ngoc Anh Le 2, Do Tung Dac 1, Thi Ngoc Dung Ngo 3, Son Hai Doan 4, Thi Ngoc Thao Nguyen 1,*
1 Department of Pathophysiology and Immunology, Hanoi Medical University, 100000 Ha Noi, Vietnam
2 Department of Immunology, University of Medicine and Pharmacy, Vietnam National University, 100000 Ha Noi, Vietnam
3 Department of Laboratory, Dong Do Hospital, 100000 Ha Noi, Vietnam
4 Department of Biochemistry, Hanoi Obstetrics & Gynecology Hospital, 100000 Ha Noi, Vietnam
Abstract
Preeclampsia (PE), a severe pregnancy complication, is a major contributor to maternal and perinatal morbidity and mortality worldwide. Matrix metalloproteinases (MMPs) and their tissue inhibitors of metalloproteinases (TIMPs) are implicated in the pathogenesis of PE. This study aimed to evaluate maternal plasma levels of MMP-2, MMP-3, MMP-9, TIMP-1, and TIMP-2 in normal and preeclamptic pregnancies across gestational trimesters to assess their predictive value.
This case-control study included a total of 138 pregnant women: 72 with normal pregnant women (controls) and 66 women diagnosed with PE, recruited at Hanoi Obstetrics and Gynecology Hospital between July 2022 and June 2024. In the second trimester (14–28 weeks), the PE and control groups included 14 and 18 women, respectively. In the third trimester (29–41 weeks), the study included 52 women with PE and 54 controls. Plasma concentrations of MMP-2, MMP-3, MMP-9, TIMP-1, and TIMP-2 were measured using enzyme-linked immunosorbent assay (ELISA). Correlations between MMPs, TIMPs, MMP/TIMP ratios, and PE severity indices were analyzed using Spearman’s correlation. Receiver operating characteristic (ROC) analysis evaluated the diagnostic and predictive utility of these markers.
Maternal plasma levels of MMP-2 and TIMP-2 were significantly higher in the PE group compared to controls during both the second and third trimesters (p < 0.05). The MMP-2/TIMP-2 ratio was significantly lower in the PE group during the third trimester (p = 0.002). MMP-3 levels were markedly elevated in PE patients (p < 0.001) and were positively correlated with plasma creatinine and proteinuria. In contrast, MMP-9 levels were significantly reduced in the PE group across both trimesters (p < 0.05), whereas TIMP-1 levels showed no significant difference between groups. Notably, MMP-9 was strongly correlated with TIMP-1 in PE, and both markers correlated with systolic blood pressure (SBP). ROC curve analysis indicated the combination of MMP-2 and TIMP-2 as the best predictor of PE in the second trimester, while TIMP-2 was the most predictive marker in the third trimester.
Elevated plasma MMP-2 and TIMP-2 levels, particularly in the second trimester, show potential as biomarkers for identifying patients at risk of PE. TIMP-2 appears promising for prediction in the third-trimester. These findings warrant further investigation for potential clinical application.
Keywords
- preeclampsia
- matrix metalloproteinase-2 (MMP-2)
- MMP-3
- MMP-9
- tissue inhibitor of metalloproteinase-1 (TIMP-1)
- TIMP-2
- biomarker
Preeclampsia (PE) is a complex, multi-organ disorder typically emerging after 20 weeks of gestation or postpartum, characterized by new-onset hypertension and proteinuria or significant end-organ dysfunction [1]. Although its etiology is not fully understood, a widely accepted two-stage model proposes that inadequate trophoblast invasion and disordered uterine spiral artery remodeling lead to placental ischemia/hypoxia, followed by systemic maternal endothelial dysfunction driven by an imbalance of circulating angiogenic and anti-angiogenic factors [2].
Matrix metalloproteinases (MMPs) are zinc-dependent endopeptidases crucial for extracellular matrix (ECM) remodeling during reproductive processes, including gametogenesis, implantation, angiogenesis, placentation, and parturition. MMP activity is tightly regulated transcriptionally, via pro-enzyme activation, and through inhibition by tissue inhibitors of metalloproteinases (TIMPs). Dysregulation of the MMP/TIMP balance has been implicated in cardiovascular disorders, including PE [3].
This study focused on a key group of MMPs involved in trophoblastic invasion into the maternal uterine and vascular remodeling, specifically MMP-2 (Gelatinase A), MMP-9 (Gelatinase B), and MMP-3 (Stromelysin-1), along with their primary endogenous inhibitors, TIMP-2 (inhibits MMP-2) and TIMP-1 (inhibits MMP-9). MMP-2 and MMP-9 degrade various ECM components, including collagen types IV, V, VII, and X, as well as gelatin. MMP-3 targets collagen, proteoglycans, laminin, and fibronectin [3]. MMP-2 plays a vital role in implantation, as well as systemic and uterine vasodilation, MMP-9 in vascular basement membrane remodeling, and MMP-3 in trophoblast motility and activation of other MMPs, like MMP-1, MMP-7, and MMP-9, thereby amplifying ECM degradation [3, 4].
Altered levels of MMPs and TIMPs have been reported in the plasma, amniotic fluid, and endothelial cells of women with PE, suggesting a potential role in the disease’s pathogenesis through both uteroplacental and vascular dysfunction. However, prior studies have evaluated individual MMPs or TIMPs at specific time points during pregnancy, without accounting for their dynamic changes throughout gestation or their regulatory interactions [5, 6, 7]. This limitation reduces the translational value of such findings. In the present study, we measured plasma concentrations of MMP-2, MMP-3, MMP-9, TIMP-1, and TIMP-2, as well as the MMP-2/TIMP-2 and MMP-9/TIMP-1 ratios, in both normal and preeclamptic pregnant women during the second and third trimesters. We further assessed their associations with clinical indicators of PE and performed receiver operating characteristic (ROC) curve analysis to determine their trimester-specific predictive value.
A case-control study was conducted at Hanoi Obstetrics & Gynecology Hospital from July 2022 to June 2024. A total of 138 pregnant women of reproductive age (15–49 years) were included: 66 were diagnosed with PE and 72 normal pregnant women matched for age and gestational age, serving as the control group. Within the PE group, 14 women were in the second trimester (14–28 weeks) and 52 in the third trimester (29–41 weeks). The control group included 18 women in the second trimester and 54 in the third trimester. All participants provided written informed consent in accordance with institutional guidelines. The study protocol was approved by the Hanoi Obstetrics and Gynecology Hospital Ethics Committee (Approval No. 734 CN/BVPS – TT ĐT CĐT).
Inclusion Criteria (PE Group): Gestational age
Exclusion Criteria (All Participants): Pregnancies resulting from assisted reproductive technologies, multiple gestations, fetal structural or chromosomal abnormalities, stillbirths, and pre-existing maternal conditions such as chronic hypertension, cardiovascular disease, liver disease, renal disorders, endocrine disorders (e.g., diabetes, Graves’ disease), neoplastic conditions, autoimmune diseases, and significant infectious diseases (e.g., human immunodeficiency virus [HIV], hepatitis) or other acute infections.
Demographic data (maternal age, gestational age, obstetric history including gravidity and prior PE), ongoing medical treatments, blood pressure, and symptoms (headache, blurred vision, edema) were recorded. Laboratory assessments included complete blood count (red blood cell [RBC], hemoglobin, platelets), plasma biochemistry (aspartate aminotransferase [AST], alanine aminotransferase [ALT], urea, creatinine, uric acid, albumin), and 24-hour proteinuria.
A single 2–5 mL peripheral blood sample was collected from each participant into ethylenediamine tetraacetic acid (EDTA) (0222, MPV Medical Plastic Joint Stock Company, Tam Diep, Ninh Binh, Vietnam) anticoagulant tubes at the time of hospital admission, before the initiation of any antihypertensive or other treatments. Plasma was separated by centrifugation (5000 rpm, 5 min) and stored at –80 °C until analysis.
Plasma concentrations were measured using sandwich ELISA kits from Proteintech Group (Rosemont, IL, USA) as follows: Human MMP-2 (Catalogue No.KE00077), Human MMP-3 (Catalogue No.KE00160), Human MMP-9 (Catalogue No.KE00164), Human TIMP-1 (Catalogue No.KE00166), and Human TIMP-2 (Catalogue No.KE00162). Absorbance was measured at 450 nm (correction wavelength 630 nm) using a BioTek ELx808 Microplate Reader (Agilent BioTek, Winooski, VT, USA) operated with BioTek Gen5 software (version 3.05, Agilent BioTek, Winooski, VT, USA).
The analytical performance parameters for each assay were as follows: For MMP-2, the range was 0.625–20 ng/mL, with an intra-assay coefficient of variation (CV) 4.5%–10% and an inter-assay CV 5.4%–8.9%. For MMP-3, the range was 31.25–2000 pg/mL, with intra-assay CV 4.6%–8.6% and inter-assay CV 6.2%–9.2%. For MMP-9, the range was 62.5–4000 pg/mL, with intra-assay CV 1.5%–3.0% and inter-assay CV 3.2%–6.7%. For TIMP-1, the range was 62.5–4000 pg/mL, with intra-assay CV 4.1%–6.2% and inter-assay CV 7.5%–8.4%. For TIMP-2, the range was 31.25–2000 pg/mL, with intra-assay CV 3.1%–4.1% and inter-assay CV 2.7%–3.2%.
Data analysis was performed using SPSS version 20.0 (IBM Corp., Armonk, NY, USA). Normality was assessed using the Kolmogorov-Smirnov test. Non-normally distributed data were presented as median and interquartile range (IQR: 1st quartile; 3rd quartile), compared between groups (PE vs. Control), and across trimesters within groups using the Mann-Whitney U-test. Spearman’s rank correlation coefficient (rho) assessed correlations between biomarkers and clinical/laboratory indices (systolic blood pressure [SBP], diastolic blood pressure [DBP], platelets, creatinine, AST, ALT, and proteinuria). ROC curves were generated for significant markers to evaluate their predictive value for PE, calculating the area under the curve (AUC).
Among 138 participants (32 in the second trimester, 106 in the third trimester),
there were no statistically significant differences in maternal age or
gestational age between the PE and control groups (p
| Parameters | Total (n = 138) | Second trimester (n = 32) | Third trimester (n = 106) | |||||||||
| Control group (n = 72) | PE group (n = 66 ) | Z | p | Control group (n = 18 ) | PE group (n = 14) | Z | p | Control group (n = 54) | PE group (n = 52) | Z | p | |
| Maternal age (years) | 29 (26–32) | 30 (26–33) | –0.6 | 0.567 | 29 (27–33) | 33 (29–36) | –1.4 | 0.153 | 29 (26–32) | 29 (25–32) | –0.1 | 0.977 |
| Gestational age (weeks) | 36 (28–39) | 35 (29–38) | –0.6 | 0.601 | 26 (23–27) | 26 (24–27) | –0.5 | 0.604 | 38 (33–39) | 37 (33–39) | –1.4 | 0.150 |
| Gravidity | 2 (1–3) | 2 (1–3) | –0.1 | 0.944 | 2 (1–2) | 2 (1–3) | –0.5 | 0.667 | 2 (1–3) | 2 (1–2) | –0.3 | 0.733 |
| SPB (mmHg) | 110 (110–110) | 150 (140–160) | –10.6 | 110 (110–110) | 155 (140–163) | –5.0 | 110 (110–110) | 150 (140–155) | –9.3 | |||
| DBP (mmHg) | 70 (70–70) | 100 (90–100) | –10.6 | 70 (70–70) | 100 (90–100) | –5.0 | 70 (70–70) | 90 (90–100) | –9.2 | |||
| MAP (mmHg) | 83 (83–83) | 113 (107–120) | –10.4 | 83 (83–83) | 119 (109–130) | –5.0 | 83 (83–83) | 112 (107–119) | –9.1 | |||
| Creatinine (µmol/L) | 57 (51–63) | 66 (59–77) | –5.6 | 51 (50–54) | 65 (57–82) | –4.0 | 59 (53–66) | 67 (59–76) | –4.2 | |||
| Platelets (G/L) | 236 (193–259) | 217 (180–264) | –0.8 | 0.411 | 260 (231–292) | 249 (182–280) | –1.1 | 0.287 | 222 (188–251) | 215 (177–260) | –0.3 | 0.781 |
| AST (U/L) | 18 (15–20) | 23 (19–36) | –5.6 | 18 (15–19) | 25 (22–42) | –4.0 | 18 (15–20) | 22 (18–36) | –4.3 | |||
| ALT (U/L) | 12 (9–16) | 15 (12–32) | –4.0 | 11 (10–16) | 19 (15–36) | –3.3 | 0.001 | 12 (8–16) | 14 (11–30) | –2.9 | 0.004 | |
| Proteinuria (g/L) | 0 (0–0) | 2 (1–8) | –10.2 | 0 (0–0) | 4 (1–9) | –4.6 | 0 (0–0) | 2 (1–6) | –9.0 | |||
Note: Data presented as median (interquartile range: IQR). Mann-Whitney U-test comparing PE vs. Control within each column. SBP, systolic blood pressure; DBP, diastolic blood pressure; MAP, mean arterial pressure; ALT, alanine aminotransferase; AST, aspartate aminotransferase; PE, Preeclampsia.
Plasma MMP-2 and MMP-3 levels were significantly higher in the PE group than in
controls in both trimesters and overall (p
| Indicators | Gestation | Control group (n = 72) | PE group (n = 66) | Z | p | ||
| Median | IQR | Median | IQR | ||||
| MMP-2 (ng/mL) | Second trimester | 250.2 | 206.6–369.4 | 444.3 | 308.0–604.6 | –3.0 | 0.002 |
| Third trimester | 270.6 | 136.8–407.7 | 360.5 | 255.1–566.0 | –2.3 | 0.022 | |
| Total | 254.2 | 168.9–379.3 | 368.5 | 249.7–562.5 | –3.3 | 0.001 | |
| MMP-3 (ng/mL) | Second trimester | 17.9 | 12.4–23.7 | 38.5 | 19.2–91.2 | –2.9 | 0.004 |
| Third trimester | 17.5 | 11.2–24.0 | 26.2 | 17.9–48.2 | –3.8 | ||
| Total | 17.7 | 11.7–23.8 | 27.3 | 18.1–57.5 | –4.7 | ||
| MMP-9 (ng/mL) | Second trimester | 839.0 | 381.6–1254.2 | 241.5 | 107.6–737.8 | –2.3 | 0.023 |
| Third trimester | 608.6 | 241.2–1269.6 | 372.8 | 215.1–625.9 | –2.0 | 0.044 | |
| Total | 653.8 | 266.6–1206.4 | 352.2 | 194.1–637.5 | –3.0 | 0.003 | |
| TIMP-1 (ng/mL) | Second trimester | 240.1 | 200.1–259.7 | 132.4 | 85.9–217.2 | –2.0 | 0.048 |
| Third trimester | 242.3 | 137.2–340.0 | 193.3 | 127.3–276.5 | –1.2 | 0.237 | |
| Total | 242.3 | 145.0–319.0 | 188.7 | 120.6–273.4 | –1.9 | 0.059 | |
| TIMP-2 (ng/mL) | Second trimester | 235.4 | 170.2–309.2 | 456.9 | 288.1–539.9 | –3.0 | 0.003 |
| Third trimester | 213.3 | 71.3–296.3 | 364.8 | 273.9–500.0 | –5.5 | ||
| Total | 218.4 | 144.3–299.6 | 388.0 | 276.7–511.4 | –6.3 | ||
| MMP-2/TIMP-2 | Second trimester | 1.5 | 0.7–1.7 | 1.1 | 0.8–1.5 | –0.5 | 0.621 |
| Third trimester | 1.6 | 0.8–3.9 | 1.1 | 0.6–1.7 | –3.2 | 0.002 | |
| Total | 1.6 | 0.8–2.9 | 1.1 | 0.7–1.6 | –3.0 | 0.002 | |
| MMP-9/TIMP-1 | Second trimester | 4.2 | 2.5–4.9 | 1.7 | 1.3–3.1 | –2.8 | 0.006 |
| Third trimester | 3.0 | 1.6–4.3 | 2.1 | 1.3–2.9 | –2.4 | 0.015 | |
| Total | 3.2 | 1.9–4.5 | 2.0 | 1.3–2.9 | –3.5 | ||
| MMP-2/MMP-9 | Second trimester | 0.4 | 0.2–0.8 | 1.4 | 0.9–3.1 | –3.4 | 0.001 |
| Third trimester | 0.5 | 0.2–0.9 | 0.9 | 0.5–2.3 | –3.2 | 0.002 | |
| Total | 0.5 | 0.2–0.9 | 1.1 | 0.6–2.3 | –4.4 | ||
Note: MMP, matrix metalloproteinase; TIMP, tissue inhibitors of metalloproteinase. Mann-Whitney U-test comparing PE vs. Control group.
A strong positive correlation was observed between MMP-9 and TIMP-1 levels (r =
0.773, p
| MMP-2 | MMP-3 | MMP-9 | TIMP-1 | TIMP-2 | ||||||
| r | p | r | p | r | p | r | p | r | p | |
| SBP | 0.124 | 0.321 | 0.092 | 0.463 | 0.288 | 0.019 | 0.403 | 0.001 | 0.051 | 0.686 |
| DBP | –0.007 | 0.958 | –0.074 | 0.553 | 0.124 | 0.322 | 0.238 | 0.054 | –0.047 | 0.706 |
| Platelets | –0.142 | 0.255 | –0.169 | 0.174 | –0.026 | 0.835 | 0.046 | 0.712 | –0.026 | 0.838 |
| Creatinine | 0.204 | 0.101 | 0.286 | 0.020 | 0.134 | 0.284 | 0.058 | 0.646 | –0.079 | 0.530 |
| AST | 0.208 | 0.093 | 0.103 | 0.413 | 0.012 | 0.925 | 0.069 | 0.580 | –0.115 | 0.357 |
| ALT | 0.140 | 0.262 | 0.013 | 0.918 | 0.171 | 0.169 | 0.188 | 0.131 | –0.249 | 0.044 |
| Proteinuria | 0.239 | 0.054 | 0.365 | 0.003 | 0.166 | 0.182 | 0.157 | 0.199 | 0.108 | 0.388 |
| MMP-2 | 0.159 | 0.203 | 0.038 | 0.76 | 0.083 | 0.505 | 0.124 | 0.320 | ||
| MMP-3 | 0.175 | 0.160 | 0.109 | 0.382 | 0.196 | 0.115 | ||||
| MMP-9 | 0.773 | 0.087 | 0.489 | |||||||
| TIMP-1 | 0.023 | 0.857 | ||||||||
Note: Statistically significant correlations (p
In the second trimester, ROC analysis showed that MMP-2 (AUC = 0.817), TIMP-2
(AUC = 0.810), the MMP-2/MMP-9 ratio (AUC = 0.853), and the combination of MMP-2
and TIMP-2 (AUC = 0.893) were effective predictors of PE (all AUC
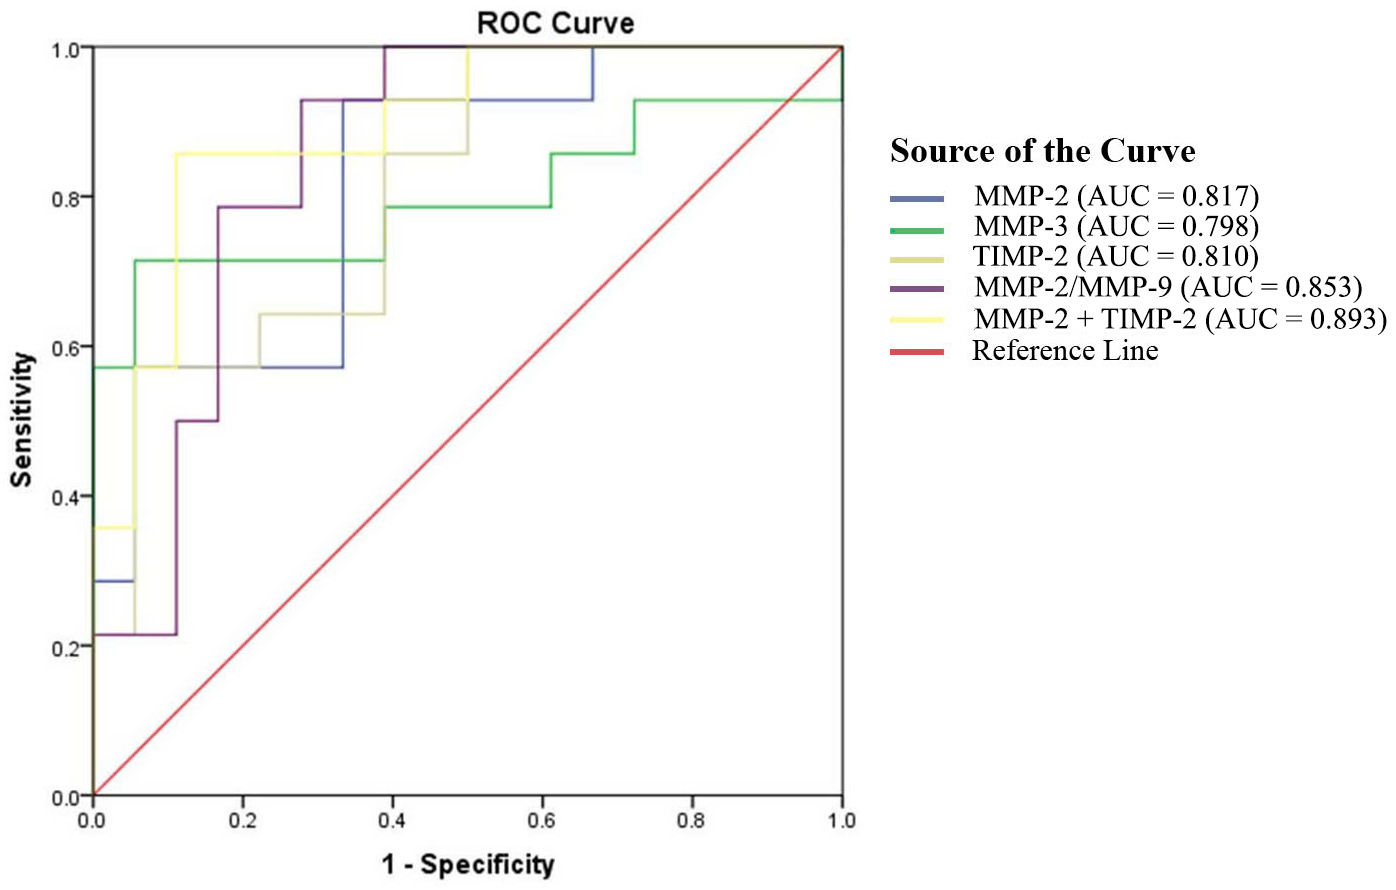 Fig. 1.
The ROC curves for plasma concentrations of MMPs and TIMPs in PE during the second trimester. ROC, receiver operating characteristic; MMPs, matrix metalloproteinases; TIMPs, tissue inhibitors of metalloproteinases; AUC, area under the curve.
| Indicators | AUC | 95% CI | Cut-off | Youden index | Sensitivity | Specificity | p |
| MMP-2 (ng/mL) | 0.817 | 0.670–0.965 | 260.8 | 0.595 | 92.9 | 66.7 | 0.002 |
| MMP-3 (ng/mL) | 0.798 | 0.619–0.976 | 27.7 | 0.659 | 71.4 | 94.4 | 0.004 |
| TIMP-2 (ng/mL) | 0.810 | 0.661–0.958 | 415.6 | 0.516 | 57.1 | 94.4 | 0.003 |
| MMP-2/MMP-9 | 0.853 | 0.718–0.988 | 0.6 | 0.651 | 92.9 | 72.2 | 0.001 |
| Combination of MMP-2 and TIMP-2 (ng/mL) | 0.893 | 0.781–1.000 | MMP-2: 260.8 | 0.746 | 85.7 | 88.9 | |
| TIMP-2: 415.6 |
Note: AUC, area under the curve; CI, confidence interval.
In the third trimester, TIMP-2 demonstrated the best predictive performance (AUC
= 0.807, p
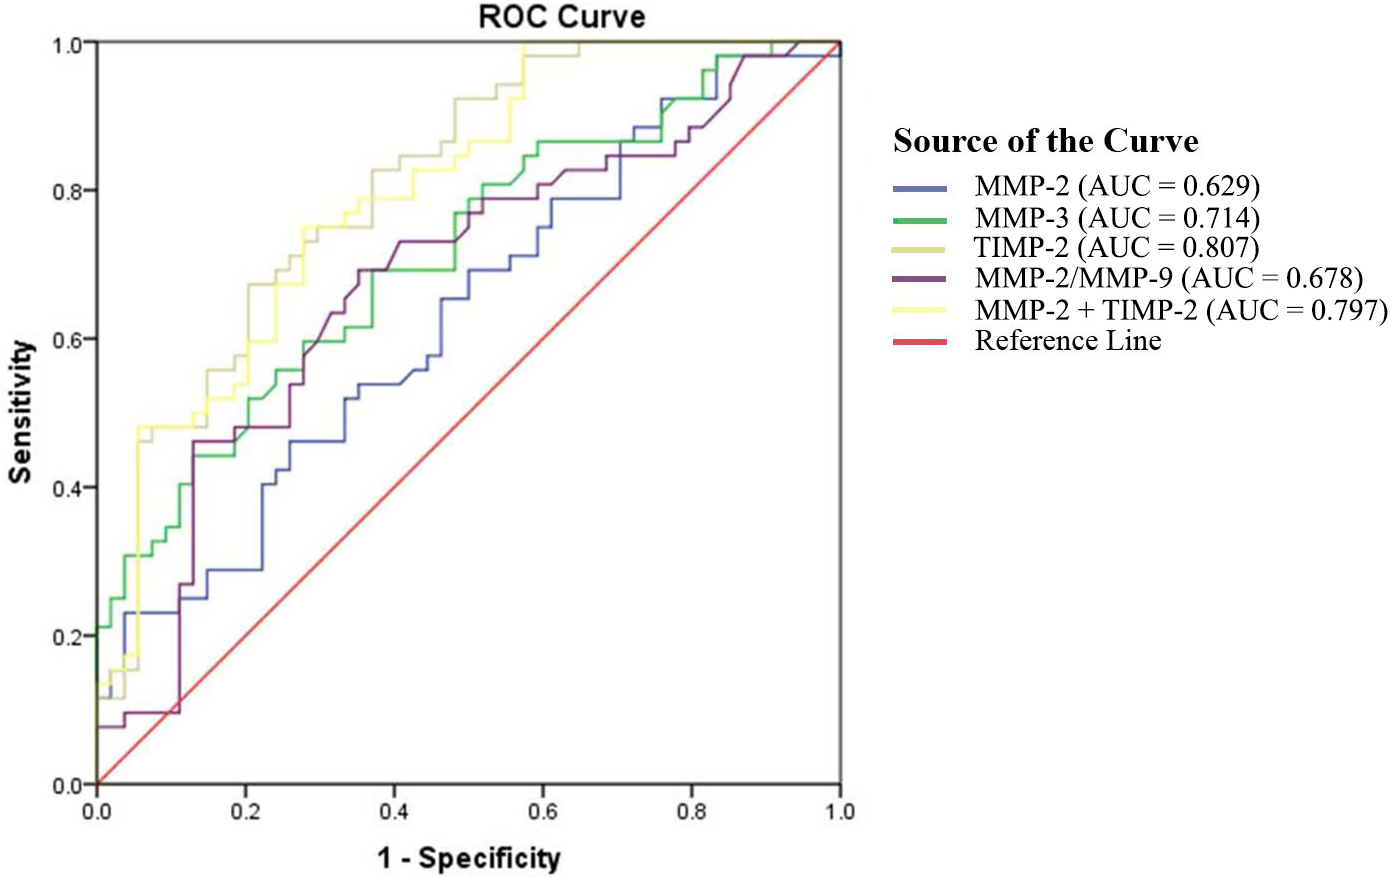 Fig. 2.
The ROC curves for plasma concentrations of MMPs and TIMPs in PE during the third trimester.
| Indicators | AUC | 95% CI | Cut-off | Youden index | Sensitivity | Specificity | p |
| MMP-2 (ng/mL) | 0.629 | 0.524–0.735 | 397.5 | 0.202 | 46.2 | 74.1 | 0.022 |
| MMP-3 (ng/mL) | 0.714 | 0.617–0.811 | 20.4 | 0.322 | 69.2 | 63.0 | |
| TIMP-2 (ng/mL) | 0.807 | 0.726–0.888 | 305.8 | 0.469 | 67.3 | 79.6 | |
| MMP-2/MMP-9 | 0.678 | 0.575–0.728 | 0.7 | 0.340 | 69.2 | 64.8 | 0.002 |
| Combination of MMP-2 and TIMP-2 (ng/mL) | 0.797 | 0.714–0.880 | MMP-2: 397.5 | 0.472 | 75.0 | 72.2 | |
| TIMP-2: 305.8 |
MMP-2 (Gelatinase A), expressed by decidual cells and trophoblasts, degrades key ECM components. It is secreted in a latent form (pro-MMP-2), and its activation involves TIMP-2 and MT1-MMP (MMP-14) in a complex process in which TIMP-2 can both facilitate activation and inhibit active MMP-2. MMP-2 is crucial for early implantation, and systemic and uterine vasodilation to ensure adequate fetal perfusion, but its activity is tightly regulated by TIMP-2, maintaining a balance essential for normal placentation [3, 4, 8].
Our finding of significantly increased plasma MMP-2 and TIMP-2 levels in PE patients compared to controls in both trimesters and overall, aligns with previous studies [9, 10]. However, the MMP-2/TIMP-2 ratio declined significantly in the PE group in the third trimester and overall, which may reflect its role in PE pathogenesis. Placental ischemia/hypoxia may stimulate vascular endothelial growth factor (VEGF) production, subsequently upregulating MMP-2 expression [11]. Elevated MMP-2 may also be mediated by interleukin-8 (IL-8) from endothelial cells under a chronic inflammatory conditions [12]. However, the reduced MMP-2/TIMP-2 ratio might indicate decreased proteolytic potential of MMP-2, resulting in impaired trophoblast invasion and vascular remodeling [3]. Additionally, the MMP-2 dependent vasodilatory effect is even more pronounced in PE compared to normal pregnancies or non-pregnant women. This suggests that inhibition of MMP-2 by TIMP-2 may decrease its vasodilatory capacity and increase the risk of vasoconstriction, exacerbating hypertensive symptoms [8]. Thus, altered MMP-2/TIMP-2 balance appears linked to both early and later stages of PE.
Notably, MMP-2 showed strong predictive value for PE in the second trimester (AUC = 0.817), consistent with findings by Bahabayi et al. [13], although our optimal cut-off (260.8 ng/mL) differed slightly, potentially due to population variations. Combining MMP-2 with TIMP-2 further improved second-trimester prediction (AUC = 0.893). In the third trimester, TIMP-2 emerged as the best single predictor (AUC = 0.807), supported by studies linking TIMP-2 (often combined with insulin-like growth factor binding protein-7 [IGFBP7]) to PE-related acute kidney injury [14].
MMP-3 (Stromelysin-1) is secreted in a zymogen form (pro-MMP-3) by decidual stromal cells, macrophages, and extravillous trophoblasts. Pro-MMP-3 is activated by serine proteases like trypsin and plasmin via proteolytic cleavage of its propeptide domain. During pregnancy, MMP-3 facilitates the directional migration of trophoblasts into maternal tissues by cleaving IGFBP-1, a key regulator of trophoblast motility. Additionally, MMP-3 contributes to ECM remodeling both directly, by degrading ECM components, and indirectly, by activating other MMPs [4, 15].
We found significantly elevated MMP-3 levels in patients with PE throughout
pregnancy, consistent with previous studies [6, 16]. A proposed pathogenesis
involves stressed syncytiotrophoblasts secreting pro-inflammatory cytokines,
including interleukin-1
MMP-3 contributed significantly to PE prediction in the second trimester with high specificity. Although trimester-specific MMP-3 data are limited, Laskowska [6] also suggested its relevance for early-onset PE, a form of the disorder associated with placental dysfunction.
MMP-9, expressed at the maternal-fetal interface, degrades ECM components and activates VEGF, playing roles in angiogenesis, particularly in microvascular development and tissue remodeling during labor [7, 17]. Its activity is inhibited by TIMP-1, and the MMP-9/TIMP-1 balance regulates trophoblast invasion [8].
We observed significantly lower plasma MMP-9 levels and a lower MMP-9/TIMP-1 ratio in the PE group, while TIMP-1 levels were not significantly different. This finding contrasts with studies reporting increased TIMP-1, but aligns with others demonstrating decreased placental MMP-9 expression and lower MMP-9/TIMP-1 ratios in hypertensive pregnancies [7, 18]. The strong positive correlation between MMP-9 and TIMP-1 (r = 0.773) in our PE group suggests a potential coordinated regulation or compensatory mechanism. Reduced MMP-9 activity could impair vascular remodeling and excess collagen deposition, leading to abnormal spiral artery development and contributing to placental ischemia. Syncytiotrophoblast stress resulting from ischemia might further suppress MMP-9 expression via inflammatory mediators, potentially creating a detrimental feedback loop [3]. Consistent with studies in hypertension, we found positive correlations between MMP-9, TIMP-1, and SBP in PE patients [18, 19].
We evaluated the trimester-specific predictive value of MMP-9, TIMP-1, and the
MMP-9/TIMP-1 ratio; however, their performances were limited (AUC
This study has some limitations that should be considered. First, it was conducted at a single center, which may limit the generalizability of the findings. Second, the use of a single blood sample provides only a snapshot of biomarker levels and does not reflect the dynamic changes that occur throughout pregnancy; therefore, longitudinal follow-up is necessary. Third, the study did not include functional assays such as zymography to evaluate the enzymatic activity of MMPs, which would have provided deeper mechanistic insight into their biological roles. Despite these limitations, our findings highlight trimester-specific alterations in MMPs and TIMPs in PE. The strong predictive performance of the combined MMP-2 and TIMP-2 in the second trimester, and of TIMP-2 alone in the third trimester, supports their potential utility as components of a multi-marker panel for PE risk assessment or diagnosis. While plasma analysis may not fully reflect placental events, its feasibility supports potential integration into prenatal screening protocols. Further longitudinal studies in larger and more diverse populations are needed to validate these findings and explore their clinical applicability.
Plasma levels of MMP-2, and TIMP-2, along with the MMP/TIMP ratio, are significantly altered in women with PE compared to controls, showing distinct trimester-specific patterns. Elevated MMP-2 and TIMP-2 levels, particularly their combination in the second trimester, and elevated TIMP-2 levels in the third trimester, show promise as potential predictive biomarkers for PE. These findings warrant further validation before clinical application.
The datasets used and analyzed during the current study are available from the corresponding author upon reasonable request.
TTN and NAL designed the research study. NAL, TDD, TNDN, TNTN, and SHD performed the research. TNTN, TDD and NAL analyzed the data. TNTN and TTN drafted the manuscript. All authors contributed to editorial changes in the manuscript. All authors read and approved the final manuscript. All authors have participated sufficiently in the work and agreed to be accountable for all aspects of the work.
The study was carried out in accordance with the guidelines of the Declaration of Helsinki. This study was reviewed and approved by the Ethics Committee of the Hanoi Obstetrics & Gynecology Hospital (Approval No. 734 CN/BVPS – TT ĐT CĐT, Date: June 24, 2022). Informed consent was obtained from all individual participants included in the study.
We thank Hanoi Medical University for facilitating this research. We are also grateful to all the doctors, nurses, and technicians at Hanoi Obstetrics and Gynecology Hospital, as well as to the postgraduate students from the Department of Physiology and Immunology at Hanoi Medical University, for their contributions to the completion of this study.
This research was funded by the Hanoi Department of Science and Technology (01C-08/14-2021-3).
The authors declare no conflict of interest.
During the preparation of this work, the authors used ChatGPT-4o in order to check spelling and grammar. After using this tool, the authors reviewed and edited the content as needed and take full responsibility for the content of the publication.
Supplementary material associated with this article can be found, in the online version, at https://doi.org/10.31083/CEOG42755.
References
Publisher’s Note: IMR Press stays neutral with regard to jurisdictional claims in published maps and institutional affiliations.