


 , Yangyang Fan 2, Liang Mu 1, Li Liu 1, Meiqing He 1, Yanhua Gao 1, Jing Shang 1, Xixi Zhang 1,*
1 Department of Ultrasound, Shaanxi Provincial People’s Hospital, 710068 Xi’an, Shaanxi, China
2 Department of Obstetrics, Shaanxi Provincial People’s Hospital, 710068 Xi’an, Shaanxi, China
Abstract
Preeclampsia (PE) is a common pregnancy complication and involves placental dysfunction and ischemia. Microvascular-Flow (MV-Flow) imaging was utilized to quantitatively assess placental microvascular architecture in PE. MV-Flow was also used to compare the microvascular architecture between PE and normal pregnancies, as well as between early- and late-onset PE cases.
The study enrolled 87 consecutive singleton pregnancies that underwent MV-Flow imaging examination between June 2021 and December 2021. Among these, 50 were normotensive pregnancies and 37 were PE pregnancies. The PE group was further stratified into early-onset (<34 weeks gestational age [GA], n = 25) and late-onset (≥34 weeks GA, n = 12) subtypes. Among the 50 normal cases, 38 were <34 weeks, and 12 were ≥34 weeks. MV-Flow technology was used to measure the placental vascular index (VIMV). The VIMVs for the middle and peripheral placental segments were referred to as VIMV-m and VIMV-p, respectively. Placental VIMVs were compared between PE and normotensive pregnancies, as well as between early- and late-onset PE cases. Perinatal outcomes were evaluated in pregnancies complicated by PE. A p-value < 0.05 (two-sided) was considered to be statistically significant.
No significant difference between the VIMV-p and VIMV-m was observed in either the normotensive or PE group, and neither parameter correlated with GA. Both VIMV-p and VIMV-m were significantly lower in early-onset PE cases compared to normotensive pregnancies <34 weeks GA (p < 0.001). Similarly, late-onset PE cases also showed lower VIMV-p and VIMV-m compared to normotensive pregnancies ≥34 weeks GA (p < 0.001). No significant differences were observed between early- and late-onset PE cases in either VIMV-p (p = 0.170) or VIMV-m (p = 0.471). Among PE pregnancies, placental VIMV measurements revealed no significant differences between appropriate-for-GA (AGA) and small-for-GA (SGA) neonates (VIMV-p: 21.40 [17.70–27.30] vs. 21.50 ± 2.50, p = 0.949; VIMV-m: 21.30 [17.50–27.50] vs. 22.80 ± 6.40, p = 0.881).
MV-Flow imaging enables quantitative assessment of microvascular architecture in PE placentas. Both early- and late-onset PE pregnancies showed significantly lower placental VIMV compared to normotensive pregnancies, supporting the clinical utility of MV-Flow for the evaluation of placental perfusion in PE. Furthermore, no significant difference in placental VIMV was observed between early- and late-onset PE, suggesting a similar impairment of placental perfusion in both subtypes.
Keywords
- placenta
- preeclampsia
- pregnancy
- ultrasonography
Preeclampsia (PE) is a common pregnancy complication affecting 3%–8% of pregnancies globally [1, 2]. It remains a leading cause of maternal and perinatal morbidity and mortality [1, 2]. Worldwide, approximately 10 million women develop PE annually, resulting in an estimated 76,000 maternal deaths and 500,000 neonatal deaths attributable to PE-related hypertensive disorders [1, 3]. According to the American College of Obstetricians and Gynecologists, the principal diagnosis of PE is the onset of hypertension after 20 weeks of gestation, accompanied by signs of end-organ damage including proteinuria, thrombocytopenia, renal insufficiency, impaired liver function, pulmonary edema, or new-onset headache/visual symptoms that are unresponsive to medication and unexplained by alternative diagnoses [4]. Clinically, PE is stratified into early-onset (
Placental perfusion is associated with both maternal blood flow and fetal circulation. Physiologically, trophoblast invasion induces remodeling of maternal uterine spiral arteries, characterized by loss of the vascular muscular layer and subsequent vasodilation. This transformation establishes high-flow uteroplacental circulation through the structural conversion of uterine arteries into low-resistance vessels [1, 6, 7]. The pathophysiology of early-onset PE stems primarily from defective spiral artery remodeling, leading to impaired uteroplacental perfusion, defective placentation, and subsequent placental hypoxia [8, 9]. In contrast, late-onset PE is associated with placental oxidative changes triggered by progressive disparity between maternal perfusion and fetoplacental demands [8, 9]. While the pathogenesis and placental pathology of early- and late-onset PE appear to be different, both forms involve placental dysfunction and ischemia [9, 10].
Given the central role of the placenta in PE pathophysiology, it is important to develop non-invasive, clinically practical methods for its in vivo functional assessment [11, 12]. In terms of conventional ultrasonography, Doppler parameters for the umbilical artery (UA) and uterine artery (UtA) provide overall resistive indices for the upstream arterial vessels of placental vascular beds on the fetal and maternal sides, respectively. However, these metrics only provide an indirect assessment of placental perfusion and cannot directly quantify microvascular density within the placenta [13]. Therefore, more advanced non-invasive imaging modalities capable of direct visualization and quantitative assessment of placental microvascular perfusion characteristics may be required [14].
Previous studies have attempted to assess placental perfusion using three-dimensional (3D) power Doppler ultrasound. However, this approach is limited by factors such as equipment settings, the requirement for experienced operators, and low reproducibility in the second and third trimesters [13, 14]. Recently, a new and non-invasive microvascular-flow (MV-Flow) imaging technology (Samsung Medison Co. Ltd, Seoul, Korea) has been used to assess the microvasculature in carotid plaque, hepatic parenchyma, fetal brain, and the placenta in normal, fetal growth restriction, and placenta accreta spectrum disorders [13]. Thanks to key features including high tissue suppression (noise reduction), advanced flash artifact filtering, compound imaging capabilities, and high sensitivity, MV-Flow technology can detect minute vessels with low-velocity blood flow that are not visible with conventional Doppler imaging [15, 16]. This innovative technology not only enables visualization of the placental villous shaft, but also quantification of the placental microvascular structure at the level of the villous lobe [17].
The aim of the present study was to evaluate the utility of MV-Flow imaging in characterizing the placental microvascular architecture in PE pregnancies. In addition, considering the distinct pathophysiological pathways between early- and late-onset PE, we compared microvascular differences between PE and normal pregnancies, as well as between early- and late-onset PE cases.
The protocol for this observational study was approved by the institutional review board of the hospital from which cases were recruited. Written informed consent was obtained from all participating subjects.
The study enrolled 87 consecutive pregnant women who underwent ultrasound examination in our department between June 2021 and December 2021. Placental MV-flow imaging was performed on all cases. The following inclusion criteria were applied: singleton pregnancy, healthy pregnant women without any gestation-related disease, pregnant women diagnosed with PE, successful ultrasound examination, an anterior placenta, and GA
Of the 87 singleton pregnancies that were finally included, 50 were normal cases without PE (normal group) and 37 were PE cases (PE group). The mean maternal age was 29.60
Ultrasound examinations were performed using a HERA W10 ultrasound system (Samsung Medison Co., Ltd., Seoul, Korea) equipped with a transabdominal CA1–7 MHz transducer. All scans were conducted by a maternal-fetal medicine-certified sonographer with
In this study, when the fetus was not moving, maternal breath-holding was practiced to allow acquisition of an optimal placental gray image, after which the MV-Flow function was activated to obtain a stable MV-Flow image of the placenta. For each case, the MV-Flow examination parameters were set as follows: image quality: normal; sensitivity: 26; tissue suppression: 3; color gain: 50; filter: 3; smooth: 1; LumiFlow: 2; alpha blending: 75%; dynamic range: 20 [13]. Once the MV-Flow function was activated, the placental microvasculature image was shown and an ellipse-shaped region of interest (ROI) was automatically provided. The ROI size was modified to envelope as much of the placental microvasculature as possible. This included placental chorionic vessels only, and excluded vessels located within the uterine muscles or on the surface of the chorionic plate. Subsequently, the vascular index (VIMV) for the ROI was automatically calculated by the software. The VIMV, defined as the ratio of the number of blood-filled pixels to total pixels within the ultrasound image, allowed the microvascularization per region of biological tissue to be quantified. Therefore, placental VIMV represents a quantitative assessment of placental microvascularization.
The placenta was divided into middle and peripheral regions along the longitudinal axis, with the middle segment corresponding to the middle third of the placenta along its axis, and the peripheral segment comprising the remaining portion [20]. MV-Flow imaging was performed three times in both the middle and peripheral placental segments, yielding three separate VIMV measurements per region. The mean of three measurements per region was calculated and recorded as VIMV-middle (VIMV-m) or VIMV-peripheral (VIMV-p) (Fig. 1).
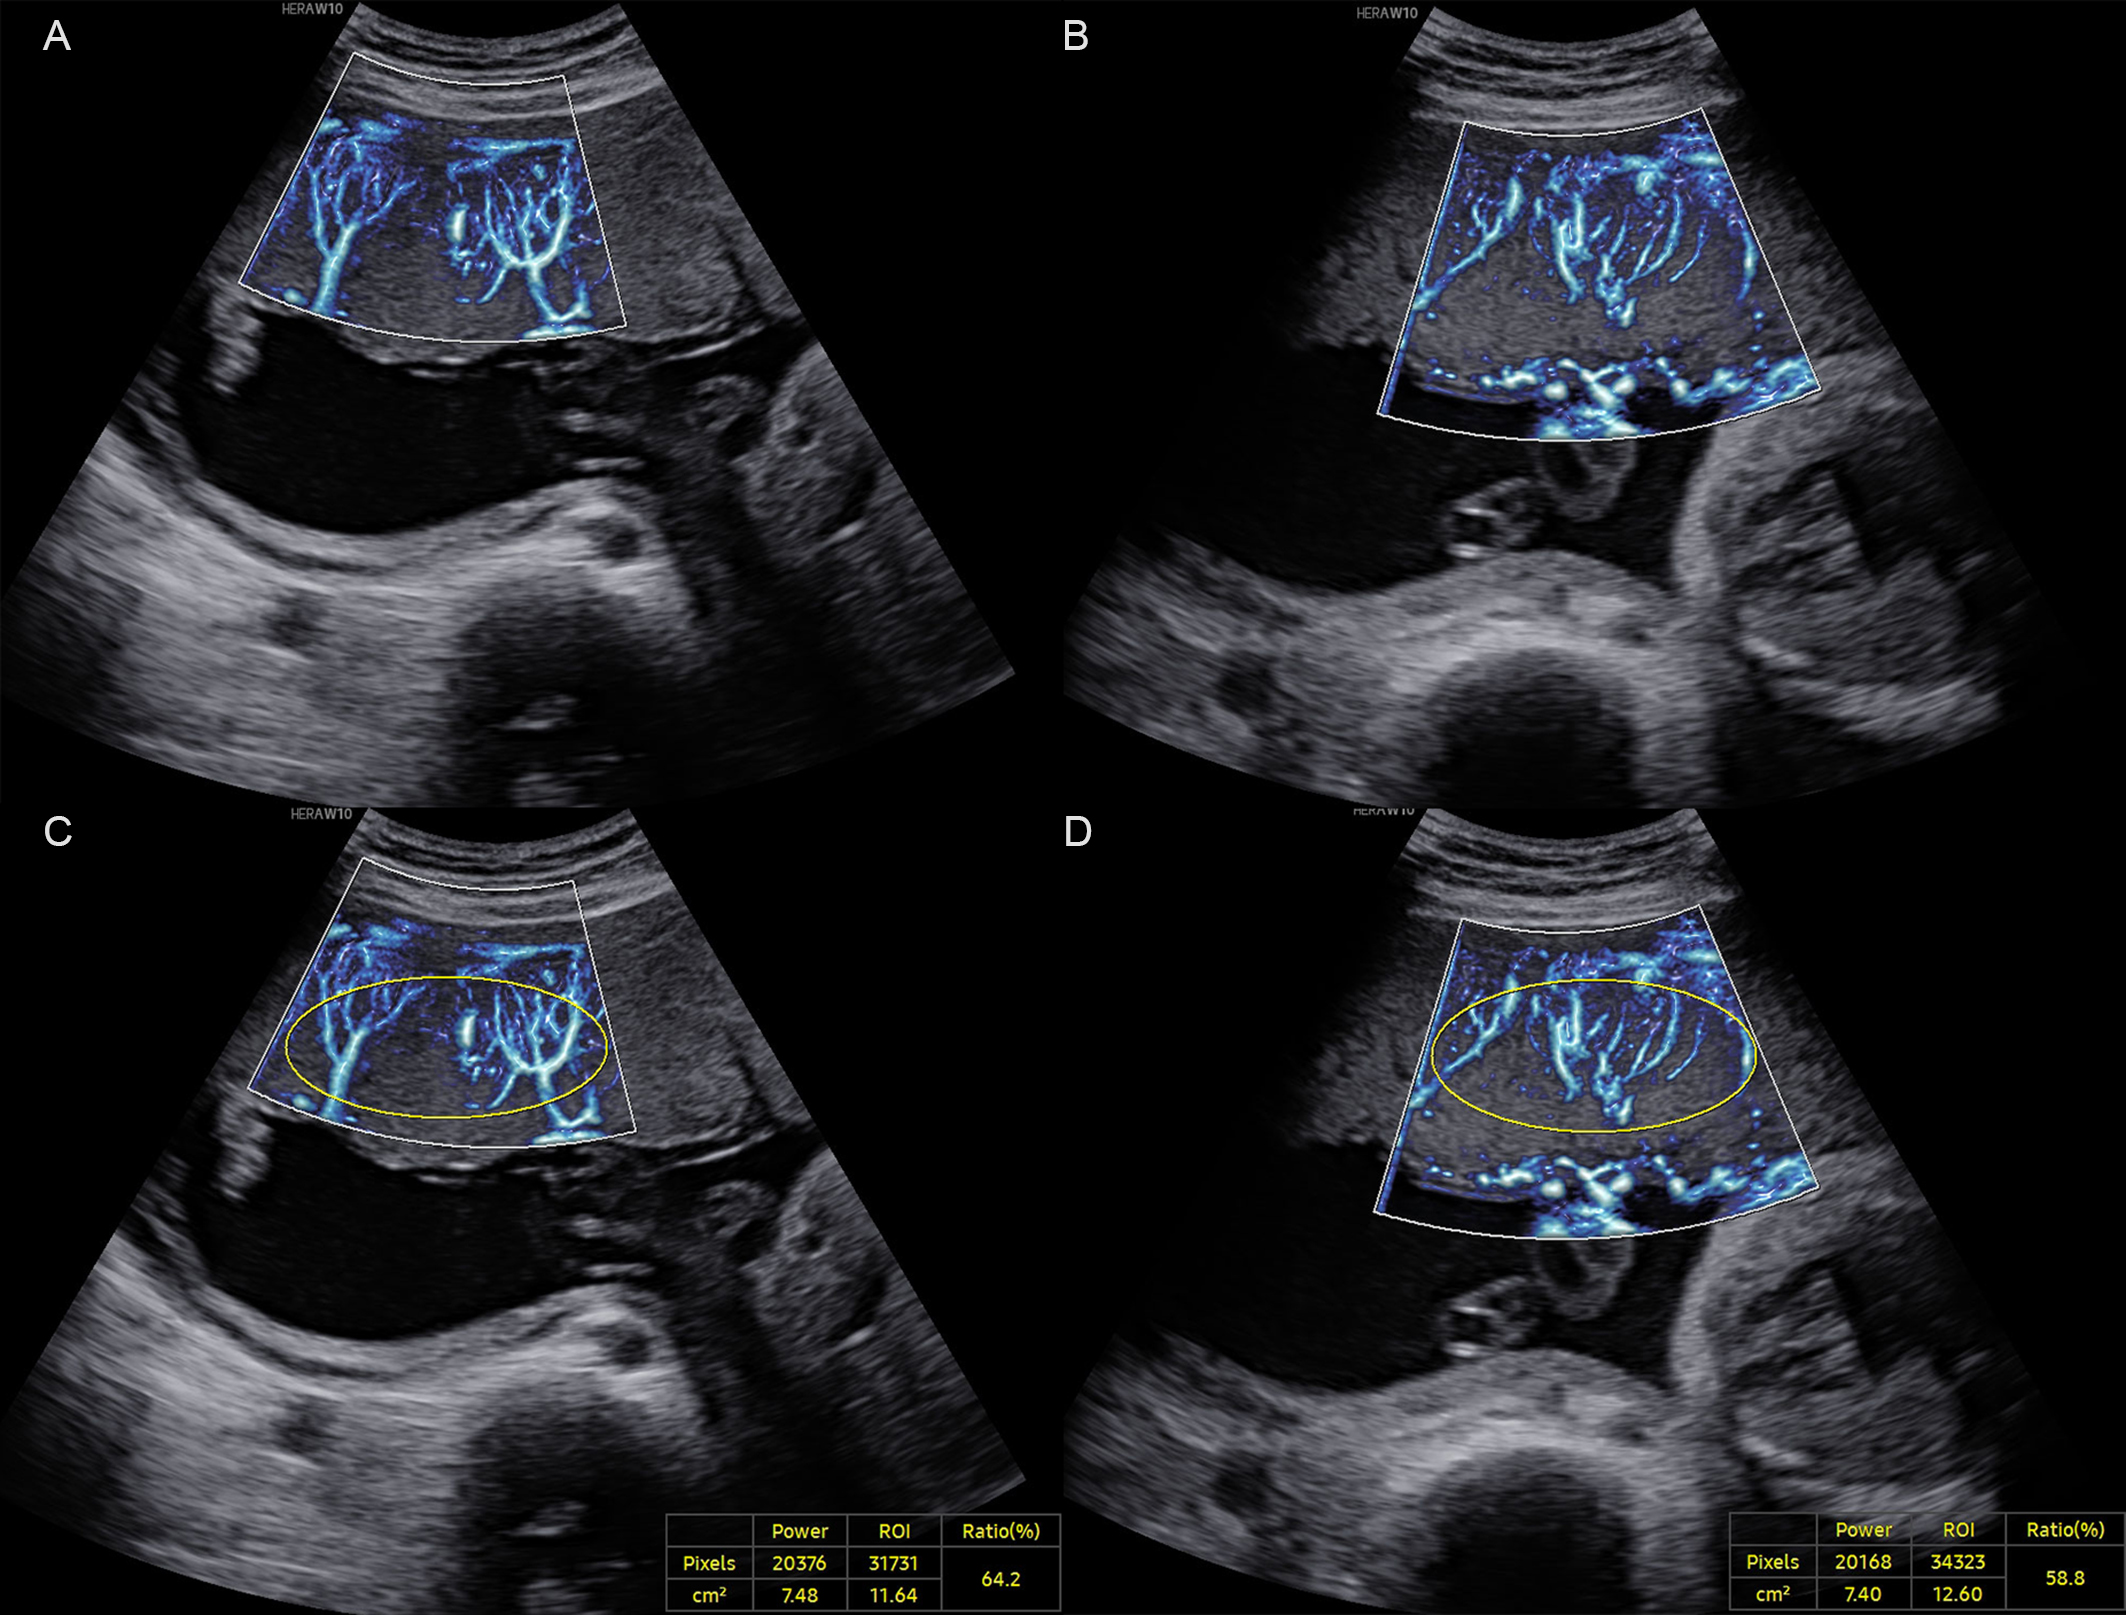 Fig. 1.
 A normal pregnancy case at 27+6 weeks of gestation. (A) MV-Flow imaging of the peripheral segment of the placenta along the longitudinal axis. (B) MV-Flow imaging of the middle segment. (C) Vascular index (VIMV) for the peripheral segment (VIMV-p, 64.2%). (D) VIMV for the middle segment (VIMV-m, 58.8%). ROI, region of interest; MV-Flow, microvascular-flow. The yellow circle shows the ellipse-shaped region of interest for which the VIMV was calculated.
Pregnancy outcome data were collected for pregnant women diagnosed with PE. The following perinatal outcomes were recorded: GA at delivery, mode of delivery, birthweight and birthweight percentile, and Apgar test score. The 2015 Chinese neonatal birth weight curve for different GA [21] was used to classify newborns according to their birthweight. Those with a birthweight below the 10th percentile were defined as small for gestational age (SGA), while neonates with a birthweight between the 10th and 90th percentile were defined as appropriate for gestational age (AGA) [19].
The Shapiro-Wilk test was used to assess whether the sample data was normally distributed. Continuous data were presented as the mean
Among the 87 cases included in this study, 50 were normal pregnancies and 37 were diagnosed with PE. Women with PE were significantly older than healthy controls (31.40
| PE | Normal pregnancy | p | |
| (n = 37) | (n = 50) | ||
| Maternal age (years) | 31.40 | 28.30 | 0.005 |
| GA at examination (weeks) | 32.20 | 30.80 | 0.102 |
| VIMV-p (%) | 19.90 (18.40–24.70) | 42.80 | |
| VIMV-m (%) | 21.20 (17.30–27.40) | 42.40 |
n represents the sample size. PE, preeclampsia; GA, gestational age.
The intra-observer correlation coefficients for VIMV-m and VIMV-p were 0.96 (95% confidence interval (CI): 0.94–0.97) and 0.94 (95% CI: 0.92–0.96), respectively, demonstrating the high reliability of measurements.
In normal pregnancies, no significant difference was observed between the VIMV-p and VIMV-m (42.80
VIMV values for the control and PE groups were compared irrespective of the GA. Both the VIMV-p and VIMV-m in the PE group were significantly lower than those in the control group (p
GA at examination was
| Early-onset PE | Normal pregnancy | p | ||
| (n = 25) | (n = 38) | |||
| GA (weeks) | 30.20 | 28.60 (27.10–31.30) | 0.115 | |
| VIMV-p (%) | 19.00 (17.30–23.40) | 42.10 | ||
| VIMV-m (%) | 19.80 (17.30–25.10) | 40.70 (37.00–46.20) | ||
| Umbilical artery | ||||
| RI | 0.72 | 0.63 | 0.013 | |
| PI | 1.16 (0.86–1.45) | 0.96 | 0.030 | |
| Middle cerebral artery | ||||
| RI | 0.78 | 0.85 | 0.002 | |
| PI | 1.68 (1.24–1.87) | 1.88 | 0.066 | |
| Right uterine artery | ||||
| RI | 0.76 (0.59–0.84) | 0.48 | ||
| PI | 1.84 (1.01–2.25) | 0.68 (0.53–0.87) | ||
| Left uterine artery | ||||
| RI | 0.68 | 0.48 | ||
| PI | 1.26 (0.99–2.16) | 0.70 (0.60–0.82) | ||
| GA-specified centile of UA-PI (n) | 0.022 | |||
| 4/25 (16%) | 6/38 (16%) | |||
| 10th–90th | 11/25 (44%) | 30/38 (79%) | ||
| 10/25 (40%) | 2/38 (5%) | |||
| GA-specified centile of right UtA-PI (n) | ||||
| 0/25 (0%) | 11/38 (29%) | |||
| 10th–90th | 9/25 (36%) | 25/38 (66%) | ||
| 16/25 (64%) | 2/38 (5%) | |||
| GA-specified centile of left UtA-PI (n) | ||||
| 0/25 (0%) | 7/38 (18%) | |||
| 10th–90th | 9/25 (36%) | 30/38 (79%) | ||
| 16/25 (64%) | 1/38 (3%) | |||
PI, pulsatility index; RI, resistive index; UA-PI, umbilical artery pulsatility index; UtA-PI, uterine artery pulsatility index.
| Late-onset PE | Normal pregnancy | p | ||
| (n = 12) | (n = 12) | |||
| GA (weeks) | 36.20 | 36.50 | 0.779 | |
| VIMV-p (%) | 23.50 | 45.00 | ||
| VIMV-m (%) | 22.80 | 43.80 | ||
| Umbilical artery | ||||
| RI | 0.61 | 0.51 | 0.004 | |
| PI | 0.93 | 0.71 | 0.003 | |
| Middle cerebral artery | ||||
| RI | 0.75 (0.74–0.78) | 0.78 | 0.416 | |
| PI | 1.41 (1.31–1.50) | 1.64 | 0.116 | |
| Right uterine artery | ||||
| RI | 0.48 | 0.44 (0.39–0.48) | 0.470 | |
| PI | 0.69 (0.54–0.85) | 0.63 (0.54–0.71) | 0.419 | |
| Left uterine artery | ||||
| RI | 0.49 | 0.51 | 0.673 | |
| PI | 0.63 (0.50–1.04) | 0.83 | 0.460 | |
| GA-specified centile of UA-PI (n) | 0.039 | |||
| 1/12 (8%) | 5/12 (42%) | |||
| 10th–90th | 8/12 (67%) | 7/12 (58%) | ||
| 3/12 (25%) | 0/12 (0%) | |||
| GA-specified centile of right UtA-PI (n) | 0.832 | |||
| 2/12 (17%) | 1/12 (8%) | |||
| 10th–90th | 9/12 (75%) | 10/12 (84%) | ||
| 1/12 (8%) | 1/12 (8%) | |||
| GA-specified centile of left UtA-PI (n) | 0.746 | |||
| 3/12 (25%) | 1/12 (8%) | |||
| 10th–90th | 6/12 (50%) | 8/12 (67%) | ||
| 3/12 (25%) | 3/12 (25%) | |||
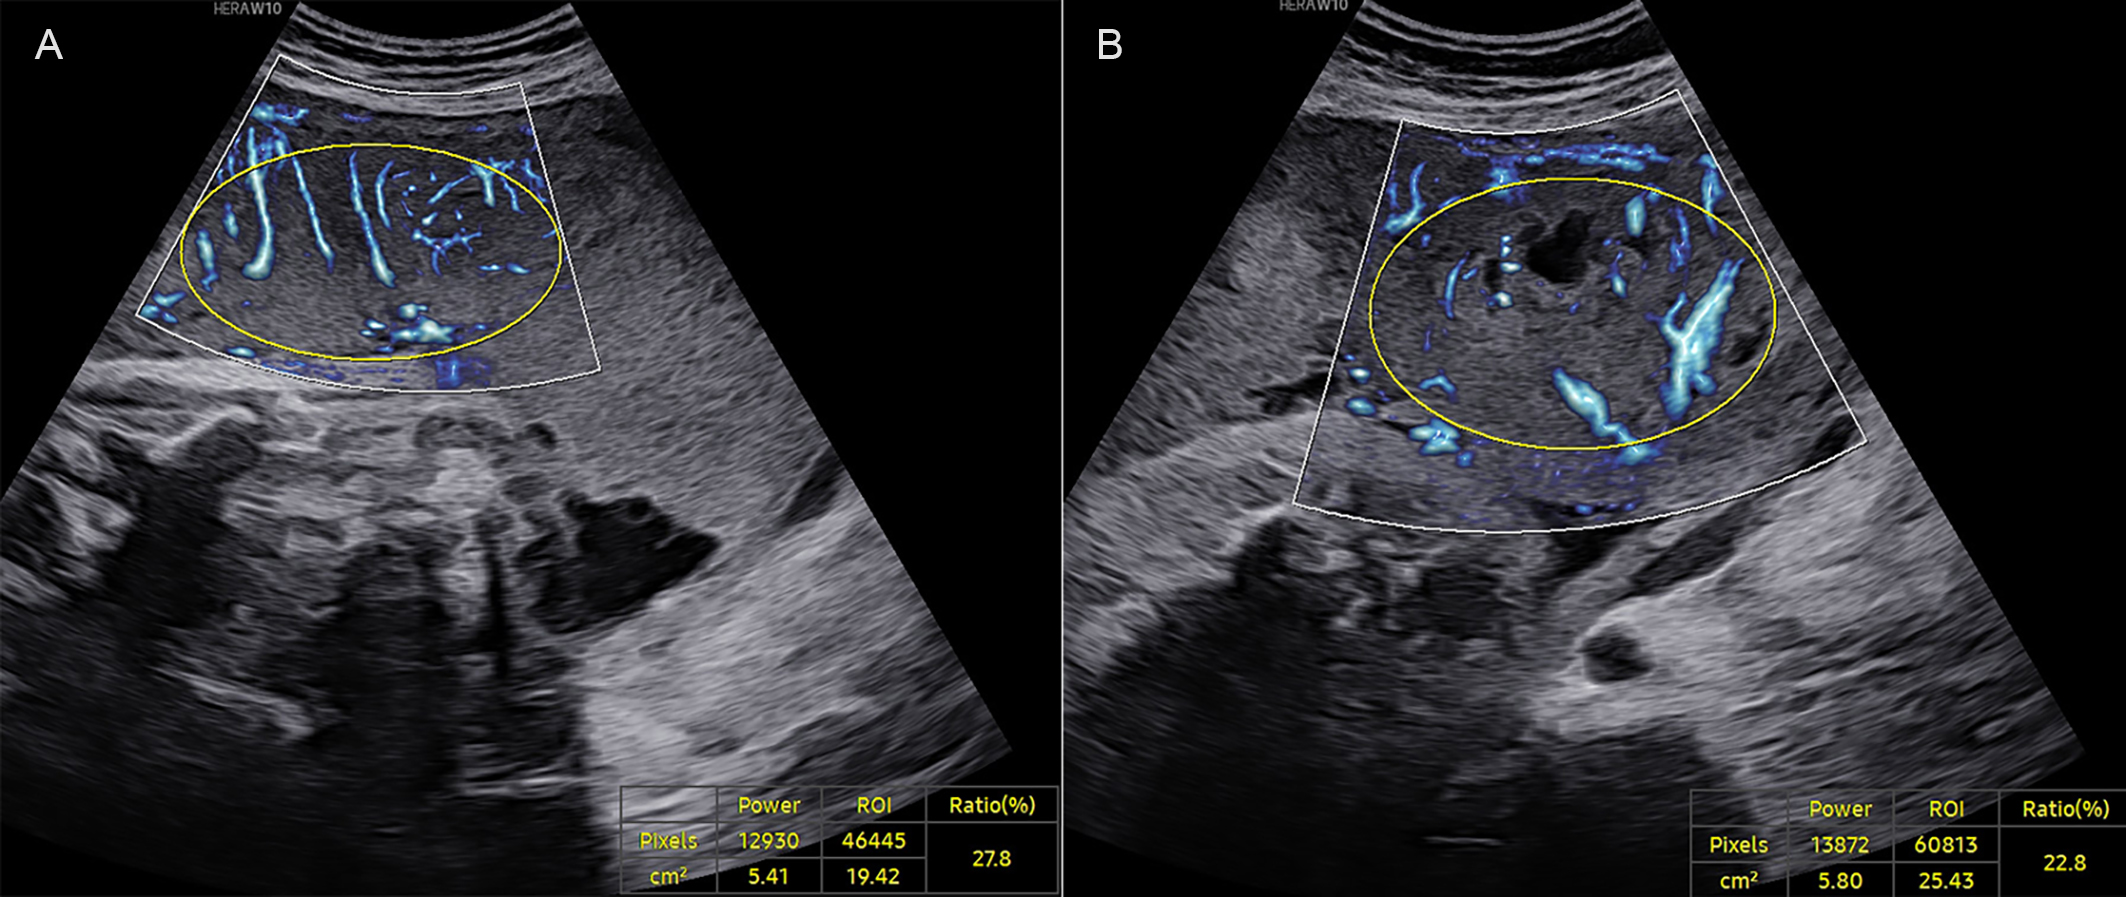 Fig. 2.
 A late-onset PE case at 37+0 weeks of gestation. (A) VIMV for the middle segment (VIMV-m, 27.8%). (B) VIMV for the peripheral segment (VIMV-p, 22.8%). The yellow circle shows the ellipse-shaped region of interest for which the VIMV was calculated.
Hemodynamic parameters for the UA, bilateral UtAs, and MCA were compared between PE cases and GA-matched normal cases. In the early-onset PE group, the RI and PI of the UA and of both UtAs were significantly higher than those of the normal group at
Perinatal outcomes were systematically evaluated in pregnancies complicated by PE. In the 37 PE cases, two early-onset cases were lost to follow-up, while three early-onset cases underwent medically indicated pregnancy termination. All 32 remaining PE cases (20 early-onset and 12 late-onset) underwent cesarean delivery at our institution, allowing comprehensive analysis of perinatal outcomes including GA at delivery, birth weight, and Apgar scores (1-, 5-, and 10-minute) (Table 4). The Apgar scores at 1 and 5 minutes were significantly higher in the late-onset PE group than in the early-onset PE group (p
| Early-onset PE | Late-onset PE | ||
| (n = 20) | (n = 12) | ||
| Maternal age (years) | 32 | 30 | |
| GA at examination (weeks) | 30.50 | 36.20 | |
| Birth age (weeks) | 31.30 | 36.30 | |
| Birth weight (g) | 1429.00 | 2321.00 | |
| Birth classification (n) | |||
| SGA newborn | 3/20 (15%) | 5/12 (42%) | |
| AGA newborn | 17/20 (85%) | 7/12 (58%) | |
| Sex (n) | |||
| Female | 8/20 (40%) | 8/12 (67%) | |
| Male | 12/20 (60%) | 4/12 (33%) | |
| Apgar score at 1 min | 6.70 | 9 for 7 cases, 10 for 5 cases | |
| Apgar score at 5 min | 2 for one case, 9 for 5 cases, 10 for 14 cases | 10 for all cases | |
| Apgar score at 10 min | 2 for one case, 9 for 3 cases, 10 for 16 cases | 10 for all cases | |
SGA, small for gestational age; AGA, appropriate for gestational age.
This study utilized MV-Flow ultrasound technology to quantify placental microvascularization, expressed as VIMV, in both normal and PE pregnancies. Our findings revealed significantly reduced placental VIMV values in PE pregnancies compared to normal pregnancies. Compared with normal pregnancies of
We found no difference between the VIMV-p and VIMV-m in either the PE or normal groups, demonstrating that placental VIMV was not related to the measurement site. Both VIMV-m and VIMV-p showed high intra-observer agreement, with correlation coefficients of 0.96 and 0.94, respectively. These results indicate that placental VIMV could be a highly reproducible metric, regardless of the sampling location. Chen et al. [13] also previously evaluated the placental microvascular architecture in normal and fetal growth-restricted pregnancy with MV-Flow imaging. In agreement with the present study, these workers found no significant variation in VIMV among different placental regions.
Our analysis demonstrated that placental VIMV was not associated with GA in either normal pregnancies or PE cases. Previous studies employing 3D power Doppler with virtual organ computer-aided analysis (VOCAL) technique demonstrated that placental vascularization indices (Vascularization Index, Flow Index, Vascularization Flow Index) were not dependent on GA during mid- and late-trimester [24, 25]. Our quantitative analysis revealed a significant reduction in placental VIMV among PE pregnancies compared to normal pregnancies. Previous studies that utilized placental 3D power doppler also showed decreased placental vascularization indices in pregnancies with PE [11, 26]. Therefore, despite using different ultrasound techniques, the present study and others have consistently shown that placental vascularization does not change according to the GA. Furthermore, these studies have consistently demonstrated impaired placental vascularization in PE pregnancies, concordant with the pathological feature of placental ischemia in PE [10, 11, 26].
In early-onset PE cases, we also found that both the RI and PI of the UA and UtAs were significantly higher compared to normal pregnancies at GA
As previously demonstrated, both early- and late-onset PE cases exhibited significantly higher UA resistance indices compared to GA-matched controls, along with reduced placental microvascular density as evidenced by markedly lower placental VIMV. Together, these findings confirm the pathological microvascular insufficiency characteristic of PE placenta. Notably, UA resistance serves as an indirect indicator of placental hypoperfusion, whereas VIMV provides direct quantitative evidence of microvascular deficiency.
However, our study found no significant differences in placental VIMV-p (p = 0.170) or VIMV-m (p = 0.471) between early- and late-onset PE cases. This indicates that although the early- and late-onset subtypes have different pathophysiological pathways, both subtypes may have similar impairment of placental perfusion.
The perinatal outcomes of PE pregnancies were also analyzed in this study. In PE cases, no significant differences in placental VIMV were observed between AGA and SGA neonates, suggesting that VIMV may lack predictive value for SGA development in PE pregnancies. Using alternative placental vascular imaging techniques, the existing literature presents conflicting evidence regarding vascular indices and SGA prediction. Some studies reported significant associations between reduced placental vascularization and SGA risk [27, 28]. However, consistent with our findings, other investigators [29, 30] found that placental vascular indices cannot predict this complication. Therefore, it remains controversial as to whether reduced placental vascularization can predict the risk of SGA newborns.
The primary novelty of our study lies in its application for the first time of MV-Flow imaging to quantitatively evaluate and compare the placental microvasculature between normal and PE pregnancies, and between early- and late-onset PE cases. Other recent studies have employed the microvascular imaging technique of Superb Microvascular Imaging (SMI) to evaluate the placental vascular characteristics [14, 20, 31, 32, 33, 34]. These studies were mainly conducted to evaluate placental microvascularization in normal pregnancy, pregnancy with fetal growth restriction, pregnancy with gestational diabetes, and placenta accreta spectrum [14, 20, 31, 32, 33, 34]. SMI also proved useful for the evaluation of placental microcirculation. However, those SMI studies did not specifically examine differences in the placental microvasculature between normal and PE pregnancy, or between early- and late-onset PE.
The present study has several limitations that should be acknowledged. Firstly, the small sample size of the PE group in particular reduced the statistical power of the study and should be considered when interpreting the findings. Nevertheless, as a pilot application of MV-Flow technology in PE, this research provides foundational data for larger studies in the future. Second, to ensure optimal signal quality for the detection of placental microvessels and minimize potential confounding from placental abnormalities, our analysis was restricted to cases with an anterior placenta, and pregnancies with either abnormal placental implantation or umbilical cord anomalies were excluded. While these methodological choices enhanced the internal validity of our study, they excluded many pregnancies and limited the generalizability of our results. Finally, as a single-center investigation, this study may be subject to institutional biases that could affect the accuracy of conclusions. Further multicenter studies with larger cohorts are required to improve the reliability and validity of this research. Additionally, expansion of the inclusion criteria to encompass diverse placental and umbilical cord conditions would enhance the clinical applicability of our findings.
MV-Flow imaging enables quantitative assessment of the microvascular architecture in PE placentas. Both early- and late-onset PE pregnancies showed significantly lower placental VIMV compared to normal pregnancies, thus supporting the clinical utility of MV-Flow for evaluation of placental perfusion in PE. Furthermore, no significant difference in placental VIMV was observed between early- and late-onset PE, suggesting similar impairment of placental perfusion in both subtypes.
The data that support the findings of this study are available on request from the corresponding author.
XZ, YF, and LL designed the research study. JP, YG, and XZ performed the research. LM, MH, and JS analyzed the data. All authors contributed to editorial changes in the manuscript. All authors read and approved the final manuscript. All authors have participated sufficiently in the work and agreed to be accountable for all aspects of the work.
The study was carried out in accordance with the guidelines of the Declaration of Helsinki. The study was approved by the Research Ethics Committee of Shaanxi Provincial People’s Hospital (2021213) and written informed consent was obtained from all subjects.
Not applicable.
This work was supported by the Science and Technology Talents Support Project of Shaanxi Provincial People’s Hospital (No. 2022JY-22), the Social Development Projects of Science and Technology Department of Shaanxi Province (No. 2022SF-209), the Project of Shaanxi Provincial People’s Hospital (No. 2023YJY-62), and the Natural Science Basic Research Program of Science and Technology Department of Shaanxi Province (No. 2025JC-YBQN-1234).
The authors declare no conflict of interest.
References
Publisher’s Note: IMR Press stays neutral with regard to jurisdictional claims in published maps and institutional affiliations.