


 , Shaoqing Jiang 1, Dehong Liu 1, Zhongrong Wei 1, Jing Xu 2,*
 , Zixuan Shen 3,*
1 Department of Medical Imaging, People’s Hospital of Yuxi City, 653100 Yuxi, Yunnan, China
2 Department of Radiology, Beicheng Central Hospital, 653100 Yuxi, Yunnan, China
3 Department of Medical Imaging, Zhuhai Hospital of Integrated Traditional Chinese and Western Medicine, 519000 Zhuhai, Guangdong, China
Abstract
Postpartum ovarian vein thrombophlebitis (POVT) is a rare yet potentially life-threatening complication. This study assesses the diagnostic utility of clinical manifestations and semi-quantitative parameters derived from non-contrast computed tomography (CT).
A total of 34,140 postpartum patients at People’s Hospital of Yuxi City from December 2017 to October 2024 were included. Among them, only 24 POVT cases and 42 non-POVT puerperal women had complete clinical and CT datasets. In both groups, the CT attenuation values of the ovarian vein (OV) and inferior vena cava (IVC), OV diameter, CT attenuation difference (OV CT value minus IVC CT value), and OV/IVC attenuation ratio (OV CT value divided by IVC CT value) were recorded. Comparisons were made between the two groups regarding D-dimer levels, OV width, CT attenuation values, and OV/IVC attenuation ratio. Data were analyzed using SPSS version 27.0, the chi-square test, or the Mann-Whitney U test conducted at a significance level of <0.05.
D-dimer levels were significantly higher in the POVT group (7.66 ± 4.94 vs. 1.94 ± 0.91 μg/mL, p < 0.01). Semi-quantitative non-contrast CT metrics showed strong diagnostic performance: OV width ≥0.90 cm (sensitivity 91.70%, specificity 95.20%), thrombus CT value ≥46.00 HU (sensitivity 100%, specificity 100%), CT attenuation difference ≥12.50 HU (sensitivity 95.30%, specificity 100%), and OV/IVC attenuation ratio ≥1.10 (sensitivity 95.30%, specificity 100%) clearly distinguished POVT from non-POVT patients (p < 0.01).
Non-contrast CT provides a valuable imaging modality for identifying POVT. D-dimer levels, combined with semi-quantitative CT parameters—OV width, thrombus CT value, CT attenuation difference, and OV/IVC attenuation ratio—can significantly improve diagnostic precision.
Keywords
- postpartum
- ovarian vein
- thrombophlebitis
- computed tomography
- semi-quantitative parameters
Postpartum ovarian venous thrombophlebitis (POVT) is a rare yet potentially life-threatening condition that can develop after childbirth. Its lack of specific clinical symptoms and signs often hinders prompt and accurate diagnosis, leading to delays in initiating proper treatment. This delay increases the risk of serious complications such as extensive thrombus formation in the lower limb veins and inferior vena cava, pulmonary embolism, and septic shock [1]. While most frequently associated with the postpartum period, POVT has also been linked to pelvic inflammatory disease, malignancies, sepsis, pelvic surgery, and hypercoagulable conditions including autoimmune diseases and inherited thrombophilia [2]. Complications are often severe and may include sepsis and pulmonary embolism [3]. Most existing literature has discussed pelvic ovarian vein thrombosis through individual case reports or small case series [2, 3, 4, 5, 6], and clinical severity varies significantly, with symptoms ranging from absent local inflammation to ovarian abscess or tissue necrosis [7]. On imaging, non-contrast computed tomography (CT) often reveals heterogeneous density in the inferior vena cava, while contrast-enhanced CT typically shows right ovarian vein dilation with a low-density filling defect at the junction of the right ovarian vein and the inferior vena cava, findings consistent with thrombosis [8]. Although contrast-enhanced CT plays a central role in diagnosis—used in 84% of cases [2]—its use is concerning in pregnant and lactating women due to risks such as acute kidney injury from contrast agents [9] and higher radiation doses associated with cumulative cancer risk [10]. This, combined with the condition’s variable clinical presentations and the reliance on fragmented case-based evidence, creates substantial challenges in timely and accurate diagnosis, exacerbating the risk of severe complications.
Despite the growing body of literature on POVT [2, 3, 4, 5, 6], a critical gap remains. Most studies have focused on individual cases or small series, and existing research has not thoroughly or systematically described the imaging features of POVT on non-contrast CT. While contrast-enhanced CT is widely recognized as the primary diagnostic tool [2], its limitations—including risks to maternal health (e.g., acute kidney injury [AKI]) and radiation exposure—make non-contrast CT a more favorable option for vulnerable populations like lactating women. However, the lack of systematic analysis of non-contrast CT findings for POVT leaves a significant void in diagnostic guidance, hindering precise identification and management of the condition.
To address this gap, the present study aims to carry out a detailed, multi-dimensional analysis of D-dimer levels and semi-quantitative non-contrast CT findings in POVT. By focusing on these understudied aspects, the research seeks to improve diagnostic precision and guide more effective treatment planning, ultimately addressing the unmet need for comprehensive insights into non-contrast imaging characteristics of POVT.
This retrospective study received approval from the Ethics Committee of People’s Hospital of Yuxi City (approval number: 2025kmykdx6f060). From December 2017 to October 2024, there were a total of 34,140 patients who underwent cesarean section in our hospital, among whom 19,912 had vaginal deliveries and 14,228 had cesarean sections.
The diagnostic criteria for POVT [1, 8] included postpartum fever, lack of response to simple anti-infective treatment, thrombosis confirmed by contrast-enhanced CT, clinical improvement following combined anti-infective and anti-thrombotic therapy, and recovery confirmed by follow-up at 3 months.
Postpartum women who underwent a CT scan from the top of the diaphragm to the lower edge of the pubic symphysis within the 42-day postpartum period were included in this study [11].
The exclusion criteria were as follows:
(1) Patients with ovarian vein tumors.
(2) Patients who have undergone internal fixation surgery around the ovarian vein.
A 64-slice CT scanner (GE Lightspeed VCT, GE Healthcare, Waukesha, WI, USA) was
used for 16 POVT cases and 36 non-POVT cases. Scan parameters included 120 kV,
250 mA, a 0.6-second rotation time, 40 mm detector width, 0.984:1 pitch, and a
512
All CT images were analyzed using a GE workstation (ADW 4.7, GE Healthcare, Waukesha, WI, USA). The slice thickness and inter-slice interval were both set at 0.625 mm.
Two radiologists with 16 and 21 years of experience independently evaluated the CT data. Any differences in interpretation were resolved through discussion. Key POVT-related features included the presence of thrombus in the ovarian vein, surrounding exudation, and pelvic effusion.
A senior radiologist with 21 years of experience in gynecological imaging measured the ovarian vein width and the CT values of both the ovarian vein and inferior vena cava. Measurements were taken three times on different slices, and the average was used (Figs. 1A,2A,3A,C,D). The CT attenuation difference was defined as the CT value of the ovarian vein (on the side with higher density and greater width) minus the CT value of the inferior vena cava. The ratio was calculated by dividing the ovarian vein CT value (same side) by the inferior vena cava CT value.
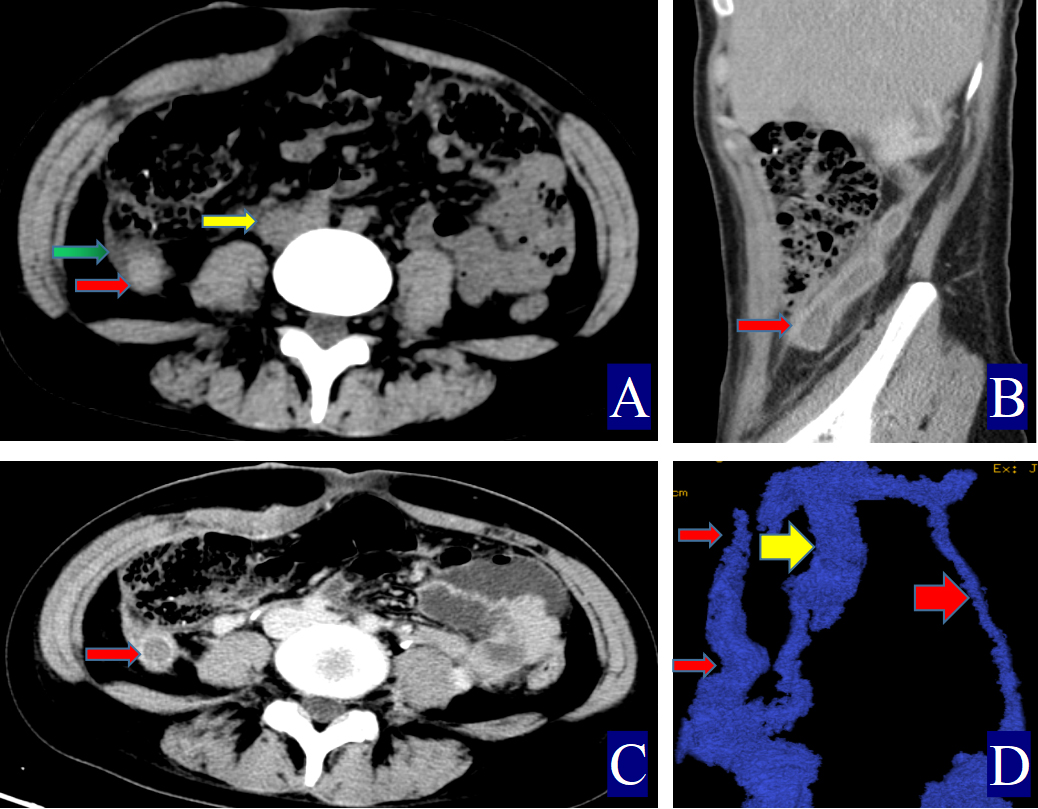 Fig. 1.
A 24-year-old woman with right ovarian vein thrombophlebitis. The red arrow indicates the ovarian vein, the yellow arrow indicates the inferior vena cava, and the green arrow indicates the periovarian vein exudate. (A) Non-contrast axial CT image. The right OV is approximately 1.4 cm wide (CT value = 52.00 HU, red arrow). The inferior vena cava shows a CT value of 32.40 HU (yellow arrow), with visible surrounding exudation (green arrow). (B) Contrast-enhanced sagittal CT image. A filling defect is observed in the right ovarian vein, consistent with POVT, and the vessel wall appears uniformly thickened (red arrow). (C) Contrast-enhanced axial CT image. The right ovarian vein shows a clear filling defect, and the vessel wall is uniformly thickened (red arrow). (D) Three-dimensional vein reconstruction. The inferior vena cava is marked (yellow arrow), with the right OV shown as a thin red arrow and the left OV as a thick red arrow.
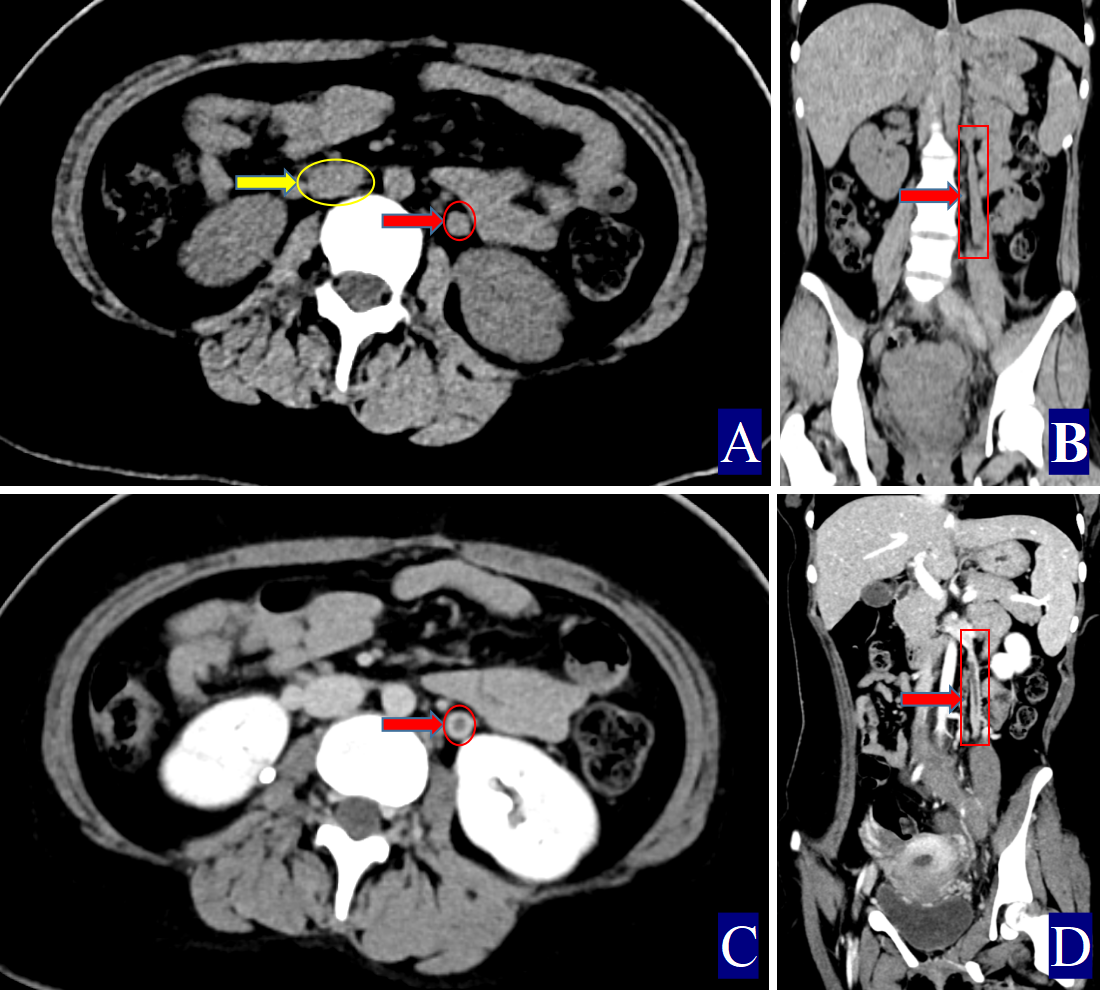 Fig. 2.
A 17-year-old woman with left ovarian vein thrombophlebitis. The red color (red circle, red arrow and red cuboid) indicates the ovarian vein, the yellow color (yellow circle and yellow arrow) indicates the inferior vena cava. (A) Non-contrast axial CT image. The right OV measures approximately 0.91 cm in width (CT value = 46.10 HU, red arrow). The CT value of the inferior vena cava is 32.00 HU (yellow arrow). (B) Non-contrast coronal CT image showing the left OV (red arrow). (C) Contrast-enhanced axial CT image. Thrombosis in the left OV with uniform wall thickening (red arrow). (D) Contrast-enhanced coronal CT image. Left POVT with uniformly thickened wall (red arrow).
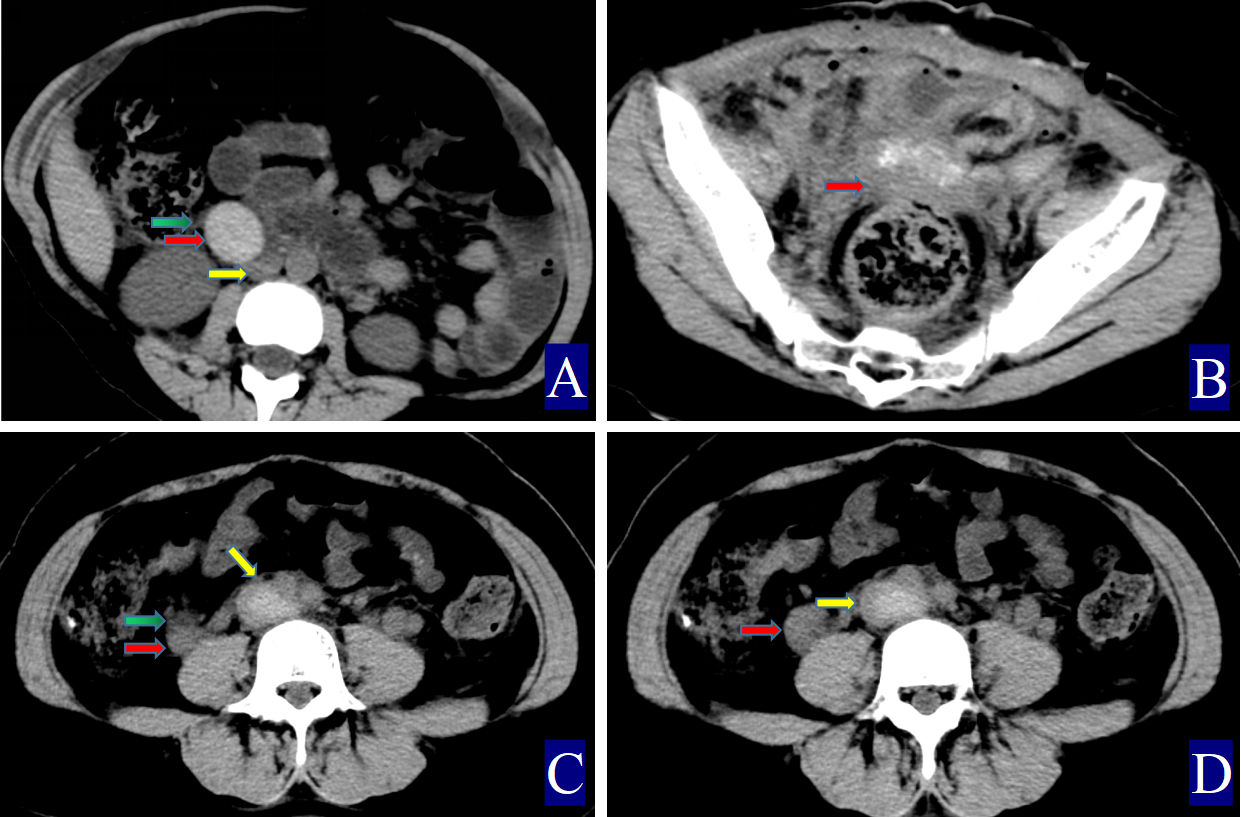 Fig. 3.
The primary and secondary CT findings of ovarian vein thrombophlebitis. The red arrow indicates the ovarian vein, the yellow arrow indicates the inferior vena cava, and the green arrow indicates the periovarian vein exudate. (A) Non-contrast axial CT image. The right ovarian vein is approximately 2.92 cm wide (CT value = 63.50 HU, red arrow). The CT value of the inferior vena cava is 38.40 HU (yellow arrow), with adjacent exudation (green arrow). (B) Non-contrast axial CT image showing pelvic effusion (thick red arrow). (C,D) A 21-year-old woman with right ovarian vein thrombophlebitis and inferior vena cava thrombosi: (C) Non-contrast axial CT image. The right ovarian vein is about 1.6 cm wide (CT value = 59.30 HU, red arrow). The inferior vena cava shows a CT value of 71.80 HU (yellow arrow), and surrounding exudation is noted (green arrow). (D) Non-contrast axial CT image.
Statistical analyses were conducted using SPSS software, version 27.0 (IBM Corp,
Armonk, NY, USA). The mode of delivery was assessed using the chi-square test,
with a statistical significance set at p
Twenty-four POVT cases were identified (23 right-sided, 1 left-sided), with an
age range of 26–43 years (mean
| Group (number) | Temperature (°C) | Delivery mode (cesarean/vaginal) | OV diameter (cm) | OV CT value (HU) | CT attenuation difference | The OV/IVC attenuation ratio | Normal OV diameter (cm) | Normal OV CT value (HU) |
| POVT (24) | 38.00 (37.45, 38.3) | 18/6 | 1.28 (1.12, 14.3) | 60.00 (58.00, 63.00) | 21.5 (15.08, 24.08) | 1.54 (1.38, 1.64) | 0.69 (0.56, 0.74) | 37.00 (33.83, 39.17) |
| Non-POVT (42) | 37.15 (36.9, 37.65) | 32/10 | 0.68 (0.50, 0.80) | 35.67 (34.67, 36.33) | –0.67 (–2.08, 0.08) | 0.98 (0.94, 1.00) | 0.66 (0.53, 0.80) | 34.83 (33.83, 36.14) |
| Z | –2.32 | - | –6.19 | –6.72 | –6.16 | –6.18 | –0.59 | –1.70 |
| p-value | 0.02 | 0.60 | 0.09 |
The CT attenuation difference = CT value of the ovarian vein – CT value of the inferior vena cava, and the OV/IVC attenuation ratio = CT value of the ovarian vein/CT value of the inferior vena cava; CT, computed tomography; OV, ovarian vein; POVT, postpartum ovarian vein thrombophlebitis; IVC, inferior vena cava.
In the POVT group, the D-dimer was determined by latex immunoturbidimetry
(STAGO, RMA, Paris, France). The mean postpartum D-dimer level was 7.66
The primary CT findings of POVT included filling defects within the ovarian vein lumen along with thickening of the vessel wall (Figs. 1,2,3). Secondary signs involved pelvic effusion in 13 cases and periovarian venous exudation with increased fat density in 19 cases (Figs. 1A,C,3A,C). One patient, who developed extensive thrombosis extending to both lower extremity veins, the inferior vena cava, and pulmonary arteries, died from postpartum hemorrhagic shock. The remaining 23 patients fully recovered.
Compared with the non-POVT group, the POVT group showed significantly greater ovarian vein width on the thrombus side, higher CT attenuation of the thrombus-side ovarian vein, as well as increased CT attenuation difference and ratios (p = 0.001, Figs. 1,2,3). Using 0.90 cm as the cut-off value for ovarian vein width, the sensitivity reached approximately 91.70%, with a specificity of 95.20% (Figs. 1A,2A,3A,C,D). With 46.00 HU as the threshold for ovarian vein CT value on the thrombus side, both sensitivity and specificity were 100% (Figs. 1A,2A,3A). For a CT attenuation difference cut-off of 12.50 HU, the sensitivity was 95.30%, and specificity remained 100%. Similarly, a ratio cut-off of 1.1 yielded a sensitivity of 95.30% and specificity of 100% (Figs. 1A,2A,3A).
In one POVT case involving extensive inferior vena cava thrombosis, the CT value of the inferior vena cava exceeded that of the ovarian vein, resulting in a negative CT attenuation difference of –12.50 HU and a ratio of 0.83 (Table 1; Fig. 3C,D).
Among the 42 non-POVT cases, the mean diameter of the right ovarian vein was
0.65
POVT was first reported by Austin [14] in 1956 and remains a rare and often underrecognized condition. In this study, the incidence of POVT was 0.06% (24 out of 34,140 cases), with a rate of 0.05% (10/19,912) following vaginal delivery and 0.10% (14/14,228) after cesarean section. These findings align with previously published data, where POVT incidence ranged from 0.002% to 0.05% overall [13]. Other studies suggest that POVT occurs in approximately 0.05%–0.18% of vaginal deliveries and 1%–2% of cesarean deliveries [15]. In our cohort, all 24 patients experienced fever, with axillary temperatures between 37.1 °C and 38.8 °C. Fever is one of the most common clinical features of POVT [16, 17, 18], consistent with earlier reports showing its presence in up to 80% of patients [16].
Direct signs observed on CT included variable widening of the ovarian vein, increased intraluminal density, and filling defects, often accompanied by vessel wall thickening, which is in line with prior reports [16, 17, 18, 19, 20, 21] (Figs. 1,2,3). A notable finding in our study was the identification of previously undescribed indirect signs: increased fat density around the ovarian vein in the pelvis and the presence of small-volume pelvic effusion (Figs. 1A,3A–D). These signs may reflect the local inflammatory reaction associated with thrombophlebitis.
Semi-quantitative parameters from non-contrast CT scans revealed clear differences between the POVT and non-POVT groups. The thrombus-side ovarian vein width, CT attenuation of the thrombotic ovarian vein, the difference between ovarian and inferior vena cava CT values, and their ratio were all significantly higher in the POVT group (p = 0.001, Figs. 1,2,3). These parameters may serve as reliable diagnostic references. For instance, using 0.90 cm as the cut-off for ovarian vein width yielded a sensitivity of approximately 91.70% and a specificity of 95.20%. This supports earlier findings [5] that vein enlargement is a key feature of POVT (Figs. 1,2,3). A CT attenuation cut-off of 46.00 HU for the thrombotic ovarian vein achieved 100% sensitivity and 100% specificity (Figs. 1,2,3). Similarly, a CT attenuation difference threshold of 12.50 HU and a ratio cut-off of 1.1 also demonstrated strong diagnostic performance (Figs. 1,2,3). However, in one patient with extensive thrombosis of the inferior vena cava, the ovarian vein had a lower CT value than the cava, resulting in a negative difference (–12.50 HU) and a ratio of 0.83, reflecting variability in advanced or complex cases. Currently available non-invasive diagnostic tools for POVT include Doppler ultrasound (sensitivity 52%), magnetic resonance imaging (MRI) (92%), and contrast-enhanced multidetector CT (100%) [5]. The present study indicates that non-contrast CT semi-quantitative parameters can closely match the diagnostic accuracy of enhanced CT, while offering greater simplicity, lower cost, and avoiding the risks associated with contrast agent use.
This study has several limitations. First, as a single-center retrospective
analysis, the use of data from only one institution may introduce selection bias.
Second, the small sample size—limited to 24 confirmed POVT cases—reduces
statistical power and increases the likelihood of false negatives. Third,
although CT-based parameters showed high sensitivity and specificity overall,
variations between individual cases were observed. Fourth, although the
semi-quantitative CT parameters demonstrated high diagnostic accuracy, the
thresholds (e.g., CT value
This study offers important clinical insights. For clinicians, when evaluating postpartum patients with non-specific symptoms such as fever, abdominal pain, and elevated D-dimer levels, POVT should be included in the differential diagnosis. The high diagnostic performance of non-contrast CT semi-quantitative parameters supports their use as a valuable adjunct in identifying POVT, potentially reducing both misdiagnosis and missed diagnosis.
The datasets used or analysed during the current study are available from the corresponding authors on reasonable request.
CC, JX and ZS designed the research study. SJ, DL and ZW performed the research. CC and ZS analyzed the data. All authors contributed to editorial changes in the manuscript. All authors read and approved the final manuscript. All authors have participated sufficiently in the work and agreed to be accountable for all aspects of the work.
This retrospective study received approval from the Ethics Committee of People’s Hospital of Yuxi City (approval number: 2025kmykdx6f060). In accordance with the ethical guidelines and regulations, written informed consent from patients was waived due to the retrospective nature of the study, which involved the analysis of de-identified clinical data. All procedures were conducted in compliance with the Declaration of Helsinki and relevant institutional ethical standards. The data were handled anonymously to ensure patient privacy and confidentiality.
Not applicable.
This research received no external funding.
The authors declare no conflict of interest.
During the preparation of this work, the authors used Doubao Assistant in order to check spelling and grammar. After using this tool, the authors reviewed and edited the content as needed and take full responsibility for the content of the publication.
References
Publisher’s Note: IMR Press stays neutral with regard to jurisdictional claims in published maps and institutional affiliations.