


 , Yang Zhou 1, Changbing Li 1, Huaping Li 1,*
 , Minfang Tao 1,*
1 Department of Gynecology and Obstetrics, Shanghai Sixth People’s Hospital Affiliated to Shanghai Jiao Tong University School of Medicine, 200233 Shanghai, China
Abstract
To retrospectively investigate the efficacy and influencing factors of tibolone and estradiol plus dydrogesterone in improving bone mineral density (BMD) in peri- and post-menopausal women, to provide a basis for clinical management.
Women aged 40–60 years who were undergoing menopausal transition or were post-menopausal, and who attended the menopause clinic at the Shanghai Sixth People’s Hospital Affiliated to Shanghai Jiao Tong University School of Medicine, between January 3, 2011, and May 11, 2020, were included in this study. Participants received tibolone or estradiol plus dydrogesterone for the management of menopause-related symptoms. Demographic characteristics were recorded, and BMD was measured using dual-energy X-ray absorptiometry at baseline and at 1, 2, and 3 years post-treatment to compare the efficacy of the two treatments in improving BMD.
The use of estradiol plus dydrogesterone showed an increasing trend in the BMD of the lumbar spine, total hip, and femoral neck after 1 and 2 years of treatment, with a decrease in the third year. Tibolone treatment showed a decreasing trend in BMD after 1, 2, and 3 years, indicating that estradiol plus dydrogesterone is superior to tibolone in improving BMD. After 3 years of tibolone treatment, changes in BMD were correlated with age, height, weight, and body mass index (BMI), whereas after 3 years of estradiol plus dydrogesterone treatment, changes in BMD showed no significant correlation with age, height, weight, and BMI.
Both estradiol plus dydrogesterone and tibolone are beneficial for maintaining BMD in peri- and post-menopausal women, with estradiol plus dydrogesterone demonstrating greater advantage over tibolone.
Keywords
- menopause
- tibolone
- estradiol + dydrogesterone
- bone mineral density
As the world population ages, the incidence of osteoporosis (OP) increases,
becoming a serious health threat to the middle-aged and older populations, with
postmenopausal women being the most significantly affected group. OP is a
skeletal system disease characterized by decreased bone strength and an increased
risk of fractures [1]. The latest epidemiological survey in China reported that
the prevalence of OP among people
At present, several medications for menopausal hormone therapy (MHT) are
available, with clinical applications in China primarily focusing on tibolone and
estradiol + dydrogesterone; the main component of tibolone is
7
MHT formulations vary in their ability to improve BMD. This study aimed to compare the changes in BMD and its differences pretreatment and at 1, 2, and 3 years post-treatment with tibolone and estradiol + dydrogesterone in women during menopausal transition and after menopause; explore the similarities and differences in the efficacy of the two drugs in improving the BMD of women; and provide clinical evidence for evaluating the effectiveness of prevention and treatment of post-menopausal OP.
We conducted a retrospective review of the medical records of peri- and
post-menopausal women who visited the menopause clinic of the Department of
Gynecology and Obstetrics at Shanghai Sixth People’s Hospital Affiliated to
Shanghai Jiao Tong University School of Medicine, between January 3, 2011, and May 11, 2020. Participants
aged 40–60 years, in the menopausal transition and post-menopausal stages
according to the criteria of reproductive aging +10 [8], with normal liver and
kidney functions, who did not undergo hormonal therapy in the past 6 months, with
no contraindications to MHT and willing to undergo MHT, and consistently taking
medications as prescribed were included in the study. However, those who have
already received antibone resorption treatment, have undergone hysterectomy and
oophorectomy, are involved in high-intensity physical activity, are smokers, and
did not undergo follow-up
According to the principles of MHT and considering participants’ wishes, if
menstruation is desired during peri-menopause, estradiol + dydrogesterone is
prescribed. However, if menstruation is not desired during peri-menopause,
tibolone is recommended—similar to when menstruation is not desired
post-menopause. When a woman aged
The demographic characteristics of the participants, including age, height, and
weight, were collected using a self-designed questionnaire [9]. Body mass index
(BMI) was calculated as weight (in kilograms) divided by the square of height (in
meters). The modified Kupperman menopause index (KMI) was used for assessing
menopausal symptoms [10], which includes 13 items. Total scores of
Statistical analyses were performed using Statistical Package for the Social
Sciences software version 26.0 (IBM Corporation, Armonk, NY, USA). BMD was
normally distributed (Kolmogorow-Smironov, KS test) and expressed as (
The average age of the participants was 50.905
| Item | Total (362) | Estradiol + Dydrogesterone (122) | Tibolone (240) | p-value | |
| Value/cases (%) | Value/cases (%) | Value/cases (%) | |||
| Age (years) | 50.905 |
46.812 |
53.008 |
||
| Height (cm) | 158.886 |
158.475 |
159.110 |
0.292 | |
| Weight (kg) | 57.028 |
56.486 |
57.319 |
0.350 | |
| BMI (kg/m²) | 22.571 |
22.458 |
22.628 |
0.585 | |
| Marital status | Married | 352 (100.0) | 116 (33.0) | 236 (67.0) | 0.093 |
| Unmarried (including divorced) | 10 (100.0) | 6 (60.0) | 4 (40.0) | ||
| Education duration | 58 (100.0) | 18 (31.0) | 40 (69.0) | 0.008 | |
| 10 years |
121 (100.0) | 29 (24.0) | 92 (76.0) | ||
| 183 (100.0) | 75 (41.0) | 108 (59.0) | |||
| Fertility status | Childless | 28 (100.0) | 13 (46.4) | 15 (53.6) | 0.064 |
| 1 Child | 297 (100.0) | 92 (31.0) | 205 (69.0) | ||
| 37 (100.0) | 17 (45.9) | 20 (54.1) | |||
| Employment status | Employed | 210 (100.0) | 107 (50.9) | 103 (49.1) | 0.000 |
| Not employed (retired + unemployed) | 152 (100.0) | 15 (9.9) | 137 (90.1) | ||
| KMI score | KMI total score |
30 (100.0) | 19 (63.3) | 11 (36.7) | 0.000 |
| KMI total score 6–15 | 121 (100.0) | 50 (41.3) | 71 (58.7) | ||
| KMI total score 16–30 | 177 (100.0) | 46 (26.0) | 131 (74.0) | ||
| KMI total score |
34 (100.0) | 7 (20.6) | 27 (79.4) | ||
Note: the data for height follow a normal distribution and are analyzed using an independent sample t-test. Age, weight, and BMI were approximately normal distribution and were analyzed using an independent sample t-test. The remaining data, including marital status, and employment status, are analyzed using the continuity correction chi-square tests. Education Duration, total KMI scores are analyzed using chi-square tests. BMI, body mass index; KMI, Kupperman menopause index.
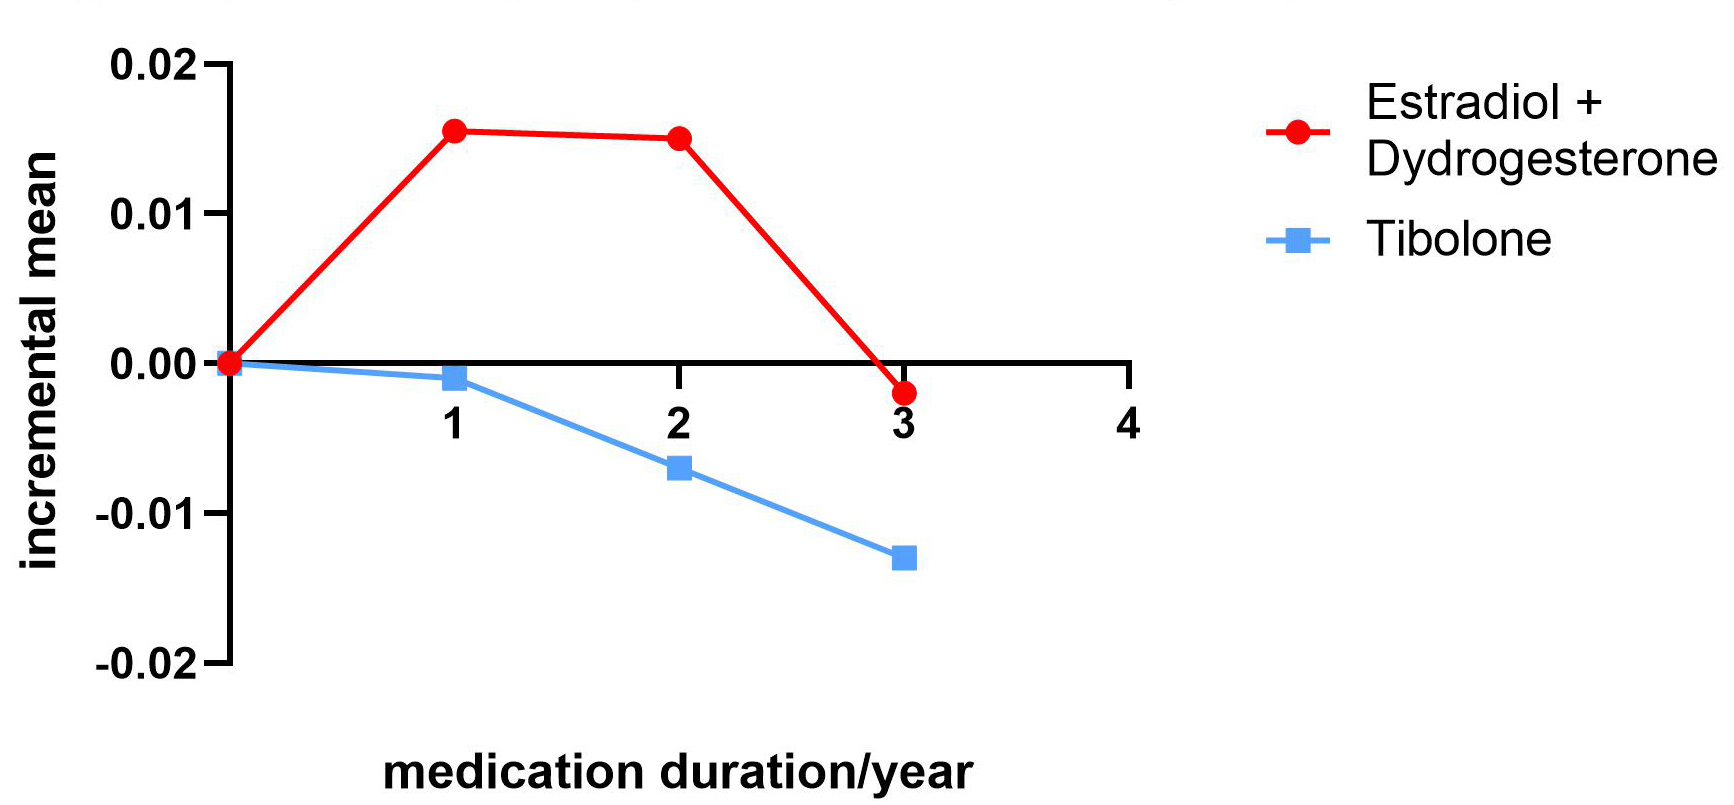
No statistically significant differences were noted between the total hip BMD
and baseline for the 2-year treatment. In the estradiol + dydrogesterone group,
total hip BMD slightly increased by 0.87% and 1.3% after 1- and 2 years of
treatment, respectively, compared to baseline, with a partial decrease (0.43%)
after 3 years (Fig. 1). Conversely, in the tibolone group, the total hip BMD
decreased by 0.22%, 0.67%, and 1.01% after 1, 2 and 3 years of treatment (Fig. 1), respectively. The differences in total hip BMD values between the two groups
were statistically significant after 1, 2, and 3 years of treatment (p =
0.013, p = 0.020, and p = 0.024, respectively; p
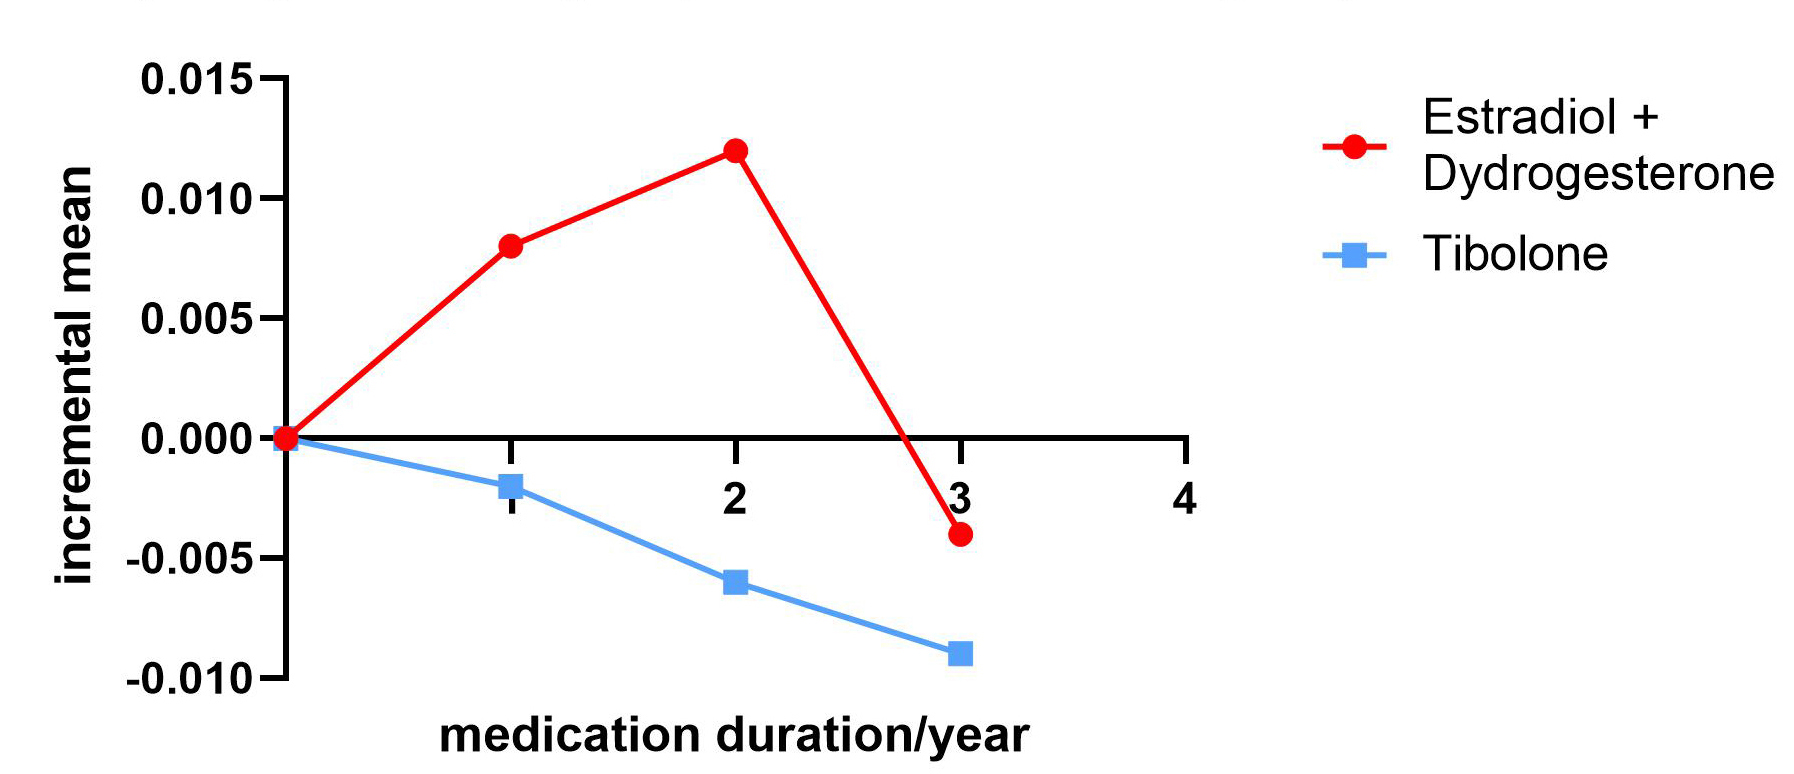 Fig. 1.
Comparison of total hip bone mineral increments between the estradiol + dydrogesterone and tibolone groups.
| Total Hip Bone Mineral Density | Total | Estradiol + Dydrogesterone | Tibolone | p-value | |
| Number of Cases | 362 | 122 | 240 | ||
| Before Treatment | 0.903 |
0.917 |
0.895 |
0.109 | |
| After 1 Year of Treatment | 0.904 |
0.926 |
0.893 |
0.013 | |
| Increase After 1 Year of Treatment | 0.001 |
0.008 |
–0.002 |
0.048 | |
| Number of Cases | 241 | 84 | 157 | ||
| Baseline for 2-Year Treatment Cases | 0.902 |
0.914 |
0.895 |
0.274 | |
| After 2 Years of Treatment | 0.902 |
0.927 |
0.889 |
0.020 | |
| Increase in 2-Year Treatment Cases | 0.0002 |
0.012 |
–0.006 |
0.020 | |
| Number of Cases | 172 | 44 | 128 | ||
| Baseline for 3-Year Treatment Cases | 0.906 |
0.938 |
0.895 |
0.047 | |
| After 3 Years of Treatment | 0.899 |
0.934 |
0.886 |
0.024 | |
| Increase After 3 Years of Treatment | –0.008 |
–0.004 |
–0.009 |
0.574 | |
Note: The increments in total hip BMD after 1, 2, and 3 years are the differences in BMD values at 1, 2, and 3 years post-treatment compared with the baseline total hip BMD at the first diagnosis, 2 years prior, and 3 years prior, respectively. The total hip BMD values conform to a normal distribution. Comparisons of BMD between the estradiol + dydrogesterone and tibolone groups are performed using an independent sample t-test for computational analysis. BMD, bone mineral density.
No statistically significant differences were observed between the two groups
regarding the initial baseline femoral neck BMD and baseline for 2 years of
treatment (p = 0.200 and p = 0.302, respectively). The estradiol
+ dydrogesterone group showed a slight increase in femoral neck BMD after 1 and 2
years compared with that at baseline (0.95% and 0.46%), whereas a slight
decrease was noted after 3 years (1.68%) (Fig. 2). In contrast, the tibolone
group exhibited a slight decrease in femoral neck BMD after 1, 2, and 3 years
(0.95%, 1.77%, and 2.13%) (Fig. 2). Differences in the increase in femoral
neck BMD after 1 and 2 years of treatment were observed between the two groups
(p = 0.010 and p = 0.011, respectively; p
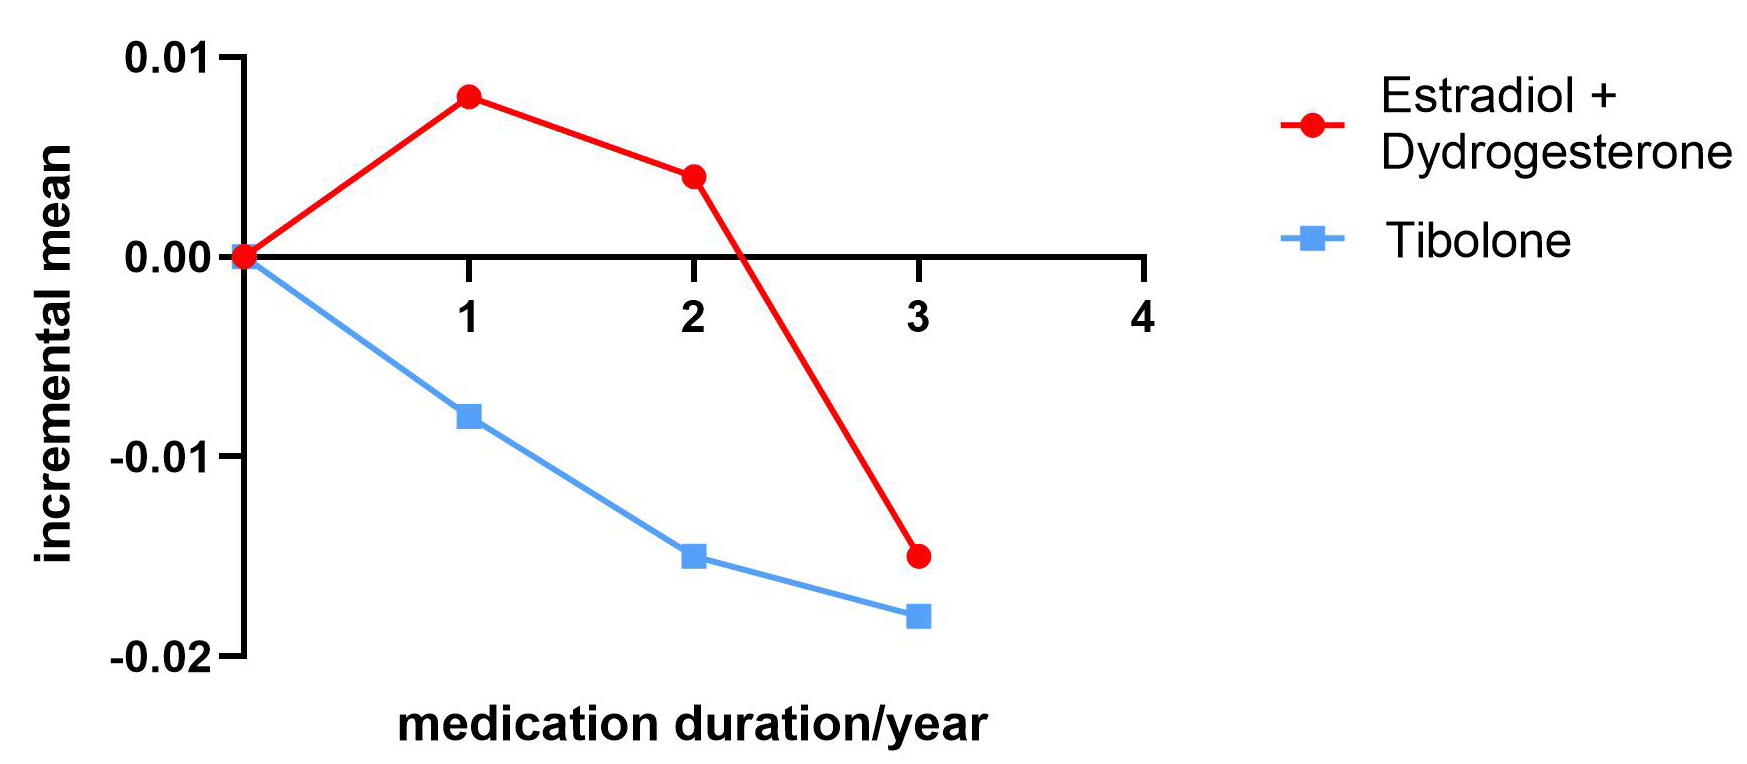 Fig. 2.
Comparison of femoral neck bone mineral density increments between the estradiol + dydrogesterone and tibolone groups.
| Femoral neck bone mineral density | Total | Estradiol + Dydrogesterone | Tibolone | p-value | |
| Number of Cases | 362 | 122 | 240 | ||
| Before Treatment | 0.846 |
0.858 |
0.840 |
0.200 | |
| After 1 Year of Treatment | 0.842 |
0.862 |
0.832 |
0.025 | |
| Increase After 1 Year of Treatment | –0.002 |
0.008 |
–0.008 |
0.010 | |
| Number of Cases | 241 | 84 | 157 | ||
| Baseline for 2-Year Treatment Cases | 0.852 |
0.864 |
0.846 |
0.302 | |
| After 2 Years of Treatment | 0.845 |
0.869 |
0.832 |
0.017 | |
| Increase in 2-Year Treatment Cases | –0.007 |
0.004 |
–0.015 |
0.011 | |
| Number of Cases | 172 | 44 | 128 | ||
| Baseline for 3-Year Treatment Cases | 0.859 |
0.894 |
0.846 |
0.020 | |
| After 3 Years of Treatment | 0.841 |
0.879 |
0.828 |
0.011 | |
| Increase After 3 Years of Treatment | –0.017 |
–0.015 |
–0.018 |
0.646 | |
The increments in femoral neck BMD at 1, 2, and 3 years post-treatment are the differences between the femoral neck BMD values at these respective timepoints and the initial femoral neck BMD at diagnosis, and at 2 and 3 years prior. Femoral neck BMD values are normally distributed. Comparisons of bone density between the estradiol + dydrogesterone and tibolone groups are performed using an independent sample t-test for calculation and analysis.
No statistically significant differences were noted between the two groups
regarding the initial baseline lumbar spine BMD for the 2-year treatment
(p = 0.165). The estradiol + dydrogesterone group showed increased
lumbar spine (L1–L4) BMD after 1 and 2 years (1.45% and 1.40%) (Fig. 3). After
3 years of treatment, a slight decrease in lumbar spine (L1–L4) BMD was observed
(0.18%) (Fig. 3). The tibolone group exhibited a decrease in lumbar spine
(L1–L4) BMD after 1, 2, and 3 years (0.097%, 0.67%, and 1.26%) (Fig. 3). The
difference in the increase in lumbar spine (L1–L4) BMD between the two groups
after 2 years of treatment was statistically significant (p = 0.013;
p
 Fig. 3.
Comparison of lumbar spine (L1–L4) bone mineral density increments between the estradiol + dydrogesterone and tibolone groups.
| Lumbar 1~4 bone mineral density | Total | Estradiol + Dydrogesterone | Tibolone | p-value | |
| Number of Cases | 362 | 122 | 240 | ||
| Before Treatment | 1.044 |
1.068 |
1.031 |
0.039 | |
| After 1 Year of Treatment | 1.048 |
1.084 |
1.030 |
0.002 | |
| Increase After 1 Year of Treatment | 0.004 |
0.0155 |
–0.001 |
0.076 | |
| Number of Cases | 241 | 84 | 157 | ||
| Baseline for 2-Year Treatment Cases | 1.049 |
1.069 |
1.038 |
0.165 | |
| After 2 Years of Treatment | 1.049 |
1.083 |
1.031 |
0.013 | |
| Increase in 2-Year Treatment Cases | 0.0005 |
0.015 |
–0.007 |
0.025 | |
| Number of Cases | 172 | 44 | 128 | ||
| Baseline for 3-Year Treatment Cases | 1.049 |
1.093 |
1.034 |
0.038 | |
| After 3 Years of Treatment | 1.039 |
1.09 |
1.021 |
0.013 | |
| Increase After 3 Years of Treatment | –0.010 |
–0.002 |
–0.013 |
0.447 | |
The increments in lumbar spine (L1–L4) BMD after 1, 2, and 3 years are the differences between the BMD values at those timepoints and the initial values at diagnosis, 2 years prior, and 3 years prior, respectively. Lumbar spine (L1–L4) BMD values follow a normal distribution, and comparisons of BMD between the estradiol + dydrogesterone and tibolone groups are performed using independent sample t-tests for computational analysis.
The ANOVA results indicated that marital status (p = 0.139, p
= 0.164, and p = 0.604), duration of education (p = 0.756,
p = 0.282, and p = 0.432), fertility status (p = 0.404
and p = 0.939, p = 0.926), KMI score (p = 0.954,
p = 0.726, and p = 0.836), and employment status (p =
0.772, p = 0.604, and p = 0.962) were not associated with
changes in BMD at various sites after 3 years (p
ANOVA results indicated that fertility status affected total hip BMD (p
= 0.048; p
The ANOVA results indicated that marital status influenced the femoral neck and
total hip BMD (p
Estrogen is closely associated with bone metabolism [11]. Following the menopausal transition, estrogen levels rapidly decrease with decreasing ovarian function, directly leading to bone loss. Reportedly, the cumulative loss rate of lumbar spine BMD over a 10-year post-menopause is 10.6%, of which 7.38% is lost during the menopausal transition [12]. Moreover, the loss of BMD in the femoral neck is 9.1%; of which 5.8% occurs during the transition period [12]. Therefore, preventing and treating menopause-related OP during and after the menopausal transition is essential. Since the 1930s, estrogen can reportedly be used to treat bone loss due to declining ovarian function and improve other menopause-related issues [13]. With the continuous development of estrogen preparations and decades of clinical practice, MHT has become an integral part of the health strategy for women during and after the menopausal transition [14]. Menopausal estrogen therapy can reduce fractures in the lumbar spine, total hip, and other areas prone to post-menopausal OP—a considerable disease affecting the health of middle-aged and older women [15].
However, different formulations and dosages of estrogen vary in effectiveness
for treating and preventing postmenopausal OP. Currently, frequently used
menopausal estrogen therapy formulations in China include 17
We accomplished this by conducting a real-world clinical study. This study is a
real-world clinical trial based on the principles of MHT and preferences of
women, treating those in peri- and post-menopause with 17
To analyze the efficacy and dosage, we used 17
Considering the treatment duration, 17
Correlation analysis showed that the treatment effect of the
17
We found that estradiol + dydrogesterone is superior to tibolone in improving BMD. After 3 years of tibolone treatment, changes in BMD were correlated with age, height, weight, and BMI, whereas after 3 years of estradiol + dydrogesterone treatment, changes in BMD showed no significant correlation with age, height, weight, and BMI.
The data that support the findings of this study are available on request from the corresponding author. The data are not publicly available due to privacy or ethical restrictions.
The study’s conception and design were undertaken by MFT. YanZ, YangZ, CBL, HPL were contributed to the research’s data acquisition. The data analysis and interpretation were shouldered by YanZ and MFT. YanZ were responsible for the manuscript’s initial drafting, while MFT critically revised the manuscript for important intellectual content. All authors contributed to editorial changes in the manuscript. All authors read and approved the final manuscript. All authors have participated sufficiently in the work and agreed to be accountable for all aspects of the work.
The study was conducted in accordance with the Declaration of Helsinki, and the protocol was approved by the Ethics Committee of Shanghai Sixth People’s Hospital Affiliated to Shanghai Jiao Tong University School of Medicine (2023-R02) and all the researchers collected data in strict accordance with the ethical requirements throughout the study. All subjects gave their informed consent for inclusion before they participated in the study.
We would like to express my gratitude to all those who helped me during the writing of this manuscript.
This research received no external funding.
The authors declare no conflict of interest.
Supplementary material associated with this article can be found, in the online version, at https://doi.org/10.31083/CEOG26546.
References
Publisher’s Note: IMR Press stays neutral with regard to jurisdictional claims in published maps and institutional affiliations.