

 , Lujia Li 1,*
 , Nan Wu 2,*
1 Department of Health Care, People’s Liberation Army Navy 971 Hospital, 266071 Qingdao, Shandong, China
2 Department of Neurosurgery, Chongqing General Hospital, Chongqing University, 401147 Chongqing, China
†These authors contributed equally.
Abstract
The association between uterine fibroids and mortality remains inconclusive. This study evaluated the relationship between uterine fibroids and all-cause, cancer-specific, and cardiovascular disease (CVD)-specific mortality using data from the National Health and Nutrition Examination Survey (NHANES) from 1999 to 2006.
A cohort analysis was conducted using NHANES data from 1999 to 2006. Weighted Cox proportional hazards regression models estimated hazard ratios (HRs) and 95% confidence intervals (CIs) to assess associations between uterine fibroids, age at diagnosis, and mortality outcomes. Subgroup analyses and interaction tests were performed to evaluate potential effect modification.
The study cohort comprised 5547 women aged 20–54 years across four survey cycles. During a median follow-up of 16.75 years, 290 deaths were recorded. After adjustment for confounders, no statistically significant associations were observed for all-cause mortality (HR: 0.96; 95% CI: 0.65–1.42), cancer-specific mortality (HR: 1.12; 95% CI: 0.64–1.96), or CVD-related mortality (HR: 0.90; 95% CI: 0.38–2.14). Age-stratified analyses similarly revealed no significant associations across diagnostic age groups.
These results indicate no elevated risk of all-cause, cancer-specific, or CVD-specific mortality associated with uterine fibroids.
Keywords
- uterine fibroids
- mortality
- cohort
- NHANES
- risk
Uterine fibroids represent the most common benign tumors arising from the smooth
muscle of the uterus in the female reproductive tract [1, 2, 3]. In 2019, an
estimated 9.6 million new cases were reported globally, contributing to a
worldwide prevalence of approximately 226 million cases [1]. These fibroids may
manifest as solitary or multiple lesions of variable size and often remain
asymptomatic. Symptomatic cases, however, may involve menorrhagia, pelvic pain,
urinary disturbances, and reproductive dysfunction [3], all of which can
profoundly compromise quality of life by impairing work performance and mental
health. The economic impact is substantial, with the United States healthcare costs increasing
by 20.3%—from
A hallmark of uterine fibroid pathophysiology is the presence of endocrine dysregulation [5]. Notably, uterine fibroids exhibit genetic overlap with endometriosis [6], a chronic, multisystem inflammatory disorder characterized by systemic inflammation, elevated oxidative stress, and proatherogenic lipid profiles [7]. Moreover, uterine fibroids, neoplastic conditions, and cardiovascular diseases (CVD) share modifiable risk factors such as obesity, physical inactivity, poor dietary patterns, and psychosocial stress [8, 9, 10, 11, 12, 13, 14, 15]. These shared etiological pathways suggest that fibroid development may function as an early clinical indicator of broader health risks in women. Integrating fibroid status into risk stratification frameworks may facilitate the implementation of individualized lifestyle interventions and tailored screening strategies, potentially mitigating long-term morbidity. Emerging evidence points to associations between uterine fibroids and increased risks of malignancies including breast [16, 17], ovarian [18], and endometrial cancers [19, 20], as well as cardiometabolic disorders such as hypertension [21, 22], dyslipidemia, and metabolic syndrome [23]. However, these associations remain controversial due to inconsistent findings across studies [24, 25]. The relationship between uterine fibroids and both all-cause and cause-specific mortality remains inadequately characterized. For example, Shen et al. (2017) [17] reported lower mortality from breast cancer among individuals diagnosed with fibroids compared to those without. In contrast, data from the 2024 Nurses’ Health Study II showed no association between uterine fibroids and all-cause premature mortality, although did identify an elevated risk of cancer-specific mortality [26]. When accounting for cancer types, the observed association was more pronounced in cases involving malignant gynecologic neoplasms [26]. To address this gap, the association between uterine fibroids and both all-cause and cause-specific mortality was investigated using data from the National Health and Nutrition Examination Survey (NHANES) 1999–2006.
This study was conducted under the NHANES framework, a nationally representative surveillance program that systematically collects data on health conditions, dietary patterns, and behavioral risk factors across the U.S. population through interviews, physical examinations, and laboratory assessments. All participants provided written informed consent, and study protocols were approved by the Ethics Review Board of the National Center for Health Statistics (NCHS) under Protocols #98-12 and #2005-06. A retrospective cohort design was employed to evaluate the association between uterine fibroids and both all-cause and cause-specific mortality, with results reported in accordance with the Strengthening the Reporting of Observational Studies in Epidemiology (STROBE) guidelines [27].
Uterine fibroid data were collected exclusively during four NHANES survey cycles spanning 1999 to 2006. Due to confidentiality regulations, outcome variables were not available for individuals younger than 18 years. Thus, public access to their mortality data was restricted. The participant selection process is depicted in Fig. 1. Of the initial 21,210 female respondents, exclusions were made for the following reasons: (1) 9352 individuals were under 18 years of age, (2) 6306 lacked information on fibroid status, and (3) 5 had insufficient identifiers for linkage with the National Death Index. After these exclusions, the final analytic cohort comprised 5547 eligible participants.
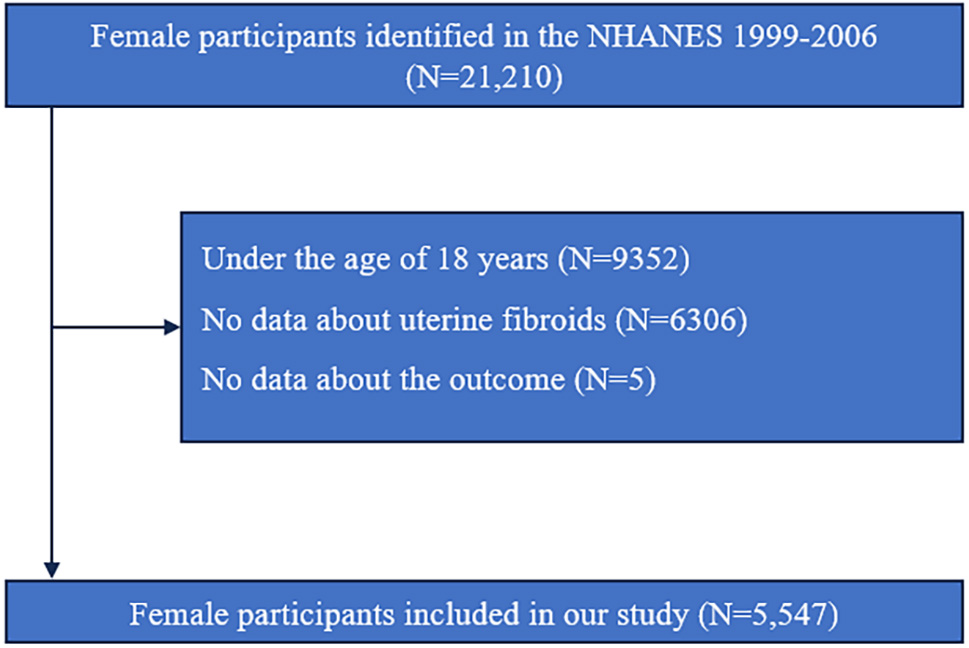 Fig. 1.
Flowchart of study population selection. NHANES, National Health and Nutrition Examination Survey; N, number.
Uterine fibroid status was determined using specific items from the reproductive health questionnaire, including “RHQ380: Told by doctor had uterine fibroids?” and “RHQ390: Age when first told had uterine fibroids”. Respondents selecting “Refused” or “Don’t know” for RHQ380 were categorized as missing and excluded from the analysis.
Mortality outcomes were ascertained through linkage with the National Death Index. Classification of mortality followed the 10th revision of the International Classification of Diseases (ICD-10). This study investigated the association between uterine fibroids and all-cause mortality, cancer-specific mortality defined by ICD-10 codes C00–C97, and cardiovascular mortality defined by codes I00–I09, I11, I13, I20–I51, and I60–I69. Follow-up began at the time of the NHANES interview and continued through December 31, 2019, or until death, whichever occurred first.
Statistical analyses adhered to NHANES complex survey design protocols and
incorporated appropriate sampling weights using R software (version 3.4.3,
Vienna, Austria; https://www.r-project.org/). p-value of less than 0.05
is considered a significant difference. Four survey cycles from 1999 to 2006 were
included. Weighting adjustments were made by applying 2/4
Categorical variables were described using frequencies and proportions and
compared using chi-square test, while non-normally distributed continuous
variables were summarized as medians with interquartile ranges (Q1–Q3) and
compared using Wilcoxon rank sum test. The analysis compared participants with a
history of uterine fibroids—further stratified by age at diagnosis (
Two Cox regression models were developed NHANES design and a thorough review of
prior literature: an unadjusted model and a multivariable-adjusted model
controlling for potential confounders. To maximize analytical completeness,
missing values with low frequency were imputed—categorical variables using mode
substitution and continuous variables using the median. For variables with more
than 20% missing data (e.g., age at menopause, number of live births,
hysterectomy status, and high cholesterol), a separate “missing” category was
created to preserve participant inclusion. The adjusted model incorporated a
comprehensive set of covariates, including: age (continuous); race/ethnicity
(non-Hispanic White, non-Hispanic Black, Other), marital status (married/living
with a partner, never married, widowed/divorced/separated); education level (high
school or less, more than high school), family poverty income ratio (PIR:
An exploratory analysis was conducted to evaluate all-cause mortality, incorporating subgroup analyses and interaction tests across race, education, marital status, PIR, and clinical variables including hypertension, hypercholesterolemia, diabetes, cancer, CVD, and reproductive health conditions such as oral contraceptive use, hormone replacement therapy, endometriosis, hysterectomy, and oophorectomy. Due to limited statistical power, cause-specific mortality related to cancer or CVD was not assessed in these stratified models.
A total of 5547 women aged 20 to 54 years, drawn from four NHANES survey cycles conducted between 1999 and 2006, were included in the analytic cohort. This sample corresponds to a weighted estimate of approximately 66,011,902 women in the U.S. population. The median duration of follow-up was 16.75 years, during which 290 deaths occurred, representing an estimated 3,411,632 deaths. Baseline characteristics are summarized in Table 1. Compared to women without uterine fibroids, those with a diagnosis were more likely to be older, non-Hispanic Black, and either married/living with a partner or widowed/divorced/separated. They also demonstrated higher economic status and exhibited increased prevalence of hypertension, hypercholesterolemia, and diabetes. Additionally, women with fibroids were more likely to report a history of cancer or CVD and were more frequently classified as current or former smokers and alcohol users. Elevated rates of oral contraceptive use, hormone replacement therapy, hysterectomy, oophorectomy, and endometriosis were also observed in this group.
| Variable | Non-uterine fibroids (n = 4848) | Uterine fibroids (n = 699) | p-value | |
| Weight sample | 56,778,280 | 9,233,622 | - | |
| Age, years, median (Q1–Q3) | 33 (26–43) | 45 (39–50) | ||
| Race, n (%) | ||||
| White, non-Hispanic | 2264 (46.70%) | 298 (42.63%) | ||
| Black, non-Hispanic | 883 (18.21%) | 266 (38.05%) | ||
| Others | 1701 (35.09%) | 135 (19.31%) | ||
| Education, n (%) | ||||
| High school or less | 2311 (47.67%) | 269 (38.48%) | ||
| More than high school | 2537 (52.33%) | 430 (61.52%) | ||
| Marital status, n (%) | ||||
| Married or living with partner | 3141 (64.79%) | 465 (66.52%) | ||
| Never married | 1045 (21.56%) | 76 (10.87%) | ||
| Widowed/divorced/separated | 662 (13.66%) | 158 (22.60%) | ||
| PIR, n (%) | ||||
| 1372 (28.30%) | 133 (19.03%) | |||
| 1.30 |
1984 (40.92%) | 262 (37.48%) | ||
| 1492 (30.78%) | 304 (43.49%) | |||
| Hypertension, n (%) | ||||
| No | 4108 (84.74%) | 467 (66.81%) | ||
| Yes | 740 (15.26%) | 232 (33.19%) | ||
| High cholesterol, n (%) | ||||
| No | 1992 (41.09%) | 372 (53.22%) | ||
| Yes | 697 (14.38%) | 175 (25.04%) | ||
| Unknown | 2159 (44.53%) | 152 (21.75%) | ||
| Diabetes, n (%) | ||||
| No | 4616 (95.21%) | 634 (90.70%) | ||
| Yes | 188 (3.88%) | 63 (9.01%) | ||
| Borderline | 44 (0.91%) | 2 (0.29%) | ||
| Ever cancer, n (%) | ||||
| No | 4675 (96.43%) | 635 (90.84%) | ||
| Yes | 173 (3.57%) | 64 (9.16%) | ||
| Cardiovascular disease, n (%) | ||||
| No | 4728 (97.52%) | 648 (92.70%) | ||
| Yes | 120 (2.48%) | 51 (7.30%) | ||
| BMI, kg/m2, n (%) | <0.001 | |||
| 1705 (35.17%) | 197 (28.18%) | |||
| 1434 (29.58%) | 185 (26.47%) | |||
| 1709 (35.25%) | 317 (45.35%) | |||
| Smoking, n (%) | 0.007 | |||
| Never | 3039 (62.69%) | 401 (57.37%) | ||
| Former | 758 (15.64%) | 139 (19.89%) | ||
| Current | 1051 (21.68%) | 159 (22.75%) | ||
| Alcohol user, n (%) | 0.008 | |||
| Never | 909 (18.75%) | 109 (15.59%) | ||
| Former | 755 (15.57%) | 137 (19.60%) | ||
| Current | 3184 (65.68%) | 453 (64.81%) | ||
| Oral contraceptive, n (%) | ||||
| Never | 1252 (25.83%) | 108 (15.45%) | ||
| Ever | 3596 (74.17%) | 591 (84.55%) | ||
| Hormone replacement therapy, n (%) | ||||
| Never | 4411 (90.99%) | 467 (66.81%) | ||
| Ever | 437 (9.01%) | 232 (33.19%) | ||
| Age at menarche, years, n (%) | 0.007 | |||
| 1067 (22.01%) | 189 (27.04%) | |||
| 12–13 | 2560 (52.81%) | 357 (51.07%) | ||
| 1221 (25.19%) | 153 (21.89%) | |||
| Age at menopause, years, n (%) | ||||
| 211 (4.35%) | 93 (13.30%) | |||
| 36–40 | 86 (1.77%) | 71 (10.16%) | ||
| 41–45 | 103 (2.12%) | 75 (10.73%) | ||
| 46–50 | 174 (3.59%) | 55 (7.87%) | ||
| 54 (1.11%) | 17 (2.43%) | |||
| Unknown | 4220 (87.05%) | 388 (55.51%) | ||
| Number of live births, n (%) | ||||
| 0 | 233 (4.81%) | 36 (5.15%) | ||
| 1 | 1024 (21.12%) | 134 (19.17%) | ||
| 2 | 1197 (24.69%) | 219 (31.33%) | ||
| 3 | 799 (16.48%) | 151 (21.60%) | ||
| 4 | 315 (6.50%) | 51 (7.30%) | ||
| 5+ | 221 (4.56%) | 34 (4.86%) | ||
| Unknown | 1059 (21.84%) | 74 (10.59%) | ||
| Number of pregnant, n (%) | ||||
| 1 | 753 (15.53%) | 81 (11.59%) | ||
| 2 | 1822 (37.58%) | 226 (32.33%) | ||
| 3 | 992 (20.46%) | 170 (24.32%) | ||
| 4+ | 1281 (26.42%) | 222 (31.76%) | ||
| Hysterectomy, n (%) | ||||
| No | 1870 (38.57%) | 148 (21.17%) | ||
| Yes | 268 (5.53%) | 272 (38.91%) | ||
| Unknown | 2710 (55.90%) | 279 (39.91%) | ||
| Ovariectomy, n (%) | ||||
| No | 4618 (95.26%) | 496 (70.96%) | ||
| Unilateral oophorectomy | 108 (2.23%) | 68 (9.73%) | ||
| Bilateral oophorectomy | 122 (2.52%) | 135 (19.31%) | ||
| Endometriosis, n (%) | ||||
| No | 4606 (95.01%) | 565 (80.83%) | ||
| Yes | 242 (4.99%) | 134 (19.17%) | ||
Abbreviation: n, number; PIR, poverty income ratio; BMI, body mass index; Q1–Q3, first quartile to third quartile.
Initial unadjusted analyses indicated significantly elevated risks of all-cause mortality (HR = 1.59; 95% CI: 1.11–2.29; p-value = 0.012) and cancer-specific mortality (HR = 2.25; 95% CI: 1.32–3.84; p-value = 0.003) among women with uterine fibroids relative to those without. No statistically significant association was observed for CVD-specific mortality (HR = 1.48; 95% CI: 0.67–3.26; p-value = 0.331). However, these associations were no longer statistically significant after adjustment for potential confounders. The adjusted HRs and 95% CIs were 0.96 (0.65–1.42) for all-cause mortality (p-value = 0.828), 1.12 (0.64–1.96) for cancer-specific mortality (p-value = 0.685), and 0.90 (0.38–2.14) for CVD-related mortality (p-value = 0.818). Age-stratified analyses by age at fibroid diagnosis yielded no significant associations across all diagnostic age categories (Table 2).
| Group | Characteristic | Unadjusted HR (95% CI) and p-value | Adjusted HR (95% CI) and p-value | |
| Overall death | ||||
| Uterine fibroids | ||||
| No | 1.0 (Ref.) | 1.0 (Ref.) | ||
| Yes | 1.59 (1.11–2.29) 0.012 | 0.96 (0.65–1.42) 0.828 | ||
| Age at uterine fibroids, years | ||||
| No | 1.0 (Ref.) | 1.0 (Ref.) | ||
| 1.26 (0.74–2.16) 0395 | 0.75 (0.43–1.30) 0.300 | |||
| 1.70 (1.16–2.49) 0.007 | 1.02 (0.68–1.53) 0.932 | |||
| Cancer death | ||||
| Uterine fibroids | ||||
| No | 1.0 (Ref.) | 1.0 (Ref.) | ||
| Yes | 2.25 (1.32–3.84) 0.003 | 1.12 (0.64–1.96) 0.685 | ||
| Age at uterine fibroids, years | ||||
| No | 1.0 (Ref.) | 1.0 (Ref.) | ||
| 1.33 (0.65–2.71) 0.436 | 0.86 (0.35–2.14) 0.752 | |||
| 2.66 (1.50–4.74) |
1.20 (0.66–2.19) 0.548 | |||
| CVD death | ||||
| Uterine fibroids | ||||
| No | 1.0 (Ref.) | 1.0 (Ref.) | ||
| Yes | 1.48 (0.67–3.26) 0.331 | 0.90 (0.38–2.14) 0.818 | ||
| Age at uterine fibroids, years | ||||
| No | 1.0 (Ref.) | 1.0 (Ref.) | ||
| 2.50 (0.78–8.03) 0.125 | 1.40 (0.49–3.96) 0.529 | |||
| 0.79 (0.31–2.01) 0.622 | 0.47 (0.14–1.54) 0.214 | |||
Abbreviation: HR, hazard ratio; CI, confidence interval; Ref., reference; CVD, cardiovascular disease; BMI, body mass index.
Adjusted for age, race/ethnicity, marital status, education level, PIR, personal history of hypertension, high cholesterol, diabetes, cardiovascular disease, cancer, smoking status, alcohol consumption, BMI, oral contraceptive use, hormone replacement therapy, age at menarche, age at menopause, endometriosis, hysterectomy, oophorectomy, number of pregnant, and number of live births.
An exploratory analysis of all-cause mortality was performed, incorporating subgroup evaluations and interaction testing across race, educational attainment, marital status, PIR, and medical histories including hypertension, hypercholesterolemia, diabetes, cancer, CVD, and reproductive health factors such as oral contraceptive use, hormone replacement therapy, endometriosis, hysterectomy, and oophorectomy. A significant association between uterine fibroids and all-cause mortality emerged among non-Hispanic Black women (HR = 1.67; 95% CI: 1.07–2.61; p-value = 0.023), with no comparable associations observed in other subgroups (Table 3). Interaction analyses revealed significant heterogeneity by race (p-value for interaction = 0.036), high cholesterol (p-value for interaction = 0.009), ovariectomy (p-value for interaction = 0.048), and marital status, (p-value for interaction = 0.017).
| Character | Uterine fibroids | Unadjusted HR (95% CI) and p-value | Adjusted HR (95% CI) and p-value | p-value for interaction | |
| Race | 0.036 | ||||
| White, non-Hispanic | No | 1.0 (Ref.) | 1.0 (Ref.) | ||
| Yes | 1.39 (0.86, 2.25) 0.178 | 0.85 (0.51, 1.45) 0.559 | |||
| Black, non-Hispanic | No | 1.0 (Ref.) | 1.0 (Ref.) | ||
| Yes | 2.15 (1.46, 3.14) |
1.67 (1.07, 2.61) 0.023 | |||
| Others | No | 1.0 (Ref.) | 1.0 (Ref.) | ||
| Yes | 0.87 (0.30, 2.48) 0.788 | 0.34 (0.09, 1.31) 0.117 | |||
| Education | 0.379 | ||||
| High school or less | No | 1.0 (Ref.) | 1.0 (Ref.) | ||
| Yes | 1.73 (1.14, 2.63) 0.100 | 1.24 (0.77, 2.00) 0.381 | |||
| More than high school | No | 1.0 (Ref.) | 1.0 (Ref.) | ||
| Yes | 1.58 (0.88, 2.84) 0.128 | 0.73 (0.38, 1.43) 0.360 | |||
| Marital | 0.017 | ||||
| Married or living with partner | No | 1.0 (Ref.) | 1.0 (Ref.) | ||
| Yes | 1.14 (0.75, 1.73) 0.543 | 0.77 (0.47, 1.25) 0.290 | |||
| Never married | No | 1.0 (Ref.) | 1.0 (Ref.) | ||
| Yes | 5.12 (2.22, 11.78) |
1.35 (0.51, 3.60) 0.548 | |||
| Widowed/divorced/separated | No | 1.0 (Ref.) | 1.0 (Ref.) | ||
| Yes | 1.90 (1.04, 3.46) 0.037 | 1.51 (0.58, 3.95) 0.399 | |||
| PIR | 0.708 | ||||
| No | 1.0 (Ref.) | 1.0 (Ref.) | |||
| Yes | 2.18 (1.33, 3.56) 0.002 | 1.02 (0.50, 2.07) 0.958 | |||
| 1.30 |
No | 1.0 (Ref.) | 1.0 (Ref.) | ||
| Yes | 2.07 (1.11, 3.87) 0.023 | 1.07 (0.583, 1.98) 0.820 | |||
| No | 1.0 (Ref.) | 1.0 (Ref.) | |||
| Yes | 1.20 (0.67, 2.17) 0.541 | 0.86 (0.46, 1.60) 0.626 | |||
| Hypertension | 0.572 | ||||
| No | No | 1.0 (Ref.) | 1.0 (Ref.) | ||
| Yes | 1.50 (0.90, 2.49) 0.116 | 0.82 (0.47, 1.41) 0.470 | |||
| Yes | No | 1.0 (Ref.) | 1.0 (Ref.) | ||
| Yes | 1.18 (0.72, 1.93) 0.514 | 1.14 (0.65, 2.02) 0.628 | |||
| High cholesterol | 0.009 | ||||
| No | No | 1.0 (Ref.) | 1.0 (Ref.) | ||
| Yes | 2.22 (1.33, 3.72) 0.002 | 1.55 (0.91, 2.63) 0.119 | |||
| Yes | No | 1.0 (Ref.) | 1.0 (Ref.) | ||
| Yes | 0.72 (0.40, 1.29) 0.268 | 0.37 (0.19, 0.72) 0.004 | |||
| Unknown | No | 1.0 (Ref.) | 1.0 (Ref.) | ||
| Yes | 1.58 (0.84, 2.99) 0.160 | 0.76 (0.37, 1.58) 0.463 | |||
| Diabetes | 0.674 | ||||
| No | No | 1.0 (Ref.) | 1.0 (Ref.) | ||
| Yes | 1.56 (1.11, 2.21) 0.011 | 0.98 (0.67, 1.45) 0.930 | |||
| Yes | No | 1.0 (Ref.) | 1.0 (Ref.) | ||
| Yes | 1.21 (0.47, 3.15) 0.693 | 0.69 (0.20, 2.36) 0.55 | |||
| Cardiovascular disease | 0.791 | ||||
| No | No | 1.0 (Ref.) | 1.0 (Ref.) | ||
| Yes | 1.58 (1.05, 2.38) 0.028 | 0.97 (0.62, 1.53) 0.909 | |||
| Yes | No | 1.0 (Ref.) | 1.0 (Ref.) | ||
| Yes | 0.78 (0.41, 1.48) 0.440 | 0.70 (0.25, 2.00) 0.507 | |||
| Ever cancer | 0.290 | ||||
| No | No | 1.0 (Ref.) | 1.0 (Ref.) | ||
| Yes | 1.39 (0.92, 2.10) 0.119 | 0.89 (0.57, 1.38) 0.597 | |||
| Yes | No | 1.0 (Ref.) | 1.0 (Ref.) | ||
| Yes | 1.98 (0.87, 4.54) 0.105 | 0.96 (0.20, 4.52) 0.957 | |||
| Smoking | 0.290 | ||||
| Never | No | 1.0 (Ref.) | 1.0 (Ref.) | ||
| Yes | 2.36 (1.35, 4.14) 0.003 | 1.06 (0.54, 2.11) 0.861 | |||
| Former | No | 1.0 (Ref.) | 1.0 (Ref.) | ||
| Yes | 0.70 (0.22, 2.20) 0.542 | 0.20 (0.04, 1.05) 0.056 | |||
| Current | No | 1.0 (Ref.) | 1.0 (Ref.) | ||
| Yes | 1.45 (0.94, 2.25) 0.092 | 1.17 (0.66, 2.09) 0.584 | |||
| Alcohol user | 0.208 | ||||
| Never | No | 1.0 (Ref.) | 1.0 (Ref.) | ||
| Yes | 4.58 (2.11, 9.96) |
1.81 (0.84, 3.90) 0.128 | |||
| Former | No | 1.0 (Ref.) | 1.0 (Ref.) | ||
| Yes | 1.31 (0.67, 2.59) 0.429 | 1.01 (0.50, 2.08) 0.969 | |||
| Current | No | 1.0 (Ref.) | 1.0 (Ref.) | ||
| Yes | 1.33 (0.80, 2.21) 0.269 | 0.87 (0.48, 1.58) 0.655 | |||
| BMI (kg/m2) | 0.523 | ||||
| No | 1.0 (Ref.) | 1.0 (Ref.) | |||
| Yes | 1.53 (0.76, 3.11) 0.236 | 0.82 (0.36, 1.83) 0.621 | |||
| No | 1.0 (Ref.) | 1.0 (Ref.) | |||
| Yes | 1.29 (0.70, 2.35) 0.414 | 0.64 (0.28, 1.45) 0.281 | |||
| No | 1.0 (Ref.) | 1.0 (Ref.) | |||
| Yes | 1.69 (1.03, 2.77) 0.037 | 1.23 (0.72, 2.12) 0.449 | |||
| Oral contraceptive | 0.992 | ||||
| Never | No | 1.0 (Ref.) | 1.0 (Ref.) | ||
| Yes | 2.03 (0.93, 4.46) 0.077 | 0.69 (0.34, 1.38) 0.295 | |||
| Ever | No | 1.0 (Ref.) | 1.0 (Ref.) | ||
| Yes | 1.57 (1.10, 2.23) 0.012 | 0.98 (0.63, 1.51) 0.923 | |||
| Hormone replacement therapy | 0.586 | ||||
| Never | No | 1.0 (Ref.) | 1.0 (Ref.) | ||
| Yes | 1.40 (0.85, 2.30) 0.186 | 0.85 (0.52, 1.40) 0.529 | |||
| Ever | No | 1.0 (Ref.) | 1.0 (Ref.) | ||
| Yes | 1.35 (0.81, 2.26) 0.245 | 1.05 (0.49, 2.25) 0.897 | |||
| Hysterectomy# | 0.783 | ||||
| No | No | 1.0 (Ref.) | 1.0 (Ref.) | ||
| Yes | 1.18 (0.55, 2.55) 0.667 | 1.11 (0.57, 2.15) 0.768 | |||
| Yes | No | 1.0 (Ref.) | 1.0 (Ref.) | ||
| Yes | 1.00 (0.61, 1.65) 0.993 | 1.14 (0.69, 1.88) 0.448 | |||
| Unknown | No | 1.0 (Ref.) | 1.0 (Ref.) | ||
| Yes | 1.35 (0.72, 2.54) 0.351 | 0.91 (0.48, 1.69) 0.753 | |||
| Ovariectomy$ | 0.048 | ||||
| No | No | 1.0 (Ref.) | 1.0 (Ref.) | ||
| Yes | 1.63 (1.06, 2.50) 0.026 | 1.08 (0.73, 1.59) 0.709 | |||
| Unilateral oophorectomy | No | 1.0 (Ref.) | 1.0 (Ref.) | ||
| Yes | 0.30 (0.10, 0.90) 0.032 | 0.0004 (0.0000, 5.7258) 0.110 | |||
| Bilateral oophorectomy | No | 1.0 (Ref.) | 1.0 (Ref.) | ||
| Yes | 1.04 (0.46, 2.34) 0.920 | 1.15 (0.49, 2.73) 0.745 | |||
| Endometriosis | 0.693 | ||||
| No | No | 1.0 (Ref.) | 1.0 (Ref.) | ||
| Yes | 1.64 (1.10, 2.45) 0.016 | 0.98 (0.64, 1.49) 0.911 | |||
| Yes | No | 1.0 (Ref.) | 1.0 (Ref.) | ||
| Yes | 0.87 (0.36, 2.11) 0.753 | 0.88 (0.23, 3.40) 0.857 | |||
Abbreviation: HR, hazard ratio; CI, confidence interval; Ref., reference; PIR, poverty income ratio; BMI, body mass index.
Adjusted for age, race/ethnicity, marital status, education level, PIR, personal history of hypertension, high cholesterol, diabetes, cardiovascular disease, cancer, smoking status, alcohol consumption, BMI, oral contraceptive use, hormone replacement therapy, age at menarche, age at menopause, endometriosis, hysterectomy, oophorectomy, number of pregnancies, and number of live births.
# Risk estimates for hysterectomy were not adjusted for age at menopause and oophorectomy due to sparse data and the absence of cases within specific strata.
$ Risk estimates for oophorectomy were not adjusted for age at menopause and hysterectomy for the same reason.
In the NHANES 1999–2006 cohort comprising 5547 women (weighted to represent 66,011,902 individuals), no statistically significant associations were identified between uterine fibroids and either all-cause or cause-specific mortality.
To date, only two studies have evaluated the long-term impact of uterine fibroids on mortality outcomes [17, 26]. The 2024 Nurses’ Health Study II, involving 110,091 women aged 25–42 years with a median follow-up of 27.2 years, reported findings that align with those of the present study—no significant association was observed between uterine fibroids and all-cause premature mortality (death before age 70) [26]. Similarly, no significant associations emerged for cause-specific mortality attributed to cardiovascular, respiratory, or other non-cancer causes. However, a notable exception was an observed association between uterine fibroids and increased cancer-specific mortality [26]. Stratified analyses further indicated elevated mortality risk from gynecologic cancers in women with fibroids, whereas no associations were detected for other cancer types, including breast, gastrointestinal, respiratory, lymphatic, hematopoietic, bone, connective tissue, or skin cancers [26]. Conversely, an investigation involving an Asian cohort of 107,357 women reported lower breast cancer–related mortality among individuals with uterine leiomyoma [17]. Several factors may explain these divergent findings: (1) the possibility of chance findings; (2) the Asian population-specific genetic profiles, lifestyle patterns, and environmental exposures; and (3) limitations of the National Health Insurance Research Database, including the absence of detailed data on reproductive history, familial predisposition, environmental risk factors, and health behaviors such as smoking and alcohol use—all of which may act as unmeasured confounders and introduce bias [17]. These discrepancies highlight the need for additional large-scale, ethnically diverse, and well-controlled studies.
The joint effect of endometriosis and uterine fibroids on health outcomes was also examined in the Nurses’ Health Study II, where co-occurrence was associated with elevated all-cause mortality (HR = 1.31; 95% CI: 1.12–1.53) [26]. In the present NHANES-based analysis, 21.67% of participants had both conditions. Subgroup and interaction analyses demonstrated comparable mortality risk patterns regardless of endometriosis status. However, race-stratified analysis revealed significantly increased mortality risk among Black women with uterine fibroids, a pattern absent in White women. This racial disparity was statistically confirmed through interaction testing (p-value for interaction = 0.036). Notably, uterine fibroid prevalence is approximately two to three times higher in Black women than in their White counterparts [8], suggesting a potentially disproportionate burden of adverse outcomes in this subgroup. An additional and unexpected observation emerged: women with both uterine fibroids and hyperlipidemia appeared to exhibit a lower mortality risk. One possible explanation is that individuals diagnosed with hyperlipidemia may engage more consistently in health-promoting behaviors and have greater access to or utilization of healthcare services, contributing to better overall outcomes. However, given the wide CIs surrounding this estimate, these findings should be interpreted with caution and warrant further validation in future research.
Hysterectomy remains a common surgical intervention for managing uterine fibroids and is frequently performed in conjunction with oophorectomy. Existing evidence suggests that hysterectomy may precipitate ovarian failure by disrupting ovarian tissue integrity or impairing vascular supply, thereby reducing ovarian sex steroid production and advancing the onset of menopause—ultimately diminishing the cardioprotective and antineoplastic benefits of endogenous estrogens [28, 29, 30, 31, 32, 33, 34]. Epidemiological studies have further linked hysterectomy to elevated risks of several types of malignancies, CVD, coronary heart disease, and stroke [35, 36, 37]. To assess these potential modifiers, stratified analyses were conducted by hysterectomy and oophorectomy status. While hysterectomy alone did not significantly alter the relationship between uterine fibroids and mortality, stratification by oophorectomy revealed a significant interaction (p for interaction = 0.048). Given the small number of participants with unilateral oophorectomy, these findings should be interpreted with caution.
This investigation has some merits, including a nationally representative cohort design, control for a broad range of potential confounders, and detailed subgroup and interaction analyses. Nonetheless, several limitations should be considered. First, as an observational study, residual confounding—particularly related to factors such as myomectomy or pharmacological treatment for fibroid symptoms—cannot be excluded. Second, reliance on self-reported data introduces potential misclassification bias, especially for exposure variables. Third, the use of NHANES data from 1999 to 2006 may limit applicability to more contemporary populations, potentially affecting generalizability. Fourth, while the median follow-up duration of 16.75 years is substantial, it may still be inadequate to capture the full spectrum of long-term mortality risks associated with a typically benign condition like uterine fibroids. Finally, the inclusion of only diagnosed cases may have led to underascertainment of asymptomatic fibroids, potentially biasing effect estimates toward the null.
In conclusion, this study observed no significant association between uterine fibroids and increased risk of all-cause or cause-specific mortality, reinforcing the need for further research to clarify long-term health outcomes and identify subpopulations at elevated risk.
The raw data from NHANES is publicly available on the NHANES website (https://wwwn.cdc.gov/nchs/nhanes/Default.aspx).
LLiu, CS, LLi, and NW designed the research study. LLiu and CS conducted the data analysis. LLi and NW contributed to the methodological guidance. All authors conducted to writing-original draft. All authors contributed to editorial changes in the manuscript. All authors read and approved the final manuscript. All authors have participated sufficiently in the work and agreed to be accountable for all aspects of the work.
The study was conducted in accordance with the Declaration of Helsinki. The study protocols were approved by the Ethics Review Board of the National Center for Health Statistics (NCHS) under Protocols #98-12 and #2005-06. Participants in NHANES provided written informed consent.
We thank Bullet Edits Limited for the linguistic editing and proofreading of the manuscript.
This research received no external funding.
The authors declare no conflict of interest.
During manuscript preparation, DeepSeek was utilized to assist with spelling and grammar verification. All content was subsequently reviewed and revised by the authors, who assume full responsibility for the final version of the publication.
Supplementary material associated with this article can be found, in the online version, at https://doi.org/10.31083/CEOG38505.
References
Publisher’s Note: IMR Press stays neutral with regard to jurisdictional claims in published maps and institutional affiliations.