


 , Kyoung Chul Chun 2, Eun Hee Ha 1,3,4,*
1 Department of Environmental Medicine, College of Medicine, Ewha Womans University, 07804 Seoul, Republic of Korea
2 Department of Obstetrics and Gynecology, Inje University Ilsan Paik Hospital, 10380 Goyang, Republic of Korea
3 Institute of Ewha-SCL for Environmental Health (IESEH), College of Medicine, Ewha Womans University, 07804 Seoul, Republic of Korea
4 Graduate Program in System Health Science and Engineering, College of Medicine, Ewha Womans University, 07804 Seoul, Republic of Korea
Abstract
Maternal nutritional requirements change with each trimester, making it crucial to provide appropriate vitamin supplementation tailored to each stage. In this study, we investigated the trimester-specific patterns of various vitamin supplements in pregnant women.
In this multicenter cross-sectional study, we analyzed a total of 816 singleton pregnant women who visited hospitals for prenatal care from April 2023 to December 2023. Participants were grouped by trimester, with 140 in the first trimester, 365 in the second, and 311 in the third trimester. A stratified analysis by trimester was performed using multiple linear regression and logistic regression models to examine trimester-specific differences in vitamin supplement intake. A one-way analysis of variance was conducted to compare the total vitamin supplement intake across trimesters.
Among the 816 pregnant women, 98.16% (801/816) reported taking at least one supplement, with the mean number of supplements increasing from 2.92 ± 1.27 in the first trimester to 4.04 ± 1.63 in the second and 4.37 ± 1.52 in the third trimester. Notably, iron supplementation increased significantly across trimesters. Stratification analysis revealed that maternal age significantly influenced calcium intake (p-value for interaction = 0.03), with women aged ≥35 years exhibiting higher intake in the third trimester. However, parity and body mass index (BMI) did not show significant interactions with any supplement type. Vitamin D and folic acid intake remained consistently high across trimesters, indicating widespread awareness of their importance. These findings suggest that supplementation practices vary based on pregnancy stage and maternal characteristics.
Our study examined the patterns of vitamin supplement intake among pregnant women in Republic of Korea across trimesters. We anticipate that this research will serve as a foundational study, providing valuable insights for future investigations into trimester-specific supplement use among pregnant women.
Keywords
- fetal development
- maternal health
- pregnancy
- pregnancy outcome
- pregnancy trimesters
- vitamins
Interest in micronutrient intake during pregnancy has increased, as maternal nutrition is crucial to fetal growth and development. In several developing countries, national antenatal programs have been implemented to emphasize the importance of vitamin supplements during pregnancy [1]. Leading organizations such as the American College of Obstetricians and Gynecologists (ACOG) [2] recommends antenatal vitamin supplements. For these reasons, many pregnant women today are taking a variety of supplements. Studies have shown that vitamin supplement use ranges from 78% to 98% in pregnancy cohorts across various countries, including the United States, Canada, and Australia [3], and 88% in Republic of Korea [4].
As in other countries, pregnant women in Republic of Korea can easily purchase various supplements from online markets, as prescriptions are generally not required. However, the effectiveness and quality of these supplements cannot be guaranteed, with some containing nutrient levels either too low or too high, or exceeding the recommended daily intake. A domestic study found that iron in 73 products (39.5%) and folic acid in 14 products (8.0%) were likely to be consumed at amounts greater than the tolerable upper intake levels [5]. Additionally, ACOG found significant differences in nutrient levels and prices among prenatal vitamins sold over-the-counter in the USA, calling for more regulatory action on nutritional supplements [2]. Inappropriate vitamin supplement or nutrition during pregnancy can lead to numerous deficiencies, which, in turn, can negatively affect pregnancy outcomes and infant growth [1].
Comprehensive nutritional supplementation (multiple micronutrients plus balanced protein energy) among women with inadequate nutrition has been associated with improved birth outcomes, including decreased rates of low birthweight [6]. Moreover, specific vitamin supplements play distinct roles across different pregnancy trimesters. A Cochrane review revealed that oral folate supplementation prior to conception and up to 12 weeks of pregnancy is effective in preventing the occurrence of neural tube defects (NTDs) [7]. Docosahexaenoic acid and eicosapentaenoic acid during pregnancy had beneficial effects on the neurological development of the fetus and infant by improving language, memory, attention, hand coordination, affecting sleep patterns, and improving visual acuity. It is recommended that supplementation with omega-3 fatty acids is initiated before 20 weeks of pregnancy [8].
In Republic of Korea, the Ministry of Health and Welfare and the Korean Nutrition Society provide dietary reference intakes (DRIs) for various nutrients [9]. However, these are merely recommendations, leading many pregnant women to rely on market trends and popular supplements rather than scientific evidence or professional advice. Given this context, understanding the current patterns of vitamin supplement intake by pregnant women and the factors influencing these choices have become increasingly relevant. Gaining insight into these patterns not only provides valuable information on common practices but can also help in assessing gaps in knowledge and support the development of evidence-based guidelines. This study aims to examine the trimester-specific patterns of vitamin supplement intake among pregnant women.
The study was conducted in accordance with the guidelines of the Declaration of Helsinki and was approved by the Institutional Review Board (IRB) of Inje University Ilsan Paik Hospital (IRB No.: 2023-04-036-001). The study population included singleton pregnant women visiting obstetric clinics at Inje University Ilsan Paik Hospital, Miz Women’s Hospital, Daejeon and Mam’s Women’s Hospital from April 2023 to December 2023.
This cross-sectional study collected data from pregnant women visiting the described hospitals. Information on vitamin supplement usage, demographic factors, socioeconomic status, obstetric history, and health status was gathered through a structured questionnaire. The survey was self-administered, and participants were asked about their overall supplement intake. Participants with incomplete survey responses or those with multiple pregnancies were excluded from the analysis. The covariates considered in the models were maternal age, gravidity, parity, body mass index (BMI), education level, income level, mother’s occupation, drinking status, and smoking status. Pregnancy trimester was defined as follows: the first trimester from week 1 to week 13, the second trimester from week 14 to week 27, and the third trimester from week 28 to week 40. As this study subjects are all Koreans, BMI was categorized as
This study was conducted using data that were initially cleansed and analyzed with SAS 9.4 software package (SAS Institute Inc., Cary, NC, USA). Figures were generated using R software version 4.3.3 (R Foundation for Statistical Computing, Vienna, Austria).
The Kolmogorov-Smirnov test was applied to assess the normality of continuous variables. Based on the data distribution, one-way analysis of variance (ANOVA), Kruskal-Wallis, Chi-squared, or Fisher’s exact tests were utilized as appropriate. Continuous variables were presented as means
Among the total of 6592 participants, those with missing values in maternal age, gravidity, parity, BMI, education level, income level, mother’s occupation, drinking status, smoking status, and type of vitamin supplement were excluded from the study. Consequently, a total of 816 participants were included in this research (Fig. 1).
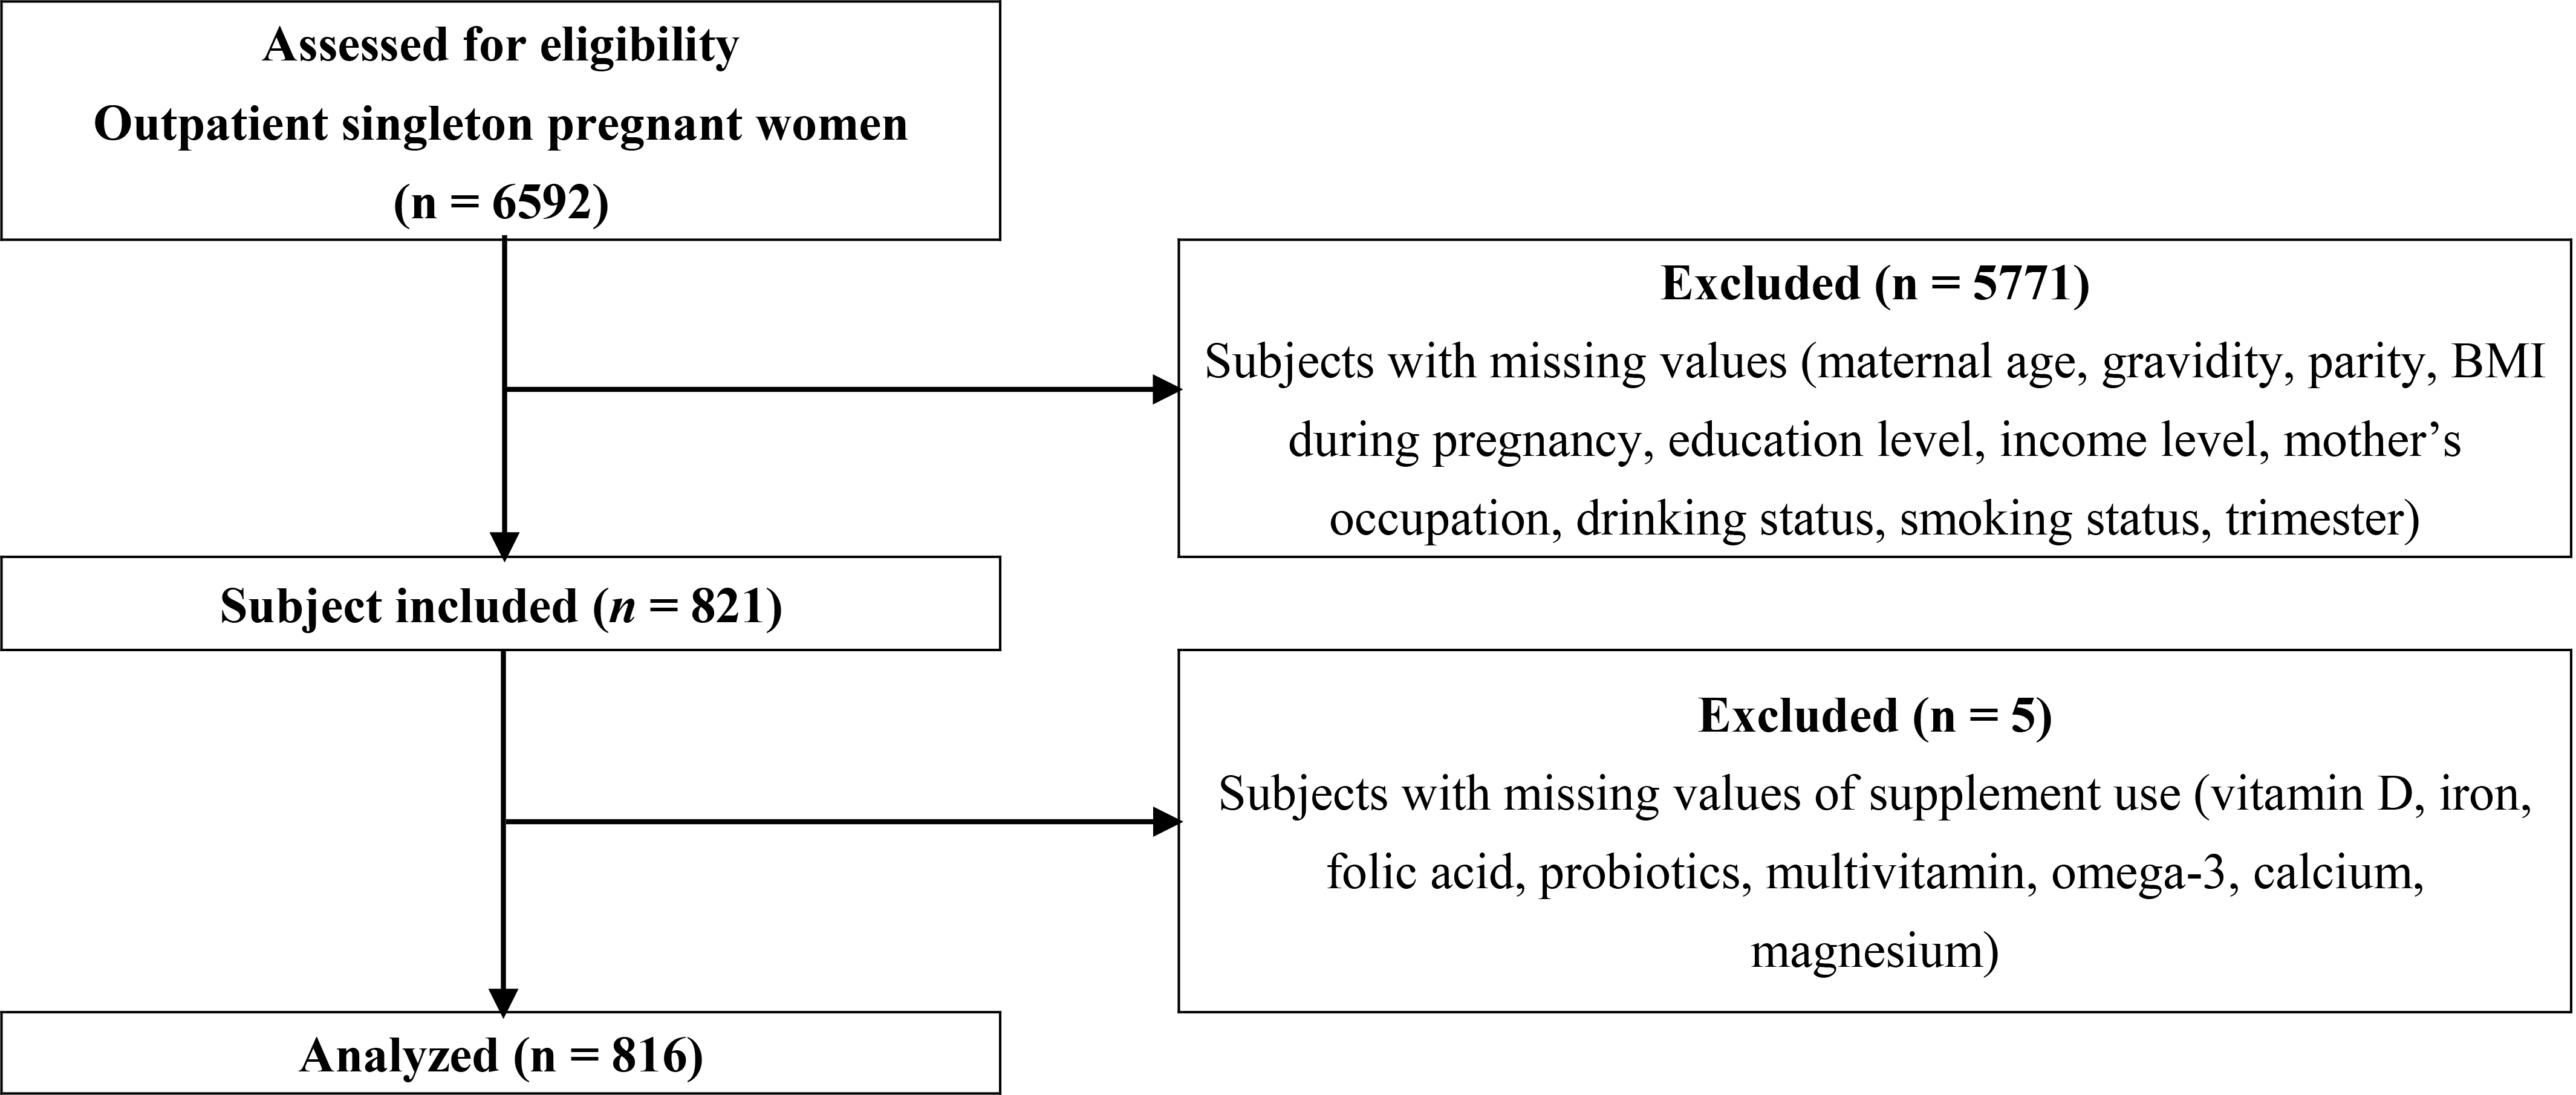 Fig. 1.
 Study flow diagram. Flow diagram of the study population selection process. A total of 6592 subjects were assessed for eligibility, and 816 were included in the final analysis. BMI, body mass index.
The demographic, obstetric characteristics, and socioeconomic status of the participants by each trimester are shown in Table 1. Out of a total of 816 participants, 140 (17.16%) were in the first trimester of pregnancy, 365 (44.73%) in the second trimester, and 311 (38.11%) in the third trimester. The median age of the participants was 32 years (Quartile 1: 30, Quartile 3: 35), and the median BMI during pregnancy was 24.04 kg/m2 (Quartile 1: 21.77, Quartile 3: 27.82). Maternal age and BMI during pregnancy were statistically significant between trimester groups. When analyzed with categorical variables, there were significant differences in maternal age and BMI during pregnancy across trimesters (p = 0.0003, p
| Variables | Pregnant women | |||||
| 1st trimester | 2nd trimester | 3rd trimester | p-value | |||
| N = 140 (17.16%) | N = 365 (44.73%) | N = 311 (38.11%) | ||||
| Age (years) | mean (SD) | 32.06 (3.61) | 32.81 (4.11) | 33.19 (3.59) | 11.31a) | 0.0035** |
| median (Q1–Q3) | 32 (30–34) | 32 (30–35) | 33 (31–35) | |||
| minimum | 23 | 18 | 22 | |||
| maximum | 43 | 47 | 45 | |||
| BMI (kg/m2) | mean (SD) | 23.02 (4.00) | 24.37 (3.96) | 26.33 (4.32) | 72.36a) | |
| median (Q1–Q3) | 22.01 (19.99–25.71) | 23.63 (21.57–26.61) | 25.52 (22.89–29.29) | |||
| minimum | 16.90 | 13.32 | 16.03 | |||
| maximum | 38.20 | 37.13 | 38.16 | |||
| Materanl age (years) | 111 (79.29%) | 255 (69.86%) | 189 (60.77%) | 16.25b) | 0.0003*** | |
| 29 (20.71%) | 110 (30.14%) | 122 (39.23%) | ||||
| Gravida | 1 (Primigravida) | 85 (60.71%) | 223 (61.10%) | 180 (57.88%) | 0.78b) | 0.6765 |
| 55 (39.29%) | 142 (38.90%) | 131 (42.12%) | ||||
| Parity | 0 (Nullipara) | 84 (60.00%) | 238 (65.21%) | 194 (62.38%) | 1.34b) | 0.5123 |
| 56 (40.00%) | 127 (34.79%) | 117 (37.62%) | ||||
| BMI (kg/m2) | 11 (7.86%) | 12 (3.29%) | 2 (0.64%) | 62.82c) | ||
| 18.5–22.9 | 70 (50.00%) | 142 (38.90%) | 77 (24.76%) | |||
| 23–24.9 | 20 (14.29%) | 81 (22.19%) | 60 (19.29%) | |||
| 39 (27.86%) | 130 (35.62%) | 172 (55.31%) | ||||
| Education | 26 (18.57%) | 77 (21.10%) | 65 (20.90%) | 0.42b) | 0.8088 | |
| 114 (81.43%) | 288 (78.90%) | 246 (79.10%) | ||||
| Income (dollar) | 92 (65.71%) | 258 (70.41%) | 217 (69.77%) | 1.09b) | 0.5797 | |
| 48 (34.29%) | 108 (29.59%) | 94 (30.23%) | ||||
| Occupation | House wife | 52 (37.14%) | 164 (44.93%) | 144 (46.30%) | 3.46b) | 0.1771 |
| Employed | 88 (62.86%) | 201 (55.07%) | 167 (53.70%) | |||
| Drinking status | No | 48 (34.29%) | 132 (36.16%) | 117 (37.62%) | 0.48b) | 0.7869 |
| Yes | 92 (65.71%) | 233 (63.84%) | 194 (62.38%) | |||
| Smoking status | No | 128 (91.43%) | 318 (87.12%) | 273 (87.78%) | 1.84b) | 0.3979 |
| Yes | 12 (8.57%) | 47 (12.88%) | 38 (12.22%) | |||
Abbreviations: Q1–Q3, first quartile to third quartile (interquartile range); SD, standard deviation; BMI, body mass index.
a) one-way analysis of variance (ANOVA) test, b) Chi-squared test, c) Fisher’s exact test.
** Indicate significant difference between trimester groups; p
*** Indicate significant difference between trimester groups; p
**** Indicate significant difference between trimester groups; p
Table 2 summarizes 8 types of vitamin supplement use during pregnancy by trimester. A total of 98.16% (801/816) of participants took at least one supplement across trimesters. When analyzed with the Chi-square and Fisher’s exact test, significant differences were observed for the variables of iron, probiotics, multivitamins, omega-3, calcium, and magnesium (p
| Variables | Pregnancy women | |||||
| 1st trimester (N, %) | 2nd trimester (N, %) | 3rd trimester (N, %) | p-value | |||
| N = 140 (17.16) | N = 365 (44.73) | N = 311 (38.11) | ||||
| Vitamin D | No | 38 (27.14) | 101 (27.67) | 74 (23.79) | 1.40a) | 0.4958 |
| Yes | 102 (72.86) | 264 (72.33) | 237 (76.21) | |||
| Iron | No | 116 (82.86) | 101 (27.67) | 29 (9.32) | 249.80a) | |
| Yes | 24 (17.14) | 264 (72.33) | 282 (90.68) | |||
| Folic acid | No | 2 (1.43) | 12 (3.29) | 15 (4.82) | 3.38b) | 0.2000 |
| Yes | 138 (98.57) | 353 (96.71) | 296 (95.18) | |||
| Probiotics | No | 73 (52.14) | 182 (49.86) | 130 (41.80) | 6.05a) | 0.0486* |
| Yes | 67 (47.86) | 183 (50.14) | 181 (58.20) | |||
| Multivitamin | No | 107 (76.43) | 214 (58.63) | 190 (61.09) | 14.20a) | 0.0008*** |
| Yes | 33 (23.57) | 151 (41.37) | 121 (38.91) | |||
| Omega-3 | No | 112 (80.00) | 211 (57.81) | 185 (59.49) | 22.85a) | |
| Yes | 28 (20.00) | 154 (42.19) | 126 (40.51) | |||
| Calcium | No | 122 (87.14) | 257 (70.41) | 192 (61.74) | 29.72a) | |
| Yes | 18 (12.86) | 108 (29.59) | 119 (38.26) | |||
| Magnesium | No | 126 (90.00) | 294 (80.55) | 237 (76.21) | 11.71a) | 0.0029** |
| Yes | 14 (10.00) | 71 (19.45) | 74 (23.79) | |||
a) Chi-squared test, b) Fisher’s exact test.
* Indicate significant difference between trimester groups; p
** Indicate significant difference between trimester groups; p
*** Indicate significant difference between trimester groups; p
**** Indicate significant difference between trimester groups; p
AIC values were calculated to identify the most appropriate model specification for the analysis (Table 3). The results indicated that model 3 consistently achieved the lowest AIC values for a majority of the supplements examined, so it was ultimately chosen as the final model specification.
| Model | Vitamin D | Iron | Folic acid | Probiotics | Multivitamin | Omega-3 | Calcium | Magnesium |
| Crude | 941.57 | 757.66 | 252.74* | 1128.56 | 1069.68* | 1063.05 | 970.63 | 797.99* |
| Model 1 | 940.90 | 753.07* | 255.15 | 1129.09 | 1070.94 | 1062.00 | 972.26 | 800.33 |
| Model 2 | 939.78 | 756.87 | 258.84 | 1126.31 | 1073.93 | 1057.80 | 975.34 | 803.66 |
| Model 3 | 939.18* | 761.69 | 263.47 | 1098.59* | 1077.37 | 1038.58* | 970.39* | 800.83 |
Model 1: maternal age, BMI.
Model 2: maternal age, BMI, education, income.
Model 3: maternal age, gravidity, parity, BMI, education, income, mother’s occupation, drinking status, smoking status.
* Indicates model with the lowest AIC value. AIC, Akaike Information Criterion.
Table 4 presents the odds ratios (OR) and 95% confidence intervals (CI) for the comparison of supplement use across trimesters. Significant differences were observed in the use of iron, omega-3, and calcium, with higher odds of use in later trimesters compared to the first trimester. Specifically, iron intake significantly increased between the first and second (OR = 13.03, p = 0.0005) and first and third trimesters (OR = 44.42, p
| Supplement | Comparison (trimester) | OR (95% CI) | p-value |
| Vitamin D | 1st vs. 2nd | 0.96 (0.61–1.50) | 0.6058 |
| 1st vs. 3rd | 1.09 (0.68–1.77) | 0.5468 | |
| 2nd vs. 3rd | 1.15 (0.80–1.64) | 0.5565 | |
| Iron | 1st vs. 2nd | 13.03 (7.83–21.69) | 0.0005*** |
| 1st vs. 3rd | 44.42 (24.34–81.03) | ||
| 2nd vs. 3rd | 3.32 (2.11–5.23) | ||
| Folic acid | 1st vs. 2nd | 0.45 (0.10–2.08) | 0.7111 |
| 1st vs. 3rd | 0.29 (0.06–1.35) | 0.0871 | |
| 2nd vs. 3rd | 0.61 (0.28–1.35) | 0.0540 | |
| Probiotics | 1st vs. 2nd | 1.06 (0.71–1.58) | 0.4321 |
| 1st vs. 3rd | 1.42 (0.92–2.17) | 0.0490* | |
| 2nd vs. 3rd | 1.33 (0.96–1.83) | 0.0694 | |
| Multivitamin | 1st vs. 2nd | 2.33 (1.49–3.66) | 0.0023** |
| 1st vs. 3rd | 2.07 (1.29–3.31) | 0.0745 | |
| 2nd vs. 3rd | 0.89 (0.65–1.23) | 0.0793 | |
| Omega-3 | 1st vs. 2nd | 2.99 (1.85–4.82) | 0.0002*** |
| 1st vs. 3rd | 2.52 (1.53–4.13) | 0.0323* | |
| 2nd vs. 3rd | 0.86 (0.62–1.19) | 0.0316* | |
| Calcium | 1st vs. 2nd | 2.87 (1.65–4.99) | 0.0642 |
| 1st vs. 3rd | 4.20 (2.39–7.39) | ||
| 2nd vs. 3rd | 1.45 (1.04–2.02) | ||
| Magnesium | 1st vs. 2nd | 2.19 (1.18–4.07) | 0.2077 |
| 1st vs. 3rd | 2.85 (1.51–5.37) | 0.0024** | |
| 2nd vs. 3rd | 1.31 (0.89–1.92) | 0.0029** |
Abbreviation: OR, odds ratio; CI, confidence interval.
Adjusted model: maternal age, gravidity, parity, BMI, education level, income level, mother’s occupation, drinking status, smoking status.
* Indicate significant difference between trimester groups; p
** Indicate significant difference between trimester groups; p
*** Indicate significant difference between trimester groups; p
**** Indicate significant difference between trimester groups; p
Stratification analysis was performed based on maternal age (
| Vitamin D | Iron | Folic acid | Probiotics | ||||||||||
| 2nd trimester | 3rd trimester | p-value for interaction | 2nd trimester | 3rd trimester | p-value for interaction | 2nd trimester | 3rd trimester | p-value for interaction | 2nd trimester | 3rd trimester | p-value for interaction | ||
| Age (years) | 0.86 (0.51–1.47) | 1.08 (0.61–1.92) | 0.97 | 17.62 (9.51–32.65)**** | 44.17 (21.67–90.02)**** | 0.06 | 0.14 (0.01–1.81) | 0.07 (0.01–0.95)* | 0.42 | 1.03 (0.64–1.64) | 1.40 (0.85–2.30) | 0.85 | |
| 1.25 (0.51–3.06) | 1.05 (0.42–2.65) | 6.84 (2.58–18.10) | 49.44 (14.68–166.53)**** | 2.76 (0.59–12.99) | 2.35 (0.48–11.59) | 1.01 (0.42–2.42) | 1.13 (0.46–2.77) | ||||||
| Parity | 0 | 0.79 (0.43–1.46) | 0.99 (0.51–1.94) | 0.40 | 18.02 (8.65–37.54)*** | 53.33 (23.28–122.14)**** | 0.81 | 0.27 (0.02–3.37) | 0.12 (0.01–1.48) | 0.20 | 1.38 (0.82–2.32) | 1.98 (1.13–3.49)* | 0.68 |
| 1.23 (0.62–2.45) | 1.24 (0.61–2.54) | 8.23 (3.92–17.47) | 35.87 (13.77–93.47)**** | 1.66 (0.37–7.43) | 1.76 (0.34–8.98) | 0.63 (0.32–1.25) | 0.84 (0.42–1.68) | ||||||
| BMI (kg/m2) | 1.13 (0.61–2.12) | 0.77 (0.38–1.56) | 0.14 | 13.54 (6.55–28.01)** | 40.32 (15.89–102.34)**** | 0.64 | 0.88 (0.22–3.65) | 0.33 (0.08–1.37) | 0.52 | 1.45 (0.81–2.60) | 1.87 (0.94–3.73) | 0.63 | |
| 0.99 (0.50–1.95) | 1.44 (0.72–2.87) | 13.95 (6.64–29.33)* | 49.98 (21.91–114.01)**** | 0.30 (0.02–4.18) | 0.28 (0.02–3.95) | 0.77 (0.42–1.42) | 1.11 (0.61–2.04) | ||||||
| Multivitamin | Omega-3 | Calcium | Magnesium | ||||||||||
| 2nd trimester | 3rd trimester | p-value for interaction | 2nd trimester | 3rd trimester | p-value for interaction | 2nd trimester | 3rd trimester | p-value for interaction | 2nd trimester | 3rd trimester | p-value for interaction | ||
| Age (years) | 3.07 (1.78–5.29)** | 2.34 (1.31–4.15) | 0.90 | 3.70 (2.13–6.45)*** | 2.11 (1.17–3.81) | 0.73 | 3.07 (1.64–5.75)* | 3.22 (1.67–6.18)** | 0.03* | 2.45 (1.18–5.08) | 2.83 (1.33–6.04)* | 0.84 | |
| 1.11 (0.47–2.59) | 1.35 (0.57–3.22) | 1.47 (0.54–3.97) | 3.11 (1.14–8.46) | 2.23 (0.69–7.23) | 6.54 (2.01–21.25)*** | 1.27 (0.38–4.26) | 2.44 (0.72–8.22) | ||||||
| Parity | 0 | 2.25 (1.28–3.98)* | 2.03 (1.11–3.72) | 0.99 | 2.80 (1.57–5.01)* | 2.98 (1.61–5.51)** | 0.31 | 3.04 (1.50–6.14) | 5.46 (2.64–11.29)**** | 0.19 | 2.02 (0.96–4.27) | 2.94 (1.35–6.37)** | 0.85 |
| 2.54 (1.20–5.38)* | 2.17 (1.00–4.68) | 3.42 (1.47–7.98)** | 2.09 (0.87–4.99) | 2.61 (1.07–6.37) | 2.58 (1.04–6.40) | 2.62 (0.84–8.17) | 2.93 (0.93–9.23) | ||||||
| BMI (kg/m2) | 2.75 (1.43–5.29) | 3.48 (1.65–7.36)* | 0.28 | 3.68 (1.81–7.51)* | 3.61 (1.60–8.17) | 0.53 | 2.87 (1.30–6.32) | 4.64 (1.96–10.96)** | 0.72 | 2.00 (0.85–4.69) | 2.82 (1.10–7.21) | 0.88 | |
| 1.93 (1.01–3.69)* | 1.48 (0.78–2.83) | 2.68 (1.37–5.23)* | 2.27 (1.17–4.42) | 2.60 (1.18–5.70) | 3.66 (1.68–7.97)** | 2.15 (0.85–5.42) | 2.69 (1.08–6.72)* | ||||||
* Indicate significant difference with the first trimester as a reference; p
** Indicate significant difference with the first trimester as a reference; p
*** Indicate significant difference with the first trimester as a reference; p
**** Indicate significant difference with the first trimester as a reference; p
Table 6 and Fig. 2 showed the percentage of supplement intake across trimesters by maternal age groups. The analysis of supplement intake by age group and trimester showed a distinct pattern. In the first trimester, women above 35 had higher intake rates for all supplements except vitamin D. However, in the second trimester, younger women showed a temporary increase in supplement intake, narrowing the gap with the older group. By the third trimester, younger women had lower intake rates than the older group for all supplements except vitamin D. Unlike other supplements, vitamin D was the only supplement with consistently higher intake among younger women across all trimesters.
| Supplements | Age group | 1st trimester (%) | 2nd trimester (%) | 3rd trimester (%) |
|---|---|---|---|---|
| Vitamin D | Under 35 | 75.23 | 73.73 | 78.71 |
| Above 35 | 64.52 | 69.09 | 71.56 | |
| Iron | Under 35 | 14.68 | 74.51 | 89.11 |
| Above 35 | 25.81 | 67.27 | 93.58 | |
| Folic acid | Under 35 | 98.17 | 97.25 | 93.56 |
| Above 35 | 100.00 | 95.45 | 98.17 | |
| Probiotics | Under 35 | 47.71 | 49.80 | 57.43 |
| Above 35 | 48.39 | 50.91 | 59.63 | |
| Multivitamin | Under 35 | 19.27 | 41.96 | 35.15 |
| Above 35 | 38.71 | 40.00 | 45.87 | |
| Omega-3 | Under 35 | 19.27 | 46.67 | 36.63 |
| Above 35 | 22.58 | 31.82 | 47.71 | |
| Calcium | Under 35 | 12.84 | 31.37 | 33.66 |
| Above 35 | 12.90 | 25.45 | 46.79 | |
| Magnesium | Under 35 | 9.17 | 20.00 | 22.77 |
| Above 35 | 12.90 | 18.18 | 25.69 |
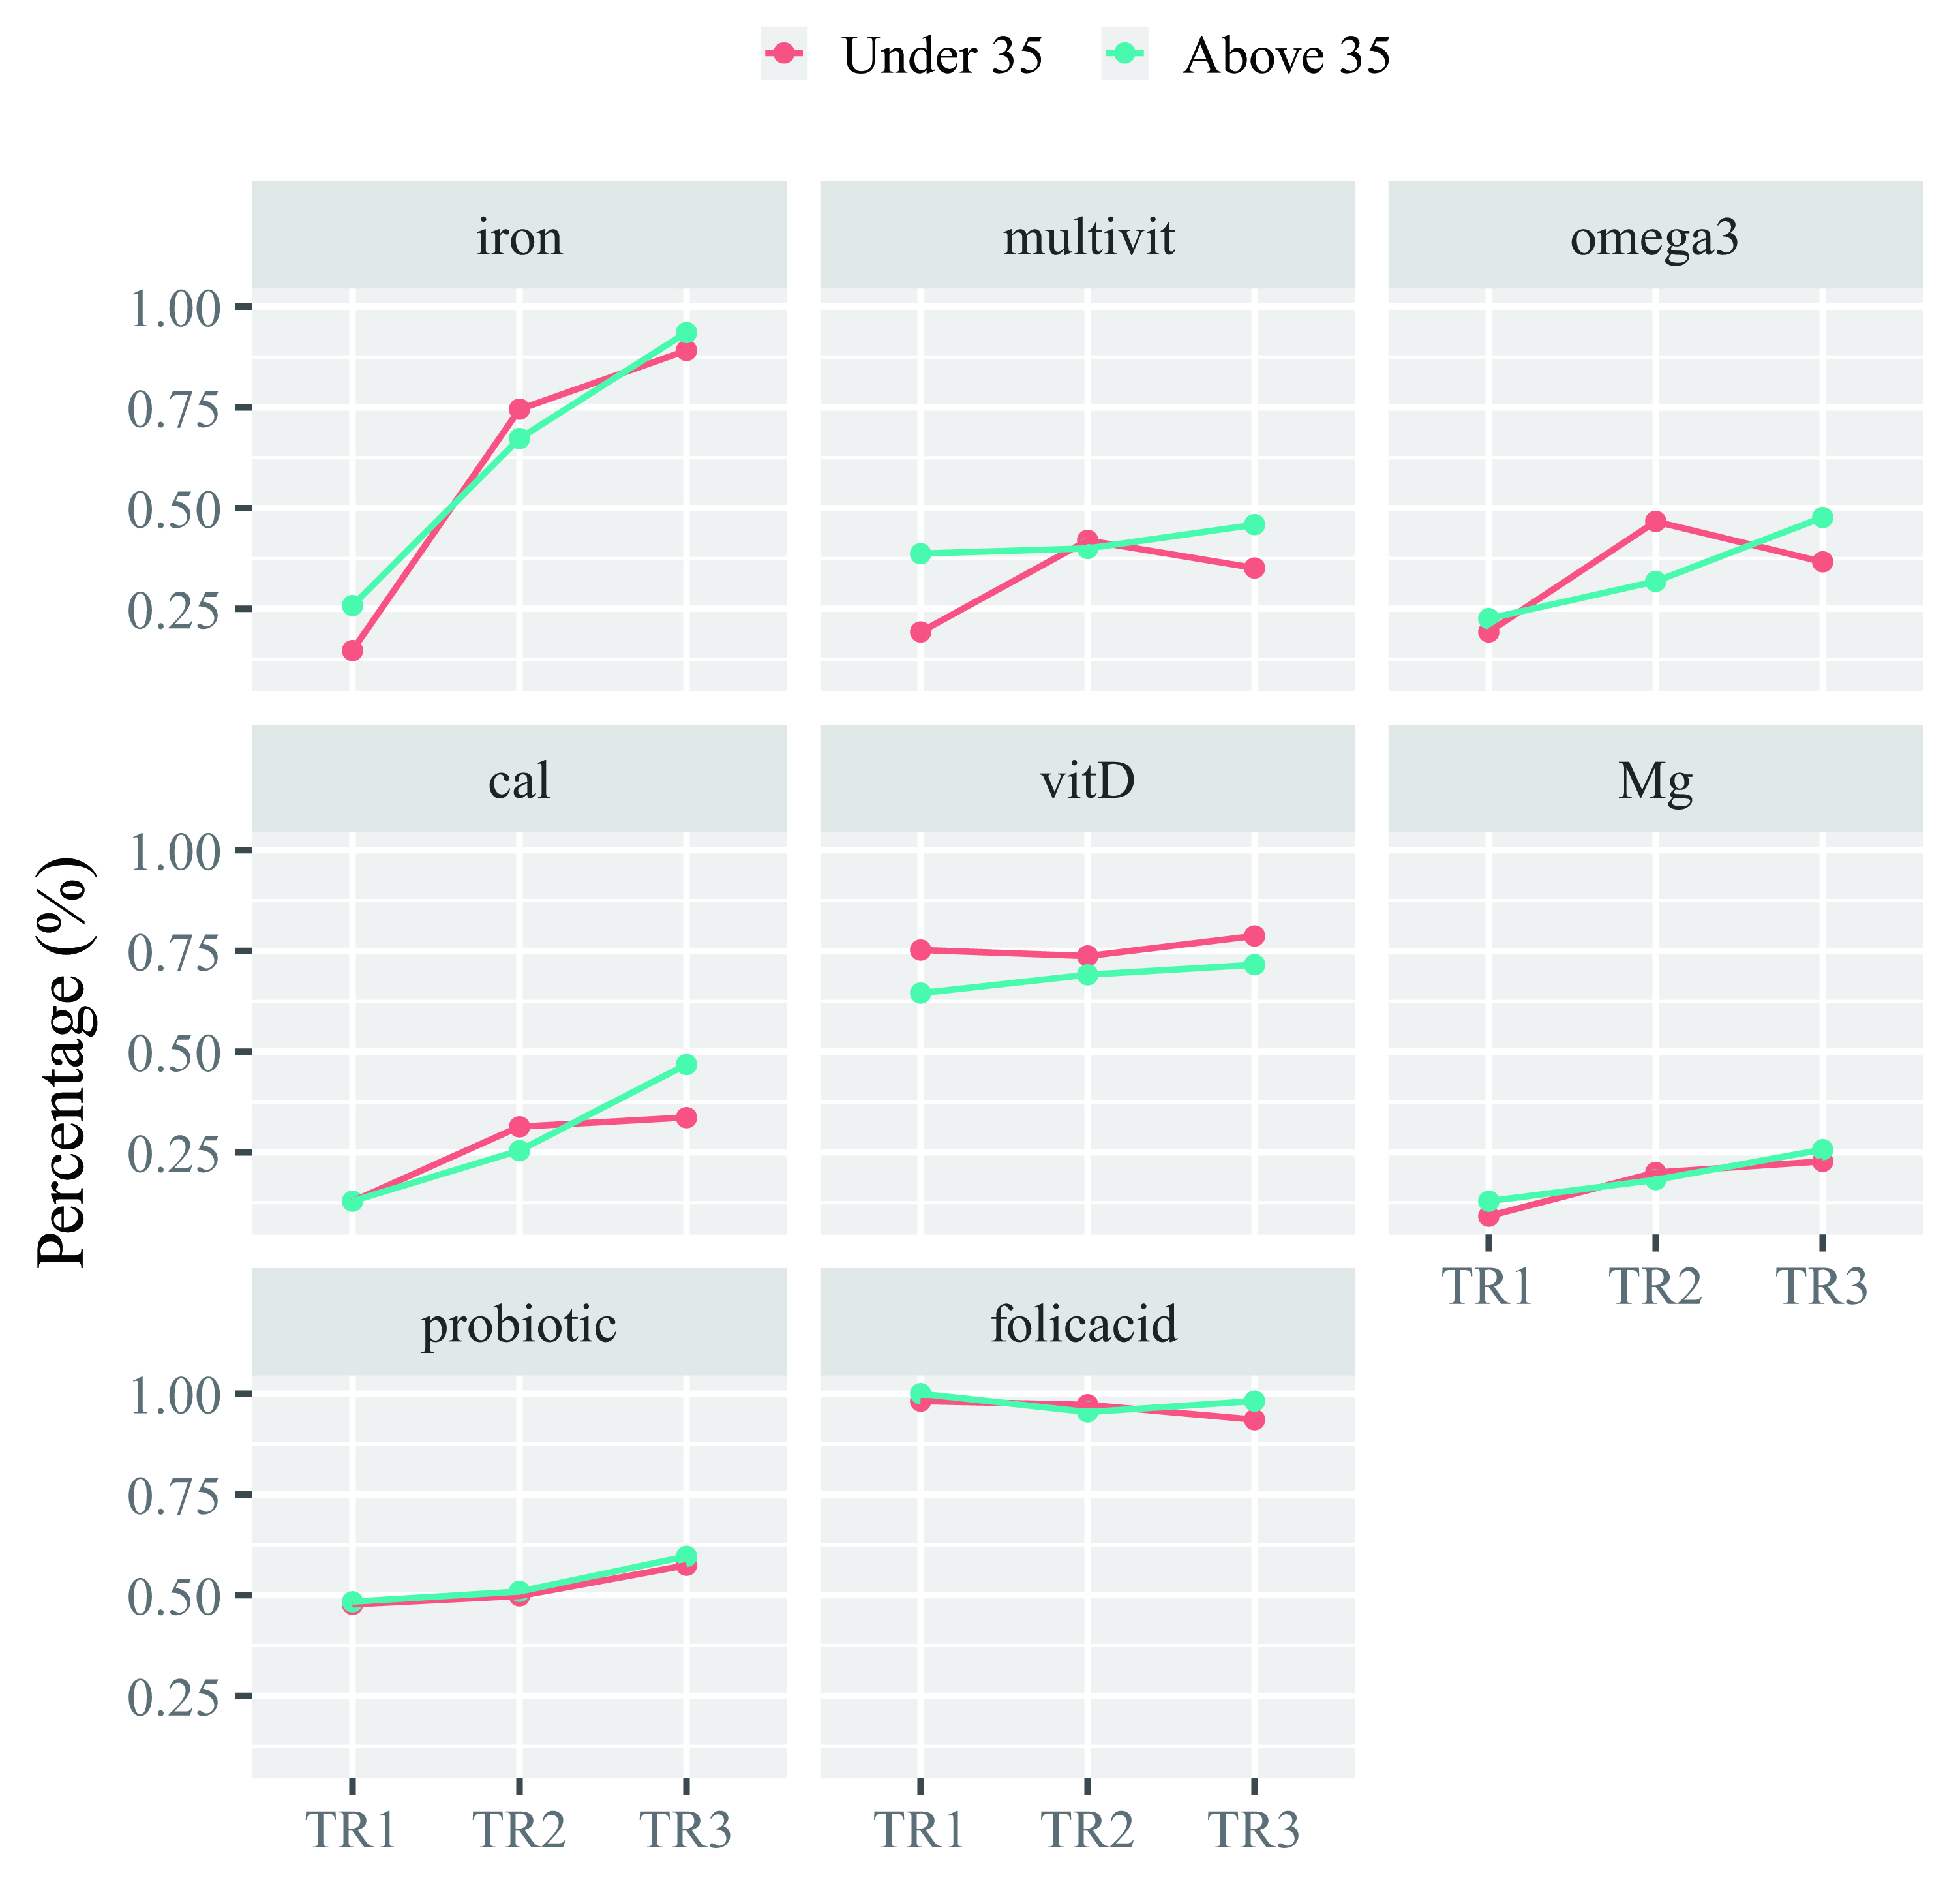 Fig. 2.
 Percentage of supplement intake across trimesters by age group. The figure displays the percentage of pregnant women consuming various nutrients across three trimesters (TR1, TR2, and TR3), stratified by maternal age groups: “Under 35” (red line) and “Above 35” (blue line). Cal, calcium; vitD, vitamin D; Mg, magnesium; multivit, multivitamin.
The total vitamin supplement count significantly differed across pregnancy trimesters, as confirmed by the Kruskal-wallis test (
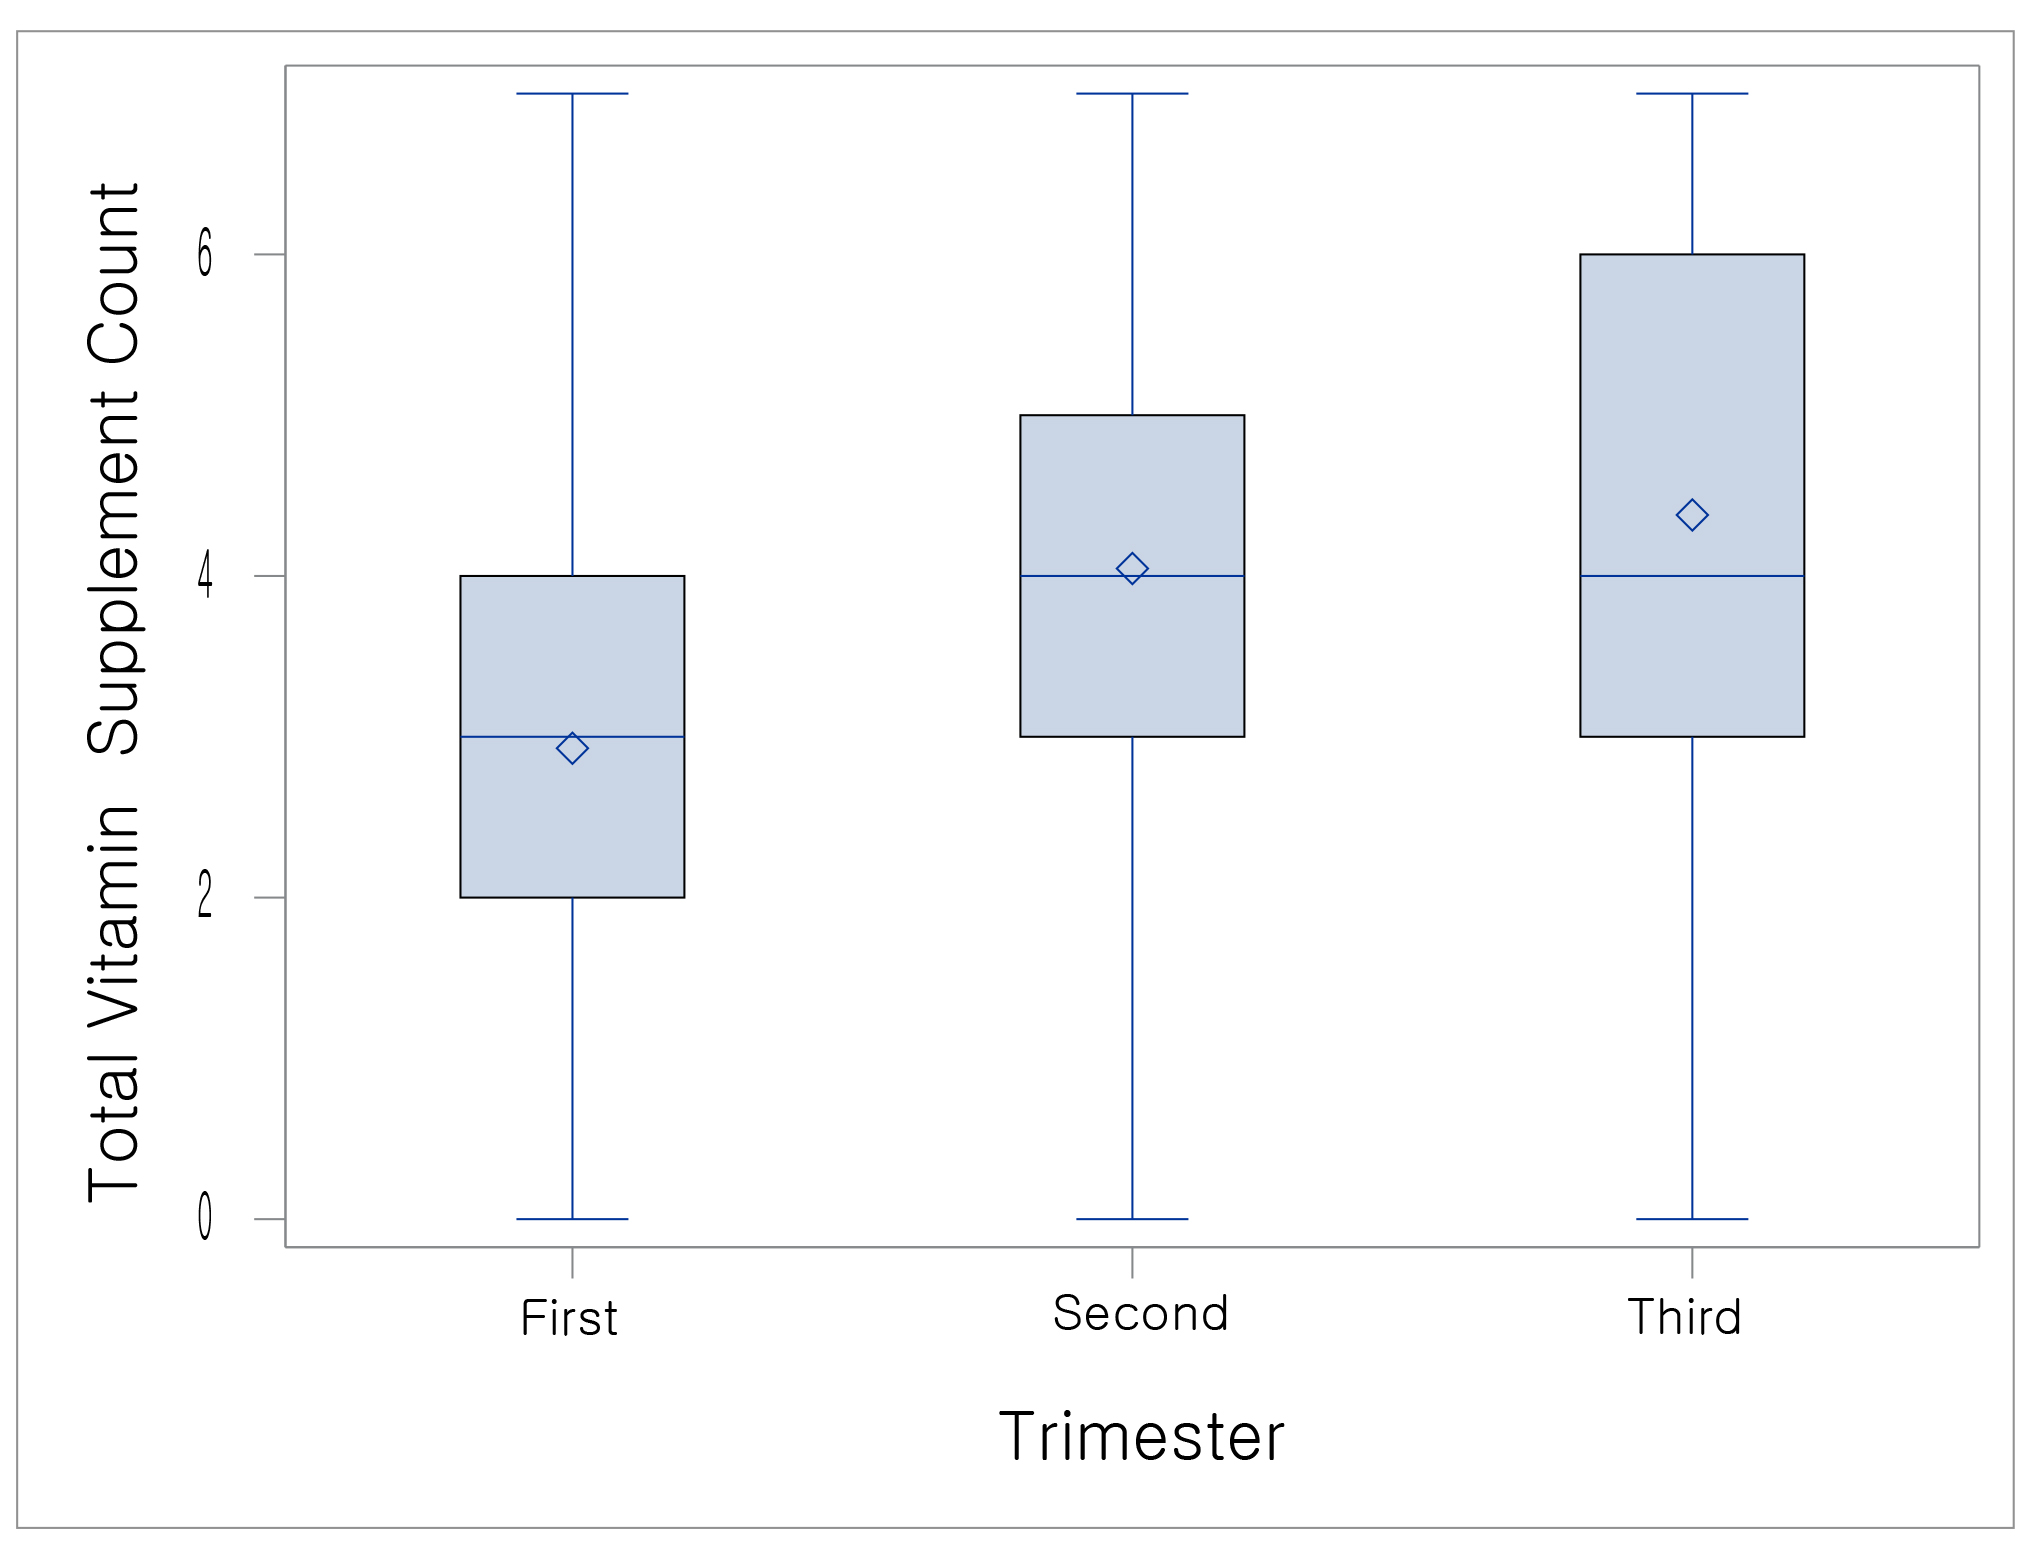 Fig. 3.
 Comparison of the number of vitamin supplements used based on the trimester of pregnancy. The boxplot illustrates the distribution of total vitamin supplement counts during the first, second, and third trimesters of pregnancy.
In this study, we investigated the patterns of vitamin supplementation use among pregnant women in Republic of Korea, providing a cross-sectional comparison across trimesters. The findings revealed a high prevalence of vitamin supplement use among pregnant women, with 98.16% of participants taking at least one supplement across trimesters, a rate exceeding the previously reported 72.9% in the United States [11] and 88% in Republic of Korea [4]. Since this study was conducted among pregnant women receiving hospital care, the participants are likely to have a higher interest in maternal and fetal health and may have already received nutritional guidance from healthcare providers. The increased intake of vitamin supplements among pregnant women is likely due to the expanding market for these products and the growing awareness of personal health and well-being, reflecting a broader consumer trend toward foods that enhance health, including vitamin supplements [12].
Supplementation with vitamins such as iron, probiotics, multivitamins, omega-3, calcium, and magnesium significantly varied across trimesters. In contrast, vitamin D and folic acid showed no significant differences across trimesters (p = 0.4958, p = 0.20, respectively), suggesting consistent use throughout pregnancy.
While folic acid intake was reported as 98.57% in the first trimester, 96.71% in the second trimester, 95.18% in the third trimester, a relatively lower intake was observed in later trimesters, possibly reflecting longstanding recommendations that prioritize folic acid consumption during early pregnancy. According to previous study, folic acid use also showed a pattern similar to our results, significantly decreasing as pregnancy progressed, with 93.1% in the first trimester, 43.7% in the second trimester, and 34.8% in the third trimester (p
In this study, vitamin D intake remained consistent across all trimesters, suggesting a growing awareness among pregnant women of its potential benefits during pregnancy. This trend is particularly relevant given that approximately 89% pregnant women in Republic of Korea have been reported to be vitamin D deficient. Research has shown that gestational vitamin D deficiency is associated with fetal intrauterine growth restriction and various adverse fetal and neonatal health outcomes, including an increased risk of preterm birth, miscarriage, low birth weight, and neonatal hypocalcemia [16].
In this study, statistically significant differences in iron supplement were observed across trimesters, with odds ratios appearing to increase in later pregnancy. According to previous study, iron use exhibited a trend consistent with our findings, increasing as pregnancy advanced, with 7.9% in the first trimester, 23.6% in the second trimester, and 61.7% in the third trimester [13]. This trend aligns with the rising iron demands during pregnancy, as approximately 1000 mg of iron is required to support maternal and fetal needs. Hallberg [17] reported a total iron requirement of 1040 mg, accounting for 350 mg transferred to the fetus and placenta, 250 mg lost during delivery, 450 mg needed for increased maternal red blood cell mass, and 240 mg lost through basal iron losses. Clinical guidelines recommend 30 mg/day of iron from the second trimester [18], when iron needs increase, which may explain this pattern , suggesting that pregnant women are following physician recommendations based on clinical evidence.
The stratified analysis was performed using demographic variables that showed significance across trimesters, such as age and BMI during pregnancy, as well as parity, which is considered an important variable [13]. Our findings highlight the significant roles of age, BMI, and parity in vitamin supplement intake during pregnancy. p-value for interaction was statistically significant in calcium intake, indicating that older women consume more calcium than younger women in the third trimester. This may reflect a greater awareness of overall maternal nutrition among older pregnant women, as evidenced by their higher intake of dietary fiber, vegetables, and fruits during pregnancy [19]. Additionally, given the crucial role of calcium in supporting both maternal and fetal bone health, this heightened awareness may contribute to their increased calcium intake [19, 20]. The World Health Organization strongly recommends routine calcium supplementation to prevent preeclampsia [21] as well as gestational diabetes mellitus [22]. These facts may help explain the higher intake rate of calcium during pregnancy among older women, who are more vulnerable to negative pregnancy outcomes. However, no significant interaction effects were observed for parity or BMI across any supplement types, including calcium. In previous stratified study on parity, folic acid compliance was found to be negatively correlated with parity [23]. However, our stratified analysis of parity showed no significant results, highlighting the need for further investigation. This lack of significance may suggest that, beyond age, other unmeasured factors could be influencing supplement intake patterns during pregnancy. Potential unmeasured variables may include dietary habits, socioeconomic status, awareness of nutritional guidelines, or healthcare provider recommendations, which could play a role in shaping individual supplement consumption behaviors. Future research should explore these potential contributing factors to better understand the complex determinants of prenatal supplement intake.
The total number of supplements used varied by trimester, with the mean increasing from 2.92
There are several limitations in this study. First, the data were originally based on a study focusing on urinary incontinence, resulting in the exclusion of a majority of participants who did not have vitamin supplement data. Second, because vitamin supplement use was assessed exclusively through yes/no questions, the specific dosages and administration details were not taken into account. Consequently, we could not calculate the actual intake of supplements and food sources, making it impossible to compare with dietary recommendations. Moreover, as a cross-sectional study, causation cannot be inferred, and potential biases—such as selection bias and recall bias—may impact the results. The study was conducted on pregnant women who visited hospitals, which may not fully represent the broader population of pregnant women, especially those who have limited access to healthcare or do not attend medical facilities. This limitation should be addressed, as it may affect the generalizability of the findings to the broader population of pregnant women. Additionally, the generalizability of the findings may also be limited to Korean pregnant women due to specific cultural factors that influence dietary habits and supplement use. Future research should involve a larger population and include more comprehensive assessments. Also, a case-control study design instead of cross-sectional study could be considered as a future direction for research. This design could provide more robust evidence regarding the factors influencing vitamin supplements used during pregnancy, especially when comparing women with different pregnancy outcomes. Lastly, the investigation of vitamin supplement use prior to conception was not addressed in this study. Despite these limitations, this study remains meaningful for exploring trends in supplement use throughout pregnancy among Korean pregnant women. Its multicenter design enhances generalizability, providing useful information on the optimal use of supplements by trimester and serves as a worthy foundation for future research.
In conclusion, this study highlights the distinct patterns of vitamin supplement use among pregnant women in Republic of Korea, revealing a significant overall increase in supplement intake in the later stages of pregnancy. The findings demonstrate variations in supplementation based on maternal age, BMI, and parity, emphasizing the need for individualized nutritional strategies and regular assessments by healthcare providers to ensure optimal maternal and fetal health. Despite some limitations, this study provides a valuable foundation for future research and the development of tailored recommendations to optimize prenatal nutrition and pregnancy outcomes.
The data sets used and analyzed during the current study are available from the corresponding author on a reasonable request.
All authors contributed significantly to the study. HJH, KCC and EHH performed the research. HJH and EHH designed the research study. HJH and KCC contributed essential reagents or tools. HJH and EHH analyzed the data. HJH wrote the paper. EHH supervised the study. All authors contributed to editorial changes in the manuscript. All authors read and approved the final manuscript. All authors have participated sufficiently in the work and agreed to be accountable for all aspects of the work.
The study was approved by the Institutional Review Board (IRB) of Inje University Ilsan Paik Hospital (IRB No.: 2023-04-036-001). The study was conducted in accordance with the Declaration of Helsinki. Written consent was obtained from the study participants. The privacy and confidentiality of the study participants were maintained by excluding their names from the questionnaire and keeping their data in a secure place.
Not applicable.
This research received no external funding.
The authors declare no conflict of interest.
During the preparation of this work the authors used ChatGPT-3.5 in order to check spell and grammar. After using this tool, the authors reviewed and edited the content as needed and takes full responsibility for the content of the publication.
References
Publisher’s Note: IMR Press stays neutral with regard to jurisdictional claims in published maps and institutional affiliations.