

 , Xia Xu 1,2,3,4,5,†, Xiaoyan Xiu 1,2,3,4,5,†, Yi Xie 1,2,3,4,5, Huangchang Yi 1,2,3,4,5, Lianghui Zheng 1,2,3,4,5, Jianying Yan 1,2,3,4,5,*
1 Fujian Maternity and Child Health Hospital, 350001 Fuzhou, Fujian, China
2 College of Clinical Medicine for Obstetrics & Gynecology and Pediatrics, Fujian Medical University, 350001 Fuzhou, Fujian, China
3 Fujian Clinical Research Center for Maternal-Fetal Medicine, 350001 Fuzhou, Fujian, China
4 Laboratory of Maternal-Fetal Medicine, Fujian Maternity and Child Health Hospital, 350001 Fuzhou, Fujian, China
5 National Key Obstetric Clinical Specialty Construction Institution of China, 350001 Fuzhou, Fujian, China
†These authors contributed equally.
Abstract
This study aimed in this study was to investigate the association between poor sleep patterns (PSPs) and type 2 diabetes mellitus (T2DM) in women with a history of gestational diabetes mellitus (GDM).
Our analysis was based on a population-based sample from National Health and Nutrition Examination Survey (NHANES) data collected between 2007 and 2018. The association between PSPs and T2DM in women with a history of GDM was assessed using logistic regression models. We performed subgroup analyses stratified by age, body mass index (BMI), race, educational level, moderate recreational activities, smoking behavior, and parity.
A total of 917 women with a history of GDM were included in our study. Compared to the non-PSPs group, participants with PSPs had a higher possibility for T2DM in women with a history of GDM (odds ratio (OR) = 2.37, 95% confidence interval (CI): 1.45–3.86). Furthermore, this association was more prominent in those aged between 35 and 49 (OR = 2.20, 95% CI: 1.03–4.71), a BMI ≥30 kg/m2 (OR = 2.56, 95% CI: 1.43–4.60), non-Hispanic white (OR = 5.34, 95% CI: 2.09–13.66) or non-Hispanic black (OR = 5.02, 95% CI: 1.48–17.06), educated beyond high school (OR = 2.65, 95% CI: 1.35–5.23), not engaged in moderate recreational activities (OR = 3.25, 95% CI: 1.72–6.14) groups and parity ≥4 (OR = 2.62, 95% CI: 1.03–6.63).
Our findings suggest that PSPs are positively associated with the prevalence of T2DM in women with a history of GDM, which demonstrates that we need targeted interventions, especially for those at high risk. Future research should evaluate how sleep patterns affect metabolic health and develop new ways to lower the risk of T2DM in women with a history of GDM.
Keywords
- poor sleep pattern
- gestational diabetes mellitus
- type 2 diabetes mellitus
- women
- NHANES
Gestational diabetes mellitus (GDM), which refers to any degree of hyperglycemia
that occurs or is first detected during pregnancy, is a common pregnancy-related
condition that usually resolves by the end of pregnancy [1, 2, 3]. However, 5–10%
of women with GDM develop Type 2 Diabetes Mellitus (T2DM) in the first postpartum
year, and approximately 50% of women with GDM develop T2DM within 10 years of
childbirth [4]. A previous meta-analysis reported that women with GDM had an
approximately a 10-fold higher risk of developing T2DM compared to controls [5].
GDM and T2DM have similar pathophysiologies in that both are associated with
insulin resistance and impaired islet
The postpartum period is a state of instability, accompanied by mood swings, anxiety, insomnia, loss of appetite, and restlessness [8]. Postpartum issues are linked to neurobiological changes, which involve increased monoamine oxidase levels and decreased estrogen levels within the first week postpartum, as well as other behavioral issues. Many women experience poor sleep patterns after childbirth, with approximately 20.4% of mothers experiencing insomnia and 67.8% reporting poor sleep quality [9]. These problems can last for 6 months or longer after giving birth. A study has shown that 92.2% of new mothers struggle with poor sleep quality [10].
The relationship between poor sleep patterns (PSPs) and T2DM may manifest in different ways [11, 12]. T2DM can disrupt sleep state due to hypoglycemia or nocturnal symptoms such as nocturia, polyuria, diabetic neuropathy, and neuropathic pain [13, 14, 15]. PSPs may lead to glucose intolerance, insulin resistance and increased incidence of diabetes [16]. Owing to the prevalence of PSPs during pregnancy [17, 18, 19], and the crucial role of sleep state in the regulation of serum glucose levels [20, 21], the impact of maternal PSPs on T2DM is of particular concern.
The clinical assessment of progression to risk factors associated with T2DM in women with a history of GDM is helpful for the early prevention and management of subsequent T2DM. To our knowledge, no previous study has investigated the link between PSPs and progression to T2DM in women with a history of GDM. Therefore, we aimed to investigate the association between PSPs and T2DM in women with a history of GDM based on a nationally representative survey, to be able to identify and intervene before T2DM occurs. This has the potential to reduce the occurrence of T2DM, safeguard women health and also help to alleviate the growing global health burden of T2DM.
The study population consisted of participants from 7 National Health and Nutrition Examination Survey (NHANES) cycles, spanning from 2007–2018, a complex, stratified, multistage probability sample of the non-institutionalized US population. These cross-sectional surveys were conducted by the National Center for Health Statistics (NCHS). Methodological details and data collection relating to the NHANES are freely available and have been described completely in the literature. The study population was restricted to women over 20 years-of-age (n = 17,907) and excluded those without a history of GDM (n = 16,923). After excluding participants with unclear diabetes status (n = 42) and participants who were pregnant (n = 25), 917 participants were retained for final analysis (Fig. 1). Ethics approval for accessing NHANES data was granted by the National Center for Health Statistics Research Ethics Review Board in the United States and all methods were performed in accordance with the Strengthening the Reporting of Observational studies in Epidemiology (STROBE) guidelines. All individuals submitted written informed consent.
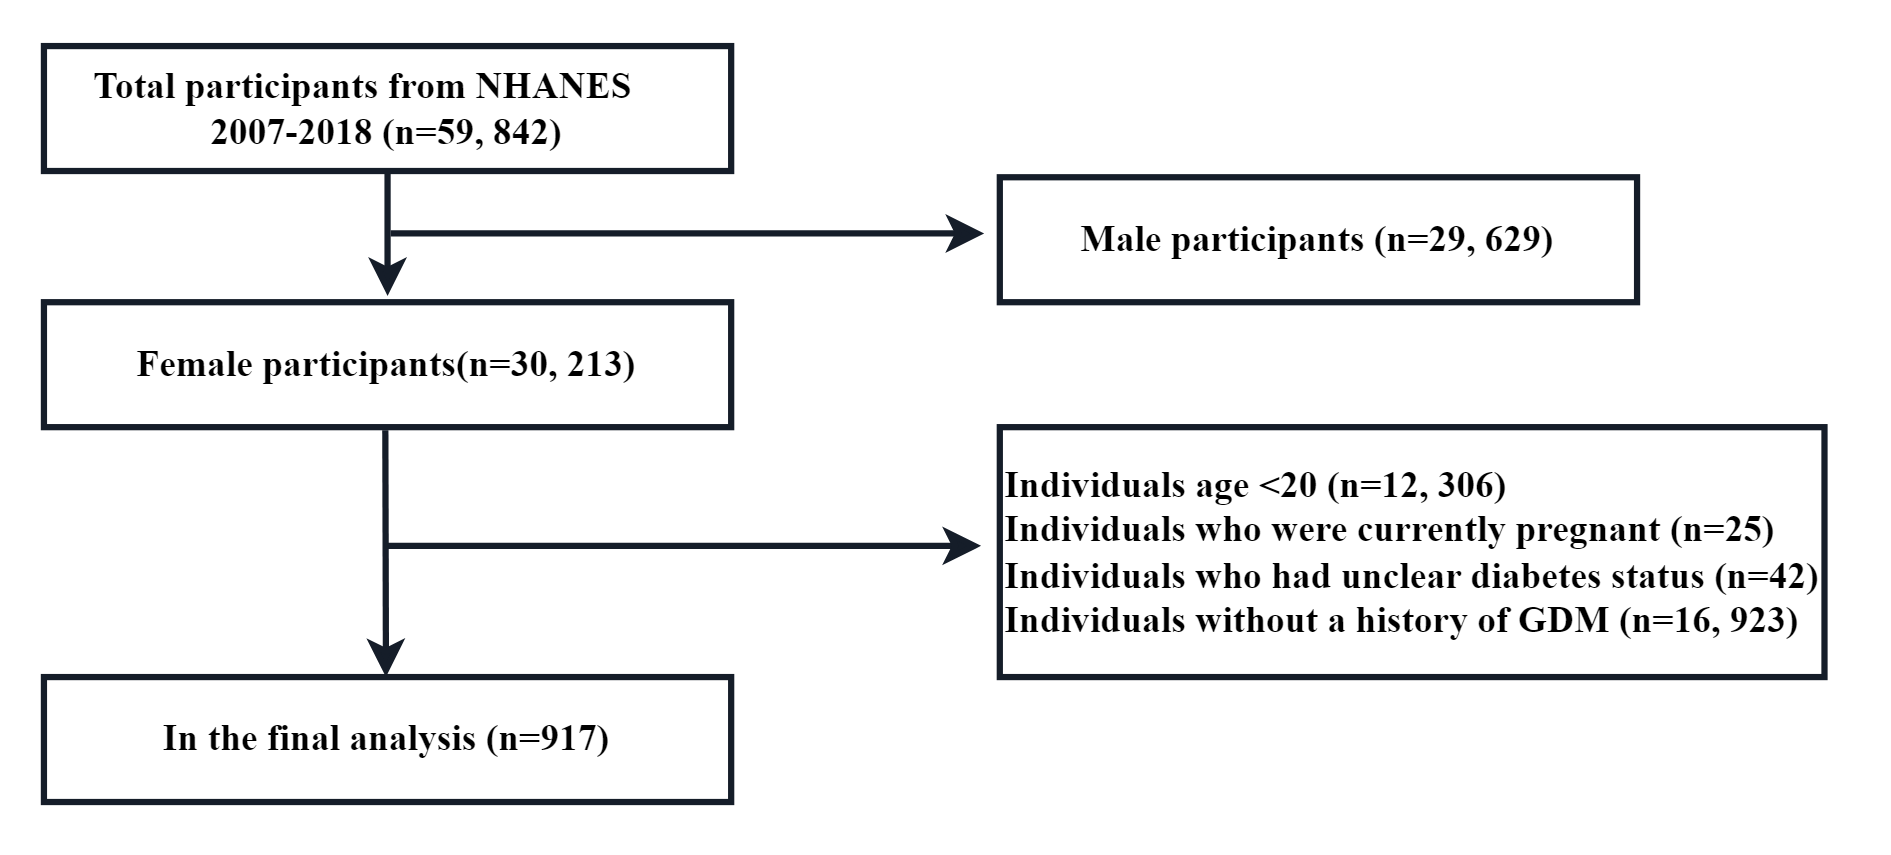 Fig. 1.
Flow chart of participants included in this study. NHANES, National Health and Nutrition Examination Survey; GDM, gestational diabetes mellitus.
The exposure variable was PSPs. Trained interviewers used a Computer-Assisted
Personal Interview system to obtain data from patients. The nighttime sleep
duration of each patient was obtained from their response to the question, “How
much sleep do you usually get at night on weekdays or workdays?” The nighttime
sleep duration was categorized as abnormal (
Data relating to age, gender, race, educational level, moderate recreational
activities, smoking behavior, parity and ratio of family income to poverty were
also obtained from the questionnaire. NHANES participants also attended mobile
examination centers where trained health technicians collected their physical
measurement data, such as body mass index (BMI) and waist circumference (WC) (WC
is an important indicator of central obesity, which differs from BMI). BMI was
calculated as weight in kilograms separated by height in meters squared. BMI was
classified as underweight (BMI:
The association between PSPs and T2DM in women with previous GDM was examined
using a multivariate logistic regression model. We constructed 3 distinct models:
model 1 was a non-adjusted model with no covariate adjusted; model 2 was a
minimally-adjusted model that adjusted only for age and race; and model 3 was a
fully-adjusted model that adjusted for age, race, WC, BMI, educational level,
moderate recreational activities, smoking at least 100 cigarettes in life,
parity, ratio of family income to poverty, as well as the serum levels of
albumin, blood urea nitrogen, creatinine, triglycerides, total cholesterol, uric
acid, glycohemoglobin, and glucose. In addition, we performed subgroup analyses,
stratified by age, BMI, race, educational level, moderate recreational
activities, smoking at least 100 cigarettes in life and parity, to make better
use of the data. Continuous variables are expressed as mean
The baseline characteristics of participants, according to T2DM status, are shown in Table 1. Of the 917 participants enrolled, 302 had a diagnosis of T2DM (mean age: 52 years), with the other 615 classified in the non T2DM group (mean age: 42 years). Compared with women without T2DM, women with T2DM were older and had higher serum levels of urea nitrogen, triglycerides, uric acid, hemoglobin, and glucose. These subjects also had a higher WC and BMI, a lower serum level of albumin and a lower ratio of family income to poverty.
| Variables | No-diabetes (n = 615) | Diabetes (n = 302) | p value | |
| Age (years) | 42.00 (34.00, 50.00) | 52.00 (43.00, 60.75) | ||
| BMI (kg/m2) | 29.95 (25.40, 35.10) | 33.52 (28.66, 37.80) | ||
| Waist circumference (cm) | 97.50 (88.10, 109.70) | 108.45 (97.55, 119.38) | ||
| Ratio of family income to poverty | 1.94 (1.12, 3.68) | 1.81 (0.93, 3.13) | 0.043* | |
| Race (%) | 0.004* | |||
| Mexican American | 137 (22.28%) | 67 (22.19%) | ||
| Non-Hispanic White | 237 (38.54%) | 83 (27.48%) | ||
| Non-Hispanic black | 104 (16.91%) | 69 (22.85%) | ||
| Other | 137 (22.28%) | 83 (27.48%) | ||
| Education level (%) | 0.002* | |||
| Less than high school | 137 (22.28%) | 97 (32.12%) | ||
| High school | 115 (18.70%) | 60 (19.87%) | ||
| More than high school | 363 (59.02%) | 145 (48.01%) | ||
| Moderate recreational activities (%) | 0.707 | |||
| Yes | 238 (38.70%) | 113 (37.42%) | ||
| No | 377 (61.30%) | 189 (62.58%) | ||
| Smoke at least 100 cigarettes in life (%) | 0.892 | |||
| Yes | 235 (38.21%) | 114 (37.75%) | ||
| No | 380 (61.79%) | 188 (62.25%) | ||
| Parity | ||||
| 475 (77.24%) | 200 (66.23%) | |||
| 140 (22.76%) | 102 (33.77%) | |||
| PSPs (%) | ||||
| Yes | 87 (14.15%) | 96 (31.79%) | ||
| No | 528 (85.85%) | 206 (68.21%) | ||
| Serum albumin (g/L) | 41.26 (39.39, 43.45) | 40.00 (38.00, 42.00) | ||
| Blood urea nitrogen (mg/dL) | 3.93 (3.21, 5.00) | 4.64 (3.57, 6.07) | ||
| Serum creatinine (µmol/L) | 61.88 (54.81, 70.72) | 62.76 (52.38, 76.02) | 0.124 | |
| Triglycerides (mmol/L) | 1.38 (0.93, 2.02) | 1.86 (1.31, 2.62) | ||
| Total cholesterol (mmol/L) | 4.99 (4.40, 5.59) | 4.94 (4.25, 5.66) | 0.849 | |
| Serum uric acid (µmol/L) | 285.50 (243.90, 327.10) | 298.53 (243.90, 356.90) | 0.006* | |
| Hemoglobin (%) | 5.50 (5.30, 5.90) | 7.15 (6.30, 8.30) | ||
| Serum glucose (mmol/L) | 5.16 (4.72, 5.66) | 7.33 (5.83, 10.29) | ||
Notes: BMI, body mass index; PSPs, poor sleep patterns. * indicates significant difference.
Table 2 shows the association between PSPs and T2DM in women with previous GDM for the 3 linear regression models. We found a positive association between PSPs and T2DM in women with previous GDM in all 3 models (Model 1: odds ratio (OR) = 2.83, 95% confidence interval (CI): 2.03–3.94, Model 2: OR = 2.92, 95% CI: 2.03–4.22, Model 3: OR = 2.37, 95% CI: 1.45–3.86).
| Variables | Non-adjusted model | Minimally-adjusted model | Fully-adjusted model |
| OR, 95% CI, p | OR, 95% CI, p | OR, 95% CI, p | |
| Non-PSPs | Reference | Reference | Reference |
| PSPs | 2.83 (2.03, 3.94), |
2.92 (2.03, 4.22), |
2.37 (1.45, 3.86), 0.0005* |
Notes: Non-adjusted model: no covariates were adjusted. Minimally-adjusted model: age and race were adjusted. Fully-adjusted model: age, BMI, waist circumference, ratio of family income to poverty, race, education level, moderate recreational activities, smoke at least 100 cigarettes in life, parity, serum albumin, blood urea nitrogen, serum creatinine, triglycerides, total cholesterol, serum uric acid, glycohemoglobin and serum glucose were adjusted. T2DM, Type 2 Diabetes Mellitus; GDM, gestational diabetes mellitus; OR, Odds Ratio; 95% CI, 95% Confidence Interval. * indicates significant difference.
When stratifying by age at 35 years, subgroup analysis shows that subjects aged 35 to 49 years who developed PSPs (OR = 2.20, 95% CI: 1.03–4.71) were more likely to develop T2DM compared to those who did not develop PSPs (Table 3).
| Variables | Non-adjusted model | Minimally-adjusted model | Fully-adjusted model | |
| OR, 95% CI, p | OR, 95% CI, p | OR, 95% CI, p | ||
| 20 |
||||
| Non-PSPs | Reference | Reference | Reference | |
| PSPs | 1.22 (0.38–3.94), 0.735 | 1.36 (0.41–4.50), 0.611 | 0.57 (0.07–4.57), 0.593 | |
| 35 |
||||
| Non-PSPs | Reference | Reference | Reference | |
| PSPs | 2.54 (1.47–4.36), |
2.92 (1.66–5.14), |
2.20 (1.03–4.71), 0.042* | |
Notes: Non-adjusted model: no covariates were adjusted. Minimally-adjusted model: race were adjusted. Fully-adjusted model: BMI, waist circumference, ratio of family income to poverty, race, education level, moderate recreational activities, smoke at least 100 cigarettes in life, parity, serum albumin, blood urea nitrogen, serum creatinine, triglycerides, total cholesterol, serum uric acid, glycohemoglobin and serum glucose were adjusted. * indicates significant difference.
When stratified by BMI, subgroup analysis showed that subjects with PSPs and with
BMI
| Variables | Non-adjusted model | Minimally-adjusted model | Fully-adjusted model | |
| OR, 95% CI, p | OR, 95% CI, p | OR, 95% CI, p | ||
| Non-PSPs | Reference | Reference | Reference | |
| PSPs | 1.48 (0.44, 4.95), 0.5230 | 1.85 (0.45, 7.57), 0.3903 | 3.75 (0.38, 37.20), 0.2582 | |
| Non-PSPs | Reference | Reference | Reference | |
| PSPs | 1.43 (0.69, 2.98), 0.3380 | 1.37 (0.61, 3.06), 0.4495 | 0.81 (0.21, 3.14), 0.7612 | |
| Non-PSPs | Reference | Reference | Reference | |
| PSPs | 3.28 (2.16, 4.99), |
3.31 (2.09, 5.25), |
2.56 (1.43, 4.60), 0.0016* | |
Notes: Non-adjusted model: no covariates were adjusted. Minimally-adjusted model: age and race were adjusted. Fully-adjusted model: age, waist circumference, ratio of family income to poverty, race, education level, moderate recreational activities, smoke at least 100 cigarettes in life, parity, serum albumin, blood urea nitrogen, serum creatinine, triglycerides, total cholesterol, serum uric acid, glycohemoglobin and serum glucose were adjusted. * indicates significant difference.
When stratified by race, subgroup analysis showed that subjects with PSPs who were non-Hispanic white (OR = 5.34, 95% CI: 2.09–13.66) and non-Hispanic black (OR = 5.02, 95% CI: 1.48–17.06) groups were more likely to develop T2DM than those without PSPs (Table 5).
| Variables | Non-adjusted model | Minimally-adjusted model | Fully-adjusted model | |
| OR, 95% CI, p | OR, 95% CI, p | OR, 95% CI, p | ||
| Mexican American | ||||
| Non-PSPs | Reference | Reference | Reference | |
| PSPs | 1.29 (0.51, 3.29), 0.5892 | 1.03 (0.38, 2.79), 0.9487 | 0.94 (0.21, 4.12), 0.9293 | |
| Non-Hispanic White | ||||
| Non-PSPs | Reference | Reference | Reference | |
| PSPs | 3.77 (2.17, 6.55), |
4.14 (2.29, 7.49), |
5.34 (2.09, 13.66), 0.0005* | |
| Non-Hispanic Black | ||||
| Non-PSPs | Reference | Reference | Reference | |
| PSPs | 4.66 (2.23, 9.76), |
4.26 (1.94, 9.35), 0.0003* | 5.02 (1.48, 17.06), 0.0096* | |
| Other | ||||
| Non-PSPs | Reference | Reference | Reference | |
| PSPs | 2.24 (1.14, 4.41), 0.0191* | 2.17 (1.01, 4.68), 0.0475* | 2.04 (0.65, 6.42), 0.2231 | |
Notes: Non-adjusted model: no covariates were adjusted. Minimally-adjusted model: age were adjusted. Fully-adjusted model: age, BMI, waist circumference, ratio of family income to poverty, education level, moderate recreational activities, smoke at least 100 cigarettes in life, parity, serum albumin, blood urea nitrogen, serum creatinine, triglycerides, total cholesterol, serum uric acid, glycohemoglobin and serum glucose were adjusted. * indicates significant difference.
When stratified by educational level, subgroup analysis showed that subjects with PSPs and an educational level that was more than high school (OR = 2.65, 95% CI: 1.35–5.23) were more likely to develop T2DM than those without PSPs (Table 6).
| Variables | Non-adjusted model | Minimally-adjusted model | Fully-adjusted model | |
| OR, 95% CI, p | OR, 95% CI, p | OR, 95% CI, p | ||
| Less than high school | ||||
| Non-PSPs | Reference | Reference | Reference | |
| PSPs | 2.14 (1.11, 4.12), 0.0223* | 2.41 (1.11, 5.24), 0.0257* | 2.22 (0.82, 6.02), 0.1189 | |
| High school | ||||
| Non-PSPs | Reference | Reference | Reference | |
| PSPs | 3.12 (1.51, 6.46), 0.0022* | 2.99 (1.33, 6.75), 0.0083* | 1.89 (0.49, 7.28), 0.3547 | |
| More than high school | ||||
| Non-PSPs | Reference | Reference | Reference | |
| PSPs | 3.17 (2.00, 5.02), |
2.94 (1.80, 4.82), |
2.65 (1.35, 5.23), 0.0048* | |
Notes: Non-adjusted model: no covariates were adjusted. Minimally-adjusted model: age and race were adjusted. Fully-adjusted model: age, BMI, waist circumference, ratio of family income to poverty, race, moderate recreational activities, smoke at least 100 cigarettes in life, parity, serum albumin, blood urea nitrogen, serum creatinine, triglycerides, total cholesterol, serum uric acid, glycohemoglobin and serum glucose were adjusted. * indicates significant difference.
When stratified by moderate recreational activities, subgroup analysis showed that subjects with PSPs who did not engage in moderate recreational activities (OR = 3.25, 95% CI: 1.72–6.14) were more likely to develop T2DM than those without PSPs (Table 7).
| Variables | Non-adjusted model | Minimally-adjusted model | Fully-adjusted model | |
| OR, 95% CI, p | OR, 95% CI, p | OR, 95% CI, p | ||
| Yes | ||||
| Non-PSPs | Reference | Reference | Reference | |
| PSPs | 2.31 (1.35, 3.97), 0.0023* | 2.34 (1.29, 4.24), 0.0051* | 1.48 (0.62, 3.52), 0.3814 | |
| No | ||||
| Non-PSPs | Reference | Reference | Reference | |
| PSPs | 3.20 (2.09, 4.88), |
3.47 (2.16, 5.57), |
3.25 (1.72, 6.14), 0.0003* | |
Notes: Non-adjusted model: no covariates were adjusted; Minimally-adjusted model: age and race were adjusted; Fully-adjusted model: age, BMI, waist circumference, ratio of family income to poverty, race, education level, smoke at least 100 cigarettes in life, parity, serum albumin, blood urea nitrogen, serum creatinine, triglycerides, total cholesterol, serum uric acid, glycohemoglobin and serum glucose were adjusted. * indicates significant difference.
When stratified by parity, subgroup analysis showed that subjects with PSPs and
with parity
| Variables | Non-adjusted model | Minimally-adjusted model | Fully-adjusted model | |
| OR, 95% CI, p | OR, 95% CI, p | OR, 95% CI, p | ||
| Non-PSPs | Reference | Reference | Reference | |
| PSPs | 2.98 (1.99, 4.46), |
3.02 (1.94, 4.69), |
2.26 (1.23, 4.16), 0.0088* | |
| Non-PSPs | Reference | Reference | Reference | |
| PSPs | 2.29 (1.27, 4.13), 0.0059* | 2.56 (1.31, 5.00), 0.0061* | 2.62 (1.03, 6.63), 0.0426* | |
Notes: Non-adjusted model: no covariates were adjusted. Minimally-adjusted model: age and race were adjusted. Fully-adjusted model: age, BMI, waist circumference, ratio of family income to poverty, race, education level, moderate recreational activities, smoke at least 100 cigarettes in life, serum albumin, blood urea nitrogen, serum creatinine, triglycerides, total cholesterol, serum uric acid, glycohemoglobin and serum glucose were adjusted. * indicates significant difference.
In this study, we evaluated the association between PSPs and T2DM in women with
previous GDM and found that PSPs was associated with a significantly higher
prevalence of T2DM in women with previous GDM. Furthermore, this association was
more prominent in those aged 35 to 49 years, a BMI
GDM predicted a significant increase in the incidence of subsequent T2DM [6], and women with a history of GDM had a 10-fold higher risk of developing T2DM when compared to women with normal serum levels of glucose, thus suggesting the importance of early intervention to avert the development of T2DM [22]. There are numerous risk factors for GDM to progress to T2DM, including fasting blood glucose levels, BMI, age, ethnicity, family history of diabetes, high blood pressure, and the use of insulin during pregnancy [23, 24]. However, to our knowledge, no previous study has investigated the relationship between PSPs and T2DM in women with a history of GDM. The results of this study revealed a positive association between PSPs and the progression of GDM to T2DM. This is consistent with previous studies that reported that poor sleep quality was associated with diabetes risk, prediabetes, and T2DM [7]. A systematic review and meta-analysis found that sleep restriction significantly reduces insulin sensitivity, and this effect is noticeable in a short period of time [25]. The stress after sleep restriction may activate the sympathetic nervous system, which raises levels of catecholamines and growth hormone, which causes increased lipolysis and decreased insulin sensitivity in the liver and periphery. Lipolysis increases levels of non-esterified fatty acids and free fatty acids, which lowers insulin sensitivity in the liver and reduces glucose uptake in the periphery. Lack of sleep can also lead to higher cortisol levels [26], and high levels of cortisol can inhibit the action of insulin, causing insulin resistance [27]. When stressed, the body taps into its glycogen reserves, which raises blood sugar levels, making the body produce even more insulin, creating a cycle that is difficult to break. However, other views have been reported. One cross-sectional study by Vézina-Im et al. [28] suggested that sleep quality was not significantly correlated with the 2-hour oral glucose tolerance test (OGTT). The discrepancy in these results may be due to differences in the ways in which PSPs was evaluated. Vézina-Im et al. [28] combined answers to questions relating to sleep latency, sleep disorders, and daytime dysfunction to obtain a composite score for sleep quality which was based on self-reported responses.
In our study, we identified differences in age, race, BMI, educational level,
moderate recreational activities and parity between PSPs and T2DM in women with a
history of GDM. With regards to racial disparities, one previous study reported
that black Americans with short sleep times had a higher risk of diabetes than
white Americans [29]. Similarly, in our study, the association between PSPs and
T2DM in women with a history of GDM was significant for some races, including
non-Hispanic White and non-Hispanic Black. Age is an important biological and
sociological factor. A systematic review and meta-analysis involving 2,847,596
women found that the older the women, the higher the risk of developing T2DM
after GDM [5]. Additionally, a retrospective cohort study from Korea [23], which
included 419,101 women with GDM, showed that compared to patients
As a basic physiological activity, sleep accounts for about one-third of all human life, and widely affects various health and disease conditions, especially endocrine-related diseases, by regulating the body’s neuroendocrine and immune functions [36]. One study showed that an hour of sleep deprivation can lead to a 4% increase in overall glucose levels [37]. Human nocturnal sleep is characterized by a rapid downregulation of the hypothalamic-pituitary-adrenal (HPA) axis, accompanied by a reduction in the levels of epinephrine, norepinephrine, and cortisol [38]. The HPA axis is also a very critical feedback regulation system in the body and is involved in the regulation of serum glucose metabolism [39]. Arousal and insomnia activate the HPA axis and can produce glucocorticoids that lead to metabolic disorders that may induce elevated serum levels of glucose [40, 41]. Therefore, PSPs are a major factor affecting serum glucose metabolism and can also affect T2DM. It is extremely important for pregnant women to return to normal blood glucose metabolism after delivery. Therefore, improving PSPs in patients with a history of GDM is thought to be beneficial. However, this conclusion needs to be validated in larger studies.
The most significant strength of this study is that we included representative samples of a multi-racial population which has better generalizability of the US population. Furthermore, the large sample size allowed us to conduct further subgroup analyses to adjust for many potential confounders. However, the limitations of our study also need to be acknowledged. First, because this was a cross-sectional study, it is not possible to account for the causal relationship between PSPs and T2DM in women with a history of GDM. Longitudinal studies are now required to investigate the causality between these factors. Second, PSPs are based on patient self-reporting which may lead to bias. Third, deviations caused by other potential confounding factors were not precluded. For example, because the NHANES database from 2007 to 2010 lacked information relating to a family history of diabetes, we did not adjust for this potential confounding factor in this study.
In summary, our findings suggest that PSPs are positively associated with the
prevalence of T2DM in women with a history of GDM which was more prominent for
those aged 35 to 49 years, a BMI
The datasets used and/or analyzed during the current study are available from the corresponding author on reasonable request.
YZZ, XX and JYY designed the research study. YZZ and XYX performed the research. YX and HCY provided help and advice on data curation. YZZ and LHZ analyzed the data. All authors contributed to editorial changes in the manuscript. All authors read and approved the final manuscript. All authors have participated sufficiently in the work and agreed to be accountable for all aspects of the work.
The NHANES interview includes demographic, socioeconomic, dietary, and health-related questions. The NCHS research ethics review board (ERB) approved the NHANES study protocol, and participants provided written informed consent at enrollment. The NCHS IRB/ERB protocol numbers of 2007–2020 National Health and Nutrition Survey are ‘#2005-06’, ‘#2011-17’ and ‘#2018-01’ (the website is https://www.cdc.gov/nchs/nhanes/about/erb.html?CDC_AAref_Val=https://www.cdc.gov/nchs/nhanes/irba98.htm). Since this study was based on publicly available deidentified data and informed consent was waived, ethical approval and consent were not required.
The authors thank the staff and the participants of the NHANES study for their valuable contributions.
This work was supported by the Joint Funds for the innovation of science and Technology, Fujian province (2020Y9134), Fujian Provincial Health Technology Project (2020GGA021/2024ZD01005), National Key Clinical Specialty Construction Program of China (Obstetric) and Fujian Provincial Natural Science Foundation of China (2024Y0035).
The authors declare no conflict of interest.
References
Publisher’s Note: IMR Press stays neutral with regard to jurisdictional claims in published maps and institutional affiliations.