


 , Jiulong Dai 1, Jiami Li 2, Man Lu 1,*
1 Department of Ultrasound Medical Center, Sichuan Clinical Research Center for Cancer, Sichuan Cancer Hospital & Institute, Sichuan Cancer Center, Affiliated Cancer Hospital of University of Electronic Science and Technology of China, 610000 Chengdu, Sichuan, China
2 School of Medical Imaging, North Sichuan Medical College, 637000 Nanchong, Sichuan, China
Abstract
Accurate assessment of lymph node involvement is essential for prognosis and guiding treatment decisions in gynecological cancers, as it directly influences therapeutic strategies and patient outcomes. However, conventional imaging techniques, such as ultrasound and computed tomography (CT), demonstrate limited accuracy in determining the nature of lymph nodes. This study implements three-dimensional shear wave elastography (3D-SWE), an innovative technique that quantifies the stiffness of inguinal lymph nodes (ILN) in patients with gynecological cancers. This approach offers a more comprehensive assessment of ultrasound elastography compared to traditional methods.
This retrospective study evaluated 120 ILNs from patients with gynecological cancers who underwent conventional ultrasound (US), two-dimensional shear wave elastography (2D-SWE), and multiplanar 3D-SWE. The diagnostic performance was analyzed using receiver operating characteristic (ROC) methodology, enabling a comprehensive comparison of the sensitivity and specificity of 3D-SWE relative to conventional ultrasound and 2D-SWE. Pathology results from lymph node resections or biopsies served as the reference standard.
Final pathology confirmed 65 metastatic and 55 benign lymph nodes. The maximum (Emax) and average (Emean) elasticity values from 2D-SWE and 3D-SWE for malignant lymph nodes were significantly higher than those for benign lymph nodes (p < 0.0001). ROC analysis indicated that for identifying metastatic lymph nodes, the area under the curve (AUC) values were 0.798 for 2D-SWE Emax, and 0.828, 0.839, and 0.816 for the transverse, sagittal, and coronal planes of 3D-SWE Emax, respectively. The differences between these AUC values were not statistically significant (p > 0.05). Furthermore, Emax values consistently surpassed Emean values in terms of characterization accuracy across modalities. Although no significant differences were observed between 2D-SWE and 3D-SWE, the sagittal view Emax yielded the best AUC, indicating optimal diagnostic precision overall.
3D-SWE, particularly using the sagittal Emax parameter, effectively distinguishes benign lymph nodes from metastatic ones by quantitatively evaluating the stiffness of ILNs in relation to gynecological tumors. Serving as a dependable diagnostic method for lymph nodes, 3D-SWE may help reduce the necessity for invasive biopsy procedures in some cases.
Keywords
- two-dimensional shear wave elastography
- three-dimensional shear wave elastography
- ultrasonography
- shear wave elastography
- elasticity imaging techniques
- gynecologic neoplasms
- lymphatic metastasis
Gynecological cancers pose a significant threat to women’s health globally [1]. Cervical cancer ranks as the fourth most prevalent cancer among women [2, 3]. Furthermore, the age-standardized incidence and mortality rates of endometrial cancer continue to rise [4, 5, 6]. Ovarian cancer remains a leading cause of gynecological cancer-related mortality, frequently diagnosed at an advanced stage [7, 8]. Additionally, there has been a consistent increase in the incidence of vulvar intraepithelial neoplasia and vulvar cancer among older women [9, 10]. The inguinal lymph nodes (ILN) serve as critical sites for metastasis in vulvar and ovarian cancers, and they may also be involved in the rare metastatic spread of endometrial cancer via the round ligament [11]. For these gynecological malignancies, precise evaluation of ILN status is essential for accurate staging, prognostication, and for guiding optimal treatment strategies, including lymphadenectomy and adjuvant therapy [10, 11, 12]. Consequently, there is an urgent need for accurate, non-invasive imaging diagnostic tools to assess ILN metastasis.
Conventional imaging techniques such as ultrasonography, computed tomography (CT), and positron emission tomography-CT have been extensively employed to evaluate lymph nodes [13, 14, 15]. However, the reliance of these modalities on morphological characteristics, alone may restrict diagnostic accuracy and overlook critical mechanical properties, such as stiffness and deformability, which are crucial for distinguishing malignancy. Elastography, as an advanced ultrasound technique, has been effectively utilized to characterize the elastic properties of organs and tissues across various disease states, including cancer [16, 17, 18, 19, 20, 21, 22], demonstrating its potential to reduce unnecessary biopsies in suspected malignancies [23, 24, 25] and predict prognosis in certain cancer types [26, 27, 28, 29]. Numerous clinical studies have highlighted the efficacy of two-dimensional (2D) elastography in differentiating between benign and malignant tumors [30, 31, 32, 33, 34, 35], including the distinction between benign and metastatic lymph nodes [36, 37, 38]. However, conventional 2D elastography is confined to a single imaging plane, which is inadequate for assessing the complex three-dimensional spatial heterogeneity in tissue stiffness that is characteristic of metastatic lymph nodes. Three-dimensional shear wave elastography (3D-SWE) addresses this limitation by acquiring consecutive 2D images for three-dimensional (3D) reconstruction, thereby facilitating a comprehensive, volumetric quantification of elastic distribution within tissues, potentially improving diagnostic accuracy and characterization of lymph nodes [39, 40, 41, 42, 43]. Nonetheless, the application of 3D-SWE to evaluate ILN has yet to be explored. This study investigates the use of 3D-SWE for the assessment of ILN in gynecological cancers, positing that this approach may enhance diagnostic accuracy. The findings could establish 3D-SWE as a reliable method for assessing metastasis in ILN, thereby informing patient management.
This retrospective study was conducted from January to August in 2017, enrolling 134 patients with gynecological cancer. The study adhered to the ethical standards outlined in the Helsinki Declaration and received approval from the institutional review board. Informed consent was obtained from all patients prior to their inclusion in the study.
The inclusion criteria were as follows: (a) ILN histopathological confirmed as benign or metastatic disease through surgical excision or ultrasound-guided core needle biopsy; (b) completion of pathological examination and diagnosis within two weeks following lymph node ultrasound; and (c) absence of diffuse systemic diseases such as lymphoma, leukemia, or other hematological malignancies.
The exclusion criteria included: (a) lymph nodes lacking adequate histological
results from surgical excision or core needle biopsy within the specified
timeframe; (b) patients lost to follow-up or with cytology findings classified as
‘indeterminate’ or ‘uncertain’ without subsequent histological examination; (c)
prior history of ILN surgery, treatment, or invasive diagnostic procedures; (d)
failure to obtain informed consent; (e) inability to perform shear wave
elastography (SWE) measurements due to breath-holding difficulties or vascular
pulsation artifacts; and (f) significant or coarse calcification (diameter
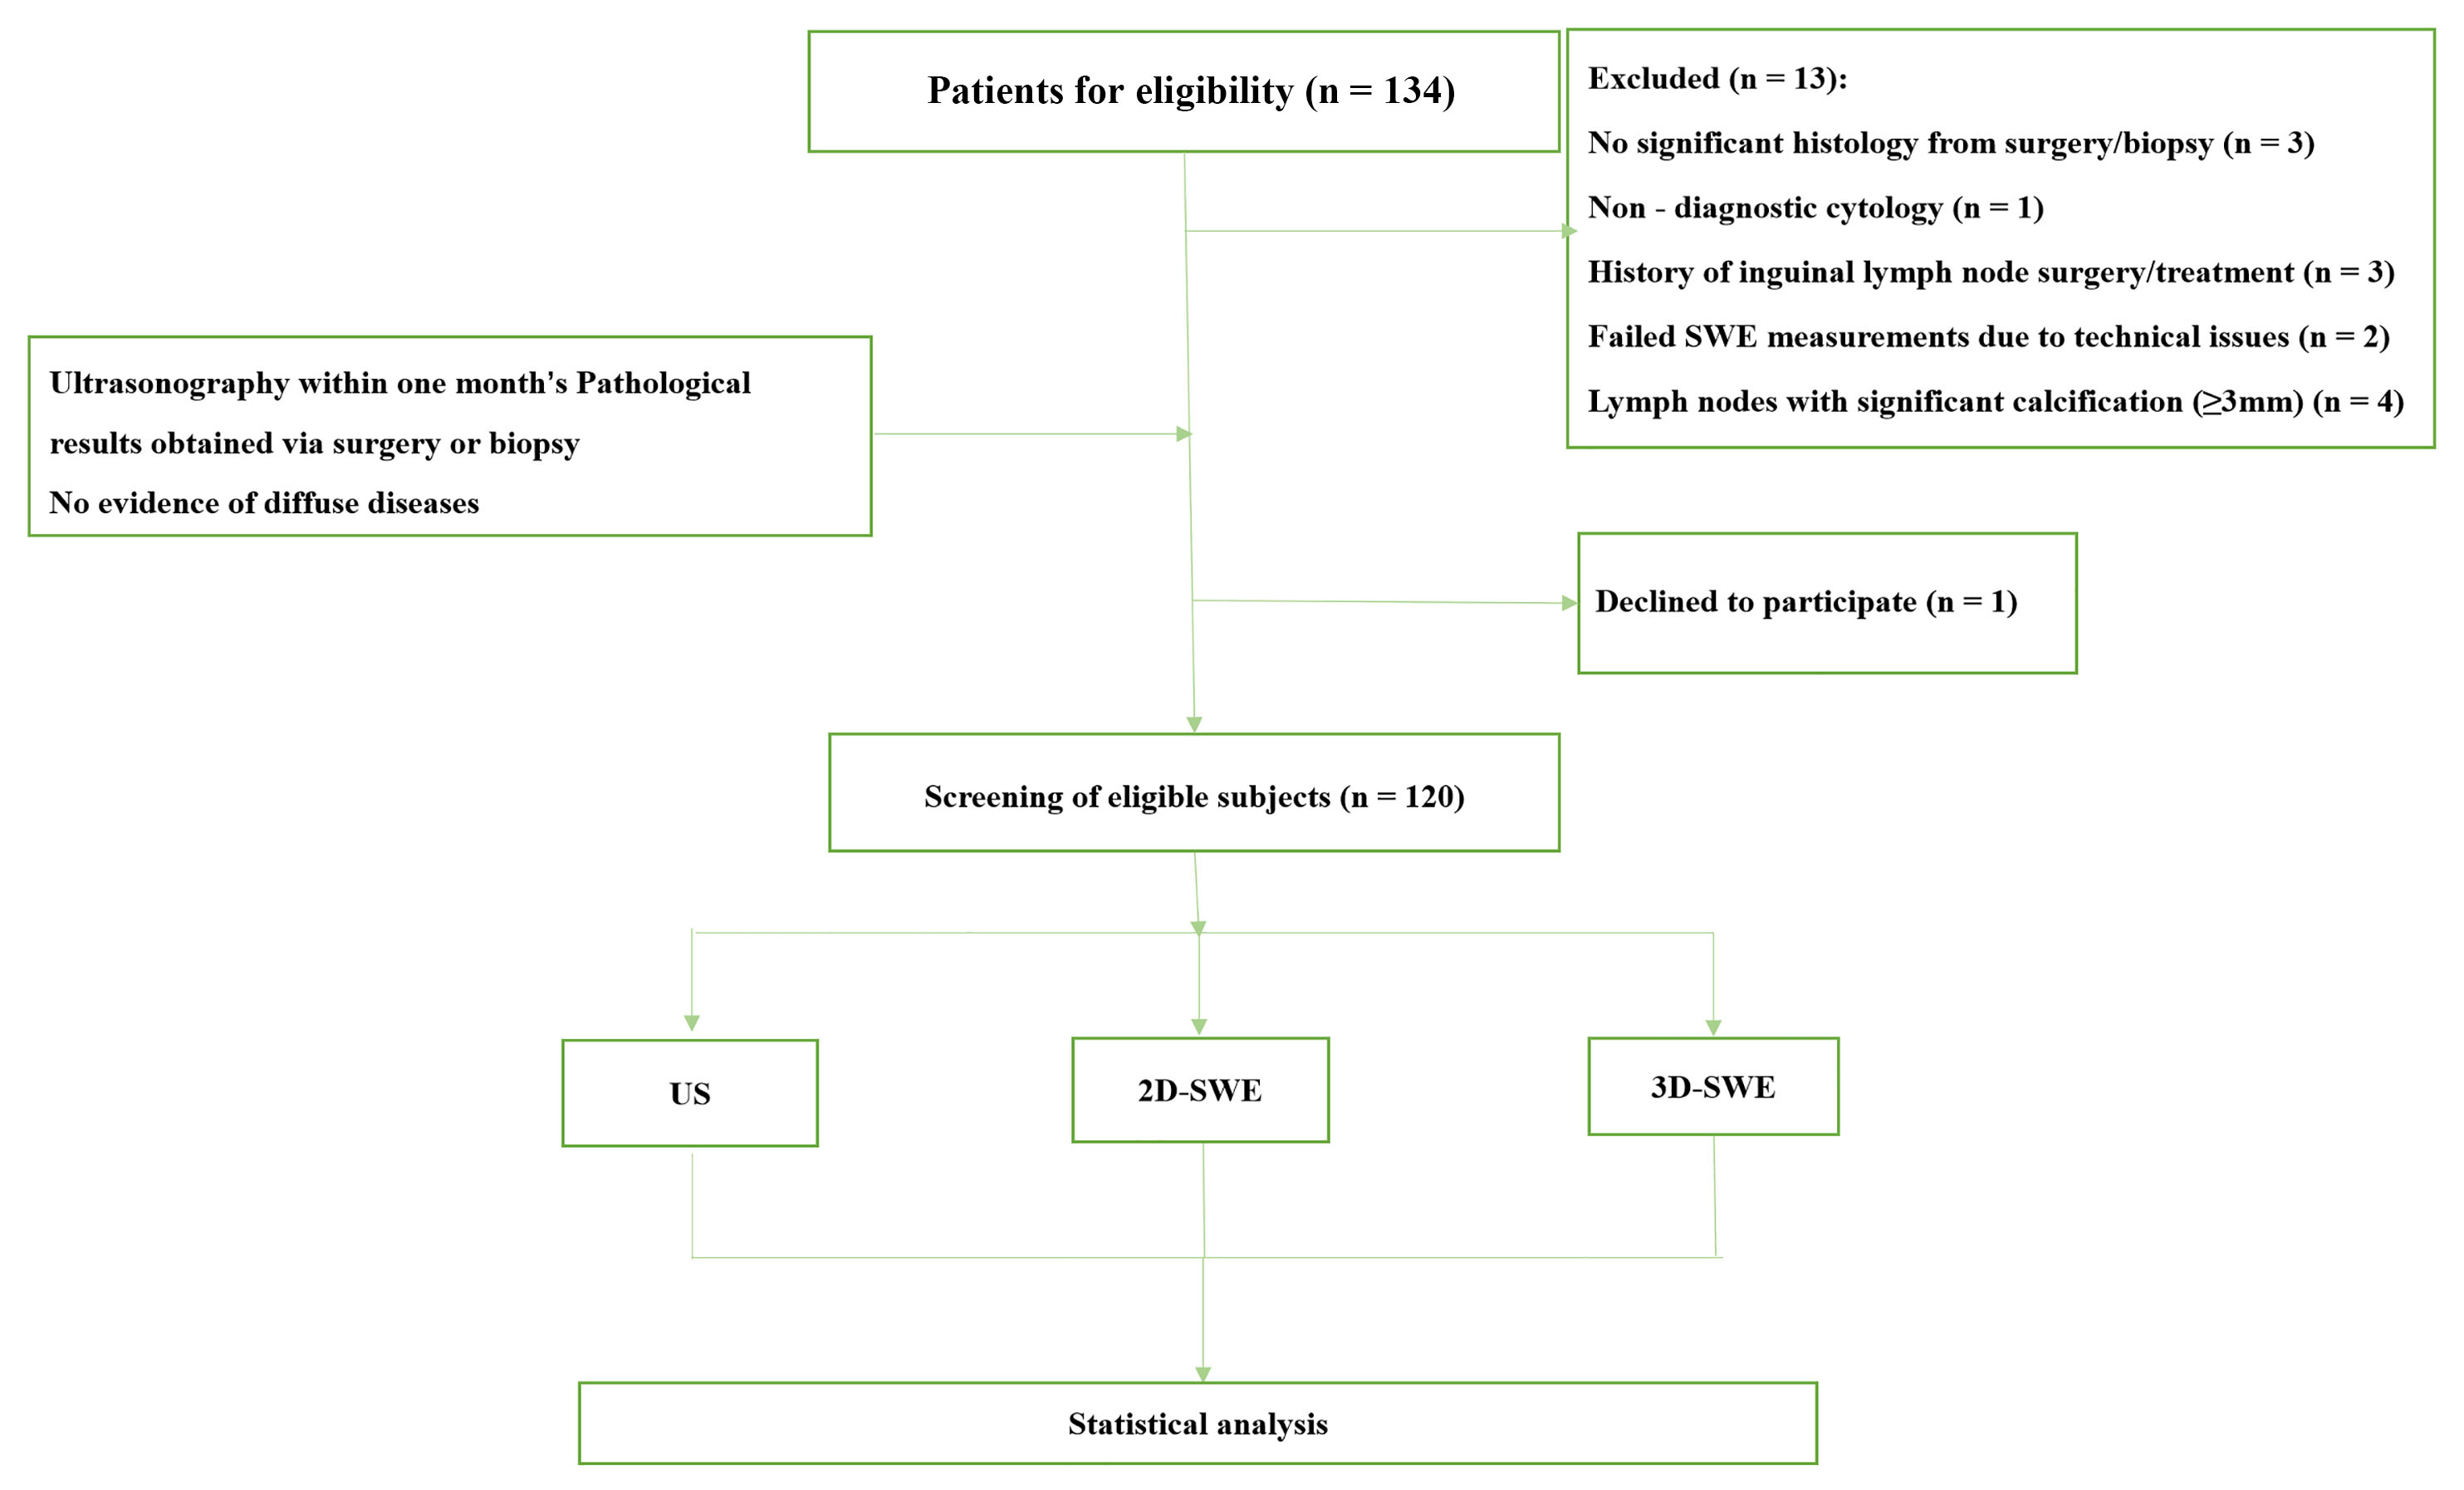 Fig. 1.
Patient flow diagram. SWE, shear wave elastography; US, ultrasound; 2D-SWE, two-dimensional shear wave elastography; 3D-SWE, three-dimensional shear wave elastography.
All patients were imaged using an AixPlorer ultrasound system (SuperSonic Imagine, Aix-en-Provence, France) in US, two-dimensional shear wave elastography (2D-SWE), and 3D-SWE imaging modes. Initially, a 4–15 MHz linear array transducer was used to acquire US images. Patients were positioned supine with their inguinal regions exposed for imaging, while two sonographers, Y.S. and J.D., each with over 10 years of experience, conducted comprehensive scans of the ILN. During the scanning process, the morphological characteristics of the lymph nodes—including size, internal echogenicity, cortical thickening, hilar appearance, and vascularity—were evaluated independently, with the sonographers blinded to the pathological diagnosis. Lymph node metastasis was suspected based on the presence of features including microcalcification, cystic changes, diffuse or focal hyperechogenicity, a longitudinal-to-transverse diameter ratio of less than 2, peripheral or mixed vascularity, irregular margins, or loss of the fatty hilum.
A 5–14 MHz linear probe was utilized to assess the lymph node. During the procedure, the ultrasound physician (Y.S. or J.D.) applied ultrasound gel and gently placed the transducer on the skin surface overlying the ILN. The patient was instructed to momentarily hold their breath while the sampling box was adjusted to encompass the entire structure. After stabilizing the image for 3 to 5 seconds, SWE was performed. For quantitative analysis, a 2 mm region of interest (ROI) was designated at the stiffest part of the lymph node, while avoiding calcified and liquefied regions. The Q-Box system (SuperSonic Imagine, Aix-en-Provence, France) subsequently calculated the maximum (Emax) and average (Emean) elasticity values in kilopascals (kPa) by averaging three measurements.
During the 3D-SWE examination, a 5–16 MHz volume transducer was utilized by two experienced ultrasound physicians (Y.S. and J.D.). The procedure commenced with appropriate patient preparation including positioning the patient in a supine position with the neck slightly extended. An adequate amount of ultrasound gel was applied to facilitate optimal acoustic coupling. The examination procedure mirrored that of 2D-SWE. The transducer was gently positioned over the targeted lymph node, and the sampling frame was meticulously adjusted to encompass the entire lymph node within the view. Once the appropriate settings were confirmed, including optimal depth and gain adjustments for clear visualization, the 3D-SWE mode was activated. At this stage, the transducer was held steady, and the patient was instructed to hold their breath for 3–5 seconds while the 3D image was captured to minimize motion artifacts. For quantitative analysis, the captured 3D volume was reviewed layer by layer using a tri-plane orthogonal schematic (transverse, sagittal, and coronal planes), enabling a comprehensive examination of various cross-sections of the lymph node. High-quality images that accurately represented the lesion were selected for further analysis. A 2 mm ROI was subsequently designated in the most rigid part of the node, ensuring that the measurements reflected the most relevant tissue characteristics. Data collection was conducted using the Q-Box system, which facilitated the measurement of Emax and Emean values in kilopascals (kPa). Three measurements were taken from the designated ROI to derive an average value for each parameter, thereby ensuring consistency and reliability in the results. This approach aimed to enhance the accuracy of the 3D-SWE assessments and support subsequent analysis of metastatic involvement in the lymph nodes (Fig. 2).
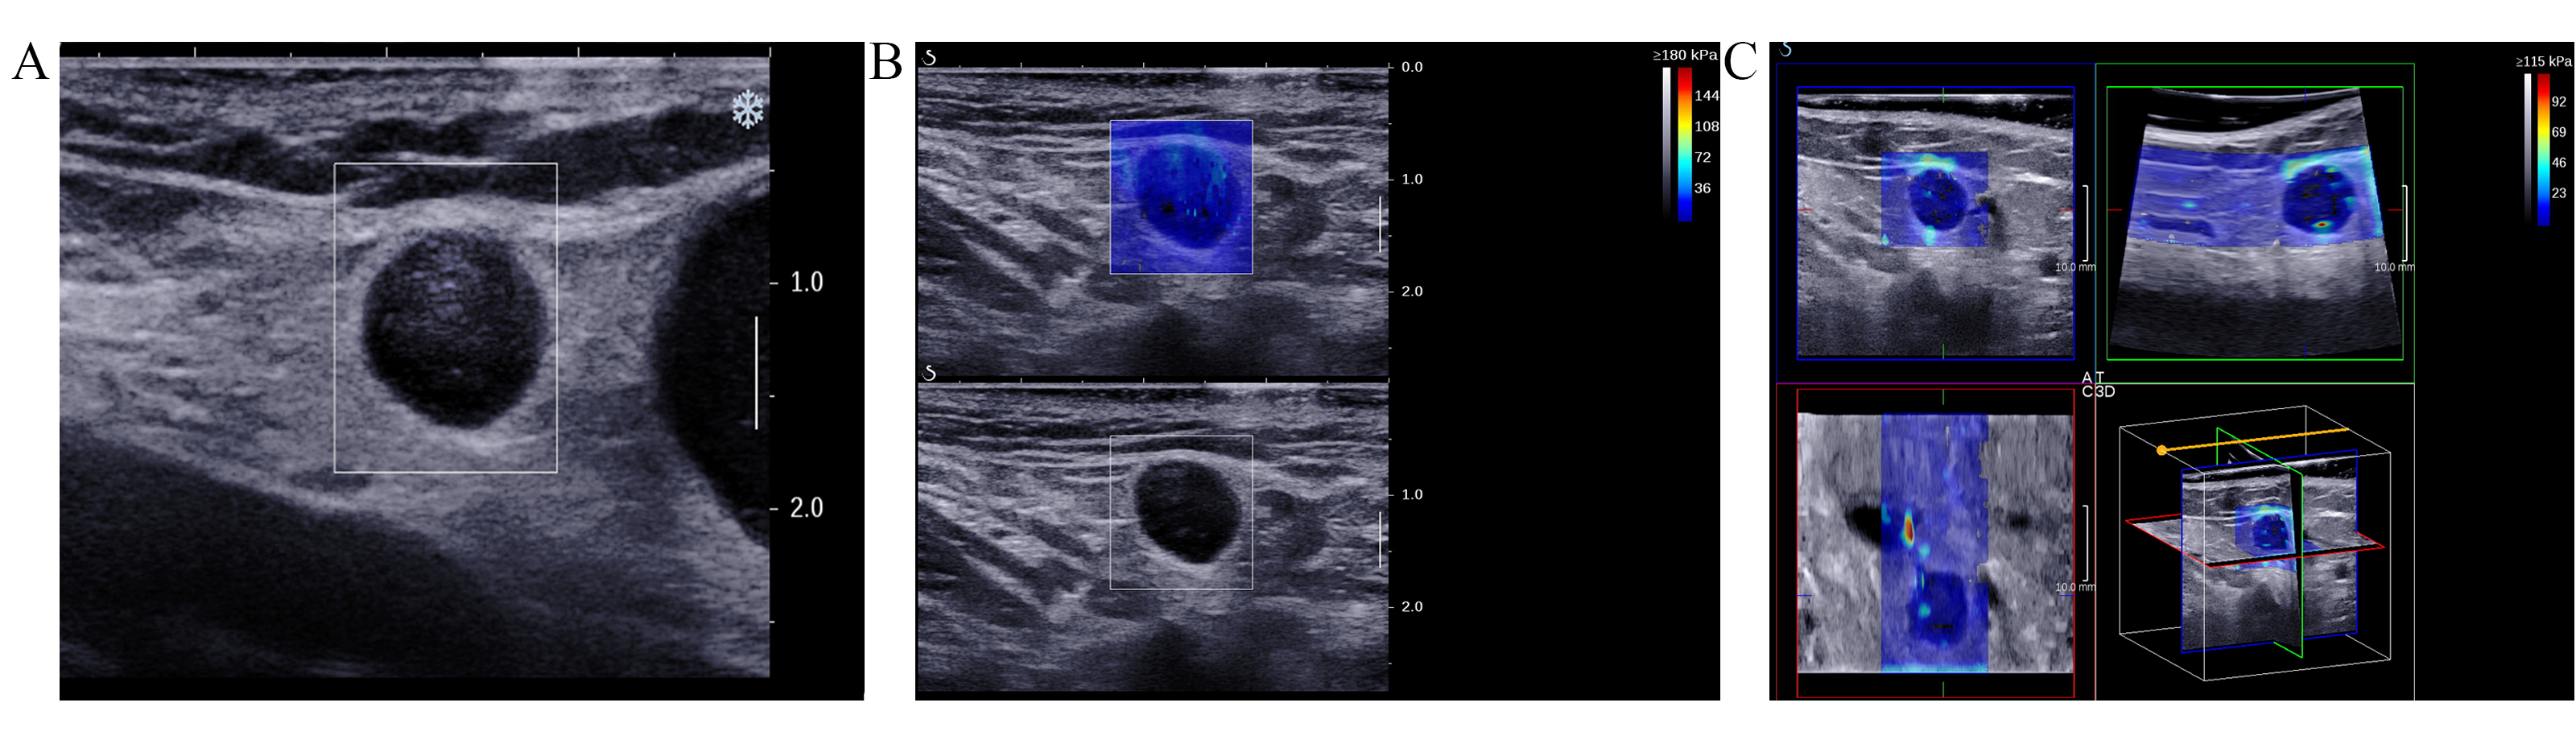
 Fig. 2.
Images of the inguinal lymph nodes (ILN) with metastasis originating from vulvar cancer in a 51-year-old female patient. (A) Ultrasound image illustrating indistinct corticomedullary differentiation, with a longitudinal to transverse diameter ratio exceeding 0.5. (B) 2D-SWE image. (C) Consists of orthogonal planes (transverse, coronal, and sagittal) derived from 3D-SWE images.
Statistical analysis was conducted using SPSS version 26.0
(IBM, Chicago, IL, USA). Both Emax and Emean did not conform to a normal
distribution and were therefore represented as the median (P25, P75) values.
Differences in nonparametric variables were analyzed using the Wilcoxon rank-sum
test, with statistical significance set at p
This study enrolled a total of 120 patients. A total of 13 participants were
excluded for the following reasons: 3 had no significant histology from surgery
or biopsy, 1 had non-diagnostic cytology, 3 had a history of ILN surgery or
treatment, 2 had failed SWE measurements due to technical issues, and 4 had lymph
nodes with significant calcification (
A total of 56 lymph nodes were diagnosed as benign using US. Among these, 41 lymph nodes (73.21%) were pathologically confirmed as benign. Additionally, 64 lymph nodes were diagnosed as metastatic, with 50 (78.13%) confirmed pathologically as malignant. For metastatic ILN, grayscale ultrasound exhibited sensitivity of 76.92%, specificity of 74.55%, accuracy of 75.83%, positive predictive value of 78.13%, and negative predictive value of 73.21%.
The median Emax and Emean of 65 malignant lymph nodes on 2D-SWE
were 38.8 (23.6, 82.8) kPa and 31.3 (16.1, 65.4) kPa, respectively. The median
Emax and Emean of 55 benign lymph nodes on 2D-SWE were 17.3 (13.5, 26.5) kPa and
15.3 (11.3, 23.6) kPa, respectively. The 2D-SWE Emax and Emean for malignant
lymph nodes were both higher than those for benign lymph nodes, with
statistically significant differences (p
| Metastatic (n = 65) | Benign (n = 55) | p value | ||
| 2D-SWE | ||||
| Emax (kPa) | 38.8 (23.6, 82.8) | 17.3 (13.5, 26.5) | p | |
| Emean (kPa) | 31.3 (16.1, 65.4) | 15.3 (11.3, 23.6) | p | |
| 3D transverse SWE | ||||
| Emax (kPa) | 55.4 (26.0, 99.5) | 23.1 (18.6, 28.4) | p | |
| Emean (kPa) | 34.5 (20.9, 76.8) | 18.2 (15.1, 22.8) | p | |
| 3D sagittal SWE | ||||
| Emax (kPa) | 49.8 (26.0, 91.2) | 21.0 (18.1, 25.1) | p | |
| Emean (kPa) | 37.3 (19.6, 72.4) | 18.3 (15.8, 22.7) | p | |
| 3D coronal SWE | ||||
| Emax (kPa) | 58.2 (26.0, 86.5) | 21.3 (17.5, 25.0) | p | |
| Emean (kPa) | 38.3 (19.4, 71.7) | 18.1 (14.4, 20.4) | p | |
Emax, the maximum elasticity values; Emean, the average elasticity values.
The median Emax and Emean values on the transverse plane of 3D-SWE for malignant
lymph nodes were 55.4 (26.0, 99.5) kPa and 34.5 (20.9, 76.8) kPa, respectively.
In contrast, the median Emax and Emean values for benign lymph nodes were 23.1
(18.6, 28.4) kPa and 18.2 (15.1, 22.8) kPa, respectively. Both Emax and Emean
values were significantly higher in malignant lymph nodes than in benign lymph
nodes (p
In the coronal plane of 3D-SWE, the median Emax and Emean for malignant lymph
nodes were 58.2 (26.0, 86.5) kPa and 38.3 (19.4, 71.7) kPa, respectively. In
contrast, for benign lymph nodes, the median Emax and Emean were 21.3 (17.5,
25.0) kPa and 18.1 (14.4, 20.4) kPa, respectively. Notably, both Emax and Emean
values on the coronal plane were significantly higher for malignant lymph
nodes than for benign lymph nodes (p
The ROC curves were generated using pathology results as the reference standard.
The AUC of the Emax value of 2D-SWE for differentiating between benign and
metastatic lymph nodes was 0.798 (95% confidence interval [CI]: 0.715–0.866).
The AUCs for the Emax values of the transverse, sagittal, and coronal planes of
3D-SWE were 0.828 (95% CI: 0.748–0.891), 0.839 (95% CI: 0.760–0.899), and
0.816 (95% CI: 0.734–0.880), respectively (Fig. 3). No significant differences
were observed between these AUCs (p
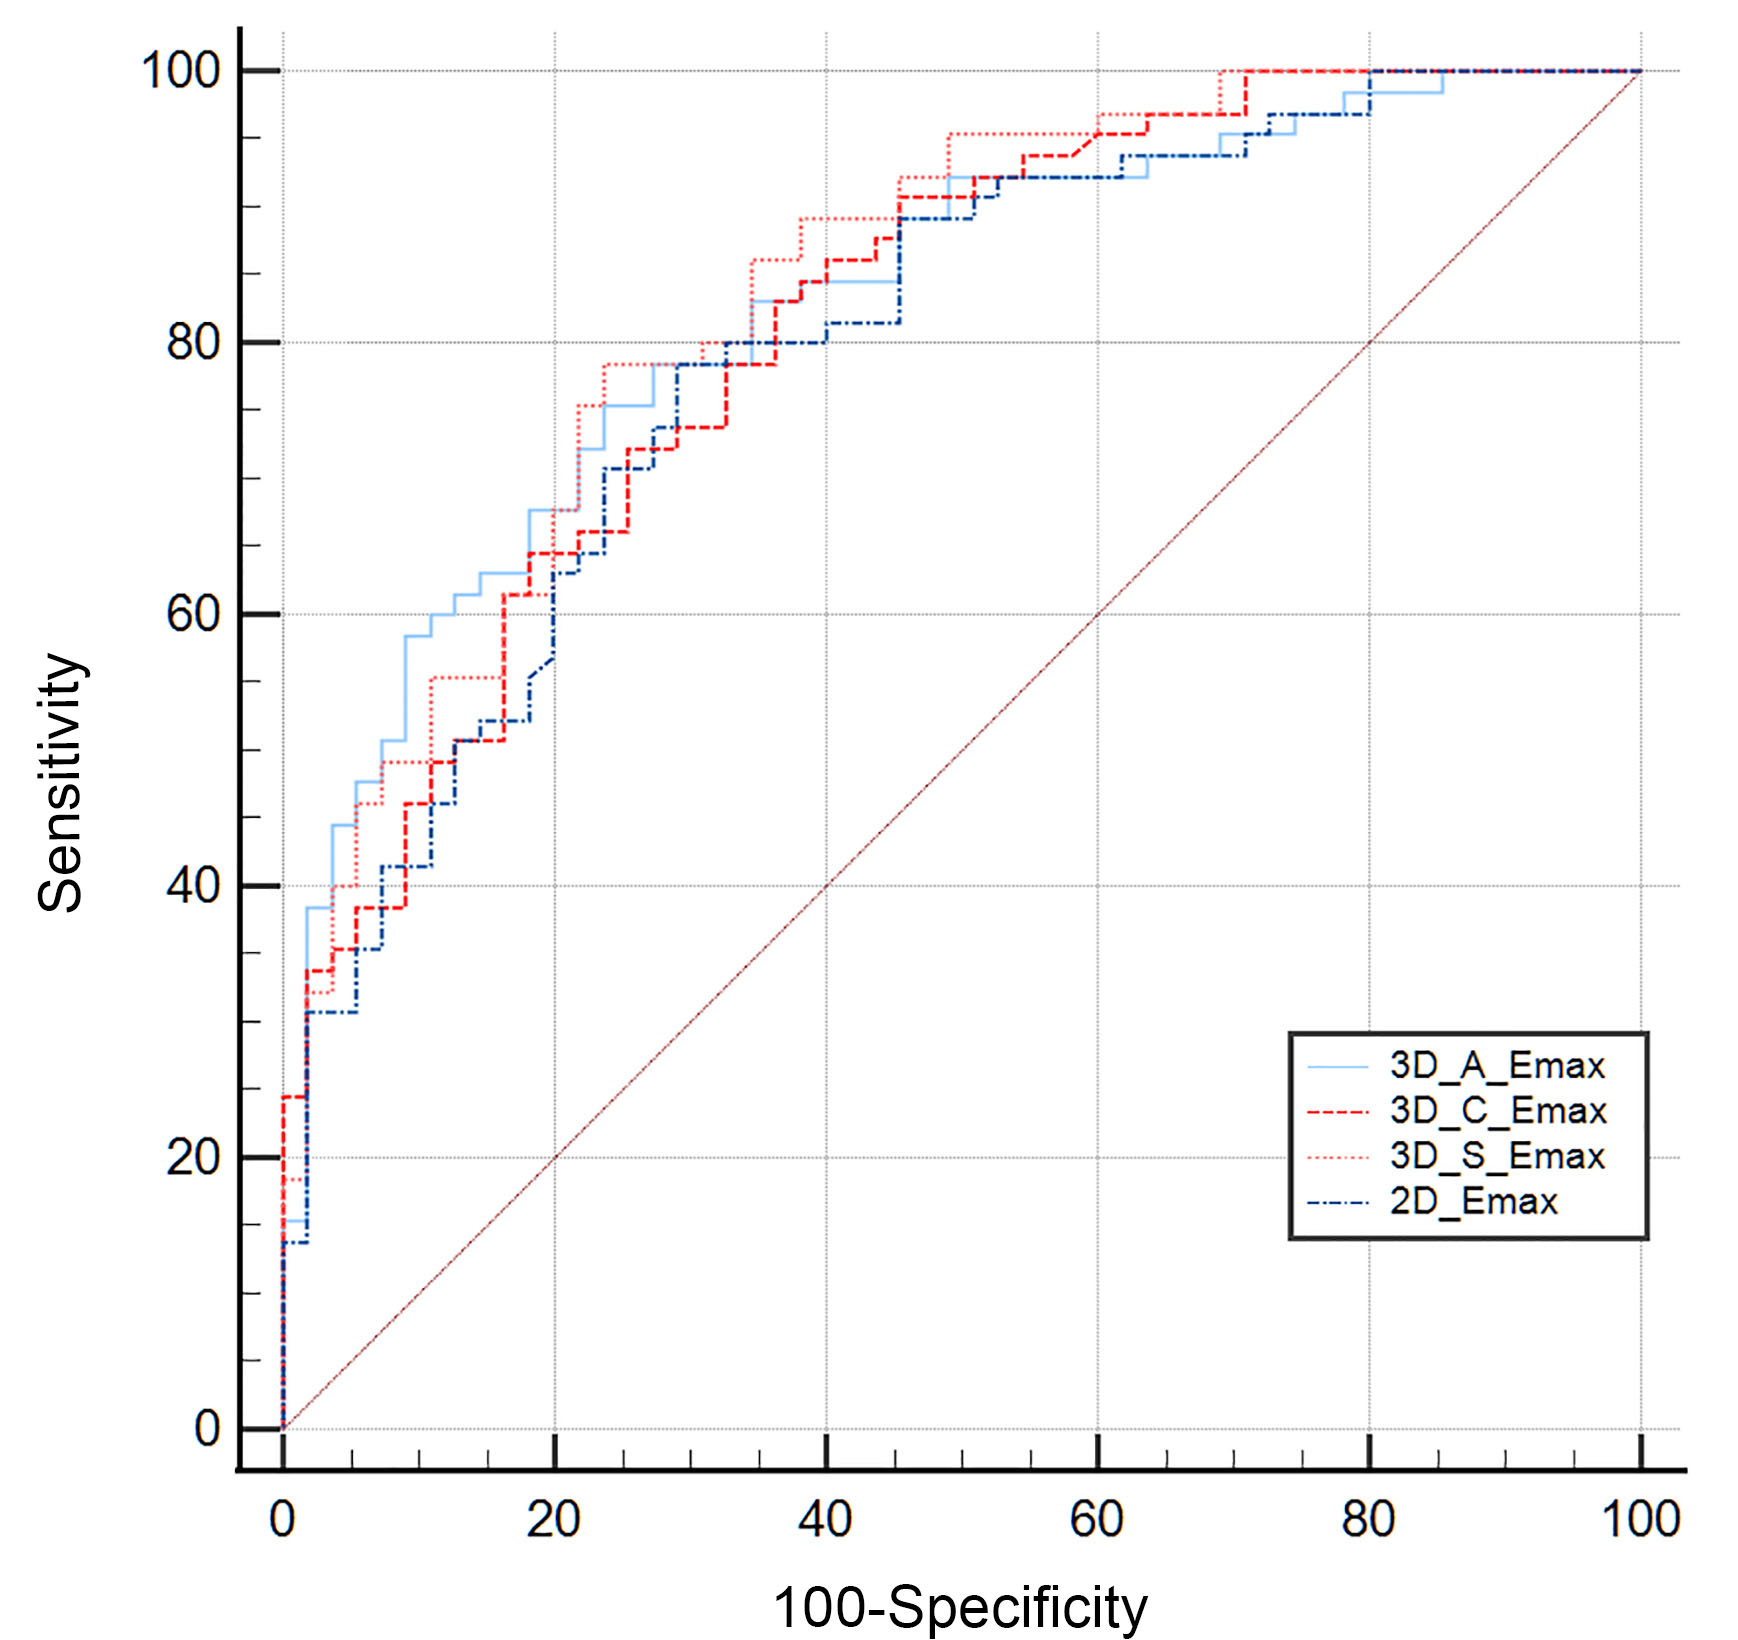 Fig. 3.
The ROC curve for the quantitative parameters of 2D-SWE and 3D-SWE in the diagnosis of metastatic ILN. ROC, receiver operating characteristic; ILN, inguinal lymph nodes; 3D_A_Emax, the maximum elasticity modulus in the transverse plane of 3D-SWE; 3D_C_Emax, the maximum elasticity modulus in the coronal plane of 3D-SWE; 3D_S_Emax, the maximum elasticity modulus in the sagittal plane of 3D-SWE; 2D_Emax, the maximum elasticity modulus of 2D-SWE.
The AUC for Emean in 2D-SWE was 0.738 (95% CI: 0.650–0.814). The AUCs for
Emean in the transverse, sagittal, and coronal planes of 3D-SWE were 0.786 (95%
CI: 0.702–0.856), 0.746 (95% CI: 0.658–0.821), and 0.766 (95% CI:
0.680–0.838), respectively. There were no significant differences observed
between 2D-SWE and the three planes of 3D-SWE (p
When differentiating between benign and malignant lymph nodes, the Emax index in the sagittal plane of 3D-SWE demonstrates higher sensitivity and specificity compared to US. The optimal cut-off values for both 2D-SWE and 3D-SWE parameters, as well as their corresponding diagnostic performance, are summarized in Table 2.
| Cut-off* | AUC | Sensitivity (%) | Specificity (%) | PPV | NPV | Accuracy | Youden’s J statistic | p value | ||
| US | - | - | 76.92 | 74.55 | 78.13 | 73.21 | - | |||
| 2D-SWE | ||||||||||
| Emax | 22.5 | 0.798 (0.715–0.866) | 78.46 | 70.91 | 76.12 | 73.59 | 75.00 | 0.4937 | p | |
| Emean | 16.3 | 0.738 (0.650–0.814) | 73.85 | 65.45 | 71.64 | 67.93 | 70.00 | 0.3930 | p | |
| 3D-SWE-A | ||||||||||
| Emax | 25.0 | 0.828 (0.748–0.891) | 75.38 | 76.36 | 79.03 | 72.41 | 75.83 | 0.5175 | p | |
| Emean | 19.8 | 0.786 (0.702–0.856) | 72.31 | 72.73 | 75.81 | 69.00 | 72.50 | 0.4503 | p | |
| 3D-SWE-S | ||||||||||
| Emax | 25.1 | 0.839 (0.760–0.899) | 78.46 | 76.36 | 79.69 | 75.00 | 77.50 | 0.5483 | p | |
| Emean | 19.6 | 0.746 (0.658–0.821) | 75.38 | 67.27 | 73.13 | 69.81 | 71.67 | 0.4266 | p | |
| 3D-SWE-C | ||||||||||
| Emax | 27.3 | 0.816 (0.734–0.880) | 72.31 | 74.55 | 77.05 | 69.49 | 73.33 | 0.5175 | p | |
| Emean | 21.8 | 0.766 (0.680–0.838) | 73.85 | 72.73 | 76.19 | 70.18 | 73.33 | 0.4657 | p | |
AUC, area under the curve; PPV, positive predictive value; NPV, negative predictive value; Emax, maximum elasticity values; Emean, average elasticity values; 3D-SWE-A, the transverse plane of 3D-SWE; 3D-SWE-S, the sagittal plane of 3D-SWE; 3D-SWE-C, the coronal plane of 3D-SWE; *The optimal cut-off, yielding maximum sensitivity and specificity on SWE.
3D-SWE utilizes ultrasound-generated shear waves to quantify tissue elasticity. By overcoming the limitations of 2D-SWE, such as its reliance on a single imaging plane and lack of anatomical context, 3D-SWE provides a more comprehensive model of tissue elasticity through multiplanar reconstruction. This technique facilitates intuitive visualization of lesions in transverse, coronal, and sagittal planes, thereby allowing for a more detailed description of tissue hardness [44]. By providing insights into tissue stiffness and elasticity, 3D-SWE enhances the diagnosis of small structures and deep organs.
In this study, we evaluated the efficacy of 3D-SWE for detecting ILN metastases in gynecological malignancies, which has not been extensively explored in the literature. The 3D-SWE technology demonstrated higher sensitivity and specificity compared to US, indicating its superior performance in differentiating between benign and metastatic lymph nodes. This enhanced performance may be attributed to 3D-SWE’s ability to quantitatively assess tissue elasticity, reflecting pathophysiological changes such as increased cell density and extracellular matrix proliferation, which are characteristic of malignant tumors. Furthermore, the excellent interobserver agreement (with an ICC of greater than 0.75) further substantiates the reliability and robustness of 3D-SWE for quantitative elastography.
In this study, we demonstrated the capability of 2D-SWE to quantitatively differentiate between benign and metastatic ILN based on stiffness measurements. The significantly elevated Emax and Emean values observed in metastatic lymph nodes are consistent with findings from previous studies [45, 46, 47]. Kawahara et al. [48] detected high shear wave velocities in ILN during the micrometastatic phase, reflecting tissue stiffening associated with extracellular matrix remodeling induced by tumor growth. The ability of 2D-SWE to identify tissue stiffening, even when the nodal capsule remains intact, highlights its diagnostic potential for early detection of metastatic progression, before structural changes are evident [48]. However, Suh et al. [49] noted that the prevalence of malignant lymph nodes significantly influences the heterogeneity observed in 2D-SWE studies, suggesting the necessity for standardized protocols, particularly in terms of measurement techniques and thresholds for malignancy.
When interpreting elastography measurements, it is essential to consider various factors that may influence the accuracy and consistency of the results. In this study, both benign and malignant ILN exhibited higher Emax and Emean values when assessed using 3D-SWE compared to 2D-SWE. This finding aligns with other investigations indicating that lesion stiffness values measured via 3D-SWE are generally greater than those obtained with 2D-SWE [50]. Further analysis suggests that the heavier transducer mass and the requirement for additional coupling agents in 3D-SWE may exert extra external pressure on the tissue, contributing to higher measured stiffness values. Additionally, several factors that influence the quality of 3D-SWE images include the amount of application of pressure, lesion location, pathological characteristics, maximal diameter, longest perpendicular depth from the skin, and the thickness of the prefocal tissue [51]. These factors also affect 2D-SWE measurements, although to a lesser extent. Furthermore, the cut-off stiffness values obtained for ILN in our study were lower than those commonly reported for cervical lymph nodes. This discrepancy is likely due to anatomical differences between the groin and neck regions, such as the irregularity of the skin, the presence of large vessels and the trachea, as well as the rigidity of pulsating vascular walls and tracheal cartilage, all of which typically yield higher stiffness measurements in the neck. In contrast, the flatter skin and looser subcutaneous tissues of the groin result in lower stiffness readings compared to the neck region. Studies on SWE of canine lymph nodes by Favril et al. [52] support this observation, demonstrating higher inter- and intra-observer consistency for ILNs compared to mandibular and popliteal lymph nodes, further highlighting the influence of anatomical factors on elastography measurements.
Malignant lesions often exhibit significant heterogeneity in tissue architecture, which can complicate the assessment of tumor stiffness and detection of regions with higher malignancy potential. However, 3D-SWE provides a multidimensional representation of stiffness variations within the mass, enhancing the detection of nonuniform stiffness variations, which is crucial for identifying malignant areas that may otherwise be missed using conventional methods. Studies conducted by Tian et al. [53] and Zhao et al. [54] demonstrated that 3D-SWE is superior to 2D-SWE in evaluating lesion homogeneity and specificity, and also outperformed US in diagnostic performance, particularly in detecting irregularities within heterogeneous tumors. Nevertheless, research findings have been inconsistent regarding the clinical advantages of either 2D-SWE or 3D-SWE, particularly with respect to their ability to quantify breast tumors and their overall diagnostic accuracy [55, 56, 57]. Yin et al. [58] reported that Young’s modulus value of 3D-SWE did not significantly differ across the transverse, sagittal, and coronal planes in muscle tissue. However, 3D-SWE’s ability of depicting tissue from multiple angles allowed for more accurate characterization of its spatial properties. Chen et al. [44, 59] found that the coronal plane exhibited the most pronounced elastic property variations and was least affected by pressure artifacts, thus providing optimal accuracy. In contrast, Wang et al. [57] reported that the sagittal plane demonstrated superior diagnostic capability compared to the transverse and coronal planes [39, 60].
Our study also observed no significant differences in quantitative parameters
across the three planes (p
Due to the retrospective design of this study, the examined population may not fully represent the broader population of patients with gynecological malignancies. Additionally, ultrasound imaging is influenced by both the operator’s technique and the machine settings. Future research should involve multicenter randomized trials with larger, more diverse sample sizes to better validate and generalize these findings.
3D-SWE effectively differentiates between benign and metastatic lymph nodes by quantitatively assessing the stiffness of ILNs in patients with gynecological tumors. As a reliable diagnostic tool for lymph nodes, 3D-SWE can reduce the need for invasive biopsy procedures while providing valuable non-invasive information.
2D SWE, two-dimensional shear wave elastography; 3D SWE, three-dimensional shear wave elastography; ILN, inguinal lymph node; US, conventional ultrasound; CT, computed tomography.
The data that support the findings of this study are available on request from the corresponding author.
YPS and JLD performed the investigation, resourced the data, curated the data, wrote the original draft of the manuscript, and created the visualizations. JLD conducted a formal analysis and reviewed and edited the writing. JML carried out the methodology and validation work. ML conceptualized the study, supervised the research, and administered the project. All authors read and agreed to the published version of the manuscript. All authors contributed to editorial changes in the manuscript. All authors have participated sufficiently in the work and agreed to be accountable for all aspects of the work.
The study was conducted by the declaration of Helsinki and approved by the medical ethics committee of Sichuan Cancer Hospital (Protocol code SCCHEC-03-2022-007 and approval date 2022-03-01). Informed consent was obtained from the participants included in the study.
This project’s success owes much to my team. We overcame difficulties together. Special thanks to our leader for leading the way and making everything organized.
This research was funded by the Youth Fund of Sichuan Medical Association, grant number Q17075.
The authors declare no conflict of interest.
References
Publisher’s Note: IMR Press stays neutral with regard to jurisdictional claims in published maps and institutional affiliations.