

1 Guangzhou Women and Children’s Medical Center, Guangzhou Medical University, 510000 Guangzhou, Guangdong, China
Abstract
Neonatal umbilical artery blood-gas analysis is a diagnostic procedure performed shortly after birth to assess the acid-base balance, oxygenation, and metabolic status of a newborn infant. This retrospective study aimed to investigate the association of prenatal maternal fever with neonatal umbilical artery blood-gas analysis.
A retrospective analysis was conducted on data from 333 parturients and their newborns. Demographic characteristics, clinical information, and neonatal umbilical artery blood gas analysis data were analyzed to evaluate the association between prenatal maternal fever and neonatal blood-gas analysis. Pregnant women with fever (≥38.0 °C) during labor were compared with those without fever. Neonatal umbilical artery blood gas parameters were assessed in relation to the degree and duration of maternal fever.
The incidence of the adverse delivery outcome of parturients with high prenatal fever and long duration of fever was significantly higher than that of the low fever, short-term fever, and normal parturients (p < 0.05). The pH of neonatal umbilical veins in the high fever groups was reduced compared with the control group (p < 0.05). Lactic acid (Lac) of neonatal umbilical vein in the low fever and high fever groups was enhanced compared with the control group (p < 0.05). The pH of neonatal umbilical veins in the short-term fever and long-term fever groups was elevated compared with the control group (p < 0.05). The umbilical artery pH and base excess (BE) were positively correlated with maternal peak fever temperature (r = 0.20, r = 0.22, p < 0.05). The umbilical Lac was negatively correlated with maternal peak fever temperature (r = –0.22, p < 0.05). Moreover, the umbilical artery pH and BE were positively correlated with maternal duration of fever (r = 0.29, r = 0.21, p < 0.05). The umbilical artery Lac was negatively correlated with maternal duration of fever (r = –0.25, p < 0.05).
The findings suggested that maternal fever during labor was associated with alterations in neonatal umbilical artery blood gas analysis. Understanding the influence of prenatal fever on delivery outcomes is crucial for optimizing maternal and neonatal health.
Keywords
- blood-gas analysis
- neonates
- prenatal maternal fever
- umbilical artery
Prenatal fever, occurring in approximately 11.4% of deliveries [1], is associated with adverse outcomes, such as contamination of the amniotic fluid, fetal distress, stillbirth, neonatal asphyxia [2], and an increased likelihood of cesarean sections [3, 4]. As awareness of the impact of intrauterine infection on both mothers and infants grows, clinical attention toward prenatal fever is increasing.
Distinguishing between infectious and non-infectious causes of prenatal fever poses challenges, particularly in cases presenting with elevated fetal heart rate, increased leukocyte count, and prolonged labor stages [5, 6]. The risks associated with short- and long-term complications of cesarean sections highlight the need for accurate diagnosis and enhanced clinical assessment of maternal fever to improve perinatal outcomes and ensure fetal intrauterine safety [7, 8].
Neonatal resuscitation guidelines emphasized the use of evidence-based medicine methods to promptly evaluate and support newborns after birth, including essential life support measures [9]. The American College of Obstetrics and Gynecology (ACOG) recommended umbilical artery blood gas analysis for all newborns with prenatal risk factors [10]. Umbilical cord blood gas analysis (UCBGA) serves as an objective and reliable adjunctive examination to assess newborns’ oxygenation metabolism at birth, with pH serving as a predictor of adverse neonatal outcomes. UCBGA is particularly advantageous for screening high-risk newborns [11, 12]. It provides a quantitative analysis to assess fetal stress reactions during delivery, recognized as the most objective basis for evaluating fetal and neonatal acid-base balance [13].
This retrospective study aimed to investigate the association between prenatal maternal fever and neonatal umbilical artery blood gas analysis. Specifically, it was attempted to assess whether the duration and degree of maternal fever during pregnancy would be correlated with neonatal blood gas parameters. This investigation could address the gap in understanding the impact of prenatal fever on neonatal acid-base balance and oxygenation metabolism at birth.
A retrospective study was conducted at the Guangzhou Women and Children’s
Medical Center (Guangzhou, China) from July 2022 to December 2022, involving
newborns and mothers who experienced prenatal fever in the delivery room. Medical
records of 333 participants with prenatal fever, along with their neonates’
records, were retrospectively analyzed. Twenty-three neonates were excluded from the analysis due to incomplete data, resulting in a total of 310 neonates included in the study. This group was further expanded to include an additional 200 control newborns, bringing a total of 510 neonates, with the grouping being based on the condition of the mother. The inclusion criteria were as follows: (1)
pregnant women with a history of fever within one week before delivery; (2)
singleton pregnancies; (3) gestational age
The study employed a retrospective case-control design to investigate the
association between prenatal maternal fever and neonatal umbilical artery
blood-gas analysis. This design allowed for the comparison of neonatal outcomes
between cases (pregnant women with fever) and controls (pregnant women without
fever). Clinical data from parturients were coded and organized using EPI DATA
software (version 3.3, Ewell Science & Technology Co., Ltd., Hangzhou, Zhejiang,
China). A total of 333 parturients with a history of fever within one week before
delivery were involved in the study. They were categorized into groups based on
fever severity and duration: the low fever group (
The umbilical cord of the fetus was clamped within one minute of birth using two hemostatic forceps, effectively stopping the blood circulation between the newborn and the mother. Subsequently, a Pico 70 UCBGA special needle (Becton, Dickinson, Plymouth, UK), was employed to extract 1 mL of umbilical cord blood from the umbilical artery, ensuring accurate sampling. To maintain sample integrity, care was taken to remove any air bubbles from the blood collection needle before sealing it with a rubber block. The needle was gently rolled horizontally for 10 sec and inverted 10 times to ensure thorough mixing of the blood sample. Within 30 min of collection, the umbilical cord blood was analyzed using the American GEM3000 blood gas analyzer (Instrumentation Laboratory Company, Bedford, MA, USA) to determine the umbilical artery pH, which was subsequently recorded for analysis. It is essential to avoid exposing the collected umbilical cord blood sample to air or introducing air into it during handling to prevent experimental errors and ensure the reliability of the results.
SPSS 24.0 (IBM, Armonk, NY, USA) and GraphPad Prism 7.0 (GraphPad Software Inc.,
San Diego, CA, USA) software were used to conduct the data analysis. The general
data were described as frequency and percentage. The Chi-square test,
Mann–Whitney U test, and one-way analysis of variance (ANOVA) were employed to
compare the data among groups. Descriptive statistics were presented as mean
A total of 333 parturients with fever were delivered in our hospital during the
study period, and the median maternal age was 29.95 years. Among them, 237
(71.17%) pregnant women developed a low fever during pregnancy, while 96
(28.83%) women developed a high fever. Tables 1,2 present the outcomes of
statistical evaluation of puerperal demographic characteristics, including age,
highest fever temperature, gestational age, parity, premature rupture of
membranes
| Characteristic | Low fever (n = 237) | High fever (n = 96) | Control (n = 200) | p | |
| Age (year) | 30.15 |
30.09 |
29.82 |
0.649^ | |
| 0.637# | |||||
| 0.835& | |||||
| Gestational age (week) | 40.22 |
41.06 |
40.35 |
0.893^ | |
| 0.973& | |||||
| Parity | 0.173 | ||||
| 1 | 178 | 79 | 163 | ||
| 59 | 17 | 37 | |||
| Premature rupture of membranes | 55 | 13 | 50 | 0.073 | |
| Number of pregnancies | 0.167 | ||||
| 1 | 151 | 71 | 128 | ||
| 86 | 25 | 72 | |||
| Delivery mode | 0.008* | ||||
| Vaginal | 139 | 56 | 138 | ||
| Assisted birth (forceps/vacuum) | 56 | 23 | 49 | ||
| Cesarean | 42 | 17 | 13 | ||
| 24-h postpartum hemorrhage (mL) | 365.33 |
413.76 |
355.49 |
0.020^* | |
| 0.017&* | |||||
| Labor analgesia | 217 | 91 | 162 | 0.093 | |
p was calculated using
Premature rupture of membranes was defined as rupture occurring
| Characteristic | Short-term fever (n = 237) | Long-term fever (n = 96) | Control (n = 200) | p | |
| Age (year) | 29.85 |
29.91 |
29.93 |
0.973^ | |
| 0.972# | |||||
| 0.999& | |||||
| Gestational age (week) | 39.88 |
39.85 |
40.12 |
0.980^ | |
| 0.982# | |||||
| 0.986& | |||||
| Parity | 0.162 | ||||
| 1 | 176 | 77 | 163 | ||
| 61 | 19 | 37 | |||
| Premature rupture of membranes | 43 | 15 | 50 | 0.095 | |
| Number of pregnancies | 0.430 | ||||
| 1 | 163 | 60 | 128 | ||
| 74 | 36 | 72 | |||
| Delivery mode | 0.428 | ||||
| Vaginal | 157 | 56 | 138 | ||
| Assisted birth (forceps/vacuum) | 50 | 22 | 49 | ||
| Cesarean | 30 | 18 | 13 | ||
| 24-h postpartum hemorrhage (mL) | 364.69 |
413.60 |
357.41 |
0.014^* | |
| 0.012&* | |||||
| Labor analgesia | 214 | 95 | 162 | ||
p was calculated using
As shown in Table 2, the 24-h postpartum hemorrhage volume in the control group
was significantly lower than that in the long-term fever
groups (p
Twenty-three neonates were excluded from the analysis due to incomplete data,
and the demographic characteristics of the remaining 310 neonates are presented
in Tables 3,4. Comparison of the leukocyte count and neutrophil proportion among the high fever, low fever, and control groups revealed significant differences
(all p
| Characteristic | Low fever (n = 216) | High fever (n = 94) | Control (n = 200) | p | |
| Gender | 0.680 | ||||
| Male | 109 | 43 | 102 | ||
| Female | 107 | 51 | 98 | ||
| Birthweight: median (IQR), g | 3276 (2941–3618) | 3307 (2957–3681) | 3298 (2933–3677) | 0.813 | |
| 1-min Apgar score |
4 | 3 | 5 | 0.762 | |
| Leukocyte count (109/L) | 18.51 |
18.71 |
10.77 |
||
| Neutrophil proportion (%) | 66.18 |
69.73 |
30.28 |
||
| NICU admission | 71 | 35 | 63 | 0.619 | |
p was calculated using
| Characteristic | Short-term fever (n = 210) | Long-term fever (n = 100) | Control (n = 200) | p | |
| Gender | 0.026* | ||||
| Male | 134 | 54 | 102 | ||
| Female | 76 | 46 | 98 | ||
| Birthweight: median (IQR), g | 3292 (2926–3611) | 3305 (2981–3672) | 3299 (2930–3674) | 0.948 | |
| 1-min Apgar score |
3 | 2 | 5 | 0.736 | |
| Leukocyte count | 18.59 |
18.62 |
10.71 |
||
| Neutrophil proportion | 68.74 |
69.14 |
30.43 |
||
| NICU admission | 64 | 27 | 50 | 0.458 | |
p was calculated using
The pH of neonatal umbilical veins in the high fever groups was reduced compared with the control group
(p
| Low fever (n = 216) | High fever (n = 94) | Control (n = 200) | p | |
| pH | 7.25 |
7.26 |
7.38 |
|
| BE (median [IQR], mmol/L) | –2.86 (–4.35, 2.35) | –2.85 (–4.34, 2.79) | –2.85 (–3.85, 2.36) | 0.783 |
| Lac (mmol/L) | 4.26 |
3.88 |
3.53 |
|
p was calculated using the Mann–Whitney U test or one-way ANOVA; BE, base excess; Lac, lactic acid; IQR, interquartile range; ^: comparison among three groups; #: Control vs. Low fever; &: Control vs. High fever; * indicates statistical significance.
As shown in Table 6, the pH of neonatal umbilical veins in the short-term fever
and long-term fever groups was elevated compared with the control group
(p
| Short-term fever (n = 210) | Long-term fever (n = 100) | Control (n = 200) | p | |
| pH | 8.03 |
8.46 |
7.36 |
|
| BE (mmol/L) | –2.49 (–3.84, 0.70) | –2.10 (–3.85, 2.05) | –2.00 (–3.85, 1.58) | 0.853^ |
| Lac (mmol/L) | 4.36 |
3.97 |
4.38 |
|
p was calculated using the Mann–Whitney U test or one-way ANOVA; BE, base excess; Lac, lactic acid; ^: comparison among three groups; #: Control vs. Short-term fever; &: Control vs. Long-term fever; * indicates statistical significance.
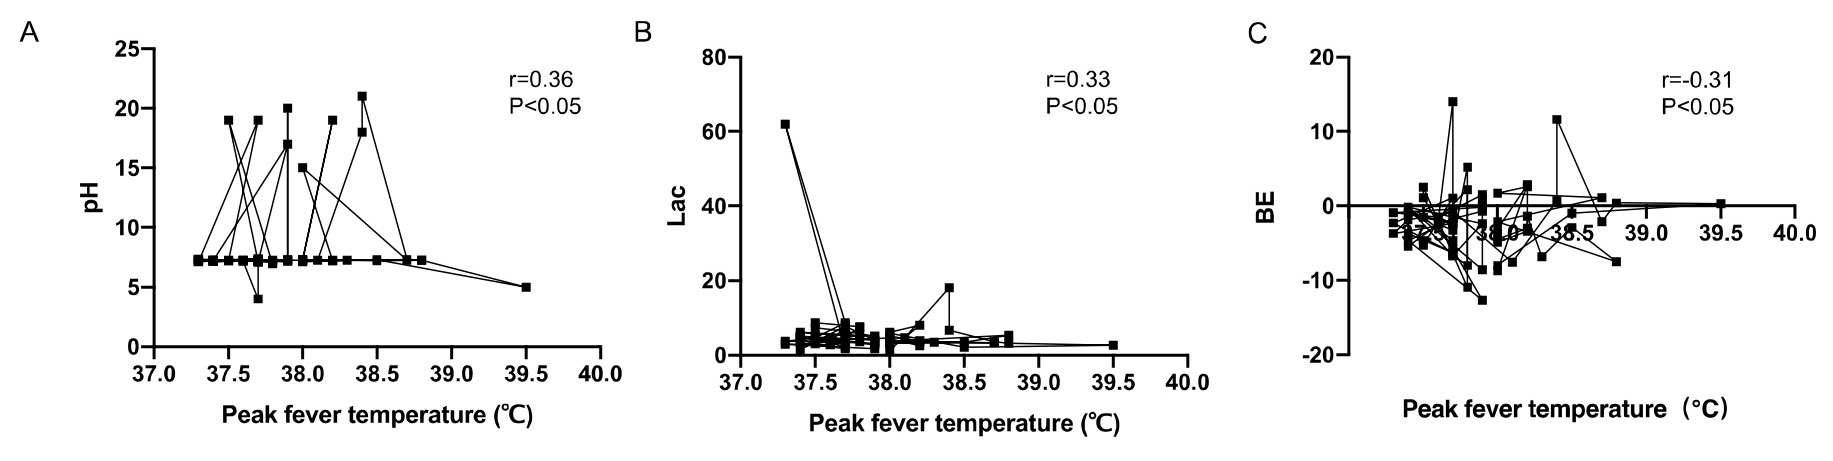
The correlation between umbilical artery blood gas analysis and maternal peak
fever temperature was evaluated by Spearman correlation analysis. The umbilical
artery pH and BE were positively correlated with maternal peak fever temperature
(r = 0.20, r = 0.22, p
 Fig. 1.
Correlation analysis between neonatal umbilical artery blood gas
analysis and maternal peak fever temperature. (A) The umbilical artery pH was
positively correlated with maternal peak fever temperature (r = 0.20, p
| Correlation coefficient r | p | |
| pH | 0.20 | 0.037* |
| BE (mmol/L) | 0.22 | 0.043* |
| Lac (mmol/L) | –0.22 | 0.041* |
| Peak maternal fever (∘C) | 38.5 |
* indicates statistical significance. BE, base excess; Lac, lactic acid.
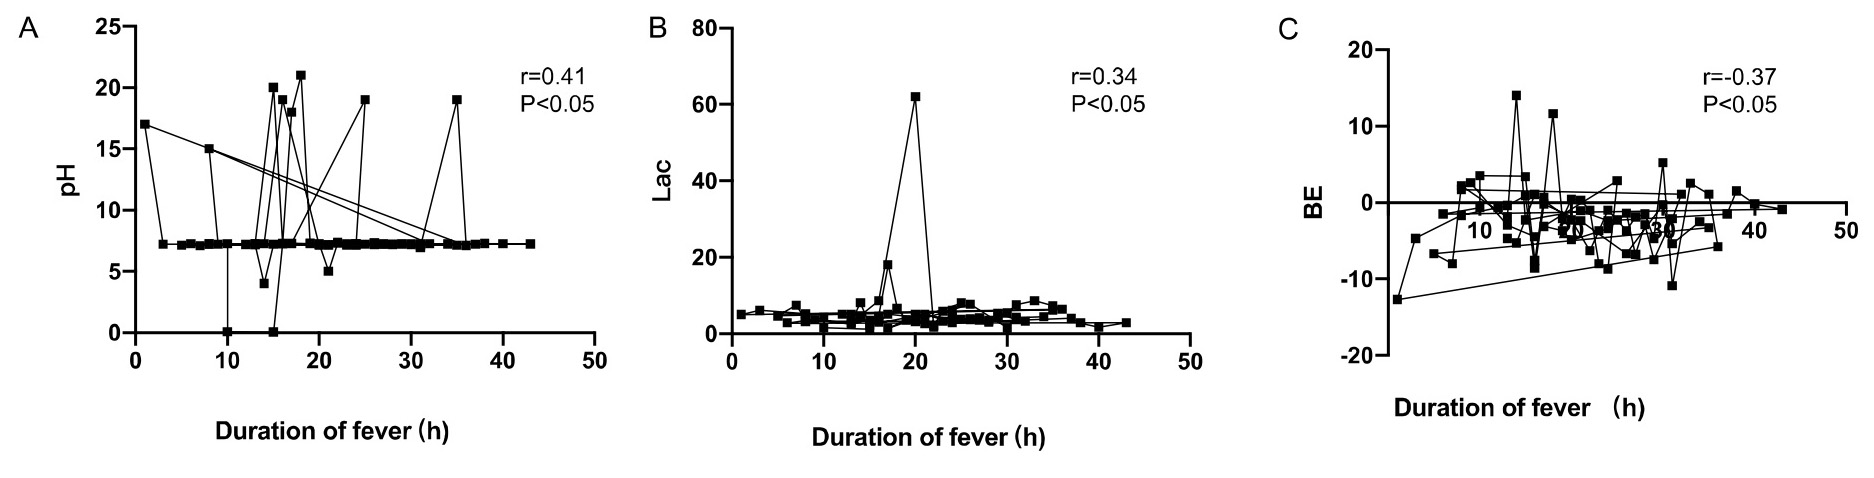
Moreover, the umbilical artery pH and BE were positively correlated with
maternal duration of fever (r = 0.29, r = 0.21, p
 Fig. 2.
Correlation analysis between neonatal umbilical artery blood gas
analysis and maternal duration of fever. (A) The umbilical artery pH was
positively correlated with maternal duration of fever (r = 0.29, p
| Correlation coefficient r | p | |
| pH | 0.29 | 0.041* |
| BE (mmol/L) | 0.21 | 0.032* |
| Lac (mmol/L) | –0.25 | 0.029* |
| Duration of maternal fever (hours) | 14.3 |
* indicates statistical significance. BE, base excess; Lac, lactic acid.
Fever refers to increased body temperature beyond the average value when the body is dysfunctional in the thermoregulation center caused by heat or various causes. Prenatal fever is a common complication during pregnancy [14]. Numerous studies have suggested that the intrauterine temperature of pregnant women is about 0.8 °C higher than that of the oral cavity and increases with maternal temperature [15]. Infection is a crucial factor contributing to prenatal fever, particularly retrograde infection resulting from artificial rupture of membranes. Premature rupture of membranes ranks foremost among the causes of prenatal fever [16, 17]. Fever in pregnant women during different periods of pregnancy can affect the progress of pregnancy and lead to various adverse pregnancy outcomes [18]. Even if the fetus has reached maturity during the prenatal period, maternal fever, particularly high fever, increases the risk of neonatal hypoxic-ischemic encephalopathy, fetal distress, neonatal septicemia, amniotic fluid contamination, cesarean section, and even fetal death [19]. Therefore, it is vital to carry out studies on the prevention of prenatal maternal fever.
In the present study, both high-risk and low-risk pregnant patients were included to assess the association between maternal pyrexia and postnatal umbilical artery blood gas analysis. Obstetric high-risk factors, such as intrauterine growth restriction (IUGR), placental abruption, and cord prolapse were assessed for each case. Additionally, the labor process was closely monitored, with particular attention to fetal heart rate monitoring and progress of labor. In this study, it was found that the incidence of the adverse delivery outcome of parturients with high prenatal fever and long duration of fever was significantly higher than that of low fever, short-term fever, and normal parturients. Consequently, clinical, scientific, and effective interventions should be given to prevent the occurrence of prenatal fever, reduce the duration of fever, and improve the maternal and pediatric outcomes. Pregnant women experiencing fever should prioritize its management, following medical advice to utilize antipyretic drugs or physiotherapy. Lowering body temperature promptly to normal level is crucial to mitigate adverse pregnancy outcomes. Additionally, comprehensive preventive health guidance regarding the various causes of prenatal fever should be provided to expectant mothers and their families. Beyond the direct effects of increased maternal metabolic demands, fever during pregnancy may lead to fetal hypoxia through multiple pathways. Inflammation-induced alterations in placental transport mechanisms could impair the delivery of oxygen from the maternal to fetal circulation. Additionally, fever-associated changes in maternal cytokine levels and vascular tone may disrupt uteroplacental blood flow, reducing oxygen delivery to the fetus. These mechanisms collectively highlight the multifaceted nature of the association between maternal fever and fetal hypoxia.
It is essential to note that while antipyretic medications may help alleviate maternal discomfort and prevent potential adverse effects on the fetus, they should be used judiciously and not as a substitute for identifying and treating the underlying cause of fever. Prompt and thorough evaluation to determine the etiology of maternal fever is essential, as it may indicate various conditions, such as infection, inflammation, or other medical issues. Treating the underlying cause of fever is crucial for optimizing maternal and neonatal outcomes. Clinicians should adopt a comprehensive approach to managing maternal fever during delivery, which includes not only the administration of antipyretic medications, but also investigation into the root cause of fever to develop appropriate treatment strategies. The management of maternal fever during delivery, including interventions, such as antipyretic medications or other treatments, may influence the pattern and severity of maternal fever, consequently affecting neonatal outcomes.
Under normal conditions, the mother supplies the fetus with blood rich in oxygen
and nutrients through the umbilical vein. The umbilical artery transports blood
rich in carbon dioxide and metabolic waste products from the fetus back to the
placenta [20]. Therefore, umbilical artery blood provides a precise reflection of
the fetal oxygenation metabolism. In cases of fetal or neonatal asphyxia and
hypoxia, aerobic energy metabolism pathways are suppressed, leading to an
increase in anaerobic metabolism. Consequently, there is elevated production and
accumulation of lactic acid and other acidic metabolites [21]. In recent years,
the international perinatal medical community has increasingly emphasized the
significance of neonatal umbilical artery blood gas values [22]. At present, both
domestically and internationally, umbilical artery blood gas analysis serves as
an objective measure to assess newborns’ acid-base status and as a quality
control index for delivery room management [23]. There is a consensus regarding
the advantages of blood gas analysis, including its simplicity, minimal
invasiveness, and swift results. This method facilitates a rapid understanding of
the body’s acid-base balance and hypoxia, thereby playing a crucial role in
diagnosing neonatal hypoxic conditions [24]. Scholars investigated whether
umbilical artery pH
However, it is important to acknowledge the limitations of this study. Firstly, its retrospective design might inherently introduce the potential for selection bias and confounding variables. Additionally, the reliance on medical records for data collection might introduce information bias. Secondly, the lack of detailed information on certain variables, such as the specific indications for extended labor in women with fever, could limit the interpretation of the findings. Thirdly, the relatively small sample size might also reduce the generalizability of the results. Finally, while the manuscript provides valuable insights into the association between maternal fever and fetal hypoxia, further research is needed to explore additional pathways through which fever may impact fetal wellbeing.
In conclusion, this retrospective study on prenatal fever mothers revealed that neonatal umbilical artery blood gas analysis was associated with the degree and duration of maternal fever. It was found that prenatal fever could influence the maternal delivery outcome, leading to adverse delivery outcomes. For high-risk pregnant women, especially those with prenatal fever, the umbilical artery blood gas analysis has high clinical application value and is worthy of further promotion in clinical application. It is imperative for future studies to explore the relationship between maternal fever management strategies and their effects on neonatal health, as understanding these dynamics can optimize perinatal care and improve neonatal outcomes.
The original contributions presented in the study are included in the article, and further inquiries can be directed to the corresponding author.
LL, XW, and TW designed the study. LL, XW, and YL performed the research. LH, LL, and TW analyzed the data. All authors contributed to editorial changes in the manuscript. All authors read and approved the final manuscript. All authors have participated sufficiently in the research and agreed to be accountable for all aspects of the research.
This study was approved by the Research Ethics Committee of Guangzhou Women and Children’s Medical Center Affiliated to Guangzhou Medical University (2021318B00). Written informed consent was signed by the parturients.
Not applicable.
This research was funded by General Guidance Project of Guangzhou Health Commission (Name: Suiwei Science and Education [2021], Grant No. 20221A010021).
The authors declare no conflict of interest.
References
Publisher’s Note: IMR Press stays neutral with regard to jurisdictional claims in published maps and institutional affiliations.