


1 Department of Physiology, Faculty of Medicine, Can Tho University of Medicine and Pharmacy, 90000 Can Tho, Vietnam
2 Department of Physiology, Faculty of Medicine, Ho Chi Minh University of Medicine and Pharmacy, 74000 Ho Chi Minh City, Vietnam
3 Department of Internal Medicine, Bac Lieu General Hospital, 84291 Bac Lieu, Vietnam
4 Department of Internal Medicine, Faculty of Medicine, Can Tho University of Medicine and Pharmacy, 90000 Can Tho, Vietnam
Abstract
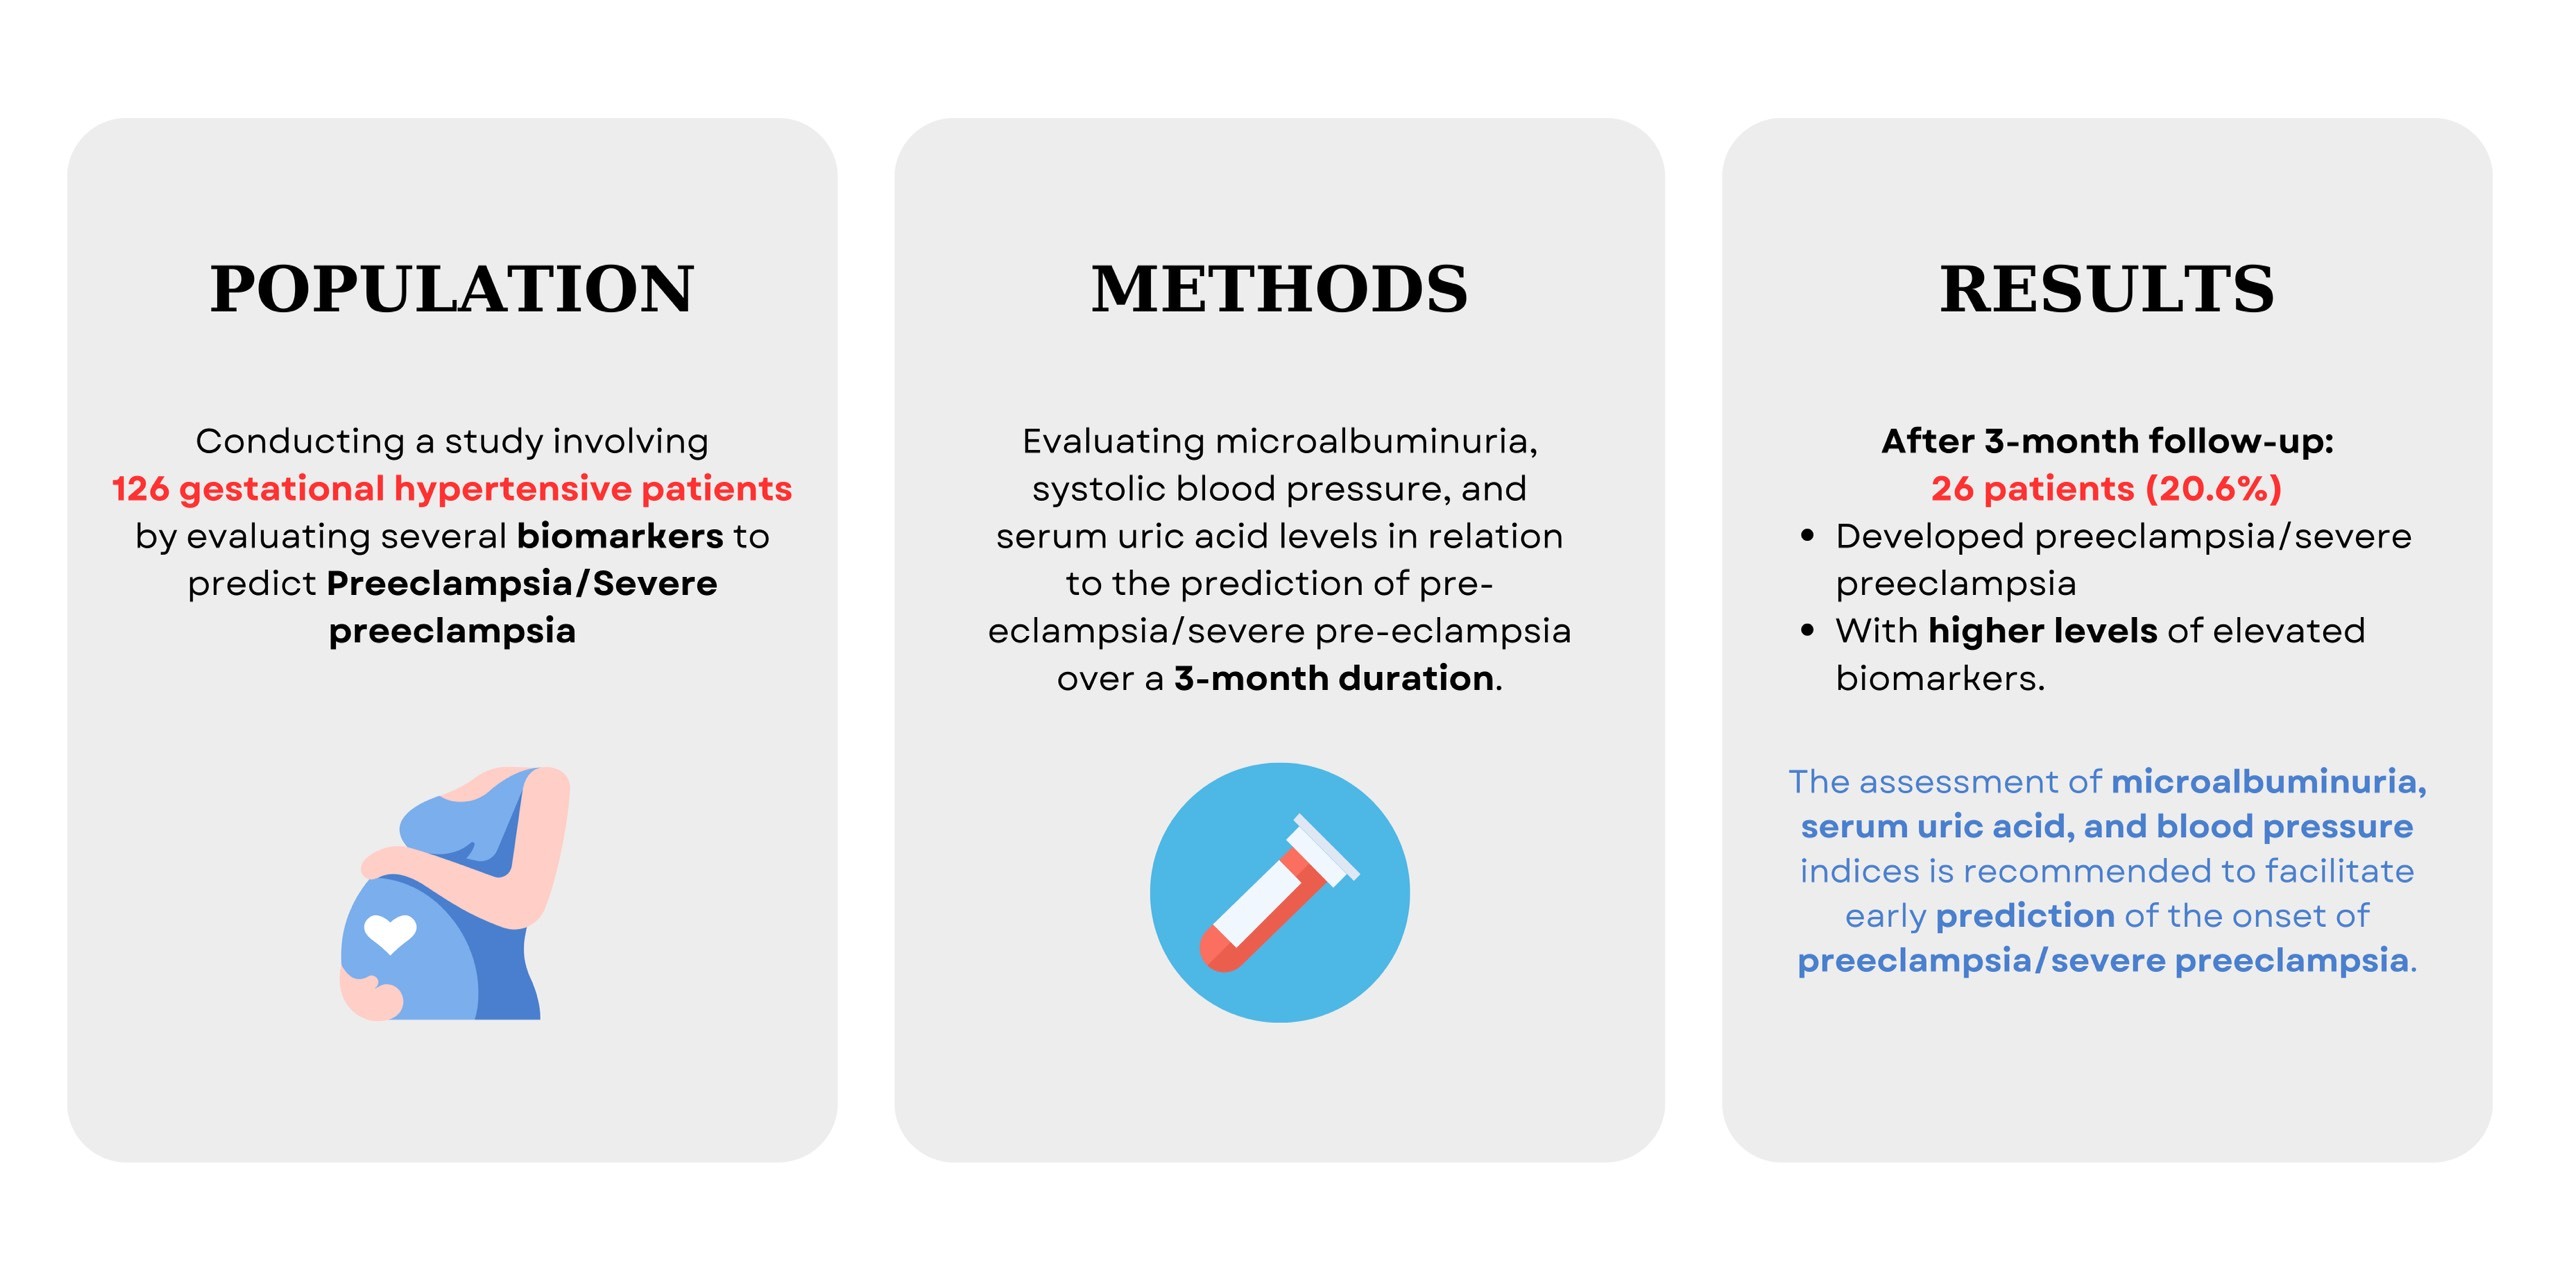
Preeclampsia is one of the most prevalent hypertensive disorders during pregnancy, leading to various issues that have an adverse impact on both the mother and the fetus. Study to evaluating several biomarkers to predict preeclampsia/severe preeclampsia in gestational hypertensive patients.
We conducted a cross-sectional analysis study of 126 pregnant women with gestational hypertension. The assessment of microalbuminuria, systolic blood pressure, and serum uric acid levels linked to incidents of preeclampsia/severe preeclampsia (after a 3-month follow-up) was carried out utilizing the receiver operating characteristic (ROC) curve.
Among the 126 pregnant women with gestational hypertension studied, 26 patients (20.6%) developed preeclampsia/severe preeclampsia during the 3-month follow-up period. In the logistic regression analysis, variables including systolic blood pressure, creatinine, serum uric acid, and microalbuminuria were identified as independent risk factors predicting preeclampsia/severe preeclampsia in gestational hypertensive patients (p < 0.05). Microalbuminuria, with a cut-off point of 126.25 mg/L, demonstrated a sensitivity of 96.2%, specificity of 96%, and an area under the curve of 0.981. Regarding systolic blood pressure, the cut-off threshold, sensitivity, and specificity were 155 mmHg, 65.4%, and 91%, respectively. Serum uric acid, with a threshold of 352.7 μmol/L, showed a sensitivity of 92.3% and a specificity of 67%, and was found to be a significant predictor of preeclampsia/severe preeclampsia in patients with gestational hypertension (p < 0.001).
In gestational hypertensive patients, the assessment of microalbuminuria, serum uric acid, and monitoring of blood pressure indices is recommended to facilitate early prediction of the onset of preeclampsia/severe preeclampsia.
Graphical Abstract
Keywords
- microalbuminuria
- systolic blood pressure
- serum uric acid
- preeclampsia
- eclampsia
- hypertensive
- pregnant
- women
Gestational hypertension during pregnancy is defined as high blood pressure that develops after 20 weeks of gestation, and without the presence of urinary protein. It is observed in approximately 5% of all pregnancies. Gestational hypertension is a primary factor leading to maternal and fetal mortality. Risks associated with gestational hypertension include stroke, multiorgan dysfunction syndrome, and disseminated intravascular coagulation. Additionally, the fetus is at risk of developmental delays (in 25% of preeclampsia cases), premature birth (in 27% of preeclampsia cases) and intrauterine fetal demise (in 4% of preeclampsia cases) [1]. According to an analysis by the World Health Organization (WHO), the maternal mortality rate in developed countries is 16.1%, whereas in Asian countries, it is 9.1% [2]. Annually, preeclampsia is identified as the cause of 42% of global maternal deaths, and it is also responsible for 15% of premature births [3, 4].
The utilization of markers, particularly those already established, is considered a prognostic measure for various conditions such as coronary artery disease and heart failure [5, 6]. As a result, monitoring biomarkers such as creatinine, uric acid (UA), and cystatin C is crucial in predicting and managing preeclampsia. UA concentration, in particular, is used to monitor renal function and correlate with the severity of preeclampsia, serving as both a prognostic marker and a factor in its pathophysiology [7, 8]. Despite its utility, there remains uncertainty in the accuracy of UA in predicting hypertensive disorders of pregnancy [3].
Previous studies have shown that individual biomarkers like UA, creatinine, and cystatin C can predict the risk and outcomes of preeclampsia [9, 10]. However, these studies focused on the prognostic value of single markers Our study addresses this gap in current research by evaluating multiple biomarkers simultaneously, providing a more comprehensive approach to predicting preeclampsia and severe preeclampsia in patients with gestational hypertension. By integrating several biomarkers, we aim to enhance prognostic accuracy and improve the identification of high-risk pregnancies. This novel method holds the potential to inform more effective diagnostic and management strategies, ultimately reducing complications for both mothers and infants.
We performed a cross-sectional analysis study involving 126 gestational hypertensive patients at Can Tho Central General Hospital and Bac Lieu General Hospital from May 2022 to May 2023.
Including criteria: all pregnant women at
Exclusion criteria: pregnant women previously diagnosed and treated for hypertension, those with neurological disorders, those with severe chronic kidney disease, and pre-existing diabetes, and those unwilling to participate in the study will be excluded.
We calculated the sample size for a proportion using the formula with
Sociodemographic and pertinent clinical information, including age, SBP, and DBP, was gathered from the participants. Biochemical and urine characteristics such as a rapid 10-parameter urinalysis, serum creatinine, serum urea, UA, urinary creatinine, microalbuminuria (quantified in mg/L with a random urine sample), were conducted to calculate the albumin/creatinine ratio in urine as a representative measure of albumin/urine/24 h, and cystatin C (quantified in mg/L).
Blood pressure measurements were taken using a validated automatic sphygmomanometer (Omron HEM-7120, Kyoto, Japan). To ensure consistency, all measurements were performed following the American Heart Association (AHA) guidelines, which include having the patient rest for at least 5 minutes before measurement, positioning the arm at heart level, and using an appropriately sized cuff. The sphygmomanometer was calibrated monthly according to the manufacturer’s instructions to maintain accuracy [13]. Each participant’s blood pressure was measured in a quiet environment with minimal distractions. Measurements were taken in triplicate, with a 1–2 minute interval between each reading, and the average of the last two readings was recorded to ensure reliability. The same trained healthcare professional conducted all measurements to minimize inter-operator variability. For the biochemical analyses, serum uric acid levels were drawn intravenously at the hospital after each patient had rested for 30 minutes. The sterilization principle and compliance preservation regime were ensured during testing by use of the comparison color method (enzymatic colorimetric test) using a Coba c 501 analyzer (Roche Diagnostics, Mannheim, Germany) with Uric Acid ver.2 (UA2, ACN 700, Roche Diagnostics, Mannheim, Germany) (serum/plasma). Other common biochemical analyses performed via dipstick testing are chemical tests that usually involve inserting a thin plastic strip called a dipstick into a urine sample. The chemicals on the strip react with the urine and change color to represent different parameter measurements.
Preeclampsia is diagnosed in pregnant women who meet the following criteria:
they must have gestational hypertension, defined as SBP
Severe preeclampsia is diagnosed when any of the following signs present: severe
hypertension (SBP
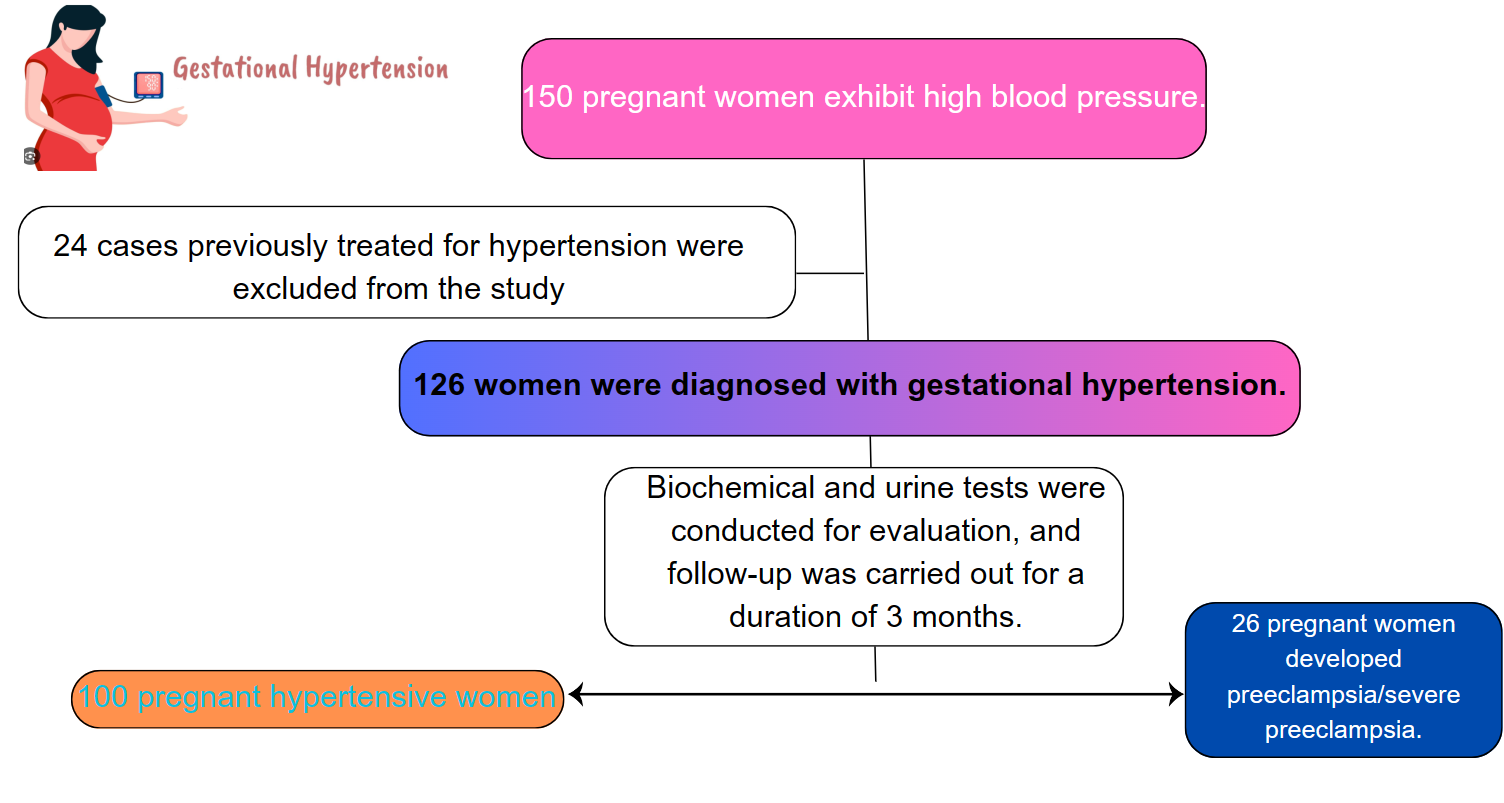 Fig. 1.
Participants flow of the study.
The analysis was conducted using SPSS version 26.0 (IBM Corp., Chicago, IL,
USA). Qualitative variables are described by frequency or proportion.
Quantitative variables are described as mean
The rate of preeclampsia/severe preeclampsia was found to be 20.6%,
particularly within the age group of 20–40 years. In the preeclampsia/severe
preeclampsia group, SBP, DBP, white blood cell count, red blood cell count, urea
levels, microalbuminuria, urine albumin/creatinine ratio, urinary creatinine,
cystatin C, and UA levels were all significantly elevated compared to the
non-preeclampsia group, with differences reaching statistical significance
(p
| Characteristics | Total | Preeclampsia/Severe preeclampsia | p | Z/t | ||
| Yes (n = 26) | No (n = 100) | |||||
| Age (years) | 31.90 |
32.31 |
31.79 |
0.756 | 0.312 | |
| Blood pressure (mmHg) | ||||||
| Systolic | 140 [120–150] | 160 [140–180] | 140 [120–140] | 5.647 | ||
| Diastolic | 90 [80–92.5] | 100 [90–100] | 90 [80–90] | 5.786 | ||
| White blood cell count ( |
11.4 [10.2–13.8] | 11 [9.7–13.7] | 11.5 [10.2–14] | 0.628 | 0.570 | |
| Red blood cell count ( |
4.31 |
4.64 |
4.22 |
3.650 | ||
| Hemoglobin (g/dL) | 12.36 |
12.57 |
12.30 |
0.426 | 0.800 | |
| HCT (%) | 37.86 |
38.82 |
37.61 |
0.235 | 1.194 | |
| Platelet count ( |
221.90 |
196.38 |
228.53 |
0.025 | 2.270 | |
| Urea (mmol/L) | 3.1 [2.5–4.3] | 4.3 [2.9–5.1] | 2.9 [2.4–4] | 0.008 | 3.126 | |
| Serum creatinine (µmol/L) | 68.8 [63.5–74.6] | 73 [63.5–82] | 67.9 [63.5–72.9] | 0.132 | 1.679 | |
| Uric acid (µmol/L) | 349.80 |
443.95 |
325.3 |
5.606 | ||
| Cystatin C (mg/L) | 1.1 [0.9–1.4] | 1.3 [1.1–1.3] | 1.1 [0.9–72.9] | 0.014 | 3.195 | |
| Microalbumin (mg/L) | 20.1 [8.4–103.8] | 500.6 [301.7–635.2] | 14.4 [7.3–39.9] | 7.542 | ||
| Albumin/Creatinin (mg/mmol) | 5.5 [2.5–28.1] | 57.8 [30.6–125.7] | 3.5 [1.9–10.7] | 6.842 | ||
| Urinary creatinin (mg/dL) | 47.8 [28.8–75.9] | 88.3 [47.4–118.2] | 41.7 [25–68.7] | 4.274 | ||
HCT, hematocrit.
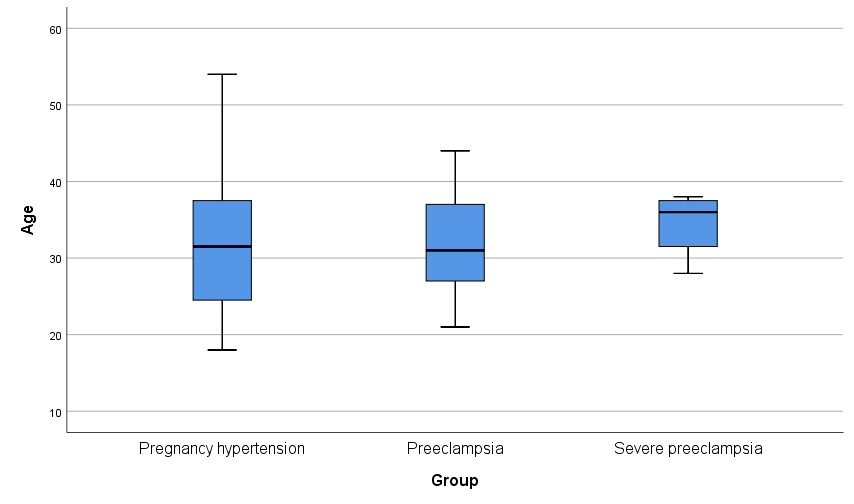 Fig. 2.
Age and blood pressure distribution.
In the logistic regression analysis employing the backward: Wald method, SBP,
creatinine, serum uric acid (SUA), and microalbuminuria emerged as independent
predictors of preeclampsia/severe preeclampsia in patients with gestational
hypertension (p
| Factors | Beta | S.E. | Wald | OR (95% CI) | p |
| Systolic blood pressure (mmHg) | 0.110 | 0.044 | 6.332 | 1.116 (1.025–1.216) | 0.012 |
| Creatinin (µmol/L) | –0.218 | 0.089 | 5.965 | 0.804 (0.675–0.958) | 0.015 |
| Serum uric acid (µmol/L) | 0.019 | 0.008 | 5.688 | 1.019 (1.003–1.035) | 0.017 |
| Microalbumin (mg/L) | 0.021 | 0.006 | 12.881 | 1.022 (1.010–1.034) |
*Variable(s) entered on step 1: SBP, systolic blood pressure; DBP, diastolic blood pressure; WBC, white blood cell count; RBC, red blood cell count; HGB, hemoglobin; HCT, hematocrit; PLT, platelet count; urea; CRE, creatinine; SUA, serum uric acid; CRE-U 2 (mg/dL), urinary creatinine; cystatin C (mg/L); age; A.C, albumin/creatinin; microalbumin, Backward: Wald method.
S.E., standard error; OR, odds ratio; 95% CI, 95% confidence interval.
Microalbuminuria, with a cut-off point of 126.25 mg/L, showed a sensitivity of
96.2%, specificity of 96%, and an area under the curve of 0.981. Regarding SBP,
the cut-off threshold, sensitivity, and specificity were 155 mmHg, 65.4%, and
91%, respectively. SUA, with a cut-off threshold of 352.7, demonstrated a
sensitivity of 92.3%, and specificity of 67%, and proved to be a significant
predictive value for preeclampsia/severe preeclampsia in gestational hypertensive
patients (p
| Factors | Cut off | AUC | Sensitivity (%) | Specificity (%) | 95% CI | p | |
| Preeclampsia/severe preeclampsia | |||||||
| Microalbumin (mg/L) | 126.25 | 0.981 | 96.2 | 96 | 0.956–1.000 | ||
| Systolic blood pressure (mmHg) | 155.00 | 0.850 | 65.4 | 91 | 0.772–0.928 | ||
| Serum creatinine (µmol/L) | 73.300 | 0.607 | 50 | 78 | 0.473–0.741 | 0.093 | |
| Serum uric acid (µmol/L) | 352.7 | 0.815 | 92.3 | 67 | 0.724–0.905 | ||
| Combination of 4 factors | 0.235 | 0.994 | 96 | 97 | 0.986–1.000 | ||
AUC, area under the curve; 95% CI, 95% confidence interval.
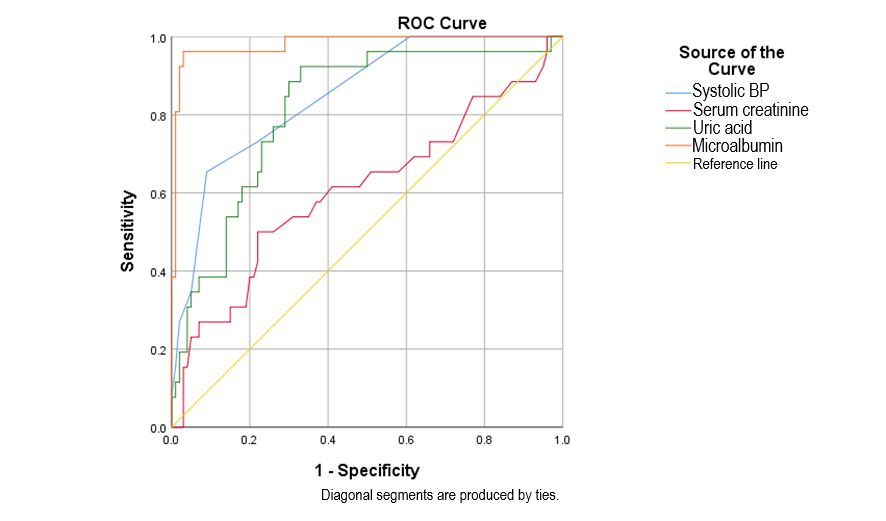 Fig. 3.
ROC curves of microalbuminuria, serum uric acid, systolic blood pressure, serum creatinine in predicting preeclampsia/severe preeclampsia. ROC, receiver operating characteristic; BP, blood pressure.
Our study indicates a preeclampsia/severe preeclampsia rate of 20.6%. Within
this, the age group ranges between 20–40 years, and SBP, creatinine, SUA, and
microalbuminuria are identified as independent risk factors predicting
preeclampsia/severe preeclampsia in pregnant women with gestational hypertension.
Notably, elevated serum UA levels, with an odds ratio (OR) of 1.019, serve as an
important early marker of renal failure and predict adverse fetal outcomes,
particularly in cases of severe gestational hypertension. A study by Bellos et al. (2020) [16] also demonstrated that serum uric acid levels
are elevated in preeclampsia and can be used to predict disease severity and
pregnancy complications. Another study also recommended the use of serum UA as a
reliable marker of preeclampsia severity [17]. In our study, the UA concentration
in the preeclampsia/severe preeclampsia group was 443.95
Microalbuminuria at a threshold of 126.25 mg/L showed high sensitivity and specificity, with an area under the curve of 0.981, indicating its strong predictive value for preeclampsia. SUA at a threshold of 352.7 mg/L demonstrated significant predictive capability with a sensitivity of 92.3% and a specificity of 67%. In contrast, serum creatinine had lower predictive performance, with sensitivity at 50% and specificity at 78%. Several studies on the cut-off thresholds, sensitivity, and specificity of various markers in predicting preeclampsia and severe preeclampsia have been conducted [9, 15, 19]. However, the values vary depending on the demographic characteristics of each study. Notably, emerging biomarkers such as serum endostatin and serum cystatin C showed promising results, with serum endostatin achieving a sensitivity of 86.36% and specificity of 91.18% at initial sampling and serum cystatin C achieving an AUC of 0.934 in the second sampling. These new markers offer the potential for improving the early identification of preeclampsia [20]. ROC plots showed that serum creatinine had greater diagnostic accuracy than SUA, and SUA was more accurate than serum cystatin C [10].
Our study has several limitations that should be considered. Firstly, the single-center design may limit the generalizability of our findings and introduce potential selection bias, as the study sample may not fully represent the broader population. Additionally, there is a possibility of measurement bias due to the reliance on specific diagnostic criteria and assessment methods used at our center. Furthermore, the relatively short follow-up period might not capture long-term outcomes or the full impact of the interventions. Despite these limitations, the favorable outcomes observed in our study suggest that future research could benefit from exploring the use of simple, readily available markers to enhance both treatment and prevention strategies.
Starting from the 20th week of gestation onwards, pregnant women who develop hypertension should be tested for creatinine, serum uric acid, and microalbuminuria, as these factors independently predict the risk of preeclampsia/severe preeclampsia. Microalbuminuria, with its remarkable predictive value and diagnostic accuracy, stands out as one of the most valuable predictive markers for preeclampsia/severe preeclampsia. To effectively apply these findings in clinical practice, it is crucial to integrate these biomarkers into routine prenatal care protocols, with a focus on early detection and intervention. This could involve regular screening and a tiered management approach based on the severity of the test results, while also considering resource availability and the risk of over-treatment.
The data are available from the corresponding author on reasonable request.
Conceptualization: HHN, LTN, THN, AVT; methodology: HHN, THN; software: THN, KTN; formal analysis: PHT, THN, CMT; data curation: PHT, SKT, THN; writing original draft preparation: AVT, THN, HHN, KTN, CMT; writing – review & editing: HHN, THN, CMT. All authors contributed to editorial changes in the manuscript. All authors read and approved the final manuscript. All authors have participated sufficiently in the work and agreed to be accountable for all aspects of the work.
This study was conducted by the principles outlined in the Helsinki Declaration. All patients gave informed consent and were aware of the study’s purpose and methods. They could withdraw at any time without affecting their treatment. The study was approved by the Ethics Committee in Biomedical Research at Can Tho University of Medicine and Pharmacy (No.105 Date:10/5/2022).
We would like to thank Can Tho University of Medicine and Pharmacy for creating favorable conditions for this study to be carried out.
This research received no external funding.
The authors declare no conflict of interest.
References
Publisher’s Note: IMR Press stays neutral with regard to jurisdictional claims in published maps and institutional affiliations.