


 , Xiaoyu Chen 3,*, Lirong Zhang 1, Wanhong Chen 3
1 Department of Medical Imaging, The Affiliated Hospital of Jiangsu University, 212001 Zhenjiang, Jiangsu, China
2 Huai’an Hospital of Traditional Chinese Medicine, 223002 Huai’an, Jiangsu, China
3 Department of Radiology, The Affiliated Huai’an Hospital of Xuzhou Medical University, 223001 Huai’an, Jiangsu, China
Abstract
Epithelial ovarian cancer (EOC) is among the top 5 causes of cancer-associated death in women. We explored the diagnostic value of 3.0 T magnetic resonance imaging (MRI) combined with carbohydrate antigen 125 (CA125) and human epididymis protein 4 (HE4) on EOC.
Among 380 ovarian space-occupying patients in this retrospective analysis, 344 were included, 59 were excluded, 25 had incomplete clinical data, and 260 were finally included as the subjects. Patients were classified into the EOC (110 patients with EOC) and N-EOC (150 patients without EOC) groups. The levels of interleukin-6 (IL-6), C-reactive protein (CRP), follicle stimulating hormone (FSH), luteinizing hormone (LH), anti-mullerian hormone (AMH), CA125, and HE4 were determined. The apparent diffusion coefficient (ADC) value and the clinical diagnostic value of MRI, CA125, HE4, and their combination were analyzed.
There were significant differences in tumor family history, gravidity, parity, IL-6, CRP, FSH, LH, AMH, and ADC value between EOC and N-EOC patients (all p < 0.05). EOC patients exhibited highly-expressed CA125 and HE4 (p < 0.01). CA125/HE4 expression was correlated with the clinicopathological features of EOC, while the ADC value was correlated with the EOC tumor diameter (all p < 0.05). MRI [area under the curve (AUC) = 0.77], CA125 (AUC = 0.85) and HE4 (AUC = 0.90) had certain diagnostic value for EOC (all p < 0.05).
The prevalence of EOC in ovarian space-occupying patients with highly-expressed CA125 and HE4 is higher. MRI combined with CA125 and HE4 has high clinical diagnostic value for EOC.
Keywords
- epithelial ovarian cancer
- 3.0 T magnetic resonance imaging
- carbohydrate antigen 125
- human epididymis protein 4
- clinicopathological features
- pathological diagnosis
- diagnostic value
Ovarian cancer (OC) ranks as the fifth most common cause of cancer-related mortality among women, and it is also one of the three types of cancers affecting the female reproductive system [1]. Due to the low physiological and anatomical position of the ovary, discerning lesions is challenging, and the majority (70%) of patients receive treatment during the late stage, with only a small number being eligible for early treatment. Epithelial ovarian cancer (EOC) constitutes approximately 90–95% of malignant tumors in the ovaries [2], but owing to the asymptomatic development of EOC and early peritoneal dissemination, the 5-year survival rate of OC is only 25%–30%. Therefore, clinical scholars have suggested the creation of efficient screening biomarkers and early illness detection techniques to enhance the rate of early diagnosis for EOC and upgrade the survival rate, which is a crucial responsibility in the field of therapeutic gynecological management [3, 4].
Tumor serum markers have emerged as a prominent direction of research in recent years, possessing the benefits of being uncomplicated, easy, minimally invasive, and cost-effective [5]. Carbohydrate Antigen 125 (CA125) is a large glycoprotein found on chromosome 19p13.2 functioning as a protective barrier for epithelial cells against pathogens through the formation of a sugar-containing barrier; however, it can also hinder the viability of killer cells, compromise the immune surveillance of cancer cells, and act as a widely utilized tumor marker for EOC globally [6]. There is evidence that approximately 50% of patients with EOC display an increased level of CA125 during the initial phase, whereas 18% have a CA125 value that falls within the normal range, hence constraining its sensitivity, and some patients with benign ovarian space-occupying show augmented CA125, limiting its specificity [7, 8]. Consequently, the diagnosis of EOC cannot rely solely on the serum CA125 test but needs to be further combined with serum tumor markers with higher specificity.
Reportedly, human epididymis protein 4 (HE4) exerts its effects on many molecular pathways involved in OC cell proliferation, metastasis and invasion, which influences the makeup of the tumor microenvironment and the immune response in the ovaries [9]. Despite wide distribution, HE4 is only overexpressed under pathological conditions, with its content low under normal conditions; HE4 has high specificity for EOC and overcomes the traditional limitations of CA125 [10]. Nevertheless, clinical practice has found that there is still some misdiagnosis and underdiagnosis during the diagnosis of EOC by CA125 combined with HE4. Evidence from clinical practice reveals that serum tumor indicators present obstacles to providing an intuitive understanding of tumor biological properties and surrounding organ invasiveness and can’t reliably distinguish the specific nature of ovarian space-occupying [11]. Magnetic resonance imaging (MRI) is a highly advanced and extensively utilized imaging technique that encompasses multiple sequences, parameters, and orientations, which offers excellent tissue and spatial resolution, minimal ionizing radiation, and is suitable for qualitative investigation of ovarian masses [12]. The determination of benign and malignant ovarian space-occupying by imaging features alone is also limited. Therefore, clinical attention will be turned to the combination of imaging and serum tumor markers. Currently, there are many clinical analyses on the combined detection of CA125 and HE4, but there are few reports on the diagnostic value for EOC by 3.0 T MRI combined with CA125 and HE4. This study aimed to assess the diagnostic efficacy of 3.0 T MRI in combination with CA125 and HE4 for EOC and analyze the relationship between CA125 and HE4 levels with the clinical characteristics of ovarian space-occupying patients, with the goal of offering novel insights for the clinical prognosis and treatment of EOC.
This study retrospectively analyzed 380 patients with ovarian space-occupying who underwent surgical treatment at The Affiliated Huai’an Hospital of Xuzhou Medical University between August 2020 and August 2023. Among them, 344 patients with ovarian space-occupying conformed to the inclusion criteria, 59 were excluded according to the exclusion criteria, 25 had incomplete clinical data, and 260 patients with ovarian space-occupying were eventually enrolled in this study. According to the results of the pathological examination, 110 patients with EOC were assigned as the EOC group (7 cases of endometrial carcinoma, 22 cases of mucinous, 81 cases of serous), and 150 patients without EOC as the N-EOC group (9 patients with non-epithelial OC, including 5 cases of immature teratoma, 3 cases of anaplastic cell tumor, and 1 case of yolk sac tumor among ovarian germ cell tumors, and the others were patients with benign ovarian diseases). The diagnosis and classification of female genital tumors were based on the classification criteria of the World Health Organization (WHO) for female genital tumors in 2020 [13, 14, 15].
The inclusion criteria were as follows: (1) first diagnosis of ovarian
space-occupying without any treatment; (2) had accepted surgical treatment and
preoperative MRI examination, with definite ovarian space-occupying type
determined by postoperative pathology; (3) complete clinical data; (4)
The exclusion criteria were as below: (1) complications of other benign or malignant tumors in women; (2) complications of cardiovascular, cerebrovascular, blood system and liver/kidney function diseases, as well as infectious and infectious diseases; (3) complications of endocrine diseases such as diabetes and hyperthyroidism; (4) had received blood transfusions, consumed alcohol, developed acute infections, or used antibiotics or anticoagulants within two weeks before retaining serum tumor markers; (5) a history of abdominal surgery in the past 3 months; (6) menstrual, pregnancy, lactation women.
EOC pathological diagnostic criteria [13, 14, 15, 16, 17]: The diagnosis was made according to the 2020 WHO classification criteria for female genital tumors. Pathologic examination revealed hyperplastic epithelium protruding to form papillae, showing multiple papillary branches, dense papillary hyperplasia, papillary ectodermal or extraperitoneal implants, regular nipple structure and nucleus, atypical hyperplasia of epithelial cells, different nucleus size and shape, and increased chromatin and nuclear division.
The body mass index (BMI), age, tumor family history,
gravidity, parity, menopausal status, interleukin (IL)-6,
C-reactive protein (CRP), follicle stimulating hormone (FSH), luteinizing hormone
(LH), anti-mullerian hormone (AMH), apparent diffusion coefficient (ADC) value,
carbohydrate antigen 125 (CA125), and human epididymis protein 4 (HE4) of all
subjects were recorded. The enrolled patients had 5 mL of elbow vein blood drawn
on an empty stomach in the early morning of the next day of admission. The blood
was then centrifuged at 3000
ELISA was used to determine the expression levels of IL-6, CRP, FSH, LH and human AMH in the serum of all subjects. CLIA was utilized to measure the expression patterns of CA125 and HE4 in serum. Specific procedures were strictly carried out following the operating instructions of the IL-6 kit (orb1532209, Biorbyt, Waterbeach, Cambridge, UK), CRP kit (LM-EL-1865, LMAI Bio, Shanghai, China), FSH kit (LM-EL-6467, LMAI Bio, Shanghai, China), LH kit (LM-EL-6364, LMAI Bio, Shanghai, China), AMH kit (LM-EL-1041, LMAI Bio, Shanghai, China), CA125 kit (MZ095925, Beetle Biological Products Co., Ltd., Suzhou, Jiangsu, China) and HE4 kit (AT03CHE4, Anti Biotechnology Co., Ltd., Shenzhen, Guangdong, China).
All patients underwent pelvic MRI examination before operation. The intestinal
tract was emptied and cleaned before examination. The pelvis was scanned using a
3.0 T MRI scanner (MAGNETOM Prisma, SIEMENS AG FWB, Munich, Germany).
The instrument parameters were set as follows: (1) T1-weighted imaging (T1WI): fast spin echo sequence
was utilized, the repetition time (TR) = 545 ms, echo time (TE) = 25 ms, the
number of signal averages (NSA) = 2, flip angle = 90°, layer thickness =
5 mm, layer spacing = 1 mm, matrix = 256
MRI positive was determined when the tumor lump was large and lobulated, with papillary protrusions or solid masses in the cystic cavity, adhesion to adjacent organs, an irregular boundary, and an unclear boundary; the microvascular morphology was uneven, which was substantive or cystic solid, or there were pelvic organ infiltration, lymph node enlargement, ascites, and planting; the T1WI and T2WI signals were complex, with diverse density and apparent enhancement (Supplementary Figs. 1,2).
SPSS 21.0 (IBM Corp., Armonk, NY, USA), MedCalc 19.0 (MedCalc Software Ltd.,
Ostend, Belgium) and GraphPad Prism 8.01 software (GraphPad Software, San Diego,
CA, USA) were utilized for data analysis and graph plotting. The
Kolmogorov-Smirnov test was used to assess the conformity of the data to normal
distribution. The normally distributed measurement data were exhibited as mean
The clinical data of patients with ovarian tumors (n = 260)
who underwent surgical treatment in The Affiliated Huai’an Hospital of Xuzhou Medical University
from August 2020 to August 2023 were collected for analysis (Table 1). Among
them, 110 patients with EOC were included in the EOC group, and 150 patients
without EOC were included in the N-EOC group. There were no statistically
significant differences in age, BMI, or menopausal status when
comparing the EOC group with the N-EOC group (all p
| EOC (n = 110) | N-EOC (n = 150) | z/ |
p | ||
| Age (years) | 58.93 |
58.31 |
0.92 | 0.36 | |
| BMI (kg/m2) | 24.48 |
24.20 |
1.408 | 0.16 | |
| Tumor family history (cases, %) | - | - | 19.68 | ||
| Yes | 28 (25.45) | 9 (6.00) | |||
| No | 82 (74.55) | 141 (94.00) | |||
| Gravidity (cases, %) | - | - | 19.43 | ||
| 70 (63.64) | 54 (36.00) | ||||
| 40 (36.36) | 96 (64.00) | ||||
| Parity (cases, %) | - | - | 22.84 | ||
| 68 (61.82) | 48 (32.00) | ||||
| 42 (38.18) | 102 (68.00) | ||||
| Menopausal status (cases, %) | - | - | 0.09 | 0.77 | |
| Yes | 81 (73.64) | 108 (72.00) | |||
| No | 29 (26.36) | 42 (28.00) | |||
| IL-6 (µg/L) | 405.83 (205.12, 567.65) | 260.33 (173.76, 554.89) | 12.28 | ||
| CRP (mg/L) | 24.03 (7.02, 44.31) | 13.61 (4.38, 55.02) | 15.04 | ||
| FSH (IU/mL) | 19.13 (4.47, 42.82) | 10.78 (1.00, 41.87) | 13.36 | ||
| LH (IU/L) | 18.45 (5.78, 33.14) | 14.00 (1.21, 37.40) | 8.23 | ||
| AMH (mg/mL) | 9.27 (2.10, 27.47) | 6.42 (0.55, 11.19) | 11.09 | ||
| ADC value | 0.98 (0.06, 1.70) | 2.55 (1.51, 5.99) | 34.84 | ||
Note: BMI, body mass index; IL-6, interleukin-6; CRP, C-reactive protein; FSH,
follicle stimulating hormone; LH, luteinizing hormone; AMH, anti-mullerian
hormone; EOC, epithelial ovarian cancer; N-EOC, patients
without EOC; ADC, apparent diffusion coefficient; SD, standard deviation. Measurement data conforming to
normal distribution were depicted as mean
Clinicopathological characteristics of OC patients were analyzed by pathological
examination. The results (Table 2) showed that the EOC group and the N-EOC group
exhibited distinct disparities in terms of tumor stage, pathological type, degree
of differentiation, tumor location, tumor diameter, and lymph node metastasis
(all p
| EOC (n = 110) | N-EOC (n = 150) | p | |||
| Tumor staging (cases, %) | - | - | 5.250 | 0.022 | |
| Early stage (stages I–II) | 40 (36.36) | 76 (50.67) | |||
| Late stage (stages III–IV) | 70 (63.64) | 74 (49.33) | |||
| Pathological type (cases, %) | - | - | 10.840 | 0.004 | |
| Endometrioid carcinoma | 7 (6.36) | 2 (1.33) | |||
| Mucosity | 22 (20.00) | 15 (10.00) | |||
| Serosity | 81 (73.64) | 133 (88.67) | |||
| Differentiation degree (cases, %) | - | - | 13.002 | 0.002 | |
| Low differentiation | 25 (22.73) | 11 (7.33) | |||
| Middle differentiation | 52 (47.27) | 79 (52.67) | |||
| High differentiation | 33 (30.00) | 60 (40.00) | |||
| Tumor location (cases, %) | - | - | 8.298 | 0.004 | |
| Unilateral | 69 (62.73) | 67 (44.67) | |||
| Bilateral | 41 (37.27) | 83 (55.33) | |||
| Tumor diameter (cases, %) | - | - | 8.818 | 0.003 | |
| 92 (83.64) | 101 (67.33) | ||||
| 18 (16.36) | 49 (32.67) | ||||
| Lymph node metastasis (cases, %) | - | - | 4.248 | 0.039 | |
| Yes | 45 (40.91) | 43 (28.67) | |||
| No | 65 (59.09) | 107 (71.33) | |||
Note: The count data were expressed as (%). Comparisons of count data between groups were performed using the Chi-square test. EOC, epithelial ovarian cancer; N-EOC, patients without EOC.
Subsequently, the expression levels of CA125 and HE4 in the serum of patients
with ovarian space-occupying were determined by CLIA. As shown in Fig. 1 the
expression of CA125 in the EOC group [127.33 (21.84, 293.22) U/mL] was
dramatically higher than that in the N-EOC group [36.55 (17.91, 150.51) U/mL],
and notably higher HE4 expression was also observed in the EOC group [112.16
(42.45, 196.07) pmol/mL] than in the N-EOC group [52.01 (19.10, 160.50) pmol/mL]
(p
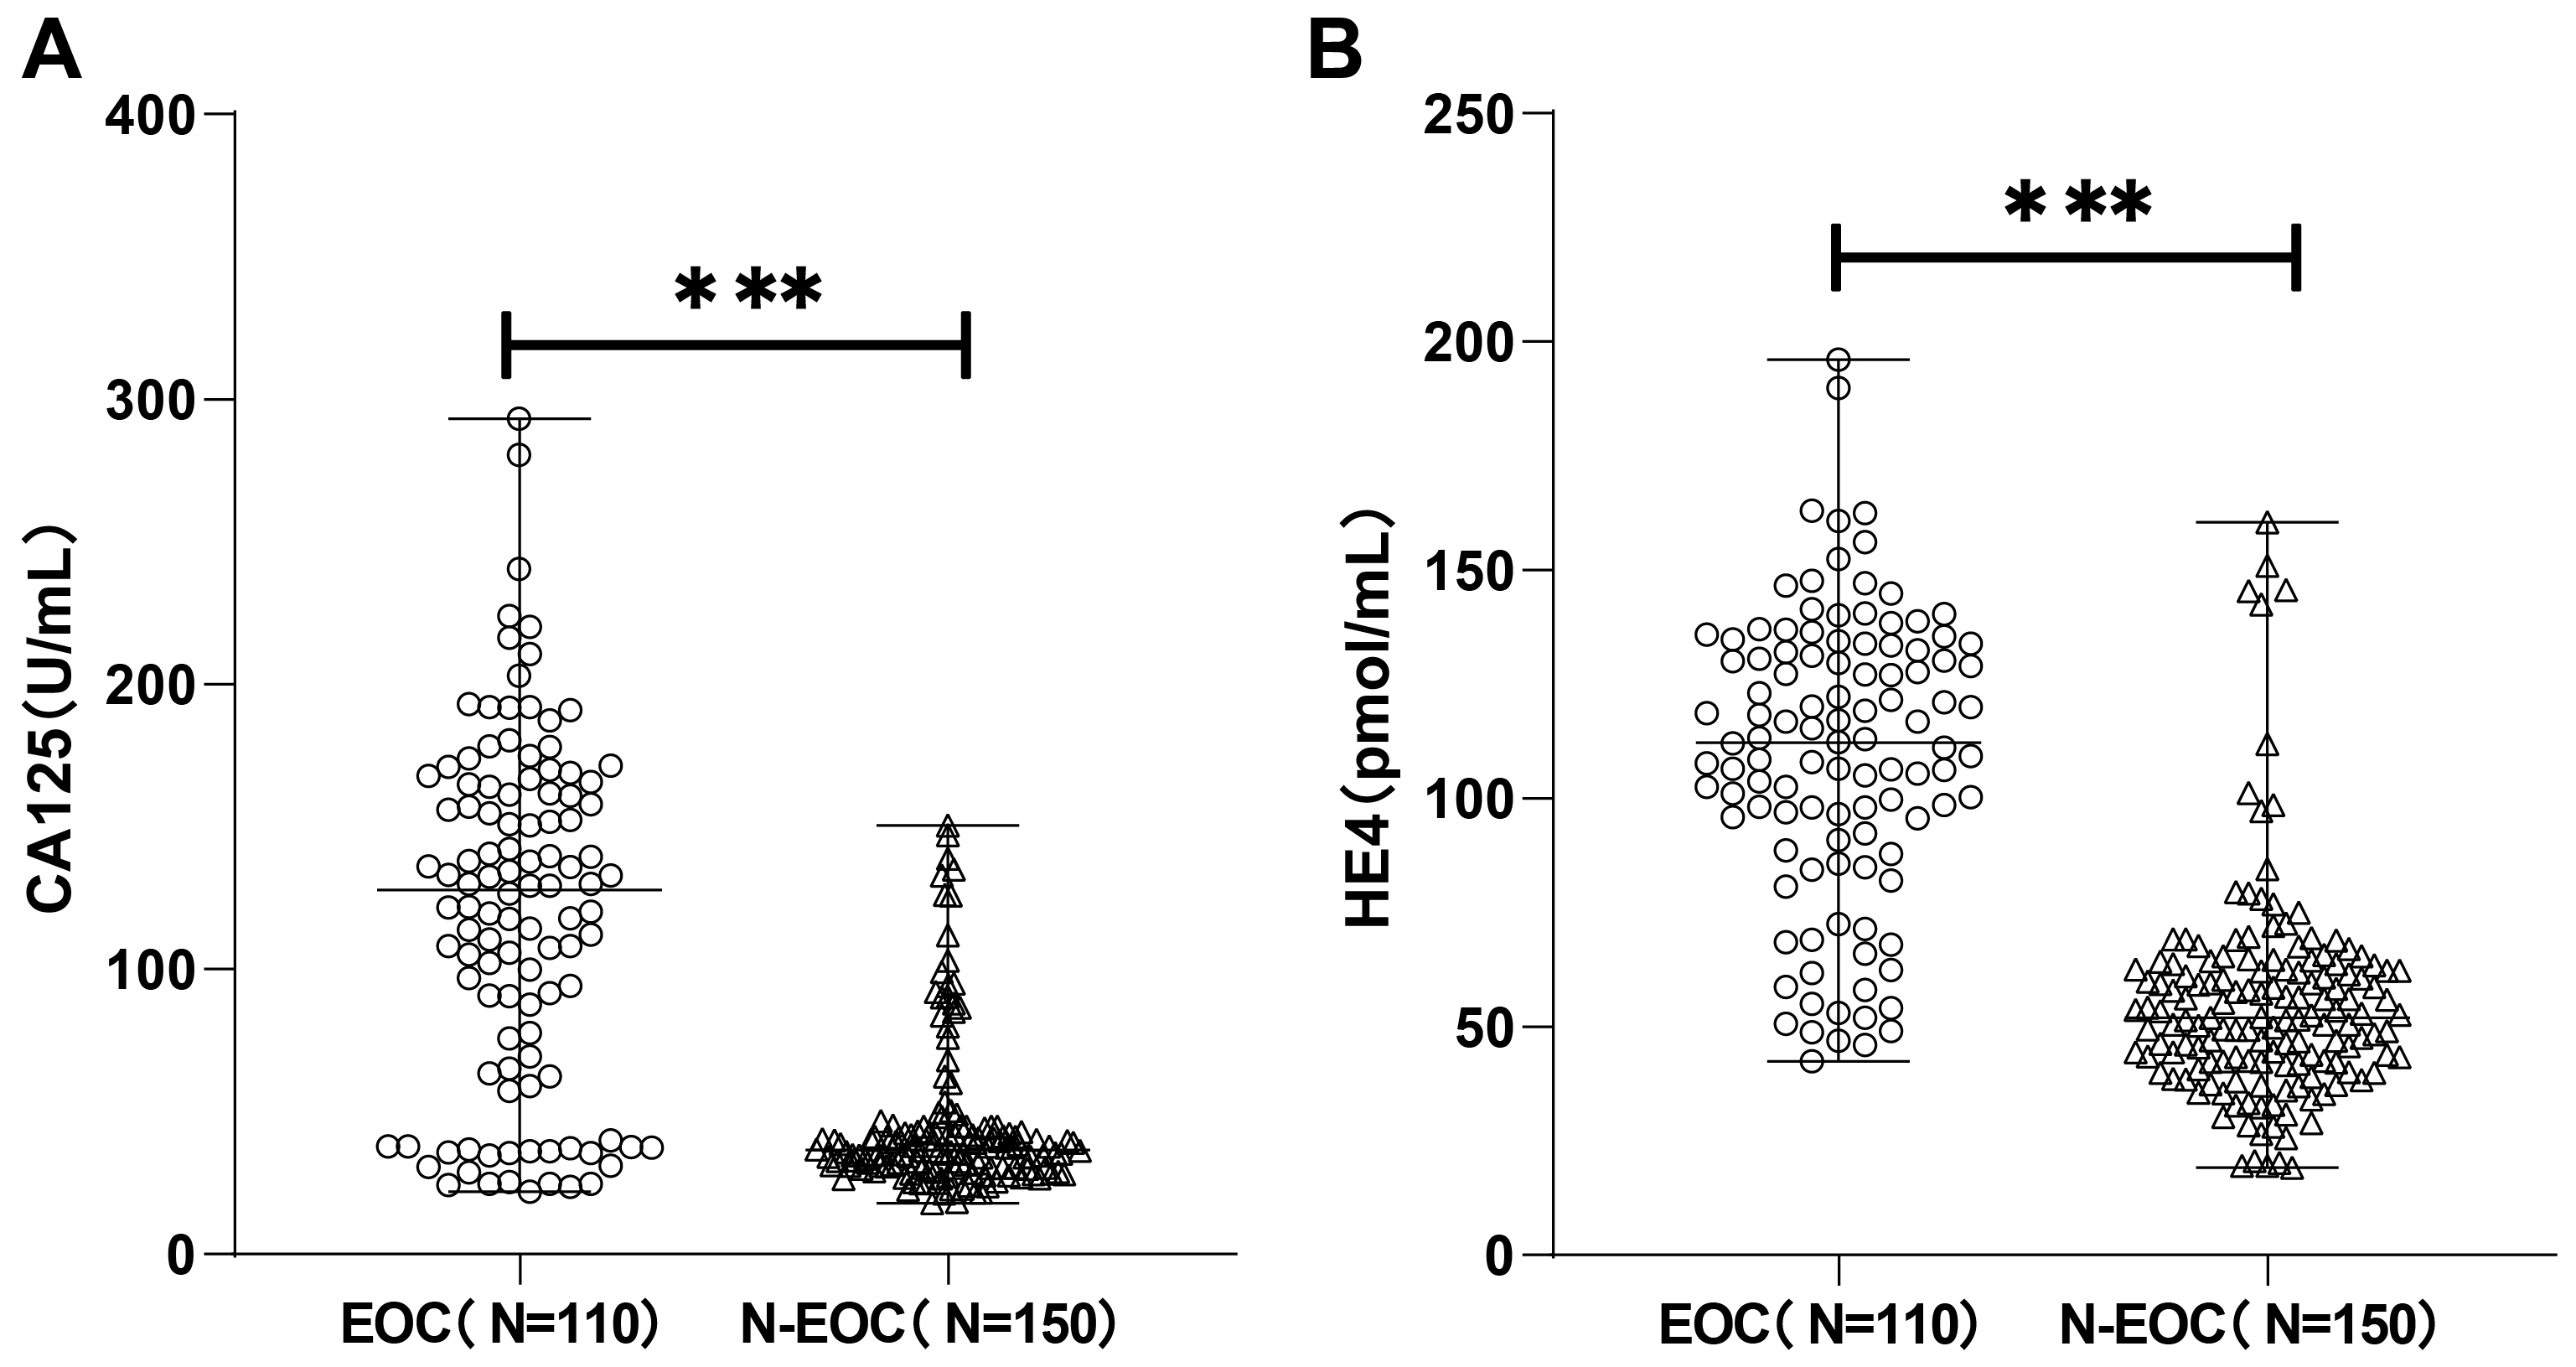 Fig. 1.
Carbohydrate antigen 125 (CA125) and human epididymis protein 4
(HE4) were highly expressed in epithelial ovarian cancer (EOC) patients. The
expression of CA125 (A) and HE4 (B) was detected by chemiluminescence immunoassay
(CLIA), and the Kolmogorov-Smirnov test was used to test for normal distribution,
and the non-normally distributed measures were expressed as
the median (minimum, maximum), and comparisons between groups
were made using the Mann-Whitney U test, *** p
We analyzed the clinicopathological features
of EOC patients by pathological examination and analyzed the expression of CA125
in EOC patients with varying clinicopathological features. The results (Table 3)
depicted notable differences in CA125 expression in EOC patients with distinct
tumor stages, tumor diameters, tumor sites, and pathological types (all
p
| Item | Cases | CA125 (U/mL) | z/H | p | HE4 (pmol/mL) | t/z/H | p | ADC value | T/F | p | |
| Tumor staging | Early stage (stages I–II) | 40 | 76.68 (21.84, 117.92) | 7.02 | 105.78 (42.45, 119.24) | 3.55 | 1.01 |
0.84 | 0.40 | ||
| Late stage (stages III–IV) | 70 | 153.42 (35.62, 293.22) | 128.31 (46.97, 196.07) | 0.95 | |||||||
| Pathological type | Endometrioid carcinoma | 7 | 57.33 (21.84, 94.04) | 24.10 | 101.07 (42.45, 108.42) | 23.315 | 0.88 |
0.98 | 0.38 | ||
| Mucosity | 22 | 64.26 (23.71, 293.22) | 85.29 (46.00, 107.93) | 1.02 | |||||||
| Serosity | 81 | 137.81 (35.54, 220.15) | 122.17 (46.97, 196.07) | 0.98 | |||||||
| Differentiation degree | Low differentiation | 25 | 105.71 (21.84, 280.44) | 5.93 | 0.05 | 106.15 (46.00, 147.07) | 6.07 | 0.05 | 0.96 |
0.26 | 0.77 |
| Middle differentiation | 52 | 133.05 (30.67, 293.22) | 122.60 (46.97, 189.88) | 0.97 | |||||||
| High differentiation | 33 | 102.17 (23.71, 240.51) | 101.07 (42.45, 196.07) | 1.00 | |||||||
| Tumor site | Unilateral | 69 | 105.82 (21.84, 216.23) | 5.33 | 106.48 (42.45, 132.01) | 4.50 | 0.98 |
0.78 | 0.44 | ||
| Bilateral | 41 | 161.61 (37.19, 293.22) | 135.90 (46.97, 196.07) | 0.94 | |||||||
| Tumor diameter | 92 | 126.10 (25.28, 293.22) | 2.63 | 114.56 |
4.28 | 0.93 |
3.61 | ||||
| 18 | 86.39 (21.84, 280.44) | 81.74 |
1.16 | ||||||||
| Lymphatic metastasis | Yes | 45 | 129.24 (21.84, 240.51) | 0.07 | 0.94 | 113.04 |
1.05 | 0.30 | 0.96 |
0.19 | 0.85 |
| No | 65 | 120.13 (24.28, 293.22) | 106.53 |
0.97 | |||||||
Note: Measurement data of normal distribution were expressed as mean
The examination using a 3.0 T magnetic resonance scanner revealed the following
results (Table 4): there were 95 positive patients, out of which 75 were true
positive and 20 were false positive; there were 156 negative patients, out of
which 35 were false negative and 121 were true negative. As illustrated in Fig. 2, ROC curve analysis using SPSS found that MRI [area under the curve (AUC) =
0.77] had certain diagnostic value for EOC. Furthermore, ROC curve analysis (Fig. 2, Table 5) found that both CA125 (AUC = 0.85, cut off at 53.23) and HE4 (AUC =
0.90, cut off at 79.51) had certain diagnostic value for EOC. The clinical
diagnostic value of MRI combined with CA125 and HE4 (combination) for EOC
patients was significantly higher than that of MRI, CA125, or HE4 alone, and the
AUC was 0.97 (p
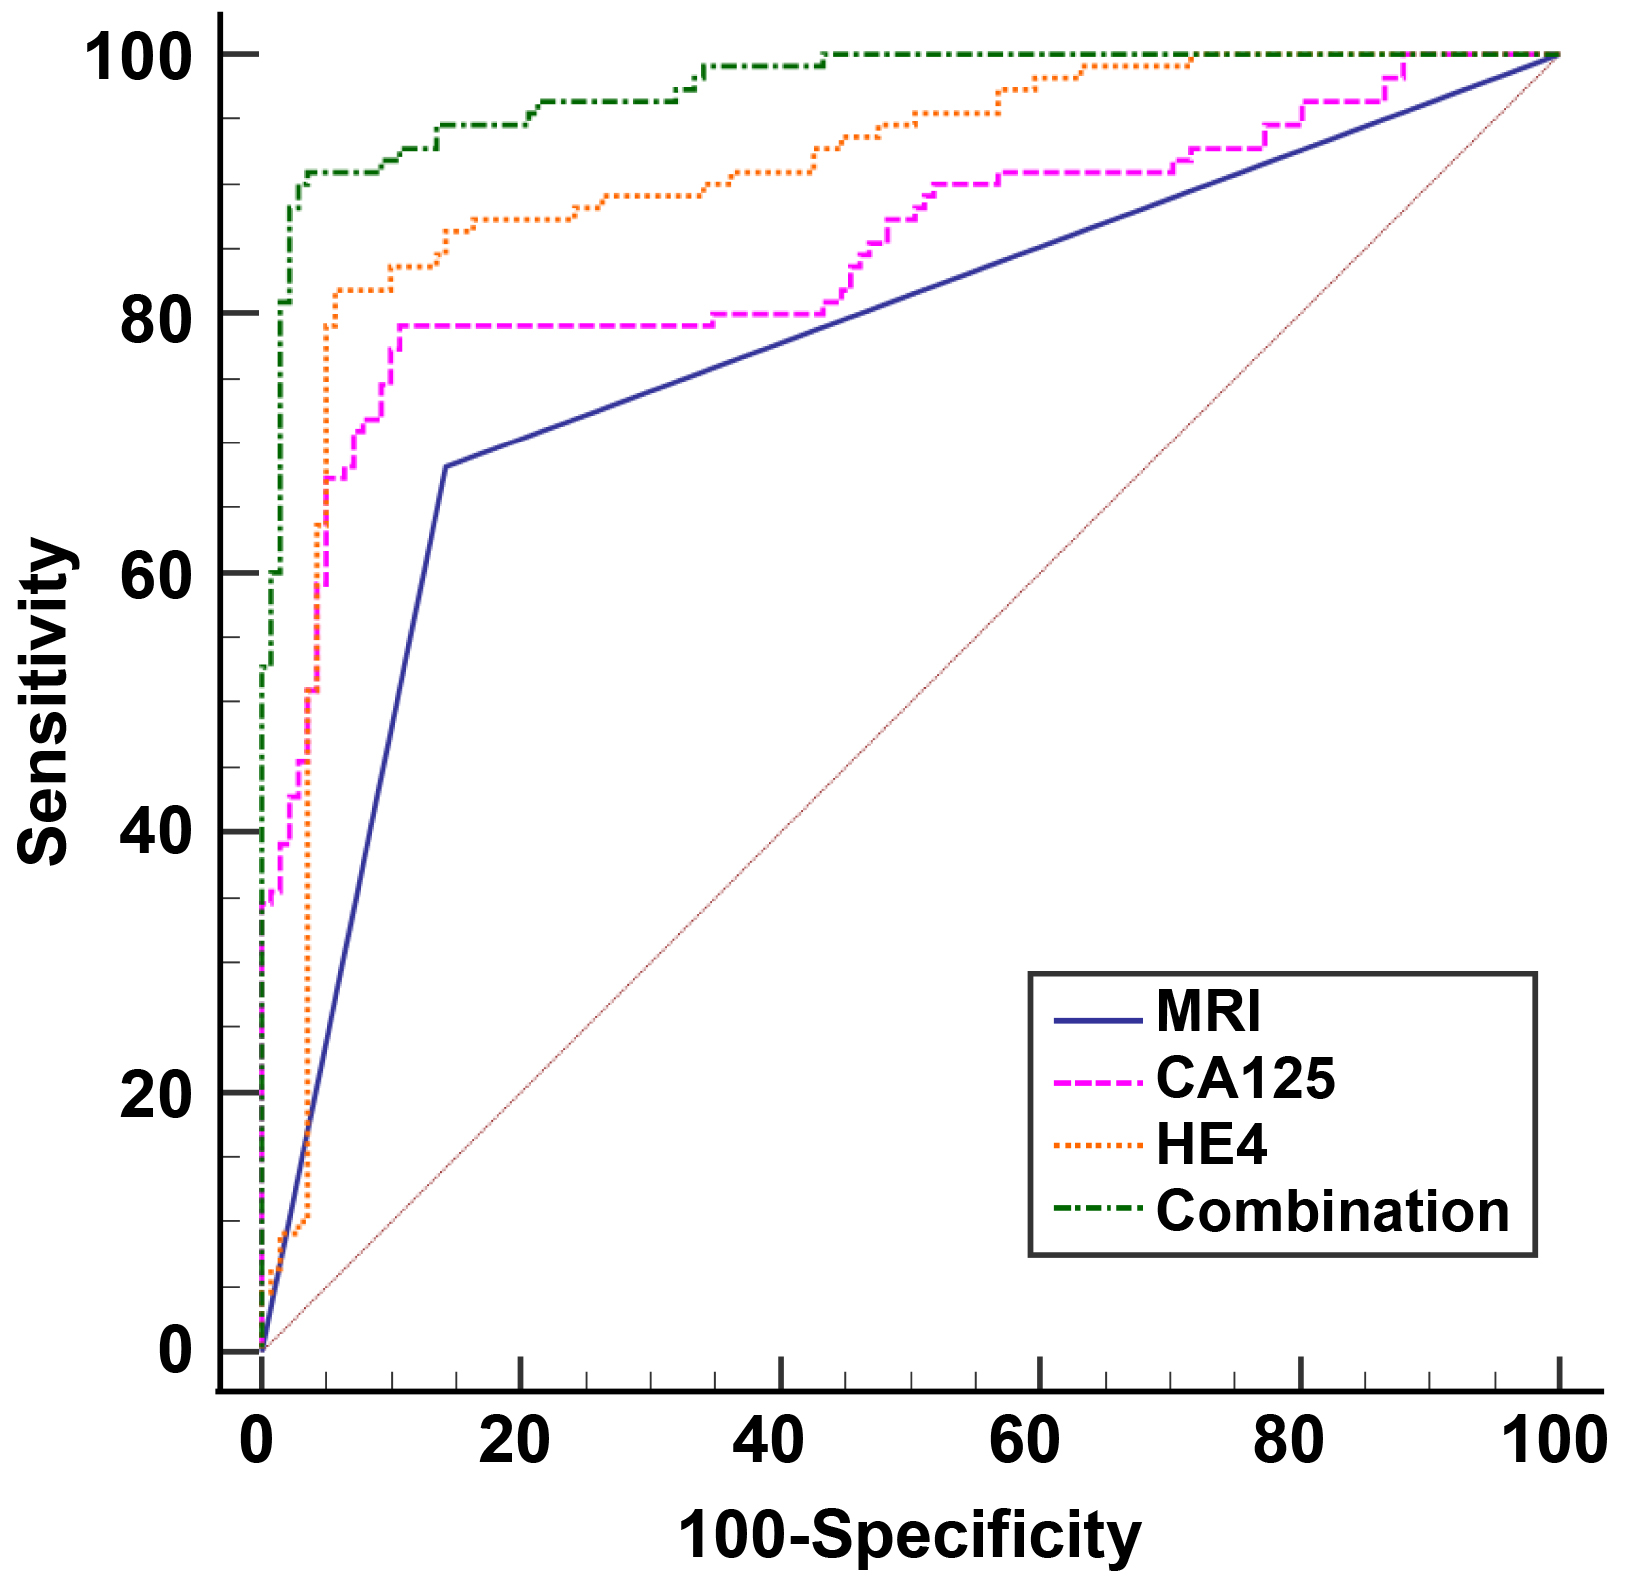 Fig. 2.
The clinical value of MRI, CA125, HE4, and the combined detection of three indexes in patients with EOC. ROC curves were employed to analyze the clinical diagnostic value of HE4, MRI, CA125, and combined triple-index testing in patients with EOC. ROC, receiver operating characteristic; CA125, carbohydrate antigen 125; HE4, human epididymis protein 4; EOC, epithelial ovarian cancer; MRI, magnetic resonance imaging.
| Pathological examination | Total | |||
| Positive | Negative | |||
| MRI | Positive | 75 | 20 | 95 |
| Negative | 35 | 121 | 156 | |
| Total | 110 | 141 | 251 | |
EOC, epithelial ovarian cancer; MRI, magnetic resonance imaging.
| Item | Sensitivity | Specificity | AUC | p | 95% CI | Cut-off |
| MRI | 68.18 | 85.82 | 0.77 | 0.71–0.82 | - | |
| CA125 | 79.09 | 89.36 | 0.85 | 0.80–0.89 | 53.23 | |
| HE4 | 81.82 | 94.33 | 0.90 | 0.86–0.94 | 79.51 | |
| Combination | 90.91 | 96.45 | 0.97 | 0.95–0.99 | 0.53 |
CA125, carbohydrate antigen 125; HE4, human epididymis protein 4; EOC, epithelial ovarian cancer; MRI, magnetic resonance imaging; AUC, area under the curve; CI, confidence interval.
| EOC (n = 110) | N-EOC (n = 150) | Total | |
| High CA125 expression | 87 (79.09) | 24 (16.00) | 111 |
| Low CA125 expression | 23 (20.91) | 126 (84.00) | 149 |
| 103.25 | 260 | ||
| p | |||
| EOC (n = 110) | N-EOC (n = 150) | Total | |
| High HE4 expression | 93 (84.55) | 3 (2.00) | 96 |
| Low HE4 expression | 17 (15.45) | 147 (98.00) | 164 |
| 185.66 | 260 | ||
| p | |||
CA125, carbohydrate antigen 125; HE4, human epididymis protein 4; EOC, epithelial ovarian cancer; N-EOC, patients without EOC.
EOC is highly prevalent, with roughly three-quarters of women being diagnosed at an advanced stage (stage III or IV) where the disease has already progressed beyond the pelvis [18]. OC is classified as either epithelial or non-epithelial, with epithelial ovarian cancer comprising endometrioid carcinoma, mucinous cystadenocarcinoma, and serous cystadenocarcinoma [14]. Non-epithelial OC encompasses dysgerminoma, yolk sac tumor, and immature teratoma in ovarian germ cell tumors [15]. Unfortunately, the absence of dependable prognostic indicators, limited understanding of its tumor biology, and resistance to chemotherapy all lead to elevated recurrence rates and unfavorable prognosis of EOC [19, 20]. Imaging techniques such as MRI or conventional ultrasound have made prominent progress and are capable of detecting the majority of ovarian tumors, but interpreting the imaging characteristics of the ovaries is intricate, and there is still a dearth of precise and sensitive markers to differentiate between benign and malignant ovarian tumors [21, 22]. Notably, biomarkers such as CA125 and HE4 may possess great potential for enhancing the diagnosis and treatment of EOC [23, 24]. In light of this, this study aimed to determine whether 3.0 T MRI combined with CA125 and HE4 could effectively diagnose EOC.
Currently, CA125 is the most widely used biomarker for clinical ovarian tumors.
CA125 was initially identified in 1982 as a biomarker of diagnosis for women with
EOC [25, 26]. HE4 was first identified in human epididymal epithelial cells and
was proven to be strongly expressed in OC, specifically in serous OC and
endometrioid carcinoma [27]. The results of the present study also showed that
A125 and HE4 were highly expressed in EOC patients, which was consistent with the
findings of previous studies [9]. As previously analyzed, cancer invades the
womb, oviduct, and intrahepatic bile ducts, disrupting basement membranes and
cellular interactions, which activate and release substantial CA125 into the
bloodstream, raising serum CA125 levels in OC [28]. Fang et al. [29]
observed notable variations in serum CA125 levels across distinct molecular
subtypes, and the augmented CA125 level consistently indicated the presence of a
large tumor diameter (
ADC is a quantitative diffusion measurement and an important
quantitative indicator for MRI, which is being utilized more frequently to
distinguish and characterize lesions [34]. Specifically, the ADC value was
correlated with the size of the EOC tumor. Similarly, another study has also
mentioned that the ratio of ADC inside the peritumor/tumor region exhibits a
strong correlation with tumor size (p
MRI offers novel opportunities for distinguishing ovarian neoplasms and predicting the progression of EOC [37]. Importantly, the combined application of ultrasound, MRI, and serum tumor markers in identifying OC has resulted in much higher diagnostic accuracy than using any one method alone [28]. To the best of our knowledge, this study innovatively revealed that patients with CA125 and HE4 high expression levels exhibited higher EOC prevalence rates, and the combination of 3.0 T MRI with CA125 and HE4 demonstrated substantially greater clinical diagnostic value in EOC patients than MRI, CA125, or HE4 alone. However, the limitations of this study are as below: the duration of this research is rather short, and the sample collection is limited in scope, with a predominance of solid cystic gland cysts among some benign cysts and a lack of fibrous benign tumors. Additionally, the small size of the solid cystic gland cysts has an impact on the results of the MRI tests. Meanwhile, we did not analyze the prognosis of EOC patients, nor did we explore the interaction between CA125 and HE4. Therefore, to enhance the credibility of the study, it is necessary to extend the time limit for collecting samples, gather additional ovarian cysts from different components of ovarian tissues, reduce the interference of single cysts on image results, investigate the correlation between CA125 and HE4 in EOC patients, and examine the long-term prognosis of EOC patients.
CA125 and HE4 were highly expressed in patients with EOC, while the ADC value of EOC patients was lower. Besides, CA125 and HE4 expression levels and ADC value in EOC patients were related to the clinicopathological features of EOC, and the prevalence of EOC was higher in ovarian space-occupying patients with high expression levels of CA125 and HE4. Further, combined detection of MRI with CA125 and HE4 had high clinical diagnostic value for EOC patients, which could provide positive guidance for clinical EOC prevention, diagnosis, and treatment.
The data that support the findings of this study are available from the corresponding author upon reasonable request.
Guarantor of integrity of the entire study: TC; study concepts: TC and DQW; study design: TC and LRZ; definition of intellectual content: TC and DQW; literature research: TC; clinical studies: TC; experimental studies: TC; data acquisition: TC and WHC; data analysis: TC and XYC; statistical analysis: TC and LRZ; manuscript preparation: TC and XYC; manuscript editing: TC, DQW, LRZ, XYC and WHC; manuscript review: TC and DQW. All authors read and approved the final manuscript. All authors have participated sufficiently in the work and agreed to be accountable for all aspects of the work.
This study was approved by the Academic Ethics Committee of The Affiliated Huai’an Hospital of Xuzhou Medical University (Approval No. HEYLL202404). This study adhered to the ethical criteria outlined in the World Medical Congress Declaration of Helsinki, complied with the applicable norms and rules governing clinical research, and was in accordance with the guidelines provided by the Enhancing the Quality and Transparency Of Health Research (EQUATOR) network. Because this study was a retrospective study, no informed consent was signed.
Not applicable.
This research received no external funding.
The authors declare no conflict of interest.
Supplementary material associated with this article can be found, in the online version, at https://doi.org/10.31083/j.ceog5111242.
References
Publisher’s Note: IMR Press stays neutral with regard to jurisdictional claims in published maps and institutional affiliations.