


 , Peng Lin 1, Yicong Liao 1, Yuemei Xie 1
1 Department of Anesthesiology, Women and Children’s Hospital, School of Medicine, Xiamen University, 361000 Xiamen, Fujian, China
Abstract
Epidural-related maternal fever (ERMF) is a common phenomenon that appears to be unique to laboring women and presents diagnostic and therapeutic dilemmas for anesthesiologists. It is crucial to identify and predict the occurrence of ERMF at an early stage to improve the outcomes for mothers and infants. This study evaluated the degree of sympathetic blockade induced by epidural labor analgesia (ELA) by quantifying blood flow spectral parameters using Pulsed-wave Doppler (PWD). The aim was to determine the predictive value of these parameters for the onset of ERMF.
A total of 103 women who had vaginal deliveries with ELA were recruited into the study. PWD ultrasound was used to measure peak systolic velocity (PSV, cm/s) and end-diastolic velocity (EDV, cm/s) in the anterior and posterior tibial arteries. Measurements were taken 1 minute before induction of analgesia and at 5-minute intervals for the subsequent 30 minutes. The change of PSV (ΔPSV) and EDV (ΔEDV) at 30 minutes relative to baseline after induction of analgesia was calculated. Participants were categorized into two groups based on their body temperature during labor and delivery: febrile and afebrile. Generalized estimating equations were used to assess differences both between and within groups across multiple time points. The correlation between two variables was analyzed using Spearman's rank correlation coefficient. Receiver operating characteristic (ROC) curves were plotted to ascertain the cut-off values of lower extremity arterial ultrasound flow spectral parameters for predicting ERMF.
Of the 103 study participants, 73 were ultimately included for analysis. Thirteen participants (17.8%) in the study developed ERMF. PSV was significantly higher in the febrile group than the non-febrile group at 10 min after ELA (p < 0.05). In contrast, EDV showed a significant difference between the two groups at 15 min after ELA (p < 0.01). Based on linear correlation analysis, there was a positive correlation between PSV and EDV at 30 minutes after analgesia induction and the peak labor temperature (p < 0.05). ROC curve analysis identified a cut-off value of 43.35 and an area under the curve (AUC) of 0.701 for ΔPSV in the anterior tibial artery region (95% confidence interval (CI) 0.525 to 0.878, p = 0.025) and a cut-off value of 29.94 and an AUC of 0.733 for ΔEDV (95% CI 0.590 to 0.877, p = 0.001). The cut-off value for ΔPSV in the region of the posterior tibial artery was 39.96 with an AUC of 0.687 (95% CI 0.514 to 0.860, p = 0.034), and the cut-off value for ΔEDV was 33.10 with an AUC of 0.713 (95% CI 0.558 to 0.869, p = 0.007).
Regional blood flow spectral parameters after epidural analgesia induction can predict the occurrence of ERMF by indirectly reflecting the degree of sympathetic activity inhibition. Specifically, the amount of change in peak systolic velocity and end-diastolic velocity relative to baseline parameters 30 min after ELA induction was the most predictive.
The study has been registered in the Chinese Clinical Trial Registry https://www.chictr.org.cn/ (reference number: ChiCTR2400080507, 31/01/2024).
Keywords
- epidural-related maternal fever
- epidural labor analgesia
- Pulsed-wave Doppler ultrasound
- peak systolic velocity
- end-diastolic velocity
Epidural-related maternal fever (ERMF) is a common phenomenon that appears to be unique to parturient women, posing diagnostic and therapeutic dilemmas for anesthesiologists [1]. For parturients, intrapartum fever can impair uterine contractions, affect labor curves, and increase the rate of vaginal births as well as cesarean sections [2, 3]. Maternal fever can also precipitate adverse neonatal effects. A recent large propensity score-matched cohort study of 37,786 women found that maternal epidural analgesia-associated fever was associated with neonatal infection, including sepsis, unspecified infection, and pneumonia [4]. It is, therefore, crucial to identify and predict the occurrence of ERMF at an early stage to improve maternal and neonatal outcomes.
There is no consensus on the pathophysiology of ERMF. Two widely accepted theories are the sterile inflammatory hypothesis and the thermoregulatory hypothesis [2, 5]. Epidural labor analgesia blocks the sympathetic nerve supply to the cutaneous vasculature, impairing body temperature regulation. Mullington et al. [5] have demonstrated that epidural analgesia can cause an imbalance in thermoregulation, increasing body temperature by blocking sympathetic pathways and reducing heat loss. As such, the extent of the sympathetic blockade in epidural labor analgesia, which may play an essential role in the development of ERMF, is a potential research direction.
We hypothesize that the degree of sympathetic blockade induced by epidural labor analgesia may be related to the development of ERMF. To test this hypothesis, we designed this prospective observational study to quantify the degree of sympathetic blockade using spectral parameters of blood flow obtained by Pulsed-wave Doppler (PWD) ultrasound (US) to predict ERMF. PWD US is one of the most commonly used diagnostic methods for noninvasive vascular examination in clinical practice. Eicke et al. [6] have demonstrated that Doppler ultrasound can quantify sympathetically induced changes in peripheral vascular resistance. Prior studies have utilized regional hemodynamic parameters to evaluate the efficacy of peripheral nerve blocks based on this mechanism [7, 8]. Acquisition of an objective ultrasound-based indicator will assist clinicians in identifying individuals at risk for ERMF early.
This research was conducted as a single-center, prospective observational study at a tertiary care teaching hospital from January to March 2024. The aim was to assess the feasibility of using regional blood flow spectral parameters as predictors for ERMF. Ethical approval for the study was granted by the institutional ethics committee (approval number: KY-2024-009-K01), and the study was registered with the China Clinical Trials Registry https://www.chictr.org.cn/ (reference number: ChiCTR2400080507, 31/01/2024). The methodology and procedures were thoroughly explained to all participants, ensuring complete understanding. Following this, written informed consent was obtained from each participant, adhering to ethical standards and research governance.
Participants in this study were parturients who had epidural analgesia during labor at the Women and Children’s Hospital, School of Medicine, Xiamen university. PASS 14.0 software (NCSS LLC, Kaysville, UT, USA) was employed to determine an appropriate sample size, considering the established principles for studies of this nature. The end-diastolic velocity (EDV) was the primary measure of interest. Drawing on previous literature findings and a pilot study [9], the anticipated area under the receiver operating characteristic (AUROC) for predicting ERMF was established at 0.8. Given the local ERMF incidence rate of approximately 20% and an estimated attrition rate of 10%, it was calculated that a minimum of 60 participants would be required [10]. This sample size was necessary to achieve a statistical power of 90%, with a Type I error probability set at 0.05 [11].
Inclusion criteria:
(1) Individuals aged between 25 to 35 years, having a singleton, primiparous women, full-term birth [2].
(2) Had a vaginal delivery.
(3) Consented to participate in the study, verified by the signing of an informed consent document.
Exclusion criteria:
(1) A preexisting severe cardiorespiratory condition.
(2) Any pregnancy complications that could potentially influence autonomic functions, such as gestational diabetes or gestational hypertension.
(3) A documented history of peripheral vascular disease.
(4) The presence of an active infectious disease, fever, or a basal body temperature of 37.5 °C or higher prior to delivery.
(5) Any contraindications to receiving epidural analgesia during labor.
(6) Severe cognitive or psychiatric disorders that could impair study participation or consent.
(7) The use of medications during the ultrasound parameter measurement phase that could affect peripheral vasoconstriction, including nifedipine.
(8) Any other medical or health conditions deemed by the anesthesiologist to render the individual unsuitable for inclusion in this study.
Upon the onset of regular uterine contractions, participants were admitted to the labor room. The anesthesiologist discussed epidural labor analgesia (ELA)’s advantages and potential risks with the participants before the study commenced. The delivery room temperature was regulated to remain between 24–26 °C, with careful attention paid to maintaining the participant’s bilateral lower extremities warm. Peripheral intravenous access was secured, and a Lactated Ringer’s solution was infused at 2–5 mL/kg/h. An experienced attending anesthesiologist performed the epidural insertions. Continuous real-time monitoring of vital signs was done, including noninvasive blood pressure (NIBP), electrocardiogram (ECG), oxygen saturation (SPO2), and fetal heart rate. For the procedure, participants were positioned in the left lateral decubitus position. The epidural catheter insertion site was selected at the L2/L3 or L3/L4 intervertebral space. The “water resistance disappearing” technique was employed to confirm entry into the epidural space. Upon a successful insertion of the spinal needle, a catheter was inserted into the lumber epidural space to a depth of approximately 3–4 cm. A test dose of 3 mL of 1.5% lidocaine was administered. The participants were then monitored for 3–5 for any signs of local anesthetic toxicity or total spinal anesthesia.
The patient-controlled epidural analgesia pump (DDB-I-A1, Apollo, Nantong, Jiangsu, China) was prepared with a mixture containing 0.08–0.15% ropivacaine and 0.4 µg/mL sufentanil, totaling 100 mL [12]. The analgesic pump was set to deliver an initial bolus of 12–15 mL, followed by a maintenance infusion of 8–10 mL/h, with a patient-controlled bolus of 6 mL and a lockout interval of 20 minutes. A blunt needle was used to ensure the anesthesia coverage extended from the T10 to S4 dermatomes. If a subject’s visual analog scale exceeded 4 after 30 minutes from the initial epidural dose, the analgesia was considered inadequate [13, 14]. In this case, an additional 8 mL of 0.125% ropivacaine was injected, and the participant was excluded from the study. Participants who required vasoactive drugs to manage hemodynamic instability during measurements were also excluded from the study.
Baseline information on subjects was documented, including weight, height, gestational age, duration of labor, hemorrhage, side effects, oxytocin dosage, basal body temperature, and any other medications taken during the study. Blood flow spectrum images were acquired while subjects were in the left or right lateral position to avoid the influence of the expanded uterus compressing blood vessels on ultrasound data. Ultrasound measurements of the right lower extremity were uniformly performed on all participants using a PWD US system (MX7, Mindray, Shenzhen, Guangdong, China) with a 3–12 MHz high-frequency linear array transducer probe to reduce variability.
Subjects underwent ultrasound measurements in the left lateral recumbent
position. The anterior tibial artery (ATA) was scanned just above the ankle joint
on the anteromedial aspect of the tibia, while the posterior tibial artery (PTA)
was scanned at the medial malleolus. Mark the probe position at the measurement
point with a black marker pen after the first measurement to ensure that all
subsequent measurements were made at the same position. Colour Doppler images of
the longitudinal axis of the artery were obtained by keeping the probe vertical
and tilting it slightly to the left or right, ensuring that the adventitia and
posterior intima were visible at the maximum diameter of the vessel. Adjust the
probe position so that the blood flow is as close as possible to the direction of
the sound beam [15]. No pressure should be exerted on the probe that could cause
deformation of the vessel. After optimising the B-mode US image, the PWD US mode
was activated. The angle between the PWD scan line and the vessel should be
Data was captured one minute prior to induction of epidural analgesia
(PSV0) and then at five-minute intervals for thirty minutes post-induction
(PSV5–PSV30). The difference relative to baseline in blood flow
parameters in the ATA and PTA was calculated (
Statistical analyses were performed utilizing SPSS software, version 22.0 (IBM
Corp., Armonk, NY, USA). Graphical representations were generated with GraphPad
Prism version 8.0 for macOS (GraphPad Software, San Diego, CA, USA) and R version
3.6.1 (R Core Team, Vienna, Austria). The normality of data distributions was
evaluated using the Kolmogorov-Smirnov test. Data adhering to a normal
distribution were expressed as the mean
Out of 103 parturients initially enrolled in the study, 11 were excluded for the
following reasons: gestational diabetes mellitus, gestational hypertension, the
use of contraindicated medications, and acute infectious diseases. During labor,
19 parturients were removed from the study: three due to inadequate epidural
analgesia, seven proceeded to cesarean section, eight presented with suboptimal
arterial visualization, and one was temporarily withdrawn from the study.
Finally, data were collected from 73 participants. Among these, 13 (17.8%)
developed a fever and were classified as the febrile group, while 60 (82.2%)
remained afebrile (Fig. 1). Table 1 presents a summary of the primary demographic
data and obstetric characteristics. The baseline demographics showed no
significant differences between the febrile and afebrile groups (p
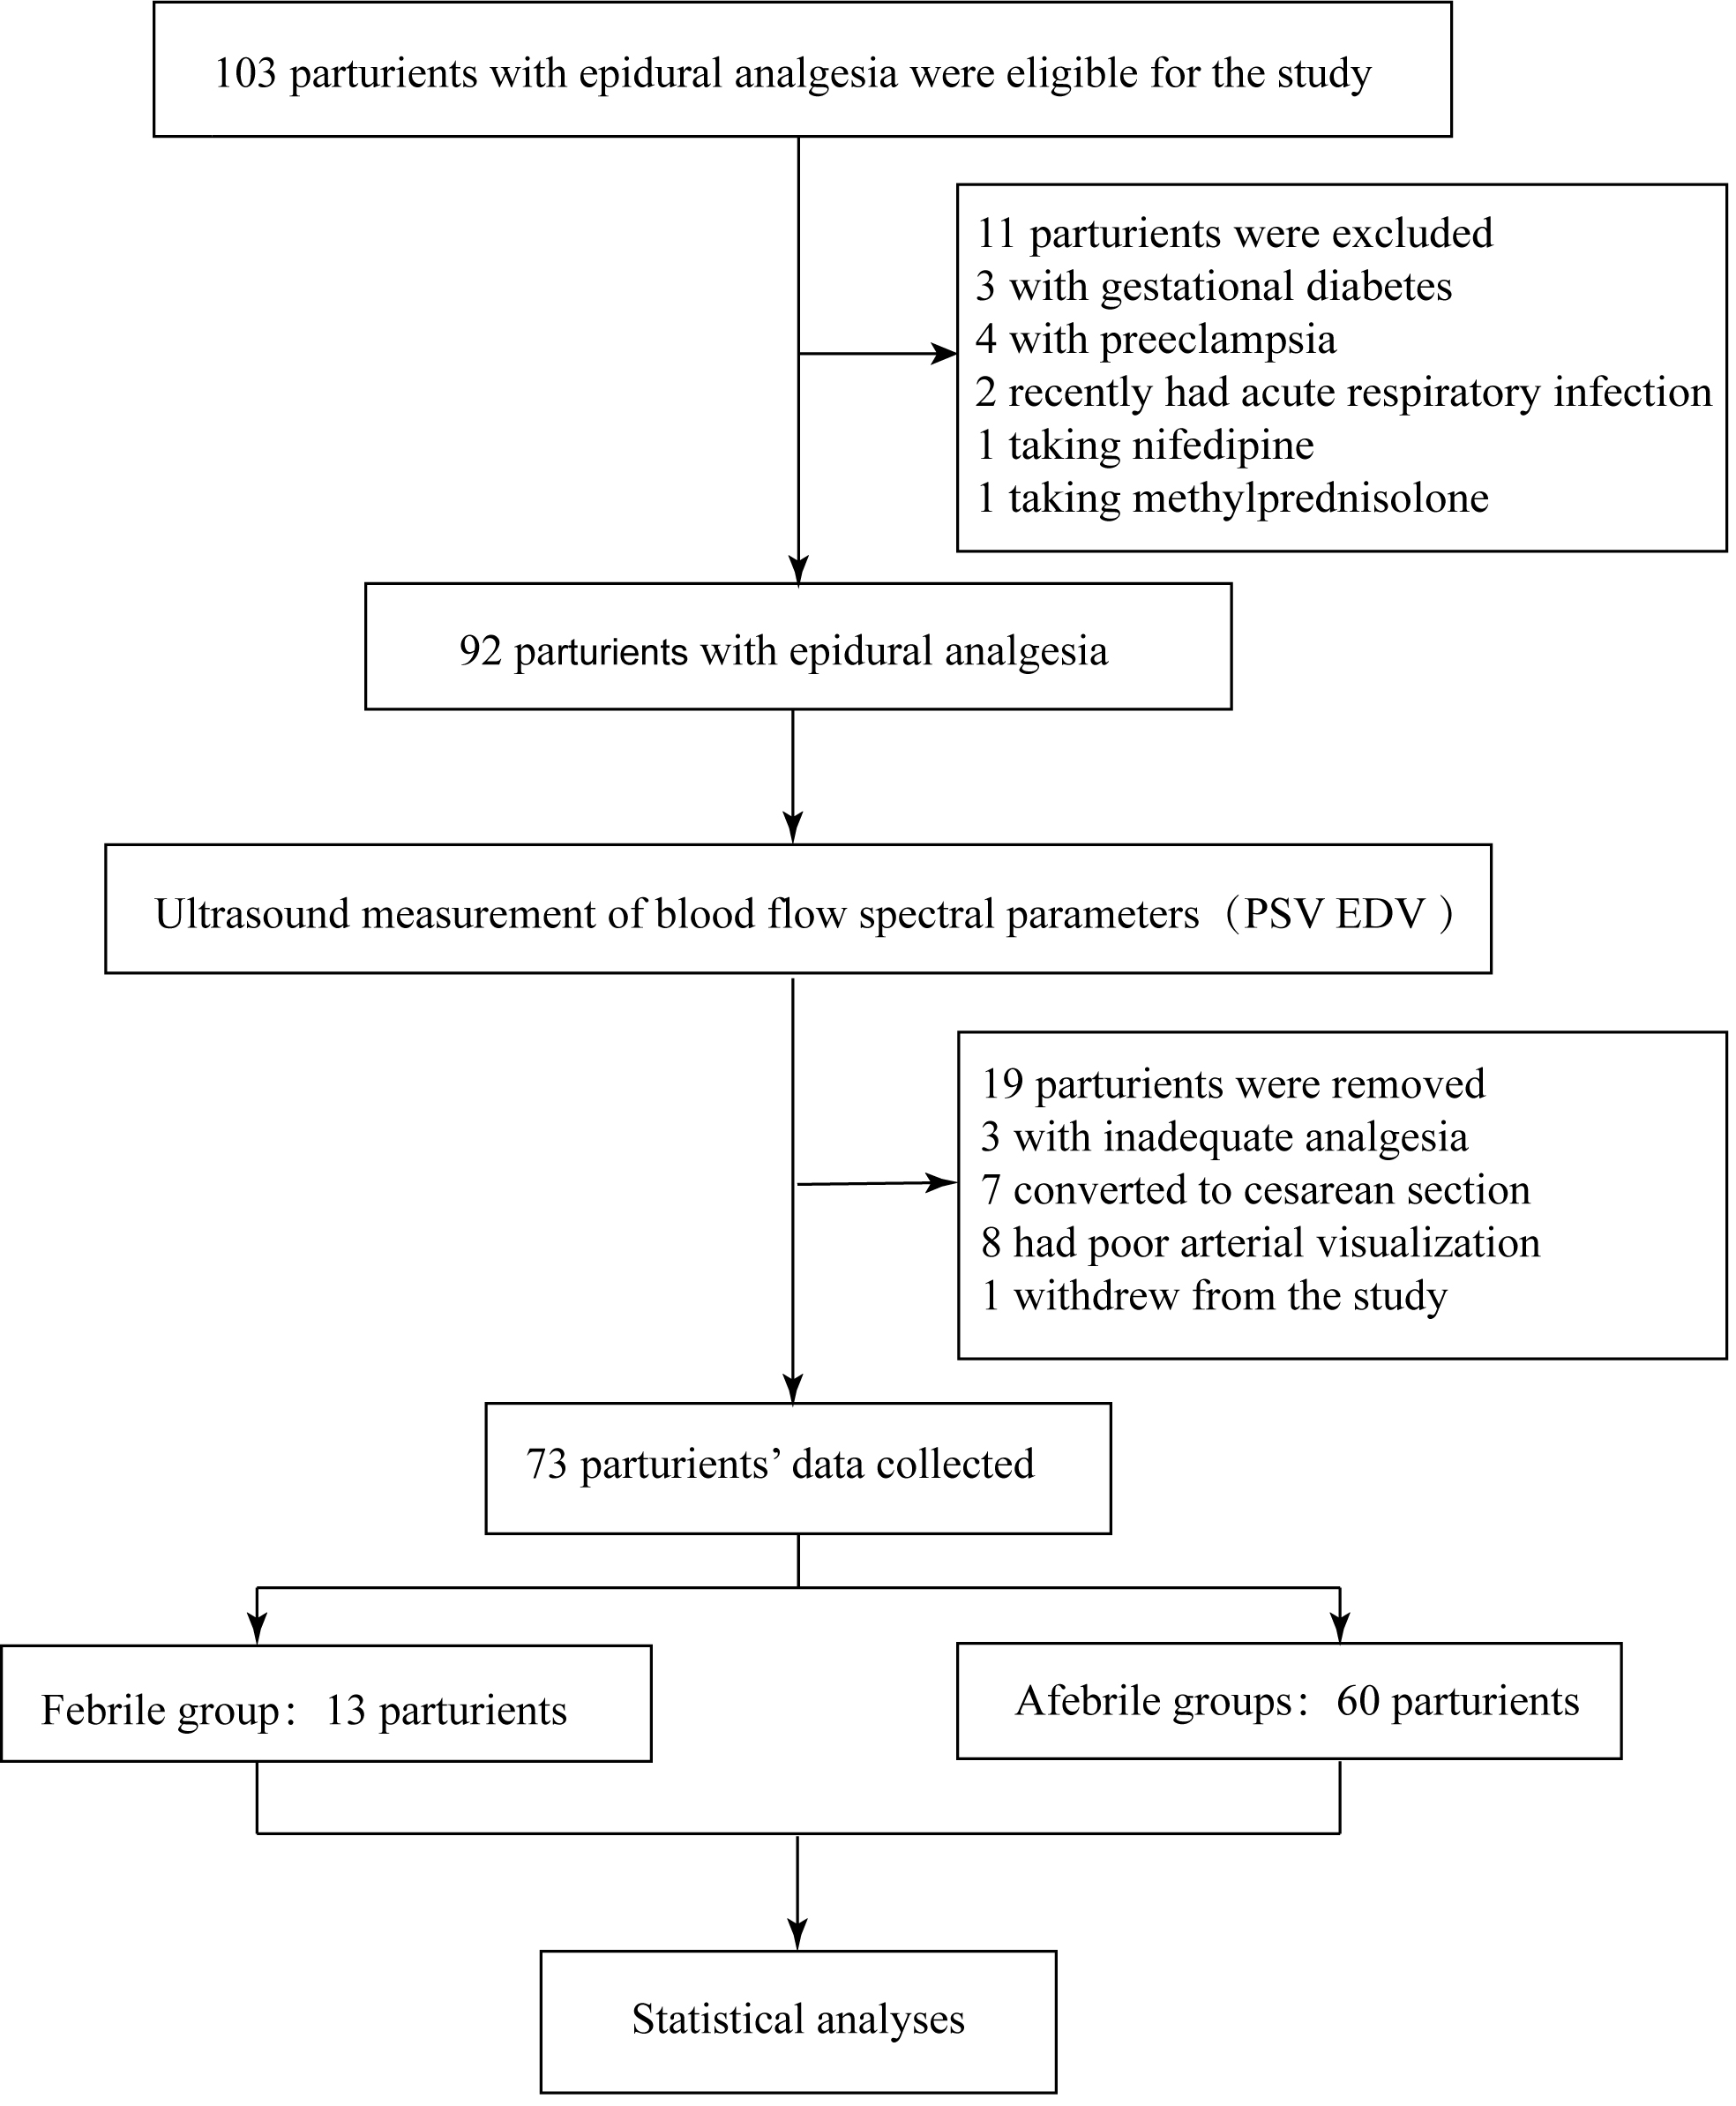 Fig. 1.
Study flow diagram. Abbreviations: PSV, peak systolic velocity; EDV, end-diastolic velocity.
| Variables | Febrile group (N = 13, 17.8%) | Afebrile group (N = 60, 82.2%) | Statistical magnitude | p value | |
| Age (years) | 28.46 |
29.63 |
t = –1.367 | 0.176 | |
| Weight (kg) | 69.04 |
68.16 |
t = 0.349 | 0.728 | |
| Height (cm) | 164.00 |
162.73 |
t = 0.847 | 0.400 | |
| Gestational age (weeks) | 40 [39–40] | 39 [39–40] | Z = –1.108 | 0.268 | |
| Cervical dilation at epidural request (cm) | 2 [2–2.5] | 2 [2–2] | Z = –0.141 | 0.888 | |
| Basal body temperature (°C) | 36.42 |
36.44 |
t = –0.398 | 0.691 | |
| Total duration of labor (h) | 12.7 |
10.4 |
t = 2.281 | 0.026 | |
| First stage of labor (h) | 11.0 |
9.3 |
t = 1.749 | 0.085 | |
| Second stage of labor (h) | 1.5 [1.2–1.85] | 0.6 [0.4–1.4] | Z = –3.137 | 0.002 | |
| Third stage of labor (min) | 6 [4–6] | 5 [3.25–6] | Z = –1.183 | 0.237 | |
| Oxytocin before ELA | 0.518 | ||||
| Using oxytocin | 8 (61.5%) | 31 (51.7%) | - | ||
| Without oxytocin | 5 (38.5%) | 29 (48.3%) | - | ||
| Premature rupture of membranes | 1 (7.7%) | 15 (25%) | 0.318 | ||
| Blood loss (mL) | 250 [205–290] | 230 [200–280] | Z = –1.022 | 0.307 | |
Data are presented as mean
The baseline spectral parameters of ultrasound blood flow did not differ
significantly between the febrile and afebrile patients (p
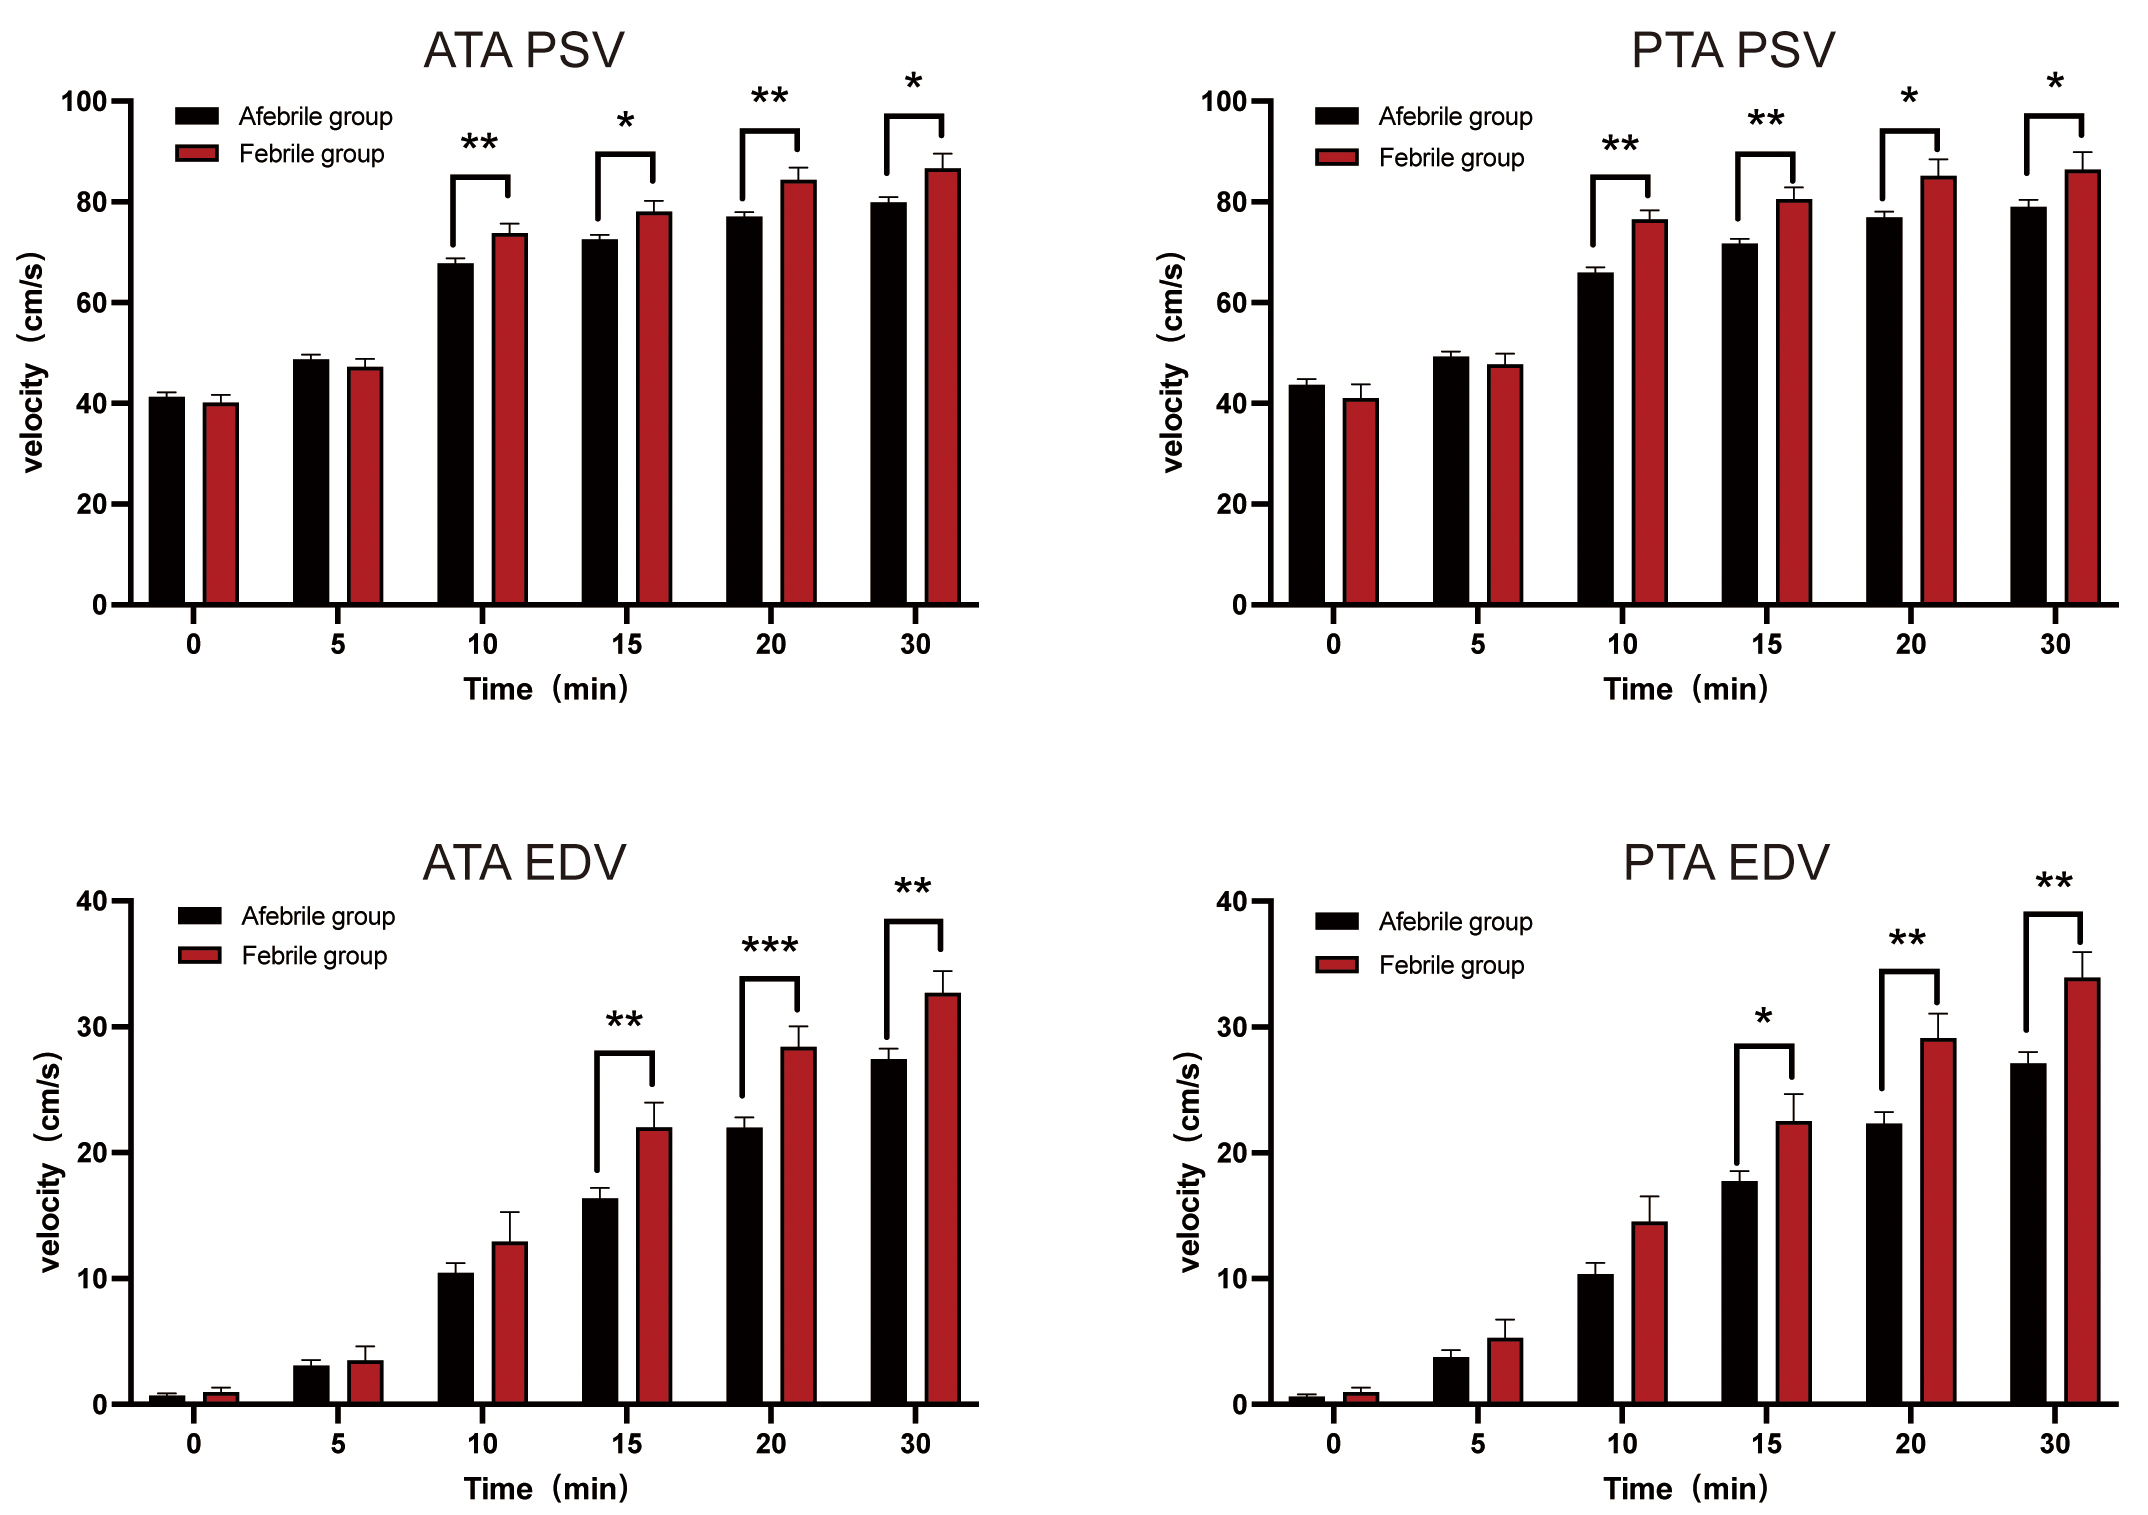 Fig. 2.
Spectral parameters of regional blood flow post-epidural labor
analgesia (ELA). *p
Post-epidural labor analgesia, there was a tendency for core body temperature to increase incrementally, reaching a peak towards the end of the second stage of labor. Subsequently, the temperature began to fall as the labor process concluded. Similarly, PSV and EDV of both lower extremity arteries showed a gradual rise following analgesia. To investigate the relationship between these variables, we conducted a Spearman correlation analysis focusing on PSV30 and EDV30 concerning Tpeak, as presented in Table 2. The analysis revealed a positive correlation between PSV30 and EDV30 with Tpeak, as shown in Fig. 3.
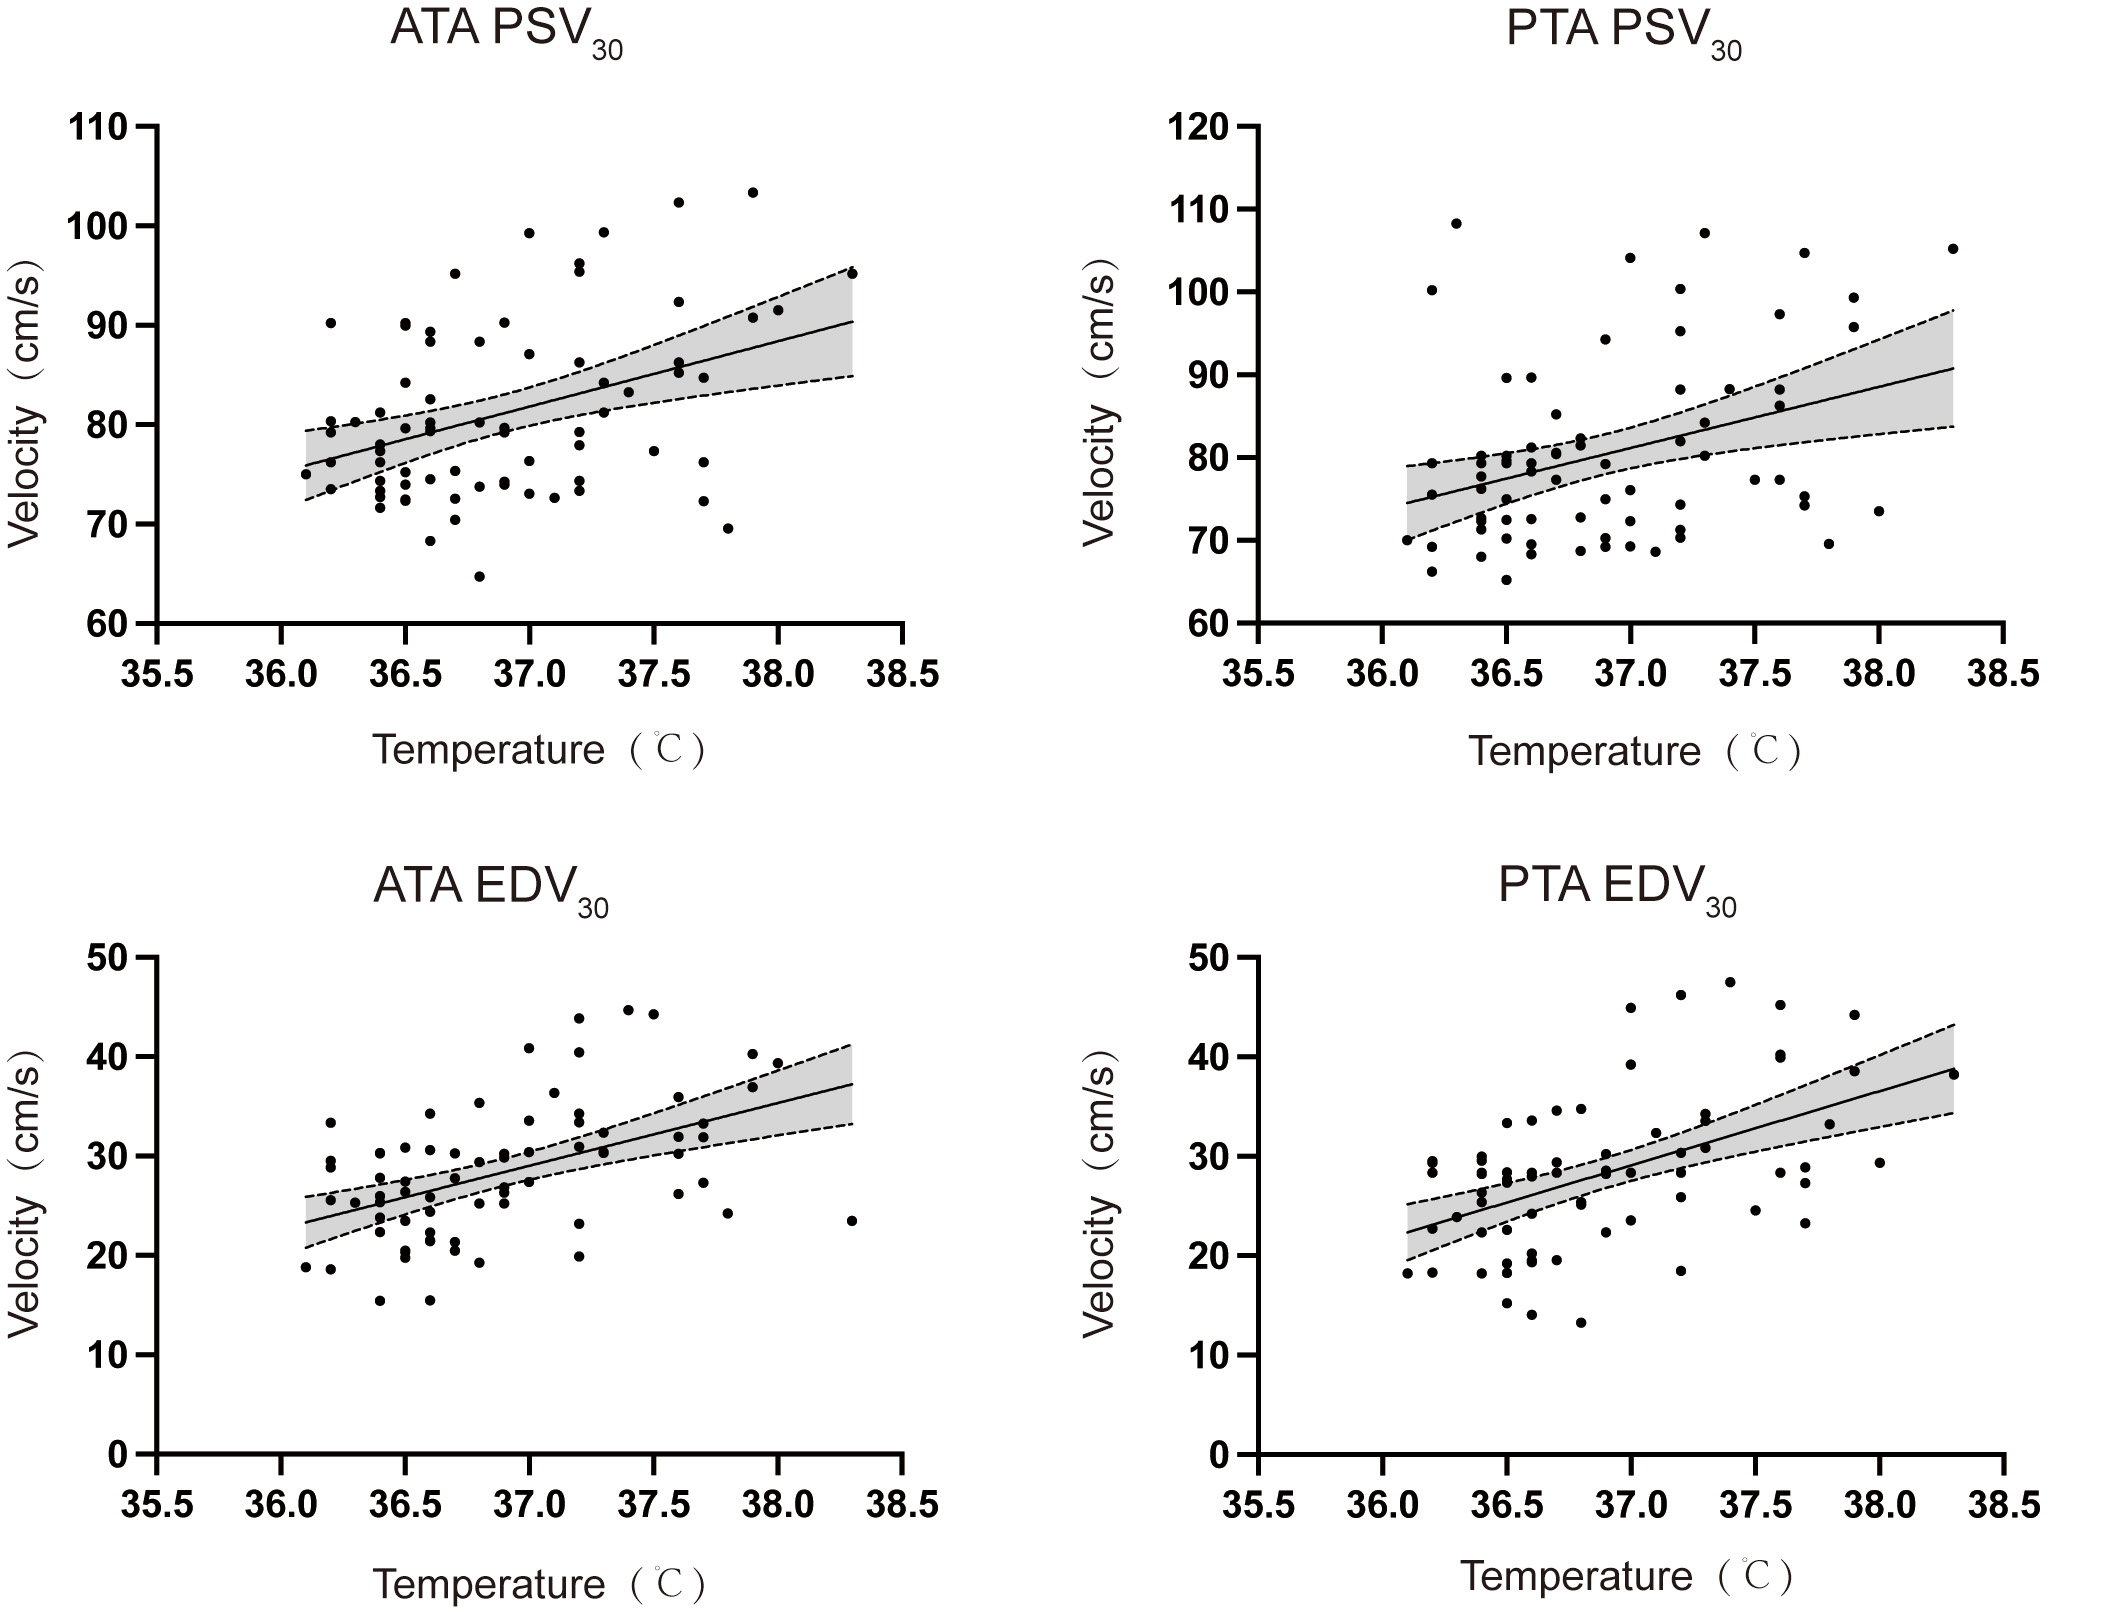 Fig. 3.
Spearman correlation analysis between blood flow spectral parameters and peak body temperature (T𝐩𝐞𝐚𝐤) at delivery. Abbreviations: ATA, anterior tibial artery; PTA, posterior tibial artery; PSV30, peak systolic velocity 30 minutes after epidural analgesia; EDV30, end-diastolic velocity 30 minutes after epidural analgesia.
| Parameters | r | R2 | 95% CI | p value | |
| ATA | PSV30 | 0.3137 | 0.1525 | 0.0833 to 0.5123 | 0.0069 |
| EDV30 | 0.4928 | 0.2371 | 0.2900 to 0.6532 | ||
| PTA | PSV30 | 0.2953 | 0.1216 | 0.0631 to 0.4972 | 0.0112 |
| EDV30 | 0.4731 | 0.2610 | 0.2663 to 0.6383 |
Abbreviations: ATA, anterior tibial artery; PTA, posterior tibial artery; PSV30, peak systolic velocity 30 min after epidural analgesia; EDV30, end-diastolic velocity 30 min after epidural analgesia; r, correlation coefficient; R2, coefficient of determination; CI, confidence interval; ELA, epidural labor analgesia.
Using the changes in blood flow parameters post-analgesia, ROC curves were
generated for the rate of change in the ATA and PTA 30 minutes after analgesia to
predict ERMF (Fig. 4). Utilizing the Youden index (sensitivity + specificity –
1), we identified the optimal cut-off value and calculated the AUC, and the
corresponding sensitivity and specificity for the ERMF prediction. The detailed
statistics are shown in Table 3. The
results demonstrate that
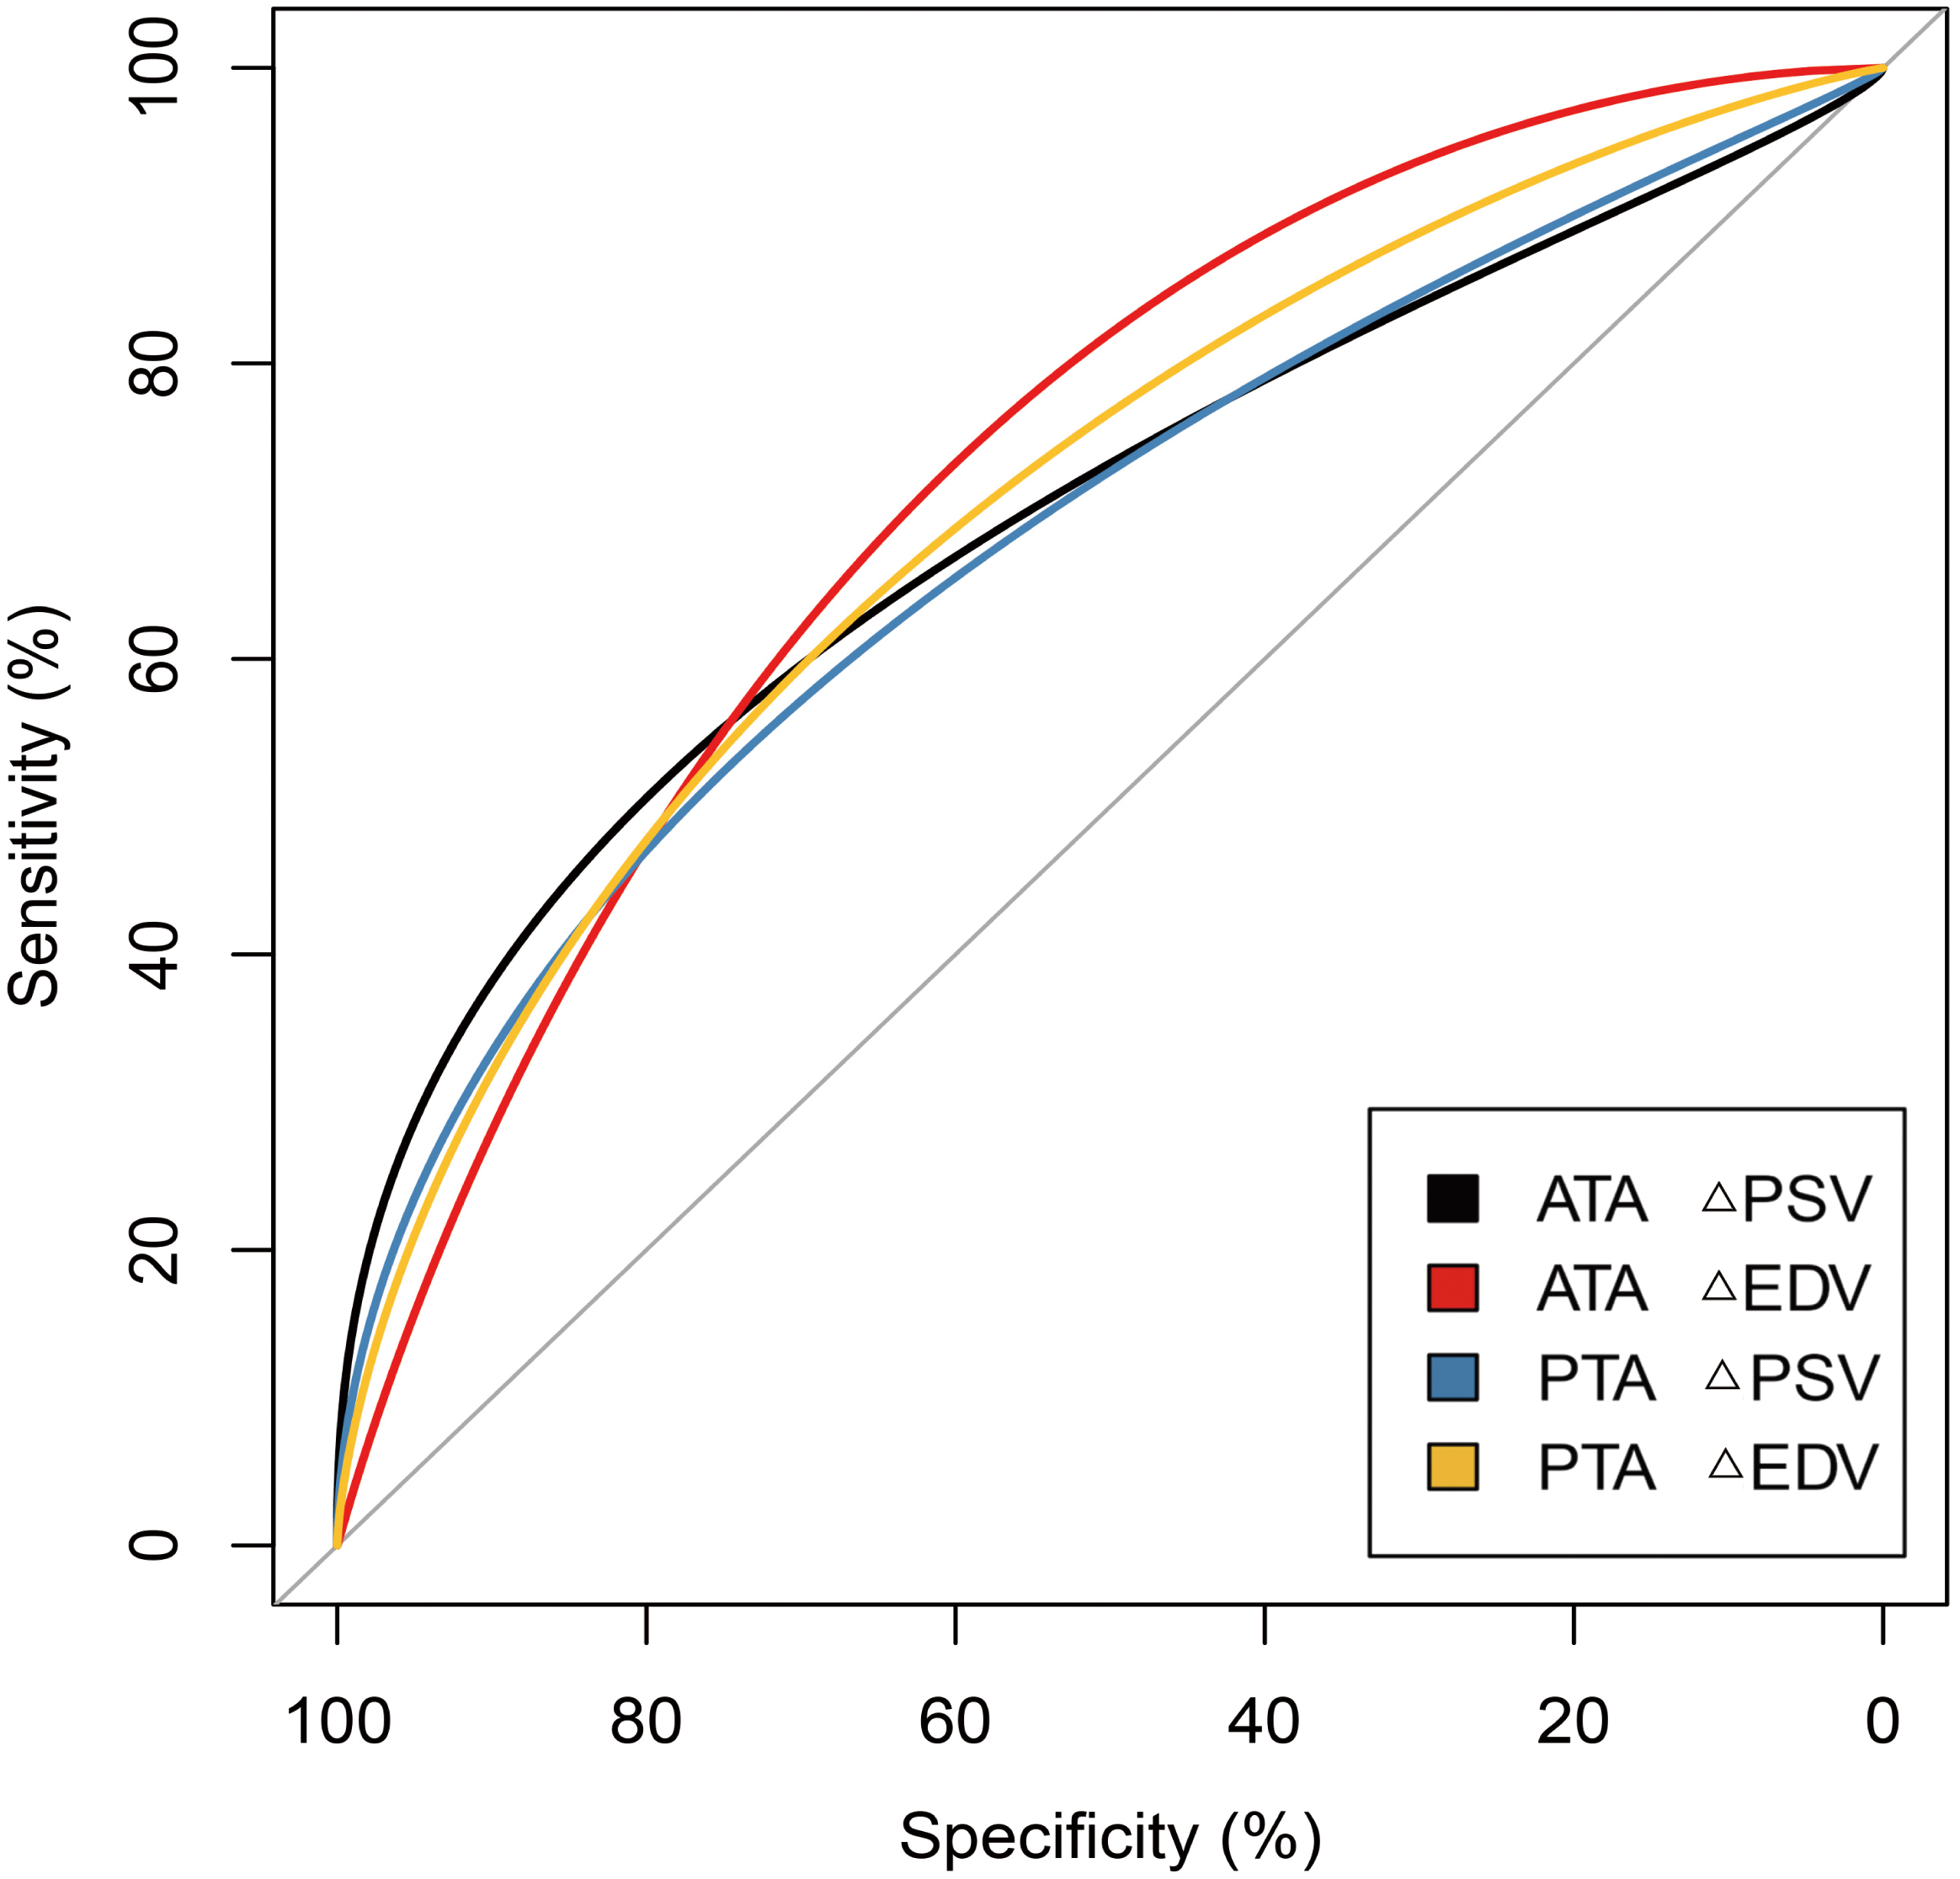 Fig. 4.
ROC curve for predicting ERMF using
| Parameters | AUC | 95% CI | Cut-off | Sensitivity | Specificity | p value | |
| ATA | 0.701 | 0.525 to 0.878 | 0.692 | 0.700 | 0.025 | ||
| 0.733 | 0.590 to 0.877 | 0.692 | 0.750 | 0.001 | |||
| PTA | 0.687 | 0.514 to 0.860 | 0.769 | 0.667 | 0.034 | ||
| 0.713 | 0.558 to 0.869 | 0.538 | 0.883 | 0.007 |
Abbreviations: ATA, anterior tibial artery; PTA, posterior tibial artery; EDV,
end-diastolic velocity; PSV, peak systolic velocity; AUC, area under the receiver
operating characteristic curve;
In this research, we evaluated the degree of sympathetic blockade induced by ELA by quantifying blood flow spectral parameters using PWD US. The aim was to determine the predictive value of these parameters for the onset of ERMF. To our knowledge, this is the first study to examine the link between blood flow spectral parameters and ERMF. We measured regional blood flow spectral parameters in the anterior and posterior tibial arteries, which indicate sympathetic nervous system activity. These vessels’ superficial and consistent anatomical positioning facilitates longitudinal ultrasound scanning, allowing for precise and reliable measurements.
Our findings revealed significant differences in PSV and EDV between the febrile and afebrile groups at 10 and 15 minutes post-ELA, respectively. Sympathetic nerves solely innervate the blood vessels in the human limbs. During ELA, the blockade of sympathetic nerve fibers precedes motor and sensory block as the local anesthetic permeates the epidural space. This blockade triggers a vasodilatory effect, influencing local blood flow velocity, a phenomenon detectable through the spectral parameters assessed by PWD US [8, 17]. Previous research has employed the pulse perfusion index (PI) as an indicator for ERMF. Sun et al. [9] found that individuals who developed a fever during labor exhibited significantly higher PI values commencing 10 minutes post-ELA, corroborating the time our study detected intergroup disparities.
The thermoregulatory hypothesis posits that ELA may interfere with maternal thermoregulation [2]. Typically, during pregnancy, there is an enhanced sympathetic activation, a characteristic feature in normotensive women, further augmented by increased vasodilatory sympathetic activity compared to the nonpregnant state [18]. Conditions such as preeclampsia are believed to arise from an imbalance between excessive sympathetic activation and the vasodilatory responses that are typical during pregnancy [19, 20]. Consequently, preserving the equilibrium of the sympathetic nervous system is crucial throughout pregnancy.
A potential explanation for the predictive ability of blood flow spectral parameters for ERMF is impaired thermoregulation due to sympathetic blockade following ELA. Labor and delivery are characterized by intense uterine contractions and considerable physical exertion, leading to elevated heat production [5]. In the case of fever, skin vasodilation during this period is mediated by sympathetic cholinergic fibers, facilitating “active vasodilation” and thus promoting increased heat loss [5, 21, 22]. ELA interrupts the sympathetic supply to the blood vessels in the skin, thereby reducing maternal thermoregulation. This impairment affects active vasodilatation, reduces blood flow to the skin, decreases heat dissipation, and increases body temperature [2, 5, 9]. Additionally, epidural labor analgesia suppresses sweat gland activity, ultimately leading to an increase in body temperature [9]. We hypothesize that ELA might disrupt this delicate balance by inducing a “chemical blockade” of the sympathetic nervous system, thus compromising the enhanced cooling mechanisms that are critical during labor.
Our hypothesis suggests that variations in the degree of sympathetic blockade may be a pathogenic factor contributing to ERMF, prompting us to analyze the correlation between blood flow spectral parameters and the participant’s body temperature. Prior research has documented a progressive rise in body temperature during labor, culminating at the termination of the second stage [9, 23, 24]. We noted a similar gradual increase in blood flow spectral parameters following analgesia. Although our measurements were confined to a 30-minute post-analgesia window, and we cannot confirm these as peak values, the consistent analgesic level at 30 minutes indicates a relatively stable impact of the local anesthetic on sympathetic tone [9]. A positive correlation between PSV30, EDV30, and the peak body temperature during labor supports our initial hypothesis that a more pronounced sympathetic blockade intensifies the disturbance in autonomic function equilibrium and impedes heat dissipation, leading to a higher body temperature increase. Our findings highlight the potential involvement of the thermoregulatory hypothesis in ERMF development [2].
It is imperative to note the considerable individual variability in the ATA and
PTA’s baseline blood flow spectral parameters. Focusing on the relative changes
in these parameters pre- and post-analgesia is more informative than the absolute
values alone. A significant strength of this study is incorporating the change of
these parameters with the incidence of ERMF in a ROC analysis to determine the
AUC. Our study shows that
In clinical practice, direct measurement of sympathetic nervous activity is not achievable; instead, we infer its activity through indirect methods. The previous study showed a PI with an AUC of 0.818 for ERMF prediction, higher than our study [9]. This variation may result from different anesthetic concentrations and doses used in the studies. Some participants were treated with ropivacaine at concentrations up to 0.15%. Lower concentrations of local anesthetics might lead to lesser sympathetic blockade than higher concentrations [26, 27]. Although PI is convenient clinically, its reliability can be significantly affected by uterine contractions during labor [28]. Our study introduces a new predictor by utilizing changes in ultrasound spectral parameters (PSV, EDV), which could offer a more objective quantitative measure and minimize the influence of confounding factors.
The practical significance of this research is in defining critical values for
the variability of blood flow spectral parameters. Maternal and fetal
hyperthermia exposure is associated with adverse effects [1]. The likelihood of
ERMF increases when the
This study has its limitations. It was a prospective observational study with a small sample size, and single-center trials may not be as reliable as multicenter ones. The homogeneity of subjects also raises concerns about the applicability of these findings to parturients with conditions like gestational hypertension or gestational diabetes mellitus that could affect sympathetic nervous system. Future research should have an inclusive study population and pursue validation through more rigorous randomized controlled trials. Additionally, the anesthetic concentrations used were standard for our facility, and further studies are required to determine whether different concentrations affect the variability of these parameters.
The changes in regional blood flow spectral parameters post-epidural analgesia offer an indirect method to gauge the extent of sympathetic inhibition, which can predict the occurrence of ERMF. Notably, the changes in peak systolic velocity and end-diastolic velocity relative to the baseline, measured 30 minutes after ELA induction, emerged as the most predictive factors. These findings could enable clinicians to identify high-risk individuals more promptly, allowing for earlier interventions to enhance maternal and infant outcomes.
The datasets used or analyzed in the study are available upon request from the corresponding author.
FS designed the study and wrote the manuscript. PL performed the part of the experiment. YMX collected date. YCL analyzed the data and revised the manuscript. JXJ designed and supervised the entire study and revised the manuscript. All authors contributed to editorial changes in the manuscript. All authors read and approved the final manuscript. All authors have participated sufficiently in the work and agreed to be accountable for all aspects of the work.
This study was approved by the Ethics Committee of Women and Children’s Hospital, School of Medicine, Xiamen University (KY-2024-009-K01). Written consent was obtained for all willing participants prior to registering for this study.
We thank Dr. Yupeng Wu for his assistance in the preparation of this manuscript.
This research received no external funding.
The authors declare no conflict of interest.
Supplementary material associated with this article can be found, in the online version, at https://doi.org/10.31083/j.ceog5110225.
References
Publisher’s Note: IMR Press stays neutral with regard to jurisdictional claims in published maps and institutional affiliations.