


1 European Institute of Positive Psychology, 28020 Madrid, Spain
2 Department of Psychobiology and Methodology in Behavioral Sciences, Complutense University of Madrid, 28223 Madrid, Spain
3 Department of Psychology, Cardenal Cisneros Higher Education Center, 28006 Madrid, Spain
Abstract
The present study aims to develop a short scale of strengths, which states that strengths would be more adaptive when used in a balanced way. We consider that strengths are dimensional scales in which the balanced scores are related to the optimal functioning of the individual.
The questionnaire measures 26 balanced strengths and was applied to two samples of 851 and 909 participants, with mean ages of 37.66 (SD = 11.11) and 44.15 (SD = 8.27), respectively.
The results show that the best-fitting model is a hierarchical factor structure with a general factor of optimal functioning, and four primary order factors that are interrelated: emotional strengths, interpersonal strengths, intellectual strengths and transcendence strengths. The reliability of the scale is adequate (α = 0.853). It is not influenced by social desirability, presents factorial invariance in terms of sex and age, and is positively related to Life Satisfaction. The results provided cross-validation.
The study provides a new tool to measure strengths, especially indicated for contexts where the amount of time to apply the measurement must be reduced.
Keywords
- balanced strengths
- optimal functioning
- overuse
- underuse
- short scale
- VIA-IS
The study of happiness has been one of the most reiterated topics in the history of human thought (Vázquez and Hervás, 2009), nevertheless it wasn’t until the 21st Century that Psychology began placing increased emphasis on it, apart from its focus on symptoms and disorders. Positive approach of Psychology is considered an antidote to psychological (depression) and physical (cardiovascular risk) discomfort and promotes learning, creativity and social cohesion (Kern et al, 2015; Seligman, 2005). It includes the study of individual character strengths that was pioneered by Peterson and Seligman (2004), who proposed the Values in Action Model (VIA) as a theoretical classification of 24 personal strengths grouped into six human virtues. These are: desirable, universal character traits with a clear moral value, and aim to foster wellbeing and success at an individual and a group level (Dahlsgaard et al, 2005). In this model the identification, use and development of strengths has been related to higher levels of wellbeing, engagement as well as work satisfaction and performance (Dubreuil et al, 2014; Forest et al, 2012; Gander et al, 2012; Kong and Ho, 2016; Linley and Harrington, 2006; Littman-Ovadia and Steger, 2010; Peterson et al, 2010).
The main questionnaire used to measure strengths is the Values in Action Inventory of Strengths (VIA-IS, Peterson et al, 2005) that is a 240-item self-report questionnaire and have shown a satisfactory internal consistency (Cronbach‘s Alpha
Another criticism made of the VIA-IS is to assume that a high score on the different strengths is optimal, which implies that a greater presence of strengths would lead to a higher sense of psychological wellbeing, positive emotions, flourishing, higher achievement and better relationships (Peterson and Seligman, 2004). There is data that suggests that an excessive use of social intelligence and humility, and the underuse of enthusiasm, humor, self-regulation and social intelligence are associated with poor functioning and mental health problems, such as social anxiety (Freidlin et al, 2017). Moreover, the reduced use of strengths has been associated with reduced vitality and higher stress, constructs that relate to depression (Wood et al, 2011). These results indicate that it is a balanced use of strengths (scoring at an optimal point) that leads to good psychological functioning (Freidlin et al, 2017). In line with this, it has been found that people with balanced strengths report higher life satisfaction and a greater access to their individual resources (Littman-Ovadia and Steger, 2010).
There are also other questionnaires designed to assess strengths such as the Strength Profile questionnaire (Linley, 2008) and the Clifton Strengths (Asplund et al, 2007). The Strength Profile questionnaire measures 60 strengths and introduces concepts as the energy when strengths are used or the difference between conscious and unconscious strengths. The internal validity scores indicate that the 60 strengths present a low level of correlation, and therefore a relative independence from one another and the internal consistency is an average of 0.82, and the test-retest reliability lies between 0.63 and 0.80 within a week (Linley and Dovey, 2012). This test’s main limitations are: (1) the scant empirical support provided; (2) framing 60 independent strengths, which is difficult to manage, and (3) comprising 120 items, which takes much time to apply.
The Clifton Strengths is a measurement of personal talent that identifies themes in which individuals have a higher potential to build strengths. It is a self-report online questionnaire of 177 ipsative items that measures 34 themes (scales). The internal consistency of the different scales is below 0.70 for 24 of the scales (ranging between 0.54 and 0.76). The test-retest reliability at 8 to 12 weeks is between 0.52 and 0.81 for the 34 scales, and the internal structure of 34 scales has been verified through hierarchical cluster analysis (Schreiner, 2006). This model’s main limitation is not based on the concept of strength, but rather of talent, even though when perfectly used, it converts to a strength. Unlike talent, strengths are more changing over time. Their use can be trained and perfected and have a purpose in and of themselves, with no need to obtain later benefit (Duckworth et al, 2005). Furthermore, this test only shows the user the 5 main strengths, with no possibility of accessing the rest of information. Additionally, the test is mainly contextualized within the business world.
With the aim of integrating the different viewpoints on strengths (Asplund et al, 2007; Linley, 2008; Peterson and Seligman, 2004), we will consider strengths as a combination of adaptative thoughts, emotions and behaviors that can be developed and that a person experiences naturally and to different degrees. Strengths make a person feel more authentic, more vital and with higher energy levels (Csikszentmihalyi and Csikszentmihalyi, 1990; Linley, 2008) when they are displayed in a balanced way and contribute to the flourishing or optimal functioning of people, groups and institutions (Seligman and Csikszentmihalyi, 2000).
As other authors have already stated, some of the consequences related to the use of strengths might be experiencing greater degrees of wellbeing and satisfaction with life (Azañedo et al, 2014; Park et al, 2004; Ruch et al, 2010) and an increased presence of positive emotions (Güsewell and Ruch, 2012). All this can contribute to better adaptation to one’s environment.
The general goal of this research study is to develop and validate a short scale of balanced strengths, grouped by a general factor of optimal functioning. Unlike previous measures such as the VIA-IS, this model considers that it is the balanced score of each strength that will foster optimal psychological functioning.
Confirmatory factor analysis will be used to validate the internal structure of the test by contrasting three alternative models: (1) A model with a general factor of optimal functioning, in which all strengths are grouped, (2) a model with four independent factors (Emotional strengths, Interpersonal strengths, Transcendence strengths and Intellectual strengths) and (3) a hierarchical model with four first order factors (according to model 2), and a general factor of optimal functioning. The previous literature (Asplund et al, 2007; Linley, 2008; Peterson and Seligman, 2004; Seligman, 2005; Seligman, 2011) suggests that the different strengths will cluster in four factors:
- Emotional strengths: being made up of positivity, gratitude, forgiveness, humor, acceptance, managing emotions and emotional awareness. - Interpersonal strengths: comprised by strengths such as cooperation, charisma, courage, harmony and honesty. - Transcendence strengths: including the strengths called commitment and appreciation of beauty: quality, innovation, equality, legacy, persistence, universal love and curiosity. - Intellectual strengths: consisting of the strengths of leadership, vitality, analysis, growth and organization.
The models will be contrasted with two independent samples to obtain cross-validation of the scale. In addition, the factorial invariance of the scale in terms of sex and age will be verified. Finally, we will examine the evidence of convergent validity of the conducted test with other related measurements and criterion validity with regards to a measurement of life satisfaction.
The research study was carried out with two independent samples, employing the second sample to replicate the results of the first sample and obtain cross-validation.
Sample 1. Consisted of 851 participants, 72.7% of which were women, with an average age of 37.66 years (SD = 11.11). At the time of the study 13.3% were unemployed, 10.6% students, 2.8% retirees and 73.3% working population.
Sample 2. Evaluated a total of 909 individuals with a mean age of 44.15 years (SD = 8.27), with 74% being women, 0.3% unemployed, 4.8% students, 0.3% retirees and 94.6% working population.
Balanced Strengths Questionnaire (FORTE). Measures 26 strengths that represent behavioural, emotional and cognitive aspects of individual behaviour (see Appendix 1). Each strength is evaluated with three ipsative items that refer to the use of strengths that the individual must arrange according to the frequency with which the experiences them in life. Scores 5 and 6 on a scale are for Overused, scores 3 and 4 are for a Balanced level, and, scores 1 and 2 are for Underused. Average scores (balanced strengths) fall under greater optimum functioning. For each strength, three phrases are presented and the person assessed must rank them from highest to lowest preference according to how he feels identified with each phrase, assigning scores from 1 to 3. For example, for Acceptance, the three phrases would be the following:
• When nothing can be changed, it is better to let go and not resist/struggle uselessly. • I am not easily satisfied with the circumstances I live in I feel good when I do what. • I can to improve and accept what I cannot change.
A person who uses strengths in a balanced way should have assigned the following number sequences: 2, 1, 3 or 2, 3, 1. That is, the most balanced answer is the second phrase. There are items that have more balanced responses in each of the three types of categories: cognitive, behavioural and emotional.
Social Desirability Scale by Crowne and Marlowe (Crowne and Marlowe, 1960), adapted by Ferrando and Chico (2000). Ten items taken from the Spanish adaptation of the scale were included to measure the social desirability in the sample and detect participants that attempt to provide an overly positive image of themselves. The items of highest internal discrimination (between 0.609 and 0.908) were selected, that is, items 6, 12, 13, 15, 16, 19, 20, 26, 30 and 33.
The Satisfaction with Life Scale (SWLS, Diener et al, 1985). The scale measures the cognitive components of subjective wellbeing on a Likert scale of 5. The adaptation by Vázquez et al. (2013) was employed. In the present study Cronbach’s Alpha of this scale was 0.854.
The construction of the strengths scale (FORTE) followed these steps. First, three judges’ experts in Positive Psychology aimed to unify the descriptions found in other existing strengths models (Asplund et al, 2007; Linley, 2008; Peterson and Seligman, 2004; Seligman, 2005; Seligman, 2011) and their corresponding measurements (VIA-IS, Strengths Profile and Clifton Strengths). A total of 26 strengths were identified. Then, each judge provided statements referring to a thought, an emotion and a behavior that characterizes each strength into three possible levels of expression: highly present (overused), balanced and absent (underused). A total of 234 items were proposed: 9 for each of the 26 strengths (9
Second, a first version of the instrument was administered to 29 experts on Positive Psychology, with the aim of evaluating the appropriateness of the items in measuring the 26 strengths on a conceptual level. The suggestions obtained from this second groups of experts were incorporated, and the final version of the scale was designed.
Finally, the three questionnaires were administered through the online platform http://www.iepp.es. In order to obtain a higher level of commitment and participation in the study a raffle was held, with one tablet being drawn and allotted amongst all participants that filled in the different questionnaires. Participants were recruited through social networks, such as Facebook, by posting messages on the website of the European Institute of Positive Psychology (IEPP). Mails were also sent to people who had requested information on the IEPP website and who had taken a course in the past. The Ethics Committee of the Cardenal Cisneros Center for Higher Education approved the present investigation (approval number: 20-09-2020).
First, the distribution of the items on the FORTE scale were analyzed to assess their normal distribution. Second, the presence of social desirability in the participants’ answers was calculated by correlating the FORTE items with the Social Desirability Scale. These calculations were carried out using SPSS (Version 28.0, IBM Corp., Armonk, NY, USA) (Arbuckle, 2006).
Third, the evidence of internal structure of the FORTE scale was analysed, as well as the factorial invariance in terms of sex and age using the program AMOS (Version 20.0, IBM Corp., Chicago, IL, USA) (Arbuckle, 2006). This type of analysis requires at least three indicators of each latent factor with a minimum of 100 participants and 10 times the number of observed variables (Byrne, 2001). In both samples, there criteria were widely met: Sample 1 with 851/26
Fourth, the reliability of the final scale was calculated. Finally, we verified the evidence of convergent validity of FORTE with the SWLS scale by calculating the Pearson correlation of both scales with SPSS V 28.0 (Arbuckle, 2006).
Table 1 display the results of the descriptive statistics (mean and standard deviation) of both samples, as well as the indicators of asymmetry and kurtosis for the FORTE scale. According to West et al. (1995), the values of asymmetry and kurtosis are not excessively elevated (asymmetry below 2 in absolute value, kurtosis below 7 in absolute value). With these values, the estimation procedure for maximum likelihood can be used, as it is a robust measurement of small deviations in normality. Following this criterion, all items present normal distribution in both samples.
| Strength | M | SD | Asymmetry | Kurtosis | ritem-total | Correlation Social Desirability | Correlation SWLS |
| (S1/S2) | (S1/S2) | (S1/S2) | (S1/S2) | (S1/S2) | (S1/S2) | (S1) | |
| Universal Love | 3.87/3.50 | 1.33/1.51 | –1.37/–0.61 | 1.24/–0.72 | 0.31/0.32 | 0.02/0.10 | 0.05 |
| Harmony | 3.56/3.60 | 1.59/1.42 | –0.76/–0.73 | –0.58/–0.27 | 0.33/0.28 | 0.12/0.21 | 0.15 |
| Forgiveness | 3.47/3.37 | 1.43/1.61 | –0.64/–0.66 | –0.31/–0.54 | 0.29/0.42 | 0.14/0.16 | 0.05 |
| Positivity | 3.46/3.74 | 1.64/1.36 | –0.78/–0.92 | –0.44/0.16 | 0.44/0.31 | 0.11/0.12 | 0.33 |
| Humor | 3.84/4.26 | 1.28/1.12 | –0.95/–1.69 | 0.51/2.74 | 0.39/0.23 | 0.03/0.06 | 0.04 |
| Cooperation | 4.23/3.76 | 1.21/1.38 | –1.85/–1.12 | 3.14/0.43 | 0.41/0.14 | 0.07/0.14 | 0.02 |
| Appreciation of Beauty | 3.62/4.23 | 1.47/1.02 | –1.01/–1.29 | 0.04/1.00 | 0.28/0.32 | –0.02/–0.05 | –0.02 |
| Gratitude | 4.09/4.22 | 1.18/1.02 | –1.46/–1.33 | 1.66/1.70 | 0.48/0.14 | 0.10/0.12 | 0.14 |
| Organization | 2.82/4.47 | 1.68/0.89 | –0.31/–2.02 | –1.07/4.42 | 0.43/0.23 | 0.01/0.05 | 0.04 |
| Quality | 4.10/4.39 | 1.18/1.00 | –1.39/–1.55 | 1.77/2.04 | 0.49/0.11 | 0.07/0.09 | 0.06 |
| Charisma | 4.25/4.39 | 1.14/1.05 | –1.90/–2.01 | 3.66/4.09 | 0.46/0.37 | 0.02/–0.03 | 0.04 |
| Legacy | 4.28/4.30 | 1.19/1.22 | –1.89/–1.88 | 3.41/3.07 | 0.55/0.28 | 0.08/0.12 | 0.13 |
| Curiosity | 4.27/3.72 | 1.14/1.32 | –1.68/–1.06 | 2.43/0.41 | 0.47/0.33 | 0.06/0.04 | 0.04 |
| Innovation | 4.17/4.18 | 1.39/1.28 | –1.69/–1.73 | 1.91/2.39 | 0.42/0.36 | 0.13/0.12 | 0.21 |
| Acceptance | 3.63/3.99 | 1.41/1.31 | –1.09/–1.56 | 0.30/1.81 | 0.47/0.42 | 0.14/0.16 | 0.19 |
| Emotional Awareness | 4.05/3.96 | 1.41/1.29 | –1.58/–1.09 | 1.62/0.66 | 0.48/0.29 | 0.13/0.14 | 0.21 |
| Managing Emotions | 4.04/3.74 | 1.32/1.27 | –1.71/–0.99 | 2.31/0.42 | 0.42/0.18 | 0.05/0.14 | 0.14 |
| Commitment | 3.83/3.75 | 1.42/1.36 | –1.07/–1.21 | 0.45/0.83 | 0.35/0.30 | –0.02/0.08 | 0.03 |
| Equality | 3.67/4.35 | 1.33/0.98 | –0.74/–1.65 | 0.20/2.77 | 0.35/0.22 | 0.12/0.11 | 0.08 |
| Honesty | 3.68/4.10 | 1.47/1.11 | –1.10/–1.05 | 0.26/0.62 | 0.47/0.30 | 0.11/0.19 | 0.08 |
| Courage | 4.15/3.35 | 1.16/1.72 | –1.57/–0.69 | 2.26/–0.82 | 0.46/0.48 | 0.01/0.03 | 0.08 |
| Persistence | 3.89/3.96 | 1.31/1.40 | –1.11/–1.25 | 0.74/0.74 | 0.42/0.44 | 0.20/0.21 | 0.29 |
| Vitality | 3.49/3.47 | 1.63/1.63 | –0.80/–0.83 | –0.53/–0.53 | 0.50/0.31 | 0.10/0.13 | 0.19 |
| Growth | 3.98/3.23 | 1.42/1.55 | –1.30/–0.54 | 0.79/–0.69 | 0.33/0.25 | 0.08/0.15 | 0.19 |
| Leadership | 3.17/3.08 | 1.61/1.31 | –0.51/–0.37 | –0.87/–0.43 | 0.29/0.11 | 0.12/0.11 | 0.12 |
| Analysis | 2.87/3.50 | 1.67/1.51 | –0.25/–0.61 | –1.12/–0.72 | 0.20/0.32 | 0.03/0.00 | 0.13 |
| Emotional Strengths | 19.87/20.34 | 3.99/3.18 | 0.17/0.28 | 0.25 | |||
| Transcendental Strengths | 16.33/17.09 | 4.84/4.49 | 0.12/0.21 | 0.19 | |||
| Intellectual Strengths | 35.69/36.89 | 6.68/4.44 | 0.19/0.13 | 0.31 | |||
| Interpersonal Strengths | 26.59/26.83 | 5.65/5.05 | 0.16/0.23 | 0.23 | |||
| Optimal Functioning | 98.48/101.15 | 16.81/12.62 | 0.16/0.28 | 0.24 |
Note: Correlations above
To verify if the FORTE scale is influenced by social desirability, the items from both samples were correlated with the Social Desirability Scale. Following Cohen’s (1992) criteria, a correlation of 0.10 presents a low effect size, 0.30 medium and 0.80 high. The correlations between the different items are very low (r
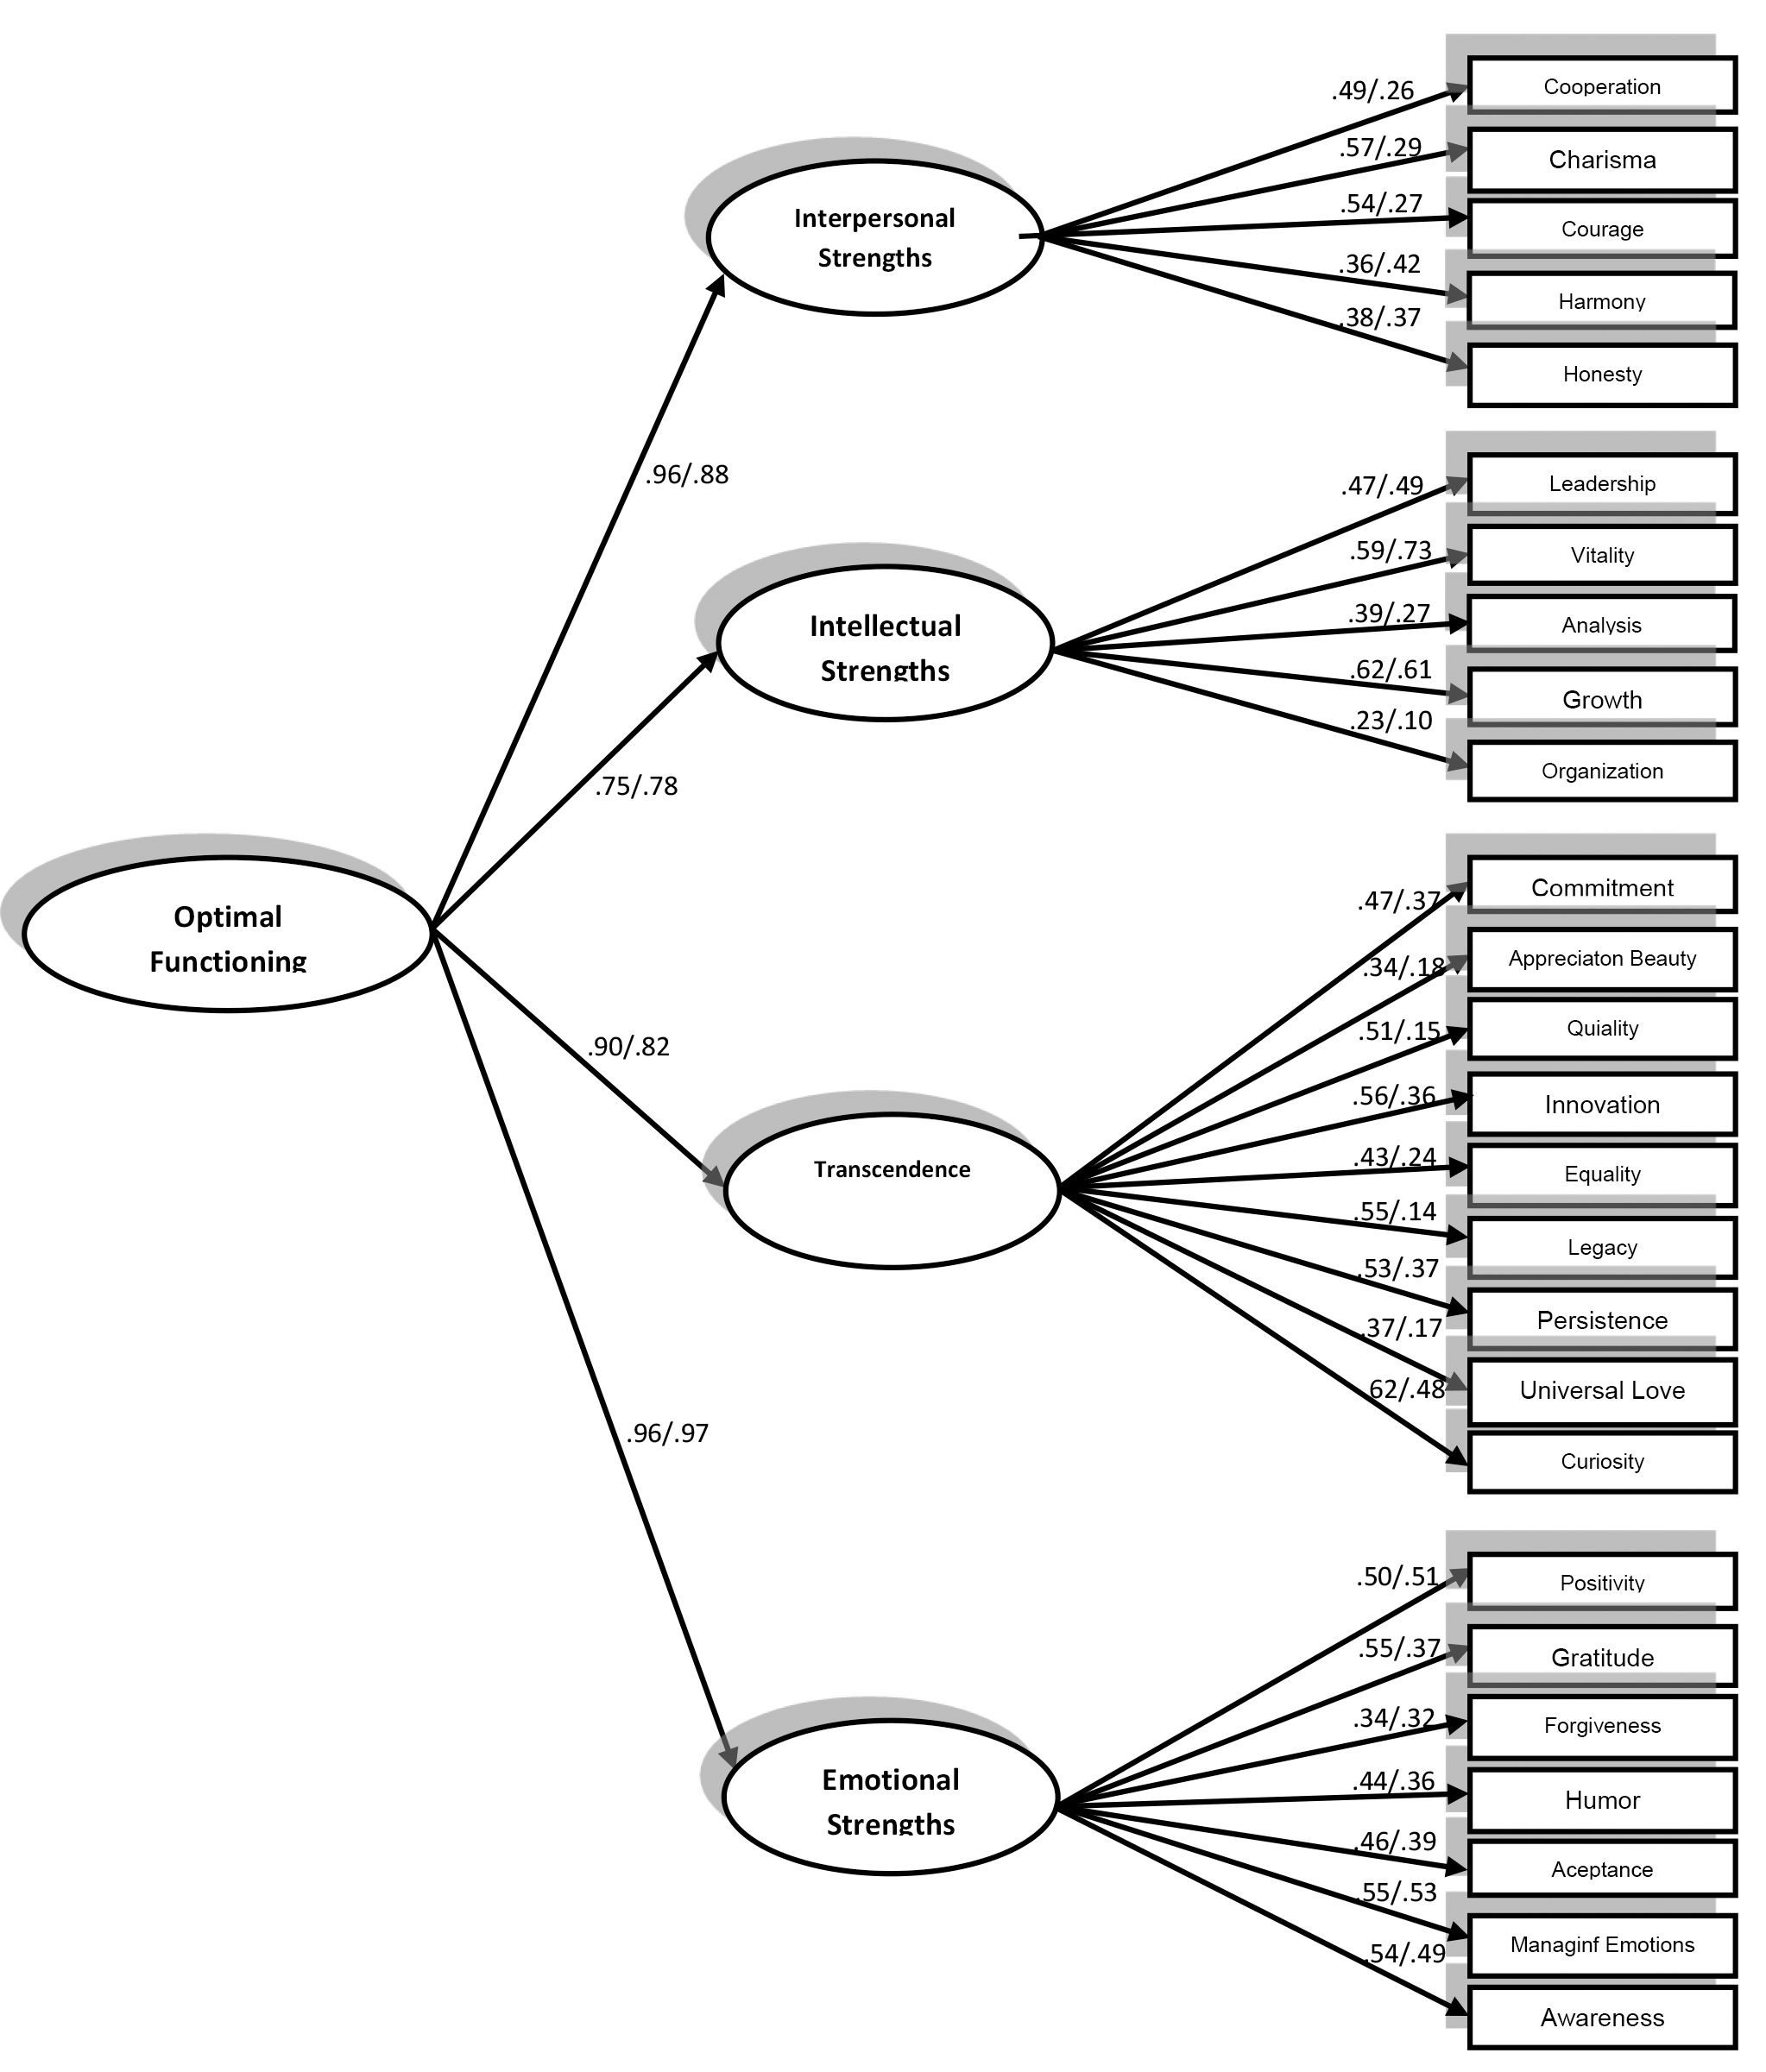
Three confirmatory models were compared for both samples separately: a model of a single general factor of optimal functioning, a model of 4 independent factors and a hierarchical model made up of one secondary order factor and 4 first order factors. Table 2 represents the adjustment indices. The hierarchical model clearly offers the best goodness of fit. The majority of indices are within the parameters of good fit, showing better adjustment in Sample 1 that in Sample 2. Fig. 1 displays this model with its corresponding factor loading in both samples. The majority of factor loadings are quite high, specially between the second order and first order factor (between 0.75 and 0.97).
| Model | Sample | GFI | NFI | CFI | TLI | PGFI | PNFI | RMSEA | Residuals | |
| One factor | 1 | 2.352 | 0.936 | 0.827 | 0.892 | 0.882 | 0.795 | 0.758 | 0.040 | 6.84% |
| 2 | 2.243 | 0.944 | 0.718 | 0.819 | 0.802 | 0.801 | 0.658 | 0.037 | 9.97% | |
| Four factors | 1 | 5.799 | 0.850 | 0.571 | 0.614 | 0.580 | 0.724 | 0.525 | 0.075 | 66.95% |
| 2 | 4.270 | 0.893 | 0.461 | 0.522 | 0.480 | 0.760 | 0.425 | 0.060 | 49.29% | |
| Hierarchical | 1 | 1.952 | 0.950 | 0.858 | 0.924 | 0.917 | 0.798 | 0.778 | 0.033 | 5.41% |
| 2 | 2.030 | 0.950 | 0.747 | 0.851 | 0.836 | 0.798 | 0.678 | 0.034 | 10.54% |
GFI, Goodness of Fit Index NFI, Normed Fit Index; CFI, Comparative Fit Index; TLI, Tucker Lewis Index; PGFI, Parsimony Goodness of Fit Index; PNFI, Parsimony Normed Fit Index; RMSEA, Root Mean Square Error of Approximation.
 Fig. 1.
 Hierarchical model for Samples 1 (values to the left) and 2 (values to the right).
Once the fit of the hierarchical factor structure was confirmed the reliability of the scale was calculated in each sample. Table 1 show the correlations of each item with the total of the scale deleting that item. In Sample 1 none of the items shows correlations below. 20 therefore it would not be advisable to eliminate any of them (Abad et al, 2011). The reliability of the scale according to Cronbach’s alpha (
The factorial invariance of the scale was study in terms of sex and ages of the participants in Sample 1 and 2 for the hierarchical model. The samples were divided in three age groups by
| Sample 1 | |||||||
| Specific model | df | GFI | CFI | RMSEA | AIC | ||
| Model A. Unconstrained | 925.77 | 590 | 1.57 | 0.923 | 0.912 | 0.026 | 1149.77 |
| 1346.93 | 941 | 1.43 | 0.894 | 0.894 | 0.023 | 1570.93 | |
| Model B. Structural weights | 970.54 | 616 | 1.57 | 0.919 | 0.907 | 0.026 | 1142.54 |
| 1375.71 | 967 | 1.42 | 0.892 | 0.894 | 0.022 | 1547.71 | |
| Model C. Structural covariances | 971.18 | 620 | 1.57 | 0.919 | 0.908 | 0.026 | 1135.18 |
| 1388.16 | 971 | 1.43 | 0.890 | 0.891 | 0.023 | 1552.16 | |
| Model D. Measurement residuals | 1031.17 | 646 | 1.60 | 0.913 | 0.899 | 0.027 | 1143.17 |
| 1419.59 | 997 | 1.42 | 0.888 | 0.890 | 0.022 | 1531.59 | |
| Comprarison of the models | Δ | Δdf | p | ΔCFI | |||
| Models A and B (Metrical invariance) | 44.77 | 26 | 0.012 | 0.005 | |||
| 28.77 | 20 | 0.092 | 0.000 | ||||
| Models B and C (Strong metrical invariance) | 0.64 | 4 | 0.001 | ||||
| 12.45 | 4 | 0.014 | 0.003 | ||||
| Models C and D (Strict metrical invariance) | 59.99 | 26 | 0.009 | ||||
| 31.43 | 26 | 0.213 | 0.001 | ||||
| Sample 2 | |||||||
| Specific model | df | GFI | CFI | RMSEA | AIC | ||
| Model A. Unconstrained | 896.07 | 590 | 1.52 | 0.915 | 0.853 | 0.024 | 1120.01 |
| 1359.45 | 941 | 1.45 | 0.891 | 0.802 | 0.023 | 1583.45 | |
| Model B. Structural weights | 952.10 | 616 | 1.55 | 0.913 | 0.839 | 0.025 | 1124.10 |
| 1401.41 | 967 | 1.45 | 0.889 | 0.795 | 0.023 | 1573.41 | |
| Model C. Structural covariances | 957.43 | 620 | 1.54 | 0.913 | 0.839 | 0.024 | 1121.43 |
| 1413.11 | 971 | 1.46 | 0.887 | 0.791 | 0.023 | 1577.11 | |
| Model D. Measurement residuals | 1025.17 | 646 | 1.59 | 0.908 | 0.818 | 0.025 | 1137.17 |
| 1453.09 | 997 | 1.46 | 0.883 | 0.785 | 0.023 | 1565.09 | |
| Comprarison of the models | Δ | Δdf | p | ΔCFI | |||
| Models A and B (Metrical invariance) | 56.03 | 26 | 0.014 | ||||
| 41.96 | 20 | 0.003 | 0.002 | ||||
| Models B and C (Strong metrical invariance) | 5.33 | 4 | 0.255 | 0.000 | |||
| 11.70 | 4 | 0.020 | 0.002 | ||||
| Models C and D (Strict metrical invariance) | 67.74 | 26 | 0.021 | ||||
| 39.98 | 26 | 0.039 | 0.004 | ||||
AIC, Akaike Information Criterion.
The evidence of convergent validity was analysed in Sample 1. Table 1 shows the correlations of the different strengths of the FORTE test and the SWLS, as well as the factors extracted through the confirmatory factor analysis. The results are statistically significant for most variables and positive, with values between 0.19 and 0.31 for the latent factors. This indicates the presence of convergent validity evidence with the SWLS.
The present research has developed and validates a balanced strengths scale that integrates previous conceptualizations of strengths. We agree with other approaches that strengths exhibit cognitive, emotional and behavioral components that are authentic, trainable and promote growth and well-being (Peterson and Seligman, 2004). We also agree that strengths expend a low amount of energy when used, and facilitate entry into the state of flow, which leads to a high perception of self-efficacy regarding what one is doing, improves engagement and task concentration, and the sensation that time flies (Linley, 2008). Additionally, we consider that, with training, existing talents can become strengths, and their use foments high performance (Asplund et al, 2007). Notwithstanding, we differ in the approach that, to be adaptive, a strength must present a high value on the measurement scale. We consider that strengths used in a balanced fashion are those most related to general satisfaction with life, meaning that optimum function foments greater satisfaction. This result has future implications in designing clinical interventions for individuals with low life satisfaction, since training oriented toward improving balance between one’s strengths would improve this satisfaction and would prevent unhealthy behaviors.
Our results, replicated in two independent, large size samples, heterogeneous in age, sex and occupation, show that the FORTE scale is grouped in a hierarchical factorial structure with a general factor of optimal functioning and four related first-order factors (Emotional strengths, Interpersonal strengths, Transcendence strengths and Intellectual strengths). Furthermore, the samples used are quite varied depending on sex, age and occupation, which allows a greater generalization of the results.
It presents adequate reliability, is not influenced by social desirability, has factorial invariance in terms of sex and age, and is positively related to a previous measurement of life satisfaction (SWLS). The strengths measurement measures 26 strengths with fewer items than other scales (such as the VIA-IS, Strengths Profile, Clifton Strengths), which will be helpful when the time available for evaluation is reduced. Also, the present scale aimed to integrate the different labels and descriptions used to refer to strengths, proposing a common language.
When we compare the factorial structure of the scale with previous studies that used oblique rotation in the factor analysis, none of them had suggested a hierarchical model with a general second order factor. With regards to the first order factors there are other authors who found 4 invariant factors of strengths in terms of sex and age (McGrath and Walker, 2016) just like on our case. Our results differ from authors who proposed the existence of 5 factors of strengths (Azañedo et al, 2017; McGrath, 2014; Peterson and Park, 2004; Peterson and Seligman, 2004).
The different factors of strengths obtained in this study are related to previous studies. Emotional Strengths represent the hedonic element of life. This element is associated with life satisfaction, hope, gratitude, school engagement, vitality and physical activity (Kern et al, 2015). This explains why authors such as Macdonald et al. (2008) or Brdar and Kashdan (2010) propose strengths groupings called Positivity (including character strengths that reflect the idea of being positive and active in life and at work), or Vitality (a global factor of positive qualities that include enthusiasm, humor, hope and others). Nevertheless, the strengths grouped in this factor do not only indicate a tendency to approach life in a positive way, but also strengths that are included in the factors of prudence and responsibility, which bear self-regulation of attitudes and actions that converge therein (Brdar and Kashdan, 2010; Macdonald et al, 2008). Also embedded within this factor are other scales, such as forgiveness, humor and gratitude, which are considered interpersonal elements by other authors (for example, Brdar and Kashdan, 2010 or Khumalo et al, 2008), and are key elements to balance positive and negative affect (Sapmaz et al, 2016).
The factor of Interpersonal Strengths comprises behaviors aimed at nurturing relationships and fostering the feeling of support and community (Seligman, 2011). Practically all studies reviewed include a factor of interpersonal strengths (Azañedo et al, 2014; Brdar and Kashdan, 2010; Littman-Ovadia and Lavy, 2012; McGrath, 2014; Peterson et al, 2008; Ruch et al, 2010). Nevertheless, there is no consensus as to which strengths are to be included in this factor, and there are studies that use different terminologies, such as niceness (Macdonald et al, 2008) or social strengths (Shryack et al, 2010) to refer to this same concept. Another example is the strength factor of civic strengths by Singh and Choubisa (2010), which reflects the basis of a healthy community life that fosters successful interactions and a sense of belonging. In our study, the strengths grouped under the positive relations factor include harmony, which is the capacity to stay calm in complex moments, courage and honesty, strengths that are considered regulating or interpersonal strengths (Littman-Ovadia and Lavy, 2012; Ruch et al, 2010).
The factor of Intellectual Strengths includes strengths such as growth or analysis that conceptually overlap with the VIA-IS strengths of curiosity, love of learning or critical thinking, and which have been considered by other authors to be related to the acquisition and application of knowledge (Singh and Choubisa, 2010), and to cognitive activity (Macdonald et al, 2008). In this factor, they go along with vitality, a strength included in very diverse types of factors, ranging from theological or transcendental (McGrath, 2014; Peterson et al, 2008), intellectual (Shryack et al, 2010) and intrapersonal to self-assurance (Singh and Choubisa, 2010). This element of vitality is central to finding the daily motivation and energy to face our goals. Therefore, it also includes strengths such as leadership and organization that refer to the interpersonal element of goal attainment. These strengths coincide with the definition of leadership made by the VIA-IS.
Lastly, the factor called Transcendental Strengths refers to meaning in life and the generation of goals that have an impact that reaches beyond the individual. Transcendental corresponds greatly with the definition of the virtue of transcendence (Peterson and Seligman, 2004), that forges connections to a broader sense of universe, generating meaning in life (Singh and Choubisa, 2010). Again, there is no consensus as to which strengths are to be grouped under this term. In this study, the factor of meaning includes strengths that are considered theological or transcendental strengths, and other strengths such as equity, curiosity and persistence, which are linked to the development of goals that transcend the individual and have been considered interpersonal (Macdonald et al, 2008; Ruch et al, 2010; Shryack et al, 2010), intellectual (Macdonald et al, 2008; Peterson et al, 2008; Singh and Choubisa, 2010), and regulatory (Brdar and Kashdan, 2010; Macdonald et al, 2008; Ruch et al, 2010), respectively.
The main difference of the present study in comparison to previous ones is the proposal of a general factor called Optimal Functioning. This factor indicates whether an individual uses his strengths in a way that is adaptive to their environment, with higher scores suggesting higher awareness of strengths and higher satisfaction being derived from their usage. The only author to propose a general factor called “goodness” is Macdonald et al. (2008), yet it is not a hierarchical factor. Unlike previous proposals, the factor of Optimal Functioning provides for a representation of the overall level of satisfaction of the individual, not just the strengths that are balanced.
As in previous studies, we have found converging validity between our scale and satisfaction with life (Azañedo et al, 2014; Park et al, 2004; Ruch et al, 2010). In this study, the correlations for strengths are slightly lower than in previous studies, but when taking into account the latent factors, similar values are found (r = 0.19 to 0.31). This data indicates that individuals who show a balanced way of using their strengths may have higher levels of satisfaction with life. This has implications for future research with regards to the design of clinical interventions for populations with low levels of life satisfaction, given that programs aimed at developing a more balanced use of strengths could improve life satisfaction and prevent imbalanced and unhealthy behaviors.
It will be essential to replicate the results in other populations, e.g., clinical, and increase the evidence of the questionnaire’s validity, and apply it to different cultures in order to evaluate the possible differences in expressing strengths. Furthermore, the FORTE questionnaire could be studied in relation to other strengths measures, such as the VIA-IS (Peterson et al, 2005), the Strength Profile questionnaire (Linley and Dovey, 2012) and the Clifton Strengths (Asplund et al, 2007) to analyze the evidence of convergent validity. Moreover, recent studies have found a positive relationship between strengths and PERMA dimensions (Wagner et al, 2020). These findings open new doors in studying wellbeing that could guide the development of strength-based interventions adapted to individual needs. Finally, remaining pending is a study, based on the degree of balance, on the relationship between strengths and psychological malaise, in order to analyze their relationship with this type of construct.
We conclude that the FORTE scale would be an appropriate measure of balanced strengths grouped hierarchically into four first-order strengths factors (interpersonal, intellectual, transcendence, and emotional). And in turn these four factors would be grouped into a general second-order factor that we have termed optimal functioning. This factor structure is stable in both sexes and at different ages. Moreover, it is related to life satisfaction.
Data and materials are available by contacting the first author (dafnec@iepp.es).
DC, conceptualization, data collection, manuscript writing. JN, supervision of data collection, manuscript writing. JP, data design and analysis, manuscript writing. All authors read and approved the final manuscript. All authors have participated sufficiently in the work and agreed to be accountable for all aspects of the work.
This study was conducted in accordance with the Declaration of Helsinki. The Ethics Committee of the Cardenal Cisneros Center for Higher Education approved the present investigation (approval number: 20-09-2020). Informed consent was obtained from all participants.
Not applicable.
This research received no external funding.
The authors declare no conflict of interest.
Description of the FORTE strengths.
1. Acceptance: Discerning what can be changed from what is better to be accepted in order to adapt. 2. Analysis: Valuing taking time to think about different options or consequences derived from a decision before chose an option. 3. Appreciation of Beauty: Paying attention fully to elements that are considered beautiful with heightened levels of concentration. 4. Harmony: Being able to stay calm in complex moments. 5. Quality: Making an effort to do things well, deriving pleasure and enjoyment from seeking excellence in areas that are important. 6. Charisma: Appreciating talent and excellence in others, being naturally able to identify positive qualities in others. 7. Emotional Awareness: Naming and making sense of emotions, expressing feelings with clarity. 8. Cooperation: Taking care and supporting others in groups, appreciating the sense of belonging and prioritizing collective growth over the individual. 9. Growth: Thinking that there are always ways of improving, searching for the development of personal projects or being part of projects that allow for promotion, improvement or growth, either financially, in terms of knowledge or socially. 10. Commitment: Keeping one’s word and promises, honouring one’s pledge. 11. Curiosity: Valuing novelty, discovery and getting to know new things. 12. Leadership: Proposing activities to others, engaging them in following courses of action. 13. Equality: Treating others equally and making sure that there are as little differences as possible. 14. Gratitude: Focusing on the good things one has, feeling grateful for the positive, small things in life and expressing feelings of gratitude. 15. Honesty: Valuing truthfulness and frankness. 16. Humour: Focusing on the amusing and funny side of things that happen, looking for a sense of cheerfulness and joyfulness. 17. Innovation: Analysing reality with a wide lens, showing flexibility when contemplating a wide range of possibilities. 18. Legacy: Doing what makes a positive impact in the world, firmly believing that what one does today has a purpose in the future. 19. Managing emotions: Knowing and feeling confident about using personal resources to manage emotions effectively. 20. Organization: Anticipating and planning future actions or possible alternatives. 21. Forgiveness: Giving a new meaning to hurt and damage to alleviate its impact and construct a resilient way of coping with painful situations. 22. Persistence: Reaching goals by means of effort and perseverance, while staying flexible along the way. 23. Positivity: Looking at things in a balanced way so that the positives outweigh the negatives, without ignoring the latter. 24. Universal Love: Looking after the wellbeing of all living beings in general, having an elevated sense of empathy and getting involved in projects that care for the planet, and its current and future inhabitants. 25. Courage: Facing personal challenges as well as defending other’s rights and vouching for their safety. 26. Vitality: Feeling a sense of energy and motivation on a day to day basis.
Instructions of the FORTE strengths.
Instructions: Three sentences should be ordered from highest to lowest degree of agreement. For example, given the following sentences:
• When nothing can be changed, it is better to let go and not resist/struggle uselessly. • I am not easily satisfied with the circumstances I live in I feel good when I do what. • I can to improve and accept what I cannot change.
You should choose which sentence you agree with the most by giving it a 1, the second one you agree with the most by giving it a 2 and the one you agree with the least by giving it a 3.
There are no right or wrong phrases, each person can choose the one he/she considers appropriate. Please answer as honestly as possible.