


 , Ewelina Bledniak 1,2, Rachael M. Harrington 2,3, Robin Morris 1,2,4, C. Nikki Arrington 1,2,4
1 Department of Psychology, Georgia State University, Atlanta, GA 30303, USA
2 Georgia State/Georgia Tech Center for Advanced Brain Imaging, Atlanta, GA 30318, USA
3 Department of Communication Sciences and Disorders, Georgia State University, Atlanta, GA 30303, USA
4 Georgia State University/Georgia Institute of Technology/Emory University Center for Translational Research in Neuroimaging and Data Science (TReNDS), Atlanta, GA 30303, USA
Abstract
Transcranial magnetic stimulation (TMS) is considered a promising technique to noninvasively modulate cortical excitability and enhance cognitive functions. Despite the growing interest in using TMS to facilitate reading performance in learning disabilities, the immediate TMS-induced effects on brain activity during reading and language tasks in adults with typically developed reading skills remain to be further investigated. In the current study, we explored how a single offline session of intermittent theta burst stimulation (iTBS) delivered to core left-hemisphere nodes of the dorsal and ventral reading network changes brain activity during a spoken and written reading task.
A total of 25 adults with typically developed reading skills participated in a sandwich design TMS-functional magnetic resonance imaging (fMRI) study, which was comprised of a baseline fMRI picture-word identification task that involved matching written or spoken words to picture cues, a single transcranial magnetic stimulation (TMS) session to either the left supramarginal gyrus (SMG) or the left middle temporal gyrus (MTG), followed by a post-stimulation fMRI session. A whole-brain analysis based on the general lineal model (GLM) was used to identify overall activated regions during the processing of spoken and written words. To identify differences between pre-and post-stimulation fMRI sessions, a paired sample t-test was conducted for each group separately (SMG and MTG groups).
Significant differences were found between pre-and post-stimulation fMRI sessions, with higher functional activation (post > pre) for spoken words only following SMG stimulation, and for both spoken and written words following MTG stimulation, in regions associated with the reading network and additional cognitive and executive control regions.
Our results showed how a single-offline TMS session can modulate brain activity at ~20 minutes post-stimulation during spoken and written word processing. The selective contribution of the SMG stimulation for auditory (spoken) word processing provides further evidence of the distinct role of the dorsal and ventral streams within the reading network. These findings could contribute to the development of neuromodulatory interventions for individuals with reading and language impairments.
No: NCT04041960. Registered 29 July, 2019, https://clinicaltrials.gov/study/NCT04041960?cond=NCT04041960&rank=1 .
Keywords
- TMS
- fMRI
- reading
- language
- words
Non-invasive brain stimulation techniques, such as transcranial magnetic
stimulation (TMS), have proven to be effective tools to modulate motor and
behavioral function in healthy and clinical populations. TMS utilizes magnetic
fields to create electrical currents in the brain tissue under the coil, leading
to neural depolarization or hyperpolarization and thereby triggering action
potentials or inhibiting them [1]. Repetitive TMS (rTMS), typically applied at
high (
The use of rTMS has also contributed to developing a better understanding of reading, a major language skill and core feature of human communication, which is essential for everyday life and cognitive development. In the reading domain, neurostimulation protocols have been applied to examine the neural correlates of word processing, providing important insights into how the brain supports reading and helping to explain neural underpinnings of developmental dyslexia and other reading disorders [3].
Connecting printed letters to their corresponding spoken sounds is a complex learning task that requires the cooperative integration of visual and auditory language modalities [4]. During spoken word processing, phonological information is integrated continuously, which serves to facilitate the mapping of phonemes onto their visual representations (graphemes) for efficient reading [5]. Neuroimaging evidence shows a left lateralized reading network that supports this. This network classically comprises three highly interconnected major circuits: dorsal, ventral, and anterior [6]. The dorsal (temporoparietal) circuit includes the posterior superior temporal gyrus (pSTG; historically known as Wernicke’s area), the supramarginal gyrus (SMG) and angular gyrus (AG), which are primarily involved in phonological decoding (sound-to-letter mapping). The ventral (occipitotemporal) circuit encompasses the occipitotemporal cortex (OTC) as well as the inferior and middle temporal gyri (ITG; MTG), and is engaged in the processing of visual (printed) text and orthographic patterns, facilitating reading fluency and automatic/sight word recognition [7]. Both ventral and dorsal circuits connect with the anterior circuit, centered around Broca’s area in the inferior frontal gyrus (IFG). In addition to being engaged with attention, working memory and other cognitive domains, the left IFG is associated with naming, silent reading, and speech-gestural (articulatory) recoding [8].
Several studies have applied rTMS to targeted cortical regions of the reading network or its right hemisphere homolog to specifically modulate reading-related skills (see [9] for a systematic review). For instance, high frequency rTMS (10 Hz) applied to the left or right SMG, has been shown to slow responses to words but not to pseudowords [10]. More recently, Harrington and colleagues applied a unique form of TMS, known as intermittent theta burst stimulation (iTBS) over the left SMG, reporting facilitation effects (i.e., speeded reaction times) during a phonological discrimination task but not during an orthographic awareness task [11]. These findings provide further evidence that the SMG is strongly linked to phonological aspects of word processing. Likewise, stimulation of the MTG, a key node with the ventral reading stream, has also been shown to modulate automatic word recognition, as it is particularly involved in the recognition of visual and orthographic patterns. Some studies, for example, have used rTMS at 1 Hz for 10 minutes to induce a temporary suppress functioning of the left posterior MTG of healthy adult readers, reporting slowed reaction times on tasks that required encoding the meaning of the words (i.e., semantic processing) following stimulation [12, 13, 14].
While TMS research for modulating reading behavior has expanded over the past 10 years, only a few studies have combined rTMS protocols with neuroimaging techniques [15, 16, 17, 18], paving the way to better understand the underlying neural mechanisms of stimulation-induced changes during reading and language-related tasks. Combining rTMS with neuroimaging seems to be particularly suitable for assessing the “offline” or after-effects of rTMS [19]. Indeed, functional neuroimaging techniques are reported to be more sensitive in capturing stimulation effects at the neural network level, even when such effects may not be sufficient to induce behavioral change [20].
A plausible explanation for the observed behavioral changes following rTMS is that there are changes in brain activation, either increased or decreased functional activation, in the targeted brain region and across networks connected to that region [15, 21]. Studies have shown that rTMS seems to particularly impact the blood oxygen level-dependent (BOLD) activity detected in functional magnetic resonance imaging (fMRI) [22, 23, 24]. This has led researchers to hypothesize that rTMS could improve reading performance in adults and children with reading impairments by modulating their brain’s reading pathways. Specifically, the left-hemisphere network used by skilled readers tends to show decreased activation in poor readers [4]. Previous neuroimaging research has shown that reading improvement in dyslexia was mediated by an increase in the activation of typically hypoactive left-hemispheres areas (also referred to as “normalization”) and by additional activation in the right hemisphere regions, including right IFG (as a “compensation” mechanism) [25]. In 2013, Costanzo and collaborators [26] provided the first evidence that high frequency rTMS over two critical dorsal regions (left STG and left inferior parietal lobe), known to be underactive in dyslexia, improved their reading performance. The same regions had previously been found to improve reading skills in typical readers [27]. However, the neural mechanisms behind these facilitatory effects have remained largely unclear.
In the present study, we sought to investigate the functional network changes of spoken and written word processing induced by a single offline session of iTBS applied to targeted nodes of the dorsal and ventral streams of the reading network. iTBS is a well-established rTMS protocol that is thought to increase cortical excitability in targeted brain regions for up to 60 minutes [28]. Since the dorsal circuit’s association with phonological processing has been consistently demonstrated [5, 29, 30], we hypothesized that iTBS to a key node of the dorsal circuit (i.e., the left SMG) would induce greater brain activation and primarily modulate responses to spoken words post-stimulation. Additionally, following stimulation of a primary node of the ventral circuit (i.e., the left MTG) we expect greater activation that would primarily impact responses to written words, given the association of ventral stream with automatic visual/orthographic whole-word recognition, and the proven sensitivity of ventral (occipitotemporal) regions for print [31].
The sample included right-handed, native English-speaking adults (N = 25; 20
females), aged between 18 and 47 years (mean = 24.25, SD = 6.93), with no prior
history of neuropsychiatric, developmental disorders or known hearing impairment.
All participants had a Full-Scale IQ score (FSIQ2) at or above 80 based on the
2-subtest version of the Wechsler Abbreviated Scale of Intelligence (WASI2) [32]
and had reading performance within age expected norms (
| SMG | MTG | |
| Age | 27.02 (7.79) | 20.11 (1.39) |
| Gender (F/M) | 11/4 | 9/1 |
| WJ-III Basic score | 101.40 (8.83) | 101.80 (6.71) |
| WASI2_FSIQ2 | 111.73 (13.59) | 108.70 (11.45) |
SMG, supramarginal gyrus; MTG, middle temporal gyrus; F, Female; M, Male; WASI2, Wechsler Abbreviated Scale of Intelligence; FSIQ2, Full-Scale IQ score; WJ-III, Woodcock Johnson-III.
The present offline rTMS-fMRI study comprised of a baseline session which included a series of behavioral reading/language assessments and an magnetic resonance imaging (MRI) scan that consisted of a functional task (see section 2.2.1). Stimulation sessions consisted of administration of iTBS to either the left SMG or MTG. Stimulation was followed by a post-stimulation fMRI scan (~20 minutes post-stimulation). Baseline (pre) and post-stimulation sessions were separated by at least 12 days to prevent carry-over effects of the functional task.
To assess functional activation before and after stimulation in response to print and speech, participants completed a picture-word identification task in which they judged whether a target stimulus (written or spoken word) matched a visual picture cue (Fig. 1). This task has shown high mean accuracy (greater than 85% in the current sample) and has proven to be highly sensitive to individual differences in reading skills [4, 5, 34]. During the experimental task, a picture of common items (e.g., dress) remained on the screen for 40–65 seconds, before being replaced by a new picture. The target items were presented following an event-related protocol: written words were displayed in a box below the picture (for 3000 ms), or auditory words were delivered via headphones. Participants were instructed to indicate via button press whether the spoken or written word matched the picture cues. As previously described by Malins and colleagues, 1/6 of trials matched the picture and 5/6 of trials did not match the picture [34]. Across all trials, the time between trial onset was jittered between 4 and 13 seconds. To average over similar responses, the analysis was restricted to functional activation of spoken and written words for the mismatch trials (25 trials in total for each mismatched condition).
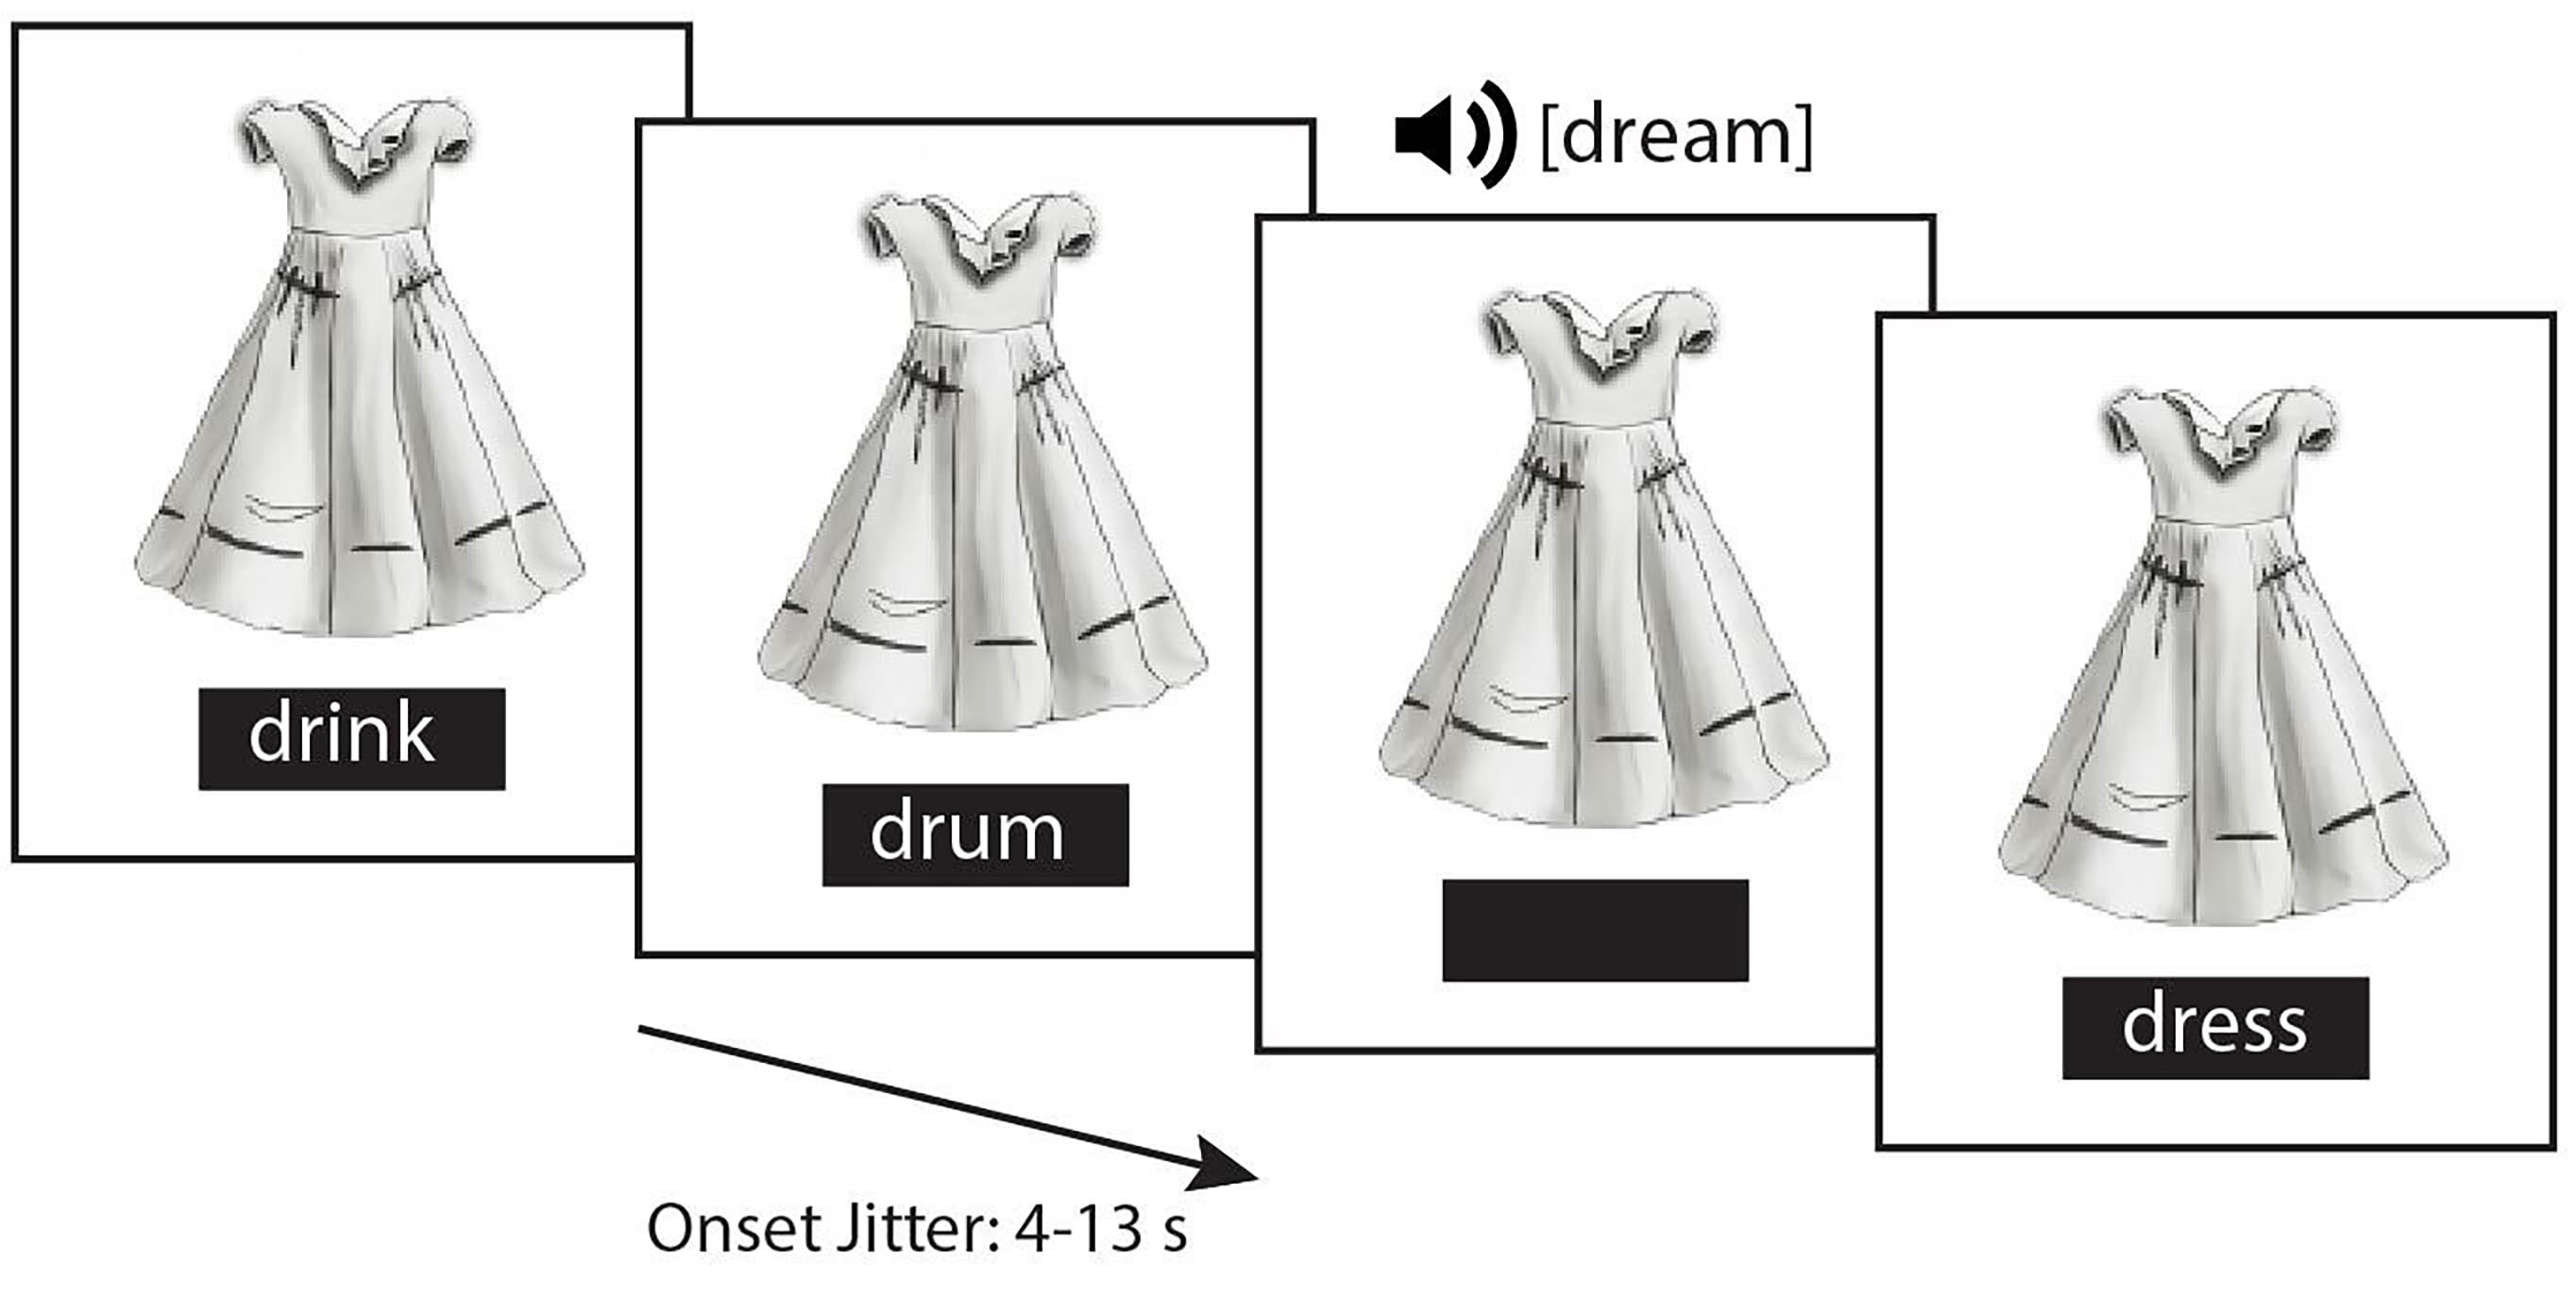 Fig. 1.
Sample trial sequence of the fMRI picture-word identification task. fMRI, functional magnetic resonance imaging.
Structural and functional MRI images were acquired with a 3 Tesla Siemens Tim
Trio scanner (Siemens Healthineers, Erlangen, Germany) at the GSU/Georgia Tech Center for Advanced Brain Imaging. For the
structural images, a T1-weighted magnetization prepared rapid gradient echo sequence (T1-MPRAGE) image (TR = 2250 ms, TE = 4.18 ms, voxel size =
1.0 mm
Functional volumes were acquired using a T2∗-weighted gradient-EPI
sequence with the following parameters: TR = 2000 ms, TE = 30 ms, flip angle =
77°, FOV = 220 mm, voxel size = 3.4
During stimulation, participants were comfortably seated with legs uncrossed, and a cap was placed on their head to help localize the motor hotspot. The motor thresholding hotspot was initially identified as the halfway point between nasion and inion and 1/3 of the length between vertex and the tragus of the left ear. The hand area of the primary motor cortex was then identified in this area through visible muscle contraction from the relaxed first dorseus interosseus (FDI) muscle following single pulse TMS via a MagPro X100 stimulator (MagVenture, Lucernemarken 15 DK-3520 Farum, Sjælland, Denmark) with a figure-of-eight coil (C-B60, MagVenture, Lucernemarken 15 DK-3520 Farum, Sjælland, Denmark). Participants were then instructed to raise their right arm in front at a 90-degree angle and contract their right hand into an “OK” sign. The active motor threshold (AMT), defined here as the minimum stimulation intensity required to cause muscle contracture, was obtained using the Parameter Estimation by Sequential Testing (PEST) method (Medical University of South Carolina, Charleston, SC, USA) and visual confirmation of muscle contraction [35].
Prior to stimulation, subjects’ heads were co-registered to their T1-MPRAGE image using fiducial points. Stereotactic neuronavigation (TMS Navigator, Localite GmbH, Bonn, Germany) was then used to target anatomically defined regions (SMG: apex of ascending ramus of superior parietal gyrus; MTG: midline of gyrus, immediately ventral to central sulcus). The iTBS protocol consisted of a series of 20 sets of 3-pulse bursts at 50 Hz repeated every 200 ms for a total of 600 pulses [36]. Protocol was delivered via the MagPro X100 stimulator (MagVenture, Lucernemarken 15 DK-3520 Farum, Sjælland, Denmark) with a passively cooled figure-of-eight coil (MCF-B65, MagVenture, Lucernemarken 15 DK-3520 Farum, Sjælland, Denmark) at 80% of individual AMT. Participants were asked to read words from the Test of Word Reading Efficiency [37] silently during active stimulation.
fMRI analysis was performed using FEAT (FMRI Expert Analysis Tool), part of the Functional Magnetic Resonance Imaging of the Brain FMRIB’s Software Library (FSL, https://fsl.fmrib.ox.ac.uk/fsl/docs/#/), version 6.0. Pre-statistical processing included: brain extraction using BET [38], motion correction (Motion Correction by FMRIB’s Linear Image Registration Tool; MCLFIRT) [39], spatial smoothing using a Gaussian kernel of FWHM 5mm and high-pass temporal filtering (Gaussian-weighted least-squares straight line fitting, with sigma = 50.0 s). Each participant’s fMRI was registered to their T1-MPRAGE image using Boundary-Based Registration (BBR) available in FSL, and this latter (T1-MPRAGE) was registered to the Montreal Neurological Institute standard space (MNI 152_2mm_brain template) using FLIRT (FMRIB’s Linear Image Registration Tool) [39, 40], which was then further refined using FNIRT nonlinear registration tool in FSL. Registration quality was checked by visual inspection.
After the preprocessing, a whole-brain analysis based on the general linear
model (GLM) was performed with local autocorrelation correction [41]. The single
subject-level GLM included regressors for matched and mismatched conditions for
each of the two task runs for each participant. Additionally, six motion
correction parameters plus extended parameters (using MCFLIRT) were included in
the model as regressors of no interest. Conditions were modeled using a
double-gamma hemodynamic response. For the model to best fit the time course of
the actual data acquisition, temporal filtering was applied, and temporal
derivatives of each condition were also included. The participant’s two runs were
combined in fixed effect models and then entered a group-level analysis using
FLAME 1+2 (FSL’s local analysis of mixed effects, stage 1 and stage 2) for each
session (pre-and post-stimulation). To evaluate for differences between pre-and
post-stimulation sessions (Post
Significant clusters were inspected in FSLeyes atlas view based on the MNI coordinates of the peak activation for each cluster. We used the Harvard-Oxford atlases (cortical and subcortical) for cluster location and inspection. Cerebellar Atlas in MNI152 space after normalization with FLIRT was used to access cerebellar activation.
Functional activations pre-and-post stimulation for spoken and written words in
each group (SMG and MTG) are shown in Fig. 2. Results of the difference between
pre-and post-stimulation are displayed in Fig. 3. Overall, significant
differences were found between the two fMRI sessions, with higher functional
activation post-stimulation in comparison to baseline (Post
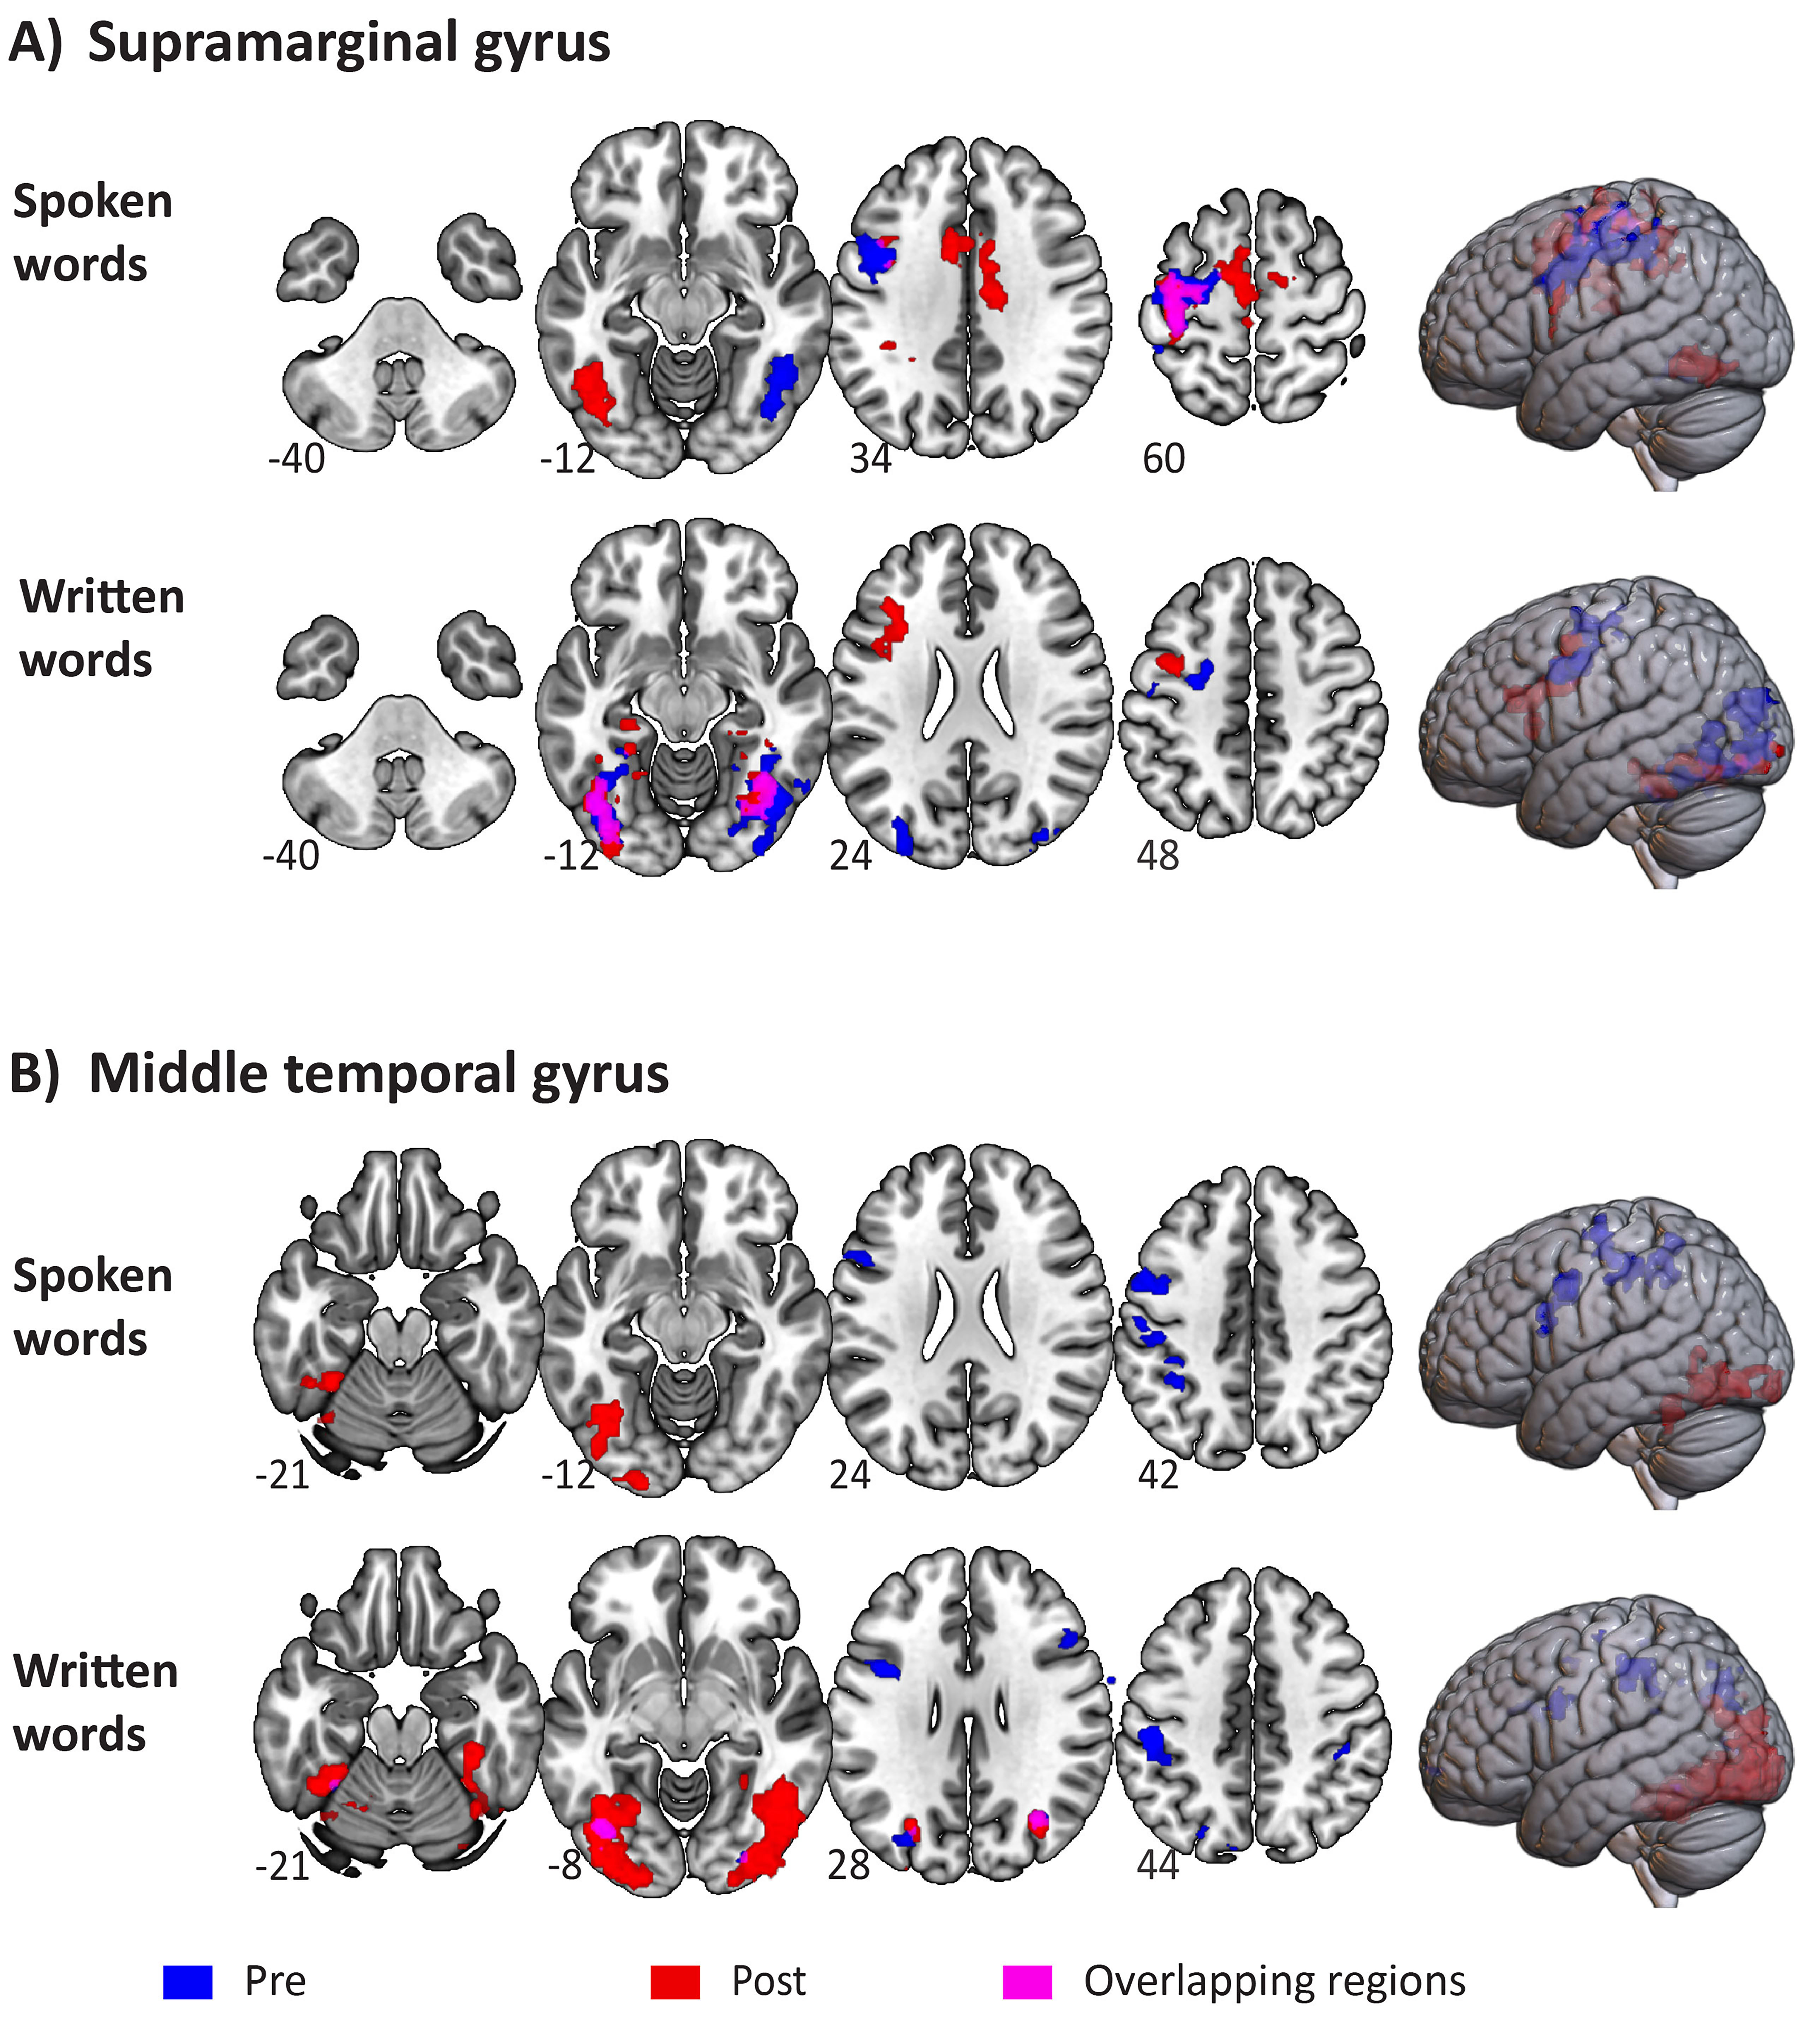 Fig. 2.
Functional activation pre-and post-stimulation for spoken and written words. (A) Functional activation pre-and post-stimulation to the left supramarginal gyrus. (B) Functional activation pre-and post-stimulation to the left middle temporal gyrus. Functional activation pre-and post-stimulation activations are shown in blue and red colors, respectively. Overlapping activated regions are shown in purple. Images are presented in neurological convention, with the left hemisphere on the left side of the image.
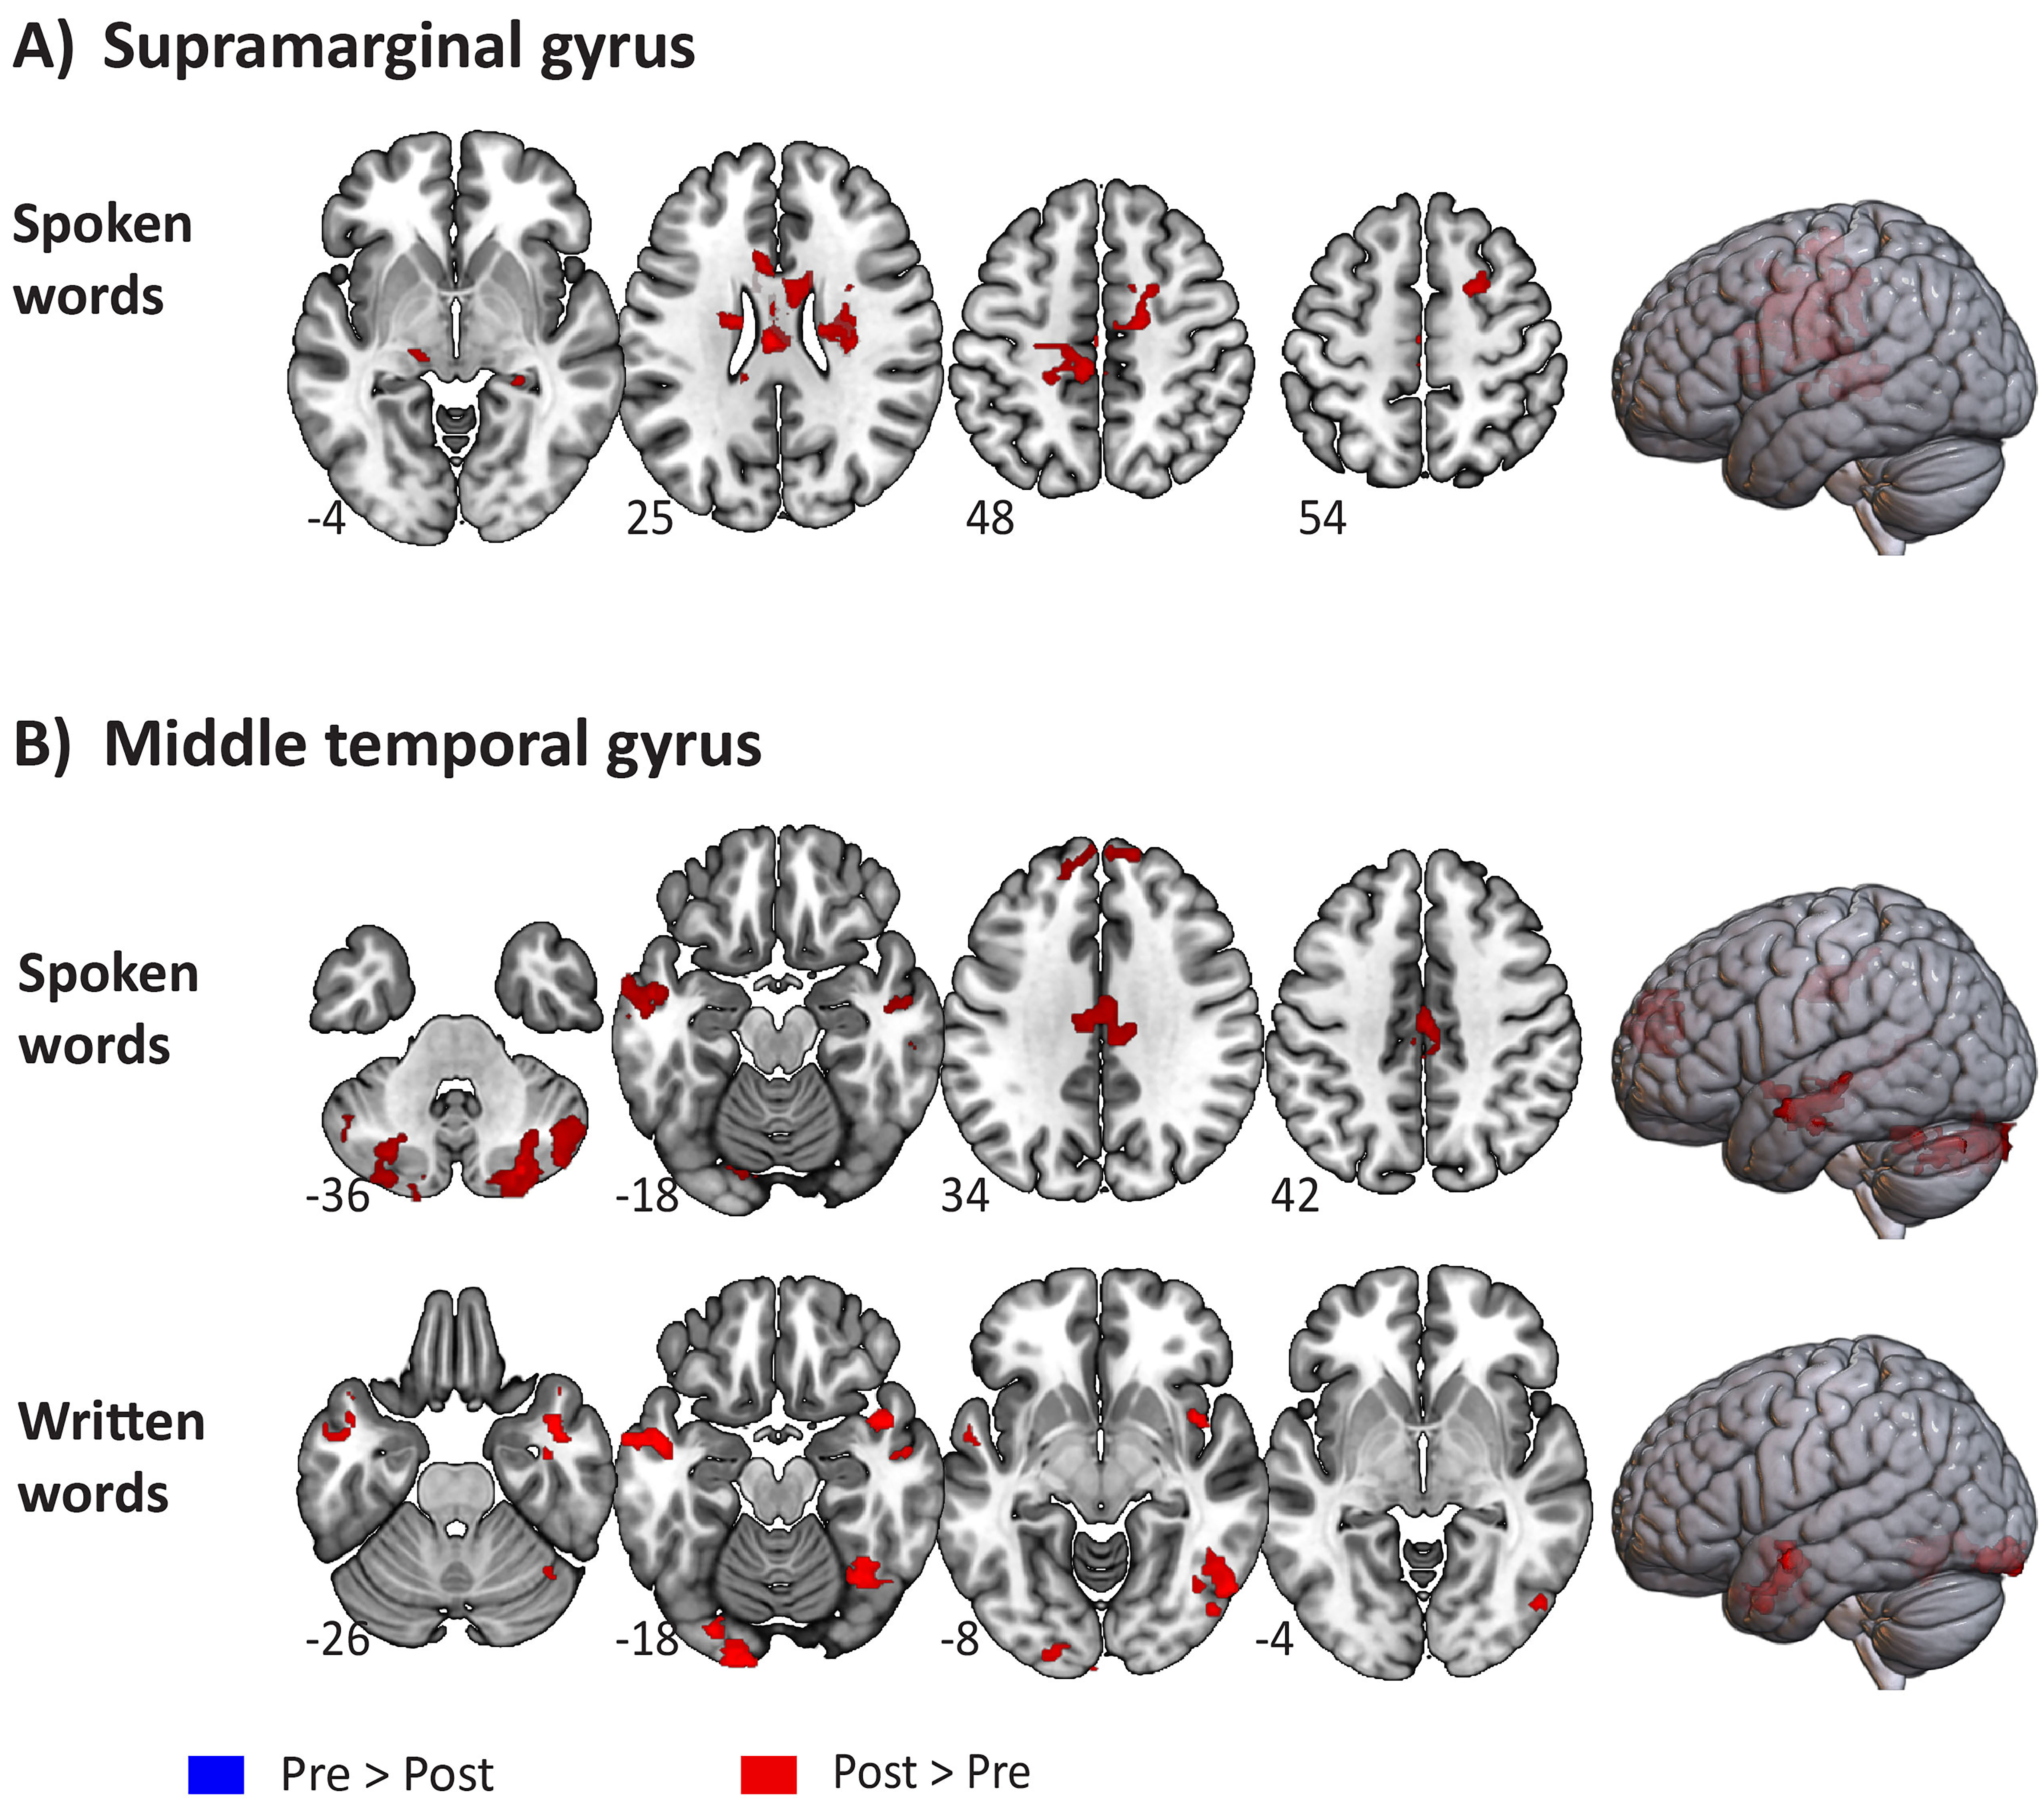 Fig. 3.
Significant differences in functional activation between the
pre-and post-stimulation sessions for spoken and written words. (A) Significant
differences pre-vs post-stimulation to the left supramarginal gyrus. (B)
Significant differences pre-vs post-stimulation to the left middle temporal
gyrus. Comparisons (Pre
For the group who received stimulation to the left SMG, distributed areas of
significant activation were engaged during the processing of spoken words in both
the pre- and post-stimulation sessions (see Fig. 2A). As indicated in Table 2,
the most significant cluster at baseline included voxels across left
frontoparietal regions including precentral and postcentral gyri, middle frontal
gyrus (MFG), IFG corresponding to the pars opercularis, and SMG. A second
significant cluster was mainly distributed across right temporooccipital regions.
After stimulation to the left SMG, spoken words engaged similar/overlapping
regions across left frontoparietal regions (precentral and postcentral gyri, MFG
and SMG), as well as bilateral frontal regions, including the supplementary motor
cortex (SMC), the superior frontal gyrus (SFG) and the cingulate and
paracingulate gyri (Fig. 2A). Left temporooccipital regions, including the
fusiform gyrus were also activated (see significant clusters, MNI coordinates and
anatomical labels in Table 2). Paired t-tests showed significant
differences between the two fMRI sessions for the processing of spoken words,
with higher activation post-SMG stimulation (Post
| Cluster | # voxels | p-value | Z-score | MNI coordinates | Location | |||
| X | Y | Z | ||||||
| Pre | 1 | 2291 | 1.12 × 10⁻¹⁰ | 3.83 | –40 | –18 | 50 | L precentral gyrus |
| 3.05 | –49 | –16 | 50 | L postcentral gyrus | ||||
| 3.00 | –50 | 12 | 32 | L middle frontal gyrus | ||||
| 2.60 | –51 | 11 | 26 | L inferior frontal gyrus, pars opercularis | ||||
| 2.39 | –48 | –37 | 45 | L supramarginal gyrus (anterior) | ||||
| 2.36 | –48 | –42 | 50 | L supramarginal gyrus (posterior) | ||||
| 2 | 388 | 0.0242 | 3.67 | 48 | –56 | –8 | R inferior temporal gyrus (temporooccipital) | |
| 2.50 | 52 | –57 | –4 | R middle temporal gyrus (temporooccipital) | ||||
| 2.50 | 45 | –67 | –16 | R lateral occipital cortex (inferior) | ||||
| 2.41 | 45 | –58 | –16 | R temporal occipital fusiform cortex | ||||
| Post | 1 | 2469 | 5.51 × 10⁻⁹ | 3.81 | –8 | 6 | 54 | L juxtapositional lobule cortex (SMC) |
| 3.42 | –4 | 9 | 58 | L superior frontal gyrus | ||||
| 3.28 | 13 | –19 | 71 | R precentral gyrus | ||||
| 2.98 | –3 | 13 | 50 | L paracingulate gyrus | ||||
| 2.98 | 6 | 5 | 50 | R juxtapositional lobule cortex (SMC) | ||||
| 2.81 | 22 | 3 | 53 | R superior frontal gyrus | ||||
| 2.80 | 3 | 9 | 48 | R paracingulate gyrus | ||||
| 2.59 | –7 | 17 | 34 | L cingulate gyrus (anterior) | ||||
| 2 | 1699 | 9.54 × 10⁻⁹ | 3.61 | –18 | –14 | 72 | L precentral gyrus | |
| 3.21 | –43 | –28 | 51 | L postcentral gyrus | ||||
| 2.73 | –40 | 14 | 34 | L middle frontal gyrus | ||||
| 2.87 | –42 | –46 | 55 | L superior parietal lobule | ||||
| 2.50 | –45 | –45 | 54 | L supramarginal gyrus (posterior) | ||||
| 3 | 462 | 0.0384 | 3.87 | –44 | –70 | –12 | L lateral occipital cortex (inferior) | |
| 3.27 | –49 | –57 | –12 | L inferior temporal gyrus (temporooccipital) | ||||
| 3.20 | –38 | –65 | –17 | L occipital fusiform gyrus | ||||
| Post |
1 * | 2967 | 2.46 × 10⁻⁸ | 2.71 | –6 | –27 | 50 | L precentral gyrus |
| 2.63 | 24 | 7 | 55 | R superior frontal gyrus | ||||
| 2.60 | 5 | 5 | 36 | R cingulate gyrus (anterior) | ||||
| 2.55 | –2 | –1 | 37 | L cingulate gyrus (anterior) | ||||
| 2.29 | –9 | –26 | 3 | L thalamus | ||||
| 2.45 | 8 | –26 | 5 | R thalamus | ||||
| Pre |
NS | |||||||
Z statistic images for pre-and post-stimulation were thresholded using clusters
determined by Z
For written words, significant activations were observed at baseline across bilateral temporooccipital regions, as well as in the left MFG, the SFG and precentral gyrus (Fig. 2A). Similar bilateral temporooccipital regions were significantly activated post-stimulation to the left SMG, with the additional recruitment of bilateral parahippocampal gyri, the left IFG, extending to the pars opercularis and pars triangularis parts, and the left insular cortex (see Table 3). However, no significant differences were found between the pre-and post-stimulation sessions during the processing of written words.
| Cluster | # voxels | p-value | Z-score | MNI coordinates | Location | |||
| X | Y | Z | ||||||
| Pre | 1 | 1746 | 2.23 × 10⁻⁸ | 3.83 | 38 | –48 | –18 | R temporal occipital fusiform cortex |
| 3.29 | 45 | –69 | –11 | R lateral occipital cortex (inferior) | ||||
| 2.97 | 41 | –68 | –14 | R occipital fusiform gyrus | ||||
| 2.88 | 45 | –57 | –6 | R inferior temporal gyrus (temporooccipital) | ||||
| 2.83 | 35 | –86 | 16 | R lateral occipital cortex (superior) | ||||
| 2 | 1518 | 1.79 × 10⁻⁷ | 3.54 | –44 | –70 | –12 | L lateral occipital cortex (inferior) | |
| 3.27 | –36 | –74 | –13 | L occipital fusiform gyrus | ||||
| 3.10 | –32 | –88 | 22 | L lateral occipital cortex (superior) | ||||
| 3.02 | –34 | –55 | –15 | L temporal occipital fusiform cortex | ||||
| 3 | 400 | 0.0257 | 3.43 | –28 | –8 | 48 | L precentral gyrus | |
| 3.09 | –26 | –3 | 65 | L superior frontal gyrus | ||||
| 2.70 | –31 | –3 | 64 | L middle frontal gyrus | ||||
| 4 | 383 | 0.0325 | 3.49 | –44 | 10 | 34 | L middle frontal gyrus | |
| 3.12 | –54 | 0 | 39 | L precentral gyrus | ||||
| Post | 1 | 809 | 0.000559 | 3.41 | –28 | –38 | –18 | L temporal fusiform cortex (posterior) |
| 2.89 | –46 | –70 | –14 | L lateral occipital cortex (inferior) | ||||
| 2.88 | –34 | –57 | –17 | L temporal occipital fusiform cortex | ||||
| 2.75 | –22 | –38 | –15 | L parahippocampal gyrus | ||||
| 2.66 | –34 | –79 | –12 | L occipital fusiform gyrus | ||||
| 2.46 | –44 | –55 | –8 | L inferior temporal gyrus (temporooccipital) | ||||
| 2.38 | –37 | –91 | –8 | L occipital pole | ||||
| 2 | 777 | 0.000769 | 3.53 | 36 | –58 | –16 | R temporal fusiform cortex | |
| 2.95 | 36 | –46 | –20 | R temporal occipital fusiform cortex | ||||
| 2.94 | 29 | –72 | –11 | R occipital fusiform gyrus | ||||
| 2.84 | 25 | –34 | –15 | R parahippocampal gyrus | ||||
| 3 | 760 | 0.000913 | 3.52 | –42 | 0 | 38 | L precentral gyrus | |
| 3.51 | –41 | 29 | 23 | L middle frontal gyrus | ||||
| 2.97 | –44 | 28 | 21 | L inferior frontal gyrus, pars triangularis | ||||
| 2.48 | –42 | 17 | 21 | L inferior frontal gyrus, pars opercularis | ||||
| 2.68 | –30 | 20 | 6 | L insular cortex | ||||
| Post |
NS | |||||||
| Pre |
NS | |||||||
All Z statistic images for pre-and post-stimulation were thresholded using
clusters determined by Z
Before MTG stimulation, spoken words primarily activated left postcentral gyrus,
SMG (anterior), precentral gyrus and IFG (pars opercularis), while significant
clusters were observed over temporooccipital regions post-MTG stimulation (see
Fig. 2B, and detailed cluster information in Table 4). Paired t-tests
showed significant differences between functional activations pre-and
post-stimulation for spoken words, with greater activation post-MTG stimulation
(Post
| iTBS | Cluster | # voxels | p-value | Z-score | MNI coordinates | Location | ||
| X | Y | Z | ||||||
| Pre | 1 | 704 | 3.15 × 10⁻⁵ | 3.62 | –50 | –28 | 46 | L postcentral gyrus |
| 2.96 | –50 | –34 | 46 | L supramarginal gyrus (anterior) | ||||
| 2.90 | –42 | –41 | 54 | L superior parietal lobule | ||||
| 2.75 | –39 | –14 | 66 | L precentral gyrus | ||||
| 2 | 466 | 0.00131 | 3.56 | –46 | 2 | 40 | L precentral gyrus | |
| 3.14 | –55 | 14 | 22 | L inferior frontal gyrus, pars opercularis | ||||
| Post | 1 | 1028 | 9.54 × 10⁻⁷ | 3.52 | –44 | 46 | 24 | L temporal occipital fusiform cortex |
| 3.18 | –41 | 81 | –13 | L lateral occipital cortex (inferior) | ||||
| 2.93 | –49 | –51 | –24 | L inferior temporal gyrus (temporooccipital) | ||||
| 2.82 | –36 | –40 | –24 | L temporal fusiform cortex (posterior) | ||||
| 2.88 | –20 | –98 | –12 | L occipital pole | ||||
| Post |
1 | 979 | 2.38 × 10⁻⁷ | 3.69 | –28 | –76 | –32 | L cerebellum (crus I) |
| 2.98 | –16 | –90 | –31 | L cerebellum (crus II) | ||||
| 2 | 912 | 5.96 × 10⁻⁷ | 4.55 | –4 | 56 | 14 | L frontal pole | |
| 3.17 | –1 | 46 | 16 | L paracingulate gyrus | ||||
| 3.11 | –8 | 51 | 28 | L superior frontal gyrus | ||||
| 3.26 | 15 | 56 | 32 | R frontal pole | ||||
| 2.35 | 1 | 45 | 16 | R paracingulate gyrus | ||||
| 3 | 899 | 7.15 × 10⁻⁷ | 4.41 | 28 | –82 | –36 | R cerebellum (crus II) | |
| 3.07 | 26 | –82 | –27 | R cerebellum (crus I) | ||||
| 4 | 559 | 0.000135 | 3.44 | 50 | –30 | –4 | R middle temporal gyrus (posterior) | |
| 3.39 | 51 | –46 | 6 | R middle temporal gyrus (temporooccipital) | ||||
| 2.99 | 50 | –26 | 1 | R superior temporal gyrus (posterior) | ||||
| 2.67 | 52 | –54 | 16 | R angular gyrus | ||||
| 5 | 469 | 0.00069 | 3.65 | –54 | –4 | –18 | L middle temporal gyrus | |
| 3.20 | –54 | 2 | –7 | L superior temporal gyrus (anterior) | ||||
| 2.73 | –43 | 6 | –9 | L insular cortex | ||||
| 6 | 382 | 0.00318 | 3.58 | 4 | –20 | 38 | R cingulate gyrus (posterior) | |
| 2.63 | –2 | –18 | 43 | L cingulate gyrus (posterior) | ||||
| 2.49 | 4 | –39 | 54 | R precuneus cortex | ||||
| Pre |
NS | |||||||
All Z statistic images were thresholded using clusters determined by Z
For written words, the maximum activation peak before stimulation to the MTG was
observed in the left postcentral gyrus, followed by bilateral SMG, left superior
parietal lobule and left precentral gyrus. Occipital and temporooccipital regions
including the fusiform gyrus were activated post-MTG stimulation, as well as the
right parahippocampal and the left cerebellum. Significant differences in
functional activation were found between pre-and post-stimulation in the MTG
group during the processing of written words (only for the Post
| iTBS | Cluster | # voxels | p-value | Z-score | MNI coordinates | Location | ||
| X | Y | Z | ||||||
| Pre | 1 | 306 | 0.0459 | 3.87 | –50 | –26 | 44 | L postcentral gyrus |
| 2.97 | –50 | –34 | 44 | L supramarginal gyrus (anterior) | ||||
| 2.55 | –50 | –42 | 35 | L supramarginal gyrus (posterior) | ||||
| 2.52 | –34 | –46 | 42 | L superior parietal lobule | ||||
| 2.37 | –38 | –22 | 50 | L precentral gyrus | ||||
| Post | 1 | 3166 | 3.07 × 10⁻¹⁶ | 3.90 | 48 | –78 | –12 | R lateral occipital cortex (inferior) |
| 3.28 | 30 | –70 | 30 | R lateral occipital cortex (posterior) | ||||
| 3.22 | 53 | –50 | –13 | R inferior temporal gyrus (temporooccipital) | ||||
| 3.21 | 35 | –53 | –18 | R temporal occipital fusiform cortex | ||||
| 3.14 | 29 | –96 | 3 | R occipital pole | ||||
| 3.13 | 27 | –81 | –13 | R occipital fusiform gyrus | ||||
| 2.64 | 33 | 33 | –14 | R parahippocampal gyrus (posterior) | ||||
| 2 | 3111 | 4.93 × 10⁻¹⁶ | 3.99 | –32 | –88 | 20 | L lateral occipital cortex (posterior) | |
| 3.54 | –29 | –94 | –9 | L occipital pole | ||||
| 3.50 | –42 | –70 | –16 | R occipital fusiform gyrus | ||||
| 3.47 | –44 | –70 | –4 | L lateral occipital cortex (inferior) | ||||
| 3.30 | –42 | –59 | –6 | R inferior temporal gyrus (temporooccipital) | ||||
| 2.91 | –40 | –50 | –25 | R temporal occipital fusiform cortex | ||||
| 2.46 | –13 | –57 | –24 | L cerebellum (VI) | ||||
| Post |
1 | 457 | 0.00195 | 3.67 | 42 | 4 | –26 | R temporal pole |
| 3.10 | 40 | 8 | –8 | R insular cortex | ||||
| 2 | 431 | 0.003 | 3.34 | 40 | –60 | –14 | R temporal occipital fusiform cortex | |
| 3.11 | 40 | –66 | –14 | R occipital fusiform gyrus | ||||
| 2.50 | 52 | –53 | –9 | R inferior temporal gyrus (temporooccipital) | ||||
| 2.30 | 38 | –59 | –25 | R cerebellum (cruis I) | ||||
| 3 | 331 | 0.0172 | 3.54 | –54 | –2 | –22 | L middle temporal gyus (anterior) | |
| 3.44 | –53 | –1 | –13 | L superior temporal gyrus (anterior) | ||||
| 4 | 310 | 0.0253 | 3.42 | –16 | –94 | –10 | L occipital pole | |
| 3.05 | –19 | –90 | –13 | L occipital fusiform gyrus | ||||
| Pre |
NS | |||||||
All Z statistic images were thresholded using clusters determined by Z
The aim of this study was to explore the rTMS-induced effects on functional brain activation during an fMRI task involving print and speech processing. Particularly, we addressed the question of how a single-offline session of iTBS applied to targeted nodes within the dorsal (i.e., left SMG) and ventral (i.e., left MTG) streams of the reading network in adults with typically developed reading skills changes brain activity during spoken and written word processing. We provide preliminary evidence of increased activation for spoken words post-SMG stimulation and for both spoken and written words post-MTG stimulation.
iTBS is a well-established rTMS protocol that has been shown to mimic long-term potentiation, leading to a facilitatory effect [42] that may last for up to 60 minutes [28]. Consistent with the efficacy and time course of iTBS observed in the motor system, the functional changes in the present study were captured approximately 20 minutes post-stimulation, suggesting short-term neuroplastic changes. While the reading network is inherently different from the motor network in terms of size, complexity and inter-individual variability of neural responses [9, 11, 34], our pre/post fMRI results suggest that iTBS delivered to either the SMG or MTG can upregulate brain regions associated with the reading network and along with other cognitive and executive control regions that support reading and language-related processes.
These findings have implications for understanding the iTBS-induced effects on more complex networks such as used for reading. Currently, the effects of TMS on neuroimaging measures are difficult to predict and the offline effects of iTBS on task-related fMRI responses in language research have rarely been studied. Changes in functional activation during reading and language-related tasks have been primarily found after a single session of 10-Hz rTMS [18] or continuous TBS [15, 43] in healthy adults. Using the same iTBS protocol implemented in this study [36], prior work from our team has demonstrated improvements in reading performance that lasted up to 60 minutes following SMG stimulation [11]. Our findings of increased functional activation following iTBS may shed light on potential neurobiological mechanisms supporting these iTBS-induced behavioral changes.
We found higher functional activation post-SMG stimulation (compared to baseline) for spoken words in the left anterior precentral gyrus, followed by the right SFG, bilateral anterior cingulate and thalamus. However, no significant differences between pre-and post-SMG stimulation activation were observed for written words. This selective fMRI response to the sounds of words provides further evidence of the functional specificity of the dorsal circuit, specially the SMG, in phonological processing [29, 30, 44, 45].
Previous research has suggested that readers who respond to intervention programs for reading difficulties show increased activation in the precentral gyrus, a brain structure that activates the articulation or physical formation of sounds in the mouth [46]. The observed modulation in the precentral gyrus for spoken words after SMG stimulation, seems to support dominant neurobiological models of reading [46, 47], confirming the interconnection of these brain structures (SMG and precentral gyrus) as primary nodes within the dorsal (decoding) pathway. These findings may suggest that iTBS could be used in support of treatments to modulate the dorsal reading network and potentially help to rebalance the disrupted cortical excitability that exists in reading disabilities [46, 48].
Of particular interest is the upregulation of brain regions outside of the classical reading network (i.e., anterior cingulate and SFG), which are known to be involved in higher cognitive and executive control functions. Anterior cingulate activation is often linked with attentional demands and effort, supporting processes that would presumably enhance reading ability [49, 50]. A neuroimaging study reported that the anterior cingulate cortex is activated more in typical readers than dyslexic readers in word reading tasks [51]. We also observed increased activation post-SMG stimulation related to baseline in the SFG, which has been shown to participate in a variety of higher-cognitive functions, including working memory and executive function that support word decoding and reading comprehension [52]. Indeed, activation in the SFG has been found during listening and reading comprehension, which are highly correlated skills [53]. Moreover, the activation of superior frontal areas of the brain has been associated with phonological processing that is not mediated by visual (print) input among skilled readers [54]. The functional changes observed in all these regions following SMG stimulation highlights how speech processing, the foundation for the phonological aspects of reading, requires the involvement of the dorsal stream as well as other distributed brain regions that support language in general.
One additional activated distal region that was observed in the current study in
comparison to baseline (Post
Given the extant evidence that the ventral reading circuit is primarily engaged in the processing of visual/orthographic patterns of words [8, 9, 31, 57], we had hypothesized that iTBS would primarily modulate functional activation in response to written words following stimulation of the left MTG. However, we also observed several clusters comprising a large number of activated voxels after stimulation during the processing of spoken words. In line with these results, there is strong support for speech-print overlap as a universal marker of reading [58]. While past functional imaging studies have established that spoken and written language processing mostly converge in the STG [4, 59, 60], a relevant study by Rueckl and colleagues revealed that regardless of spoken words and writing systems, perisylvian regions in the IFG and STG/MTG gyri were consistently co-activated by both spoken and written words in adult readers of English, Spanish, Chinese and Hebrew [58]. This is also consistent with a previous finding, wherein both visual and auditory tasks have elicited increased MTG activation [61].
As anticipated, significant increased activation following MTG stimulation was
predominantly observed in temporooccipital regions, including the fusiform cortex
for written words in comparison to baseline (Post
Interestingly, the maximum activation peak for spoken words (in the Post
Taken together, our findings support that rTMS may be effective in modulating regions within functionally specialized networks but may also have an impact on a more global scale, possibly generating remote effects as a result of interactions across brain networks [66]. Evidence suggests that the majority of rTMS-induced changes tend to spread across brain networks [67], which implies that “focal” neuromodulation by rTMS may impact distal brain regions through intra-network connections, as well as interactions between networks. For instance, previous work has shown that an offline session of 5-Hz rTMS over the left dorsolateral prefrontal cortex (DLPFC) caused changes in BOLD responses in widespread cortical regions, including primary sensoriomotor cortex, lateral occipital cortex, insula and STG [22]. These cortical regions encompass several functional networks, which suggests that the stimulation of a densely connected node can affect multiple networks. A recent study applied iTBS over a domain-general node of cognitive control (the pre-supplementary motor area) to improve executive and semantic processing in healthy middle-age to older adults [68]. The results showed that iTBS induced increased functional activation during semantic processing at remote regions in posterior attention and visual networks. Particularly in reading research, previous rTMS-fMRI studies in healthy participants have demonstrated that after stimulating a core region within the reading network, nodes within the same hemisphere and contralateral homologous regions showed compensatory upregulation (i.e., increased activity) that might contribute to maintaining high task performance [15, 18]. This supports local and global network changes observed in other rTMS literatures that can be both inhibitory and faciliatory, regardless of the presumed directionality of the stimulation protocol [20]. This would also suggest the inhibition or recruitment of networks or other brain regions outside of the primary reading network to support language and reading behavior. Our current results in typically developed readers seem to reflect similar upregulation mechanisms during spoken and written word processing, which may not necessarily be related to improved behavioral performance. In the current study, we did not observe significant differences in the picture-word identification task (PID) task performance pre versus post stimulation. However, this was anticipated due to the simplicity of task demands and reproduceable high accuracy rate across subject pools (mean greater than 85%).
Understanding these neurobiological mechanisms supporting change is crucial to informing successful rTMS interventions for readers with treatment resistant language and reading impairments. Our findings on how the reading network dynamically responds to stimulation and impacts print and speech processing on the neural network level could help advance language research and inform our understanding of the complex interplay of network components in visual versus auditory language processing. It is also valuable for the incorporation of neuromodulation techniques such as rTMS in clinical practice for developmental dyslexia, post-stroke aphasia, acquired alexia and other communication disorders. Protocols similar to the one used here could also serve as a diagnostic tool to determine how disrupted networks functionally reorganize in these conditions.
This study has several limitations that should be taken into consideration. First, our small sample sizes limit the generalization of these findings and require further replication. Nevertheless, we consider these results promising as they can serve as a foundation upon which to develop specific rTMS-fMRI protocols and more specific predictions for examining the neural network effects of neurostimulation during print and speech processing.
Since we were particularly interested in exploring the overall neurophysiological effects following rTMS, a whole-brain analysis was performed. One could argue that a region of interest (ROI)-based approach focused on key brain regions within the reading network has more statistical power and would be crucial to map network-specific modulations. However, such results can often be biased by ROI choice [69]. While an ROI-based approach could be useful in future work, our exploratory analysis allowed us to confirm the recruitment of additional brain regions apart from the classic reading network (e.g., cingulate cortex, SFG, cerebellum, thalamus), which are known to be engaged in reading and language-related tasks, but whose contributions are not outlined in the dominant neural models of reading.
Although the present study lacked a sham (control) stimulation protocol, the current design provides for a functional control demonstrating the differential contribution of SMG and MTG to distinct aspects of reading and language processing. As such, we believe that the robust iTBS-induced effects, following stimulation of the left SMG, a key node of the dorsal stream, highlight its importance in spoken word processing.
Additionally, it would be beneficial to investigate whether the functional brain changes in the present study mediated behavioral reading changes. We suggest further studies recruiting participants with mixed reading skills (i.e., typical readers, poor readers and individuals with current diagnosis of reading disabilities), as well as including a pre/post-stimulation behavioral reading assessment in order to establish brain and behavioral reading relationships that occur after iTBS.
This study combines offline iTBS with fMRI to investigate the stimulation-induced effects of key dorsal and ventral nodes on functional activation during spoken and written word processing in typical readers. Our preliminary results show increased functional activation for spoken words following SMG stimulation, and for both spoken and written words after MTG stimulation in regions within the reading network and related cognitive and executive control regions. These iTBS-induced effects, observed around 20 minutes post-stimulation, highlight the selective contribution of SMG for auditory (spoken) word processing and provide additional supporting evidence for the dual-route theory of reading. If replicated, these findings could contribute to finding neural biomarkers and developing neuromodulatory interventions for individuals with reading and language impairments.
Raw imaging data is deposited to the Collaborative Informatics and Neuroimaging Suite (https://coins.trendscenter.org/) and will be publicly available as of the date of publication. All reported data will be shared by lead contact upon reasonable request.
CNA, RM and RH designed the research study. CNA and RH facilitated data collection. AHD and EB analyzed the data. AHD and EB wrote the first draft of the manuscript. All authors contributed to editorial changes in the manuscript. All authors read and approved the final manuscript. All authors have participated sufficiently in the work and agreed to be accountable for all aspects of the work.
The research protocol was approved by the joint Georgia State University/Georgia Tech Center for Advanced Brain Imaging Institutional Review Board (Protocol numbers: H16199 and H18271). The study was carried out in accordance with the guidelines of the Declaration of Helsinki and all participants provided written informed consent.
The authors would like to acknowledge Mykayla Jeter, Ryan Slaby, Eileen Persechetti, and Humza Baig for help with data collection. We would also like to acknowledge Dr. Colleen Hanlon for helping with study design.
This study was supported by the Oak Foundation OCAY-16-526 and OFIL-22-102 (PI: RM), the National Center for Neuromodulation for Rehabilitation NC NM4R P2CHD086844 MUSC18-114-8B465 (PI: CNA) and the Eunice Kennedy Shriver National Institute of Child Health and Human Development R21 HD108576-01 (PI: CNA).
The authors declare no conflict of interest.
References
Publisher’s Note: IMR Press stays neutral with regard to jurisdictional claims in published maps and institutional affiliations.