


1 Department of Hearing and Speech Rehabilitation, Binzhou Medical University, 264000 Yantai, Shandong, China
Abstract
This study investigated the characteristics of auditory event-related potentials (AERP) evoked by vowel and consonant contrasts in prelingual deafness adults, who fitted with bilateral hearing aids (HA) in quiet and noisy environments.
Standard stimuli /ba/ (75%) and deviant stimuli (/ga/ and /bu/, 12.5% each) were presented using a passive oddball paradigm in quiet and noisy (+10 decibel [dB] signal-to-noise ratio [SNR]) conditions. Eighteen young adults aged 18–23 years with long-term bilateral HA, and 20 age-matched normal hearing (NH) individuals participated in the study.
The hearing loss (HL) group showed lower N1-P2 and mismatch negativity (MMN) amplitudes and longer N1 and MMN latencies than the NH group. Both groups showed reduced N1-P2 amplitudes and longer MMN latencies in noise. The consonant contrast (/ga/-/ba/) induced lower and delayed MMN than the vowel contrast (/bu/-/ba/).
Young adult bilateral HA users with prelingual severe to profound HL have poorer abilities in processing consonant-vowel syllables than people with NH, especially in noisy conditions and consonant contrast differences. Long-term auditory compensation provided by bilateral HA for people with prelingual severe and profound HL does not seem to enable adequate development of the auditory cortex.
Keywords
- hearing loss
- noise
- event related potential
- hearing aids
- mismatch negativity
Target auditory information is often obscured in the background noise, requiring more auditory effort to be identified accurately. Speech recognition in background noise was even more challenging for people with hearing loss (HL) [1]. Deficits in encoding the changes in the frequency of sounds might contribute to the poor speech recognition and comprehension of people with HL [2]. In contrast to pure tones and clicks, the speech spectrum is complex and variable. The variation in the fundamental frequency (F0) of speech in tone languages such as Mandarin, Cantonese, and Thai distinguishes the meaning of speech [3]. Therefore, the lack of ability to perceive and discriminate frequency changes in sound signals was also a significant factor affecting speech recognition in patients with sensorineural deafness.
In addition to subjective tests such as speech recognition, auditory event-related potential (AERP) is a valuable objective assessment for characterizing auditory cortex processing of sound stimuli. The N1-P2 complex originates in the primary auditory cortex and temporal lobe auditory-related areas, which is an exogenous component of AERP. N1 is the first negative peak of the long latency AERP, occurring 50–200 ms after stimuli. P2 is a positive peak immediately following N1 with a latency of 150–250 ms. The prominent waveform of the N1-P2 complex makes it easier to be identified even in complex listening environments, such as in background noise [4]. The mismatch negativity (MMN), originating in the auditory cortex and its neighboring areas and frontal lobes, evoked during the passive auditory oddball paradigm is a differential component of standard and deviant stimuli. The MMN, which is not governed by attention, reflects the automatic detection of information differences in the auditory cortex during the early stages of auditory processing [5]. The morphology, amplitude, and latency of AERP reflect the neural response of the acoustic characteristics of the signal, which can be used as an index to evaluate auditory sensitivity [6]. In recent years, audiologists have extensively studied AERP evoked by speech. A study noted that speech stimuli (words “heed” and “who’d”) tend to have delayed N1 and P2 latencies due to their complexity when compared to other types of sound stimuli (tone burst at 1500 Hz and 3000 Hz) [7]. Another study has reported that consonants with rapid spectrotemporal changes were more difficult to be identified in noisy environments than vowels since vowels were inherently louder than consonants according to the sonority sequencing principle [8]. Therefore, speech stimuli would contribute to providing additional information about complex signal processing.
Changes in AERP could also reflect the effects of auditory compensation and treatment in people with HL. Hearing aids (HA) and cochlear implantation (CI) are the two mainstream approaches to hearing compensation and treatment for sensorineural HL. HA is the preference for mild or moderate HL patients [9], and CI is usually suitable for those with severe and profound sensorineural HL or for those unable to improve their listening performance through HA [10]. Korczak et al. [11] (2005) used /ba/ and /da/ as stimuli and found that the majority of HL participants showed increased amplitudes, shorter latencies, and better waveform morphology when using HA compared to not using HA, although the users still demonstrated longer N1 and MMN latencies than hearing controls. Early use of HA effectively improved the perception of vowels, consonants, and lexical tones in Mandarin-speaking children with severe HL [12], which might serve as strong evidence of brain plasticity. Moreover, one previous study found that the MMN of post-linguistic CI users was reduced in the noisy condition (white noise and two-talker babble noise at 10 decibel [dB] signal-to-noise ratio [SNR]) when compared to the quiet condition, and the behavioral tests showed that their vocabulary perceptual ability was much lower in the two-talker babble condition than in the white noise condition [13].
One study has been conducted to compare the effects of auditory compensation between the two modalities. For example, it was found that compared to HA, CI can significantly improve auditory and speech outcomes in children with HL, further improving their productivity and quality of life [14]. It was also reported, however, that after three years of rehabilitation and growth, the mean AERP of children with CI were significantly lower than those with HA and normal hearing (NH), implying that the central auditory system of children with CI develops more slowly [15].
Bilateral implantation of CI is commonly suggested for severe or profound sensorineural HL in both ears to achieve better hearing compensation. However, patients possibly prefer a compromised pattern of compensation, such as bimodal (HA in one ear and CI in the other), or simply bilateral HA, for concerns about financial cost, hearing preference, or surgical risk [16]. A study has shown that bimodal improves speech perception in noise compared to unilaterally compensated children, even when the compensation patterns are not consistent in both ears [17]. It is noteworthy that bilateral HA users also constitute a proportion of patients with HL. It is necessary to re-examine how the noisy environments impact speech perception and discrimination in these young HL people who have been wearing bilateral HA for many years.
In this study, we aimed to explore the central auditory development in adults with prelingual severe to profound HL who have been wearing bilateral HA for a long time, and whether they showed unique processing skills when encoding speech in noisy environments, which might provide valuable references for guiding children with prelingual deafness. By analyzing the characteristics of AERP components of adults with HL under quiet and noisy conditions, we can understand their auditory processing patterns, which could help us to have a better understanding of the impact of long-term use of bilateral HA on the auditory function of adults. Therefore, our findings on the relationship between AERP, different environments, and speech stimulus types in adults could assist parents, audiologists, and other professionals in making more informed decisions when choosing hearing compensation methods for children with HL. We hypothesized that bilateral HA would not provide adequate cortical development for adults with HL, showing inadequate central processing of speech sounds and speech differences, especially in the presence of noise disturbances. Consonant differences might induce a lower and more delayed MMN component than that of the vowel difference. We explored the following aspects: (1) To observe whether there are differences in AERP composition between long-term HA users and NH groups; (2) To investigate the effects of environment and speech stimulus signal types on the components of N1, P2, and MMN.
Eighteen adults with HL (9 males; 20.08
| Subject | Gender | Age at test (years) | Left ear (dB HL) | Right ear (dB HL) | ||||||||||||
| 0.25 kHz | 0.5 kHz | 1 kHz | 2 kHz | 4 kHz | Average | 8 kHz | 0.25 kHz | 0.5 kHz | 1 kHz | 2 kHz | 4 kHz | Average | 8 kHz | |||
| 01 | F | 18.94 | –10 | –5 | 0 | –5 | 5 | –1.25 | –5 | –5 | 0 | 0 | –5 | 0 | –1.25 | –5 |
| 02 | M | 20.06 | 0 | 5 | 10 | 0 | 0 | 3.75 | 5 | 5 | 5 | 5 | 0 | 5 | 3.75 | 5 |
| 03 | M | 18.80 | –5 | 0 | 0 | 0 | 10 | 2.50 | 5 | 0 | 5 | 5 | 5 | 0 | 3.75 | 0 |
| 04 | M | 19.21 | 0 | 5 | 0 | –10 | 0 | –1.25 | –15 | 5 | 10 | 15 | 0 | 0 | 6.25 | –5 |
| 05 | F | 19.71 | –5 | 0 | 5 | –5 | –5 | –1.25 | –10 | –5 | 5 | 5 | 5 | 0 | 3.75 | –5 |
| 06 | M | 19.46 | 10 | 10 | 5 | 5 | 0 | 5.00 | –5 | 15 | 15 | 10 | 5 | 0 | 7.50 | 0 |
| 07 | M | 20.13 | 10 | 10 | 5 | –5 | 5 | 3.75 | 5 | 10 | 10 | 5 | –5 | 5 | 3.75 | 15 |
| 08 | M | 19.26 | –5 | –5 | –5 | –5 | 5 | –2.50 | –15 | –5 | 5 | 0 | –5 | –5 | –1.25 | 5 |
| 09 | F | 20.24 | 0 | –5 | 5 | 0 | –5 | –1.25 | –10 | –5 | 0 | 5 | 5 | 0 | 2.50 | –5 |
| 10 | F | 19.94 | 0 | 0 | 10 | 5 | 5 | 5.00 | 0 | –5 | 5 | 5 | 5 | –5 | 2.50 | –15 |
| 11 | F | 19.95 | 0 | 10 | 10 | 5 | 5 | 7.50 | 0 | 0 | 10 | 10 | 5 | 0 | 6.25 | 5 |
| 12 | M | 18.95 | 0 | 0 | –5 | 0 | 5 | 0.00 | –5 | 5 | 5 | 0 | 0 | 0 | 1.25 | 5 |
| 13 | M | 19.79 | 5 | 5 | 10 | 5 | 5 | 6.25 | –10 | 5 | 10 | 0 | –10 | –5 | –1.25 | –15 |
| 14 | F | 19.63 | 5 | 10 | 0 | 5 | 5 | 5.00 | –5 | 0 | 10 | 5 | 5 | 5 | 6.25 | –5 |
| 15 | M | 19.98 | 0 | 5 | 0 | –5 | 5 | 1.25 | 5 | –5 | 5 | –10 | –10 | 5 | –2.50 | –5 |
| 16 | F | 21.89 | 5 | 5 | 0 | 0 | 0 | 1.25 | 0 | –5 | –5 | 0 | 5 | –10 | –2.50 | –5 |
| 17 | F | 18.94 | –5 | 0 | 5 | –5 | 0 | 0.00 | 0 | 0 | 5 | 5 | 0 | 5 | 3.75 | –5 |
| 18 | F | 22.89 | 5 | 5 | 0 | 0 | 0 | 1.25 | –5 | –5 | 0 | 0 | 0 | 5 | 1.25 | 0 |
| 19 | M | 20.21 | 5 | 10 | 10 | 5 | –10 | 3.75 | –5 | 5 | 5 | 0 | 5 | –5 | 1.25 | –5 |
| 20 | F | 20.08 | 0 | 5 | 15 | 15 | 5 | 10.00 | 0 | 5 | 5 | 10 | 5 | 5 | 6.25 | 0 |
| M | 19.90 | 0.75 | 3.50 | 4.00 | 0.25 | 2.00 | 2.44 | –3.50 | 0.75 | 5.25 | 3.50 | 0.50 | 0.25 | 2.38 | –2.00 | |
| (SD) | (0.94) | (4.95) | (4.90) | (5.26) | (5.45) | (4.47) | (3.22) | (6.00) | (5.62) | (4.49) | (5.14) | (4.86) | (4.22) | (3.01) | (6.62) | |
Note: F, female; M, male; M (SD), mean (standard deviation); dB, decibel; HL, hearing level.
| Subject | Sex | Age (years) | Age of onset (years) | Age of intervention (years) | Etiology | Type of acoustic device | Unaided PTA (dB HL) | Aided PTA (dB HL) | WRS (aided) | |||
| Left | Right | Left | Right | Left | Right | |||||||
| 01 | F | 19.88 | Birth | 2 | Drugs | Simens ICI | Simens ICI | 95.00 | 96.25 | 57.50 | 48.75 | 60% |
| 02 | M | 20.53 | 2 | 2 | Drugs | Resound LT561 DRW | Resound LT561 DRW | 83.75 | 100.00 | 42.50 | 57.50 | 92% |
| 03 | F | 21.16 | 2 | 3 | Unknown | Simens ICI | Simens ICI | 83.75 | 81.25 | 48.75 | 33.75 | 40% |
| 04 | M | 21.42 | 3 | 4 | Unknown | Phonak P30 | Phonak P30 | 108.33 | 106.25 | 62.50 | 62.50 | 16% |
| 05 | M | 22.23 | 2 | 6 | Unknown | Phonak Audeo P70 | Phonak Audeo P70 | 82.50 | 95.00 | 38.75 | 65.00 | 80% |
| 06 | M | 20.80 | 2 | 2 | Unknown | Naida P70 UP | Naida P70 UP | 86.25 | 92.50 | 36.25 | 36.25 | 32% |
| 07 | F | 20.33 | 2 | 4 | Drugs | Beranfon Zerena9 | Starkey MU24iQ | 82.50 | 95.00 | 38.75 | 65.00 | 50% |
| 08 | F | 21.35 | Birth | 5 | Unknown | Oticon Xceed Play | Oticon Xceed Play | 102.50 | 102.50 | 51.25 | 46.25 | 60% |
| 09 | F | 21.75 | 2 | 2 | Drugs | Resound dw788 | Starkey MU24iQ | 65.00 | 88.75 | 27.50 | 46.25 | 76% |
| 10 | M | 19.95 | 2 | 2 | Drugs | Virto M Black | Virto M Black | 71.25 | 81.25 | 51.25 | 70.00 | 76% |
| 11 | F | 19.39 | Birth | Birth | Unknown | Starkey CE QT11 | Starkey CE QT11 | 105.00 | 95.00 | 80.00 | 55.00 | 43% |
| 12 | F | 18.52 | 3 | 4 | Drugs | Phonak AL730 | Phonak AL730 | 76.25 | 67.50 | 56.25 | 53.75 | 20% |
| 13 | F | 18.29 | Birth | 4 | Unknown | Virto P70-312 | Virto P70-312 | 88.75 | 90.00 | 57.50 | 58.75 | 76% |
| 14 | M | 18.05 | 2 | 2 | Unknown | AcoSound AR1 | Starkey CIC ET2 | 86.25 | 65.00 | 47.50 | 37.50 | 77% |
| 15 | F | 19.36 | 2 | 3 | Drugs | Beltone TST9 CIC HP | Beltone TST9 CIC HP | 88.75 | 77.50 | 50.00 | 42.50 | 73% |
| 16 | M | 20.44 | Birth | 1 | Unknown | Rexton Sterling 40 8C | Simens ORION P | 85.00 | 92.50 | 42.50 | 48.75 | 69% |
| 17 | M | 19.42 | 3 | 4 | Drugs | Simens Nitro | Simens Nitro | 113.75 | 100.00 | 62.50 | 47.50 | 54% |
| 18 | M | 18.50 | Birth | 1 | Unknown | Oticon OPN3 | Oticon OPN3 | 115.00 | 106.67 | 65.00 | 38.75 | 65% |
| M | 20.08 | 1.50 | 2.83 | 89.98 | 90.72 | 50.90 | 50.76 | 58.83% | ||||
| (SD) | (1.18) | (1.09) | (1.46) | (13.27) | (11.37) | (11.80) | (10.25) | (20.36%) | ||||
PTA, pure tone threshold audiometry; WRS, word recognition score.
| Subject | Left ear (dB HL) | Right ear (dB HL) | ||||||||||||
| 0.25 kHz | 0.5 kHz | 1 kHz | 2 kHz | 4 kHz | Average | 8 kHz | 0.25 kHz | 0.5 kHz | 1 kHz | 2 kHz | 4 kHz | Average | 8 kHz | |
| 01 | 65 | 80 | 95 | 100 | 105 | 95.00 | 100 | 60 | 75 | 90 | 110 | 110 | 96.25 | 100 |
| 02 | 65 | 50 | 85 | 95 | 105 | 83.75 | 100 | 70 | 85 | 115 | 95 | 105 | 100.00 | 100 |
| 03 | 75 | 85 | 80 | 95 | 75 | 83.75 | 85 | 40 | 65 | 85 | 90 | 85 | 81.25 | 70 |
| 04 | 90 | 95 | 110 | 120 | 108.33 | 75 | 90 | 110 | 105 | 120 | 106.25 | |||
| 05 | 70 | 70 | 80 | 90 | 90 | 82.50 | 100 | 80 | 80 | 95 | 100 | 105 | 95.00 | 100 |
| 06 | 70 | 80 | 85 | 85 | 95 | 86.25 | 70 | 80 | 85 | 105 | 100 | 92.50 | ||
| 07 | 70 | 70 | 80 | 90 | 90 | 82.50 | 100 | 80 | 80 | 95 | 100 | 105 | 95.00 | 100 |
| 08 | 80 | 80 | 100 | 115 | 115 | 102.50 | 85 | 85 | 100 | 115 | 110 | 102.50 | ||
| 09 | 70 | 65 | 70 | 60 | 65 | 65.00 | 75 | 95 | 95 | 90 | 85 | 85 | 88.75 | 70 |
| 10 | 60 | 65 | 70 | 70 | 80 | 71.25 | 75 | 70 | 75 | 85 | 95 | 81.25 | ||
| 11 | 75 | 90 | 100 | 115 | 115 | 105.00 | 70 | 85 | 100 | 95 | 100 | 95.00 | 95 | |
| 12 | 65 | 75 | 80 | 85 | 65 | 76.25 | 65 | 55 | 70 | 70 | 65 | 65 | 67.50 | 55 |
| 13 | 40 | 60 | 90 | 90 | 115 | 88.75 | 100 | 65 | 70 | 85 | 100 | 105 | 90.00 | |
| 14 | 80 | 80 | 90 | 85 | 90 | 86.25 | 80 | 50 | 55 | 60 | 75 | 70 | 61.25 | 75 |
| 15 | 65 | 65 | 90 | 100 | 100 | 88.75 | 75 | 80 | 80 | 85 | 80 | 65 | 77.50 | 60 |
| 16 | 65 | 65 | 80 | 100 | 95 | 85.00 | 75 | 80 | 90 | 100 | 100 | 92.50 | ||
| 17 | 95 | 110 | 110 | 120 | 115 | 113.75 | 80 | 95 | 100 | 105 | 100.00 | |||
| 18 | 110 | 115 | 115 | 115.00 | 65 | 100 | 105 | 115 | 106.67 | |||||
| M | 72.78 | 77.78 | 89.44 | 95.00 | 94.69 | 89.98 | 88.00 | 70.56 | 80.00 | 90.28 | 95.56 | 95.31 | 90.51 | 82.50 |
| (SD) | (14.26) | (15.91) | (12.55) | (15.55) | (15.95) | (13.27) | (12.28) | (12.55) | (10.76) | (14.37) | (13.37) | (15.67) | (11.84) | (16.55) |
All participants were tested for word recognition score (WRS) using the Mandarin speech test materials (MSTMs) [18]. The WRS was performed in monosyllables with a fixed sound intensity of 75 dB hearing level.
As shown in Fig. 1A, MMN was evoked by a double oddball paradigm in a pseudo-random sequence consisting of 600 standard stimuli /ba/ as well as 100 deviant stimuli /ga/ and /bu/ each. The duration of each stimulus was 300 ms, the interstimulus interval (ISI) was 1000 ms, the sampling rate was 44.1 kHz, and the bit depth was 24. The fundamental frequency (F0) and the first and the second formant (F1 and F2) of each stimulus are shown in Table 4, and the waveforms and speech spectrograms are shown in Fig. 1B.
| /ba/ | /ga/ | /bu/ | |
|---|---|---|---|
| Fundamental frequency (F0) | 164 Hz | 164 Hz | 136 Hz |
| First formant (F1) | 1084 Hz | 1143 Hz | 513 Hz |
| Second formant (F2) | 3998 Hz | 4127 Hz | 3541 Hz |
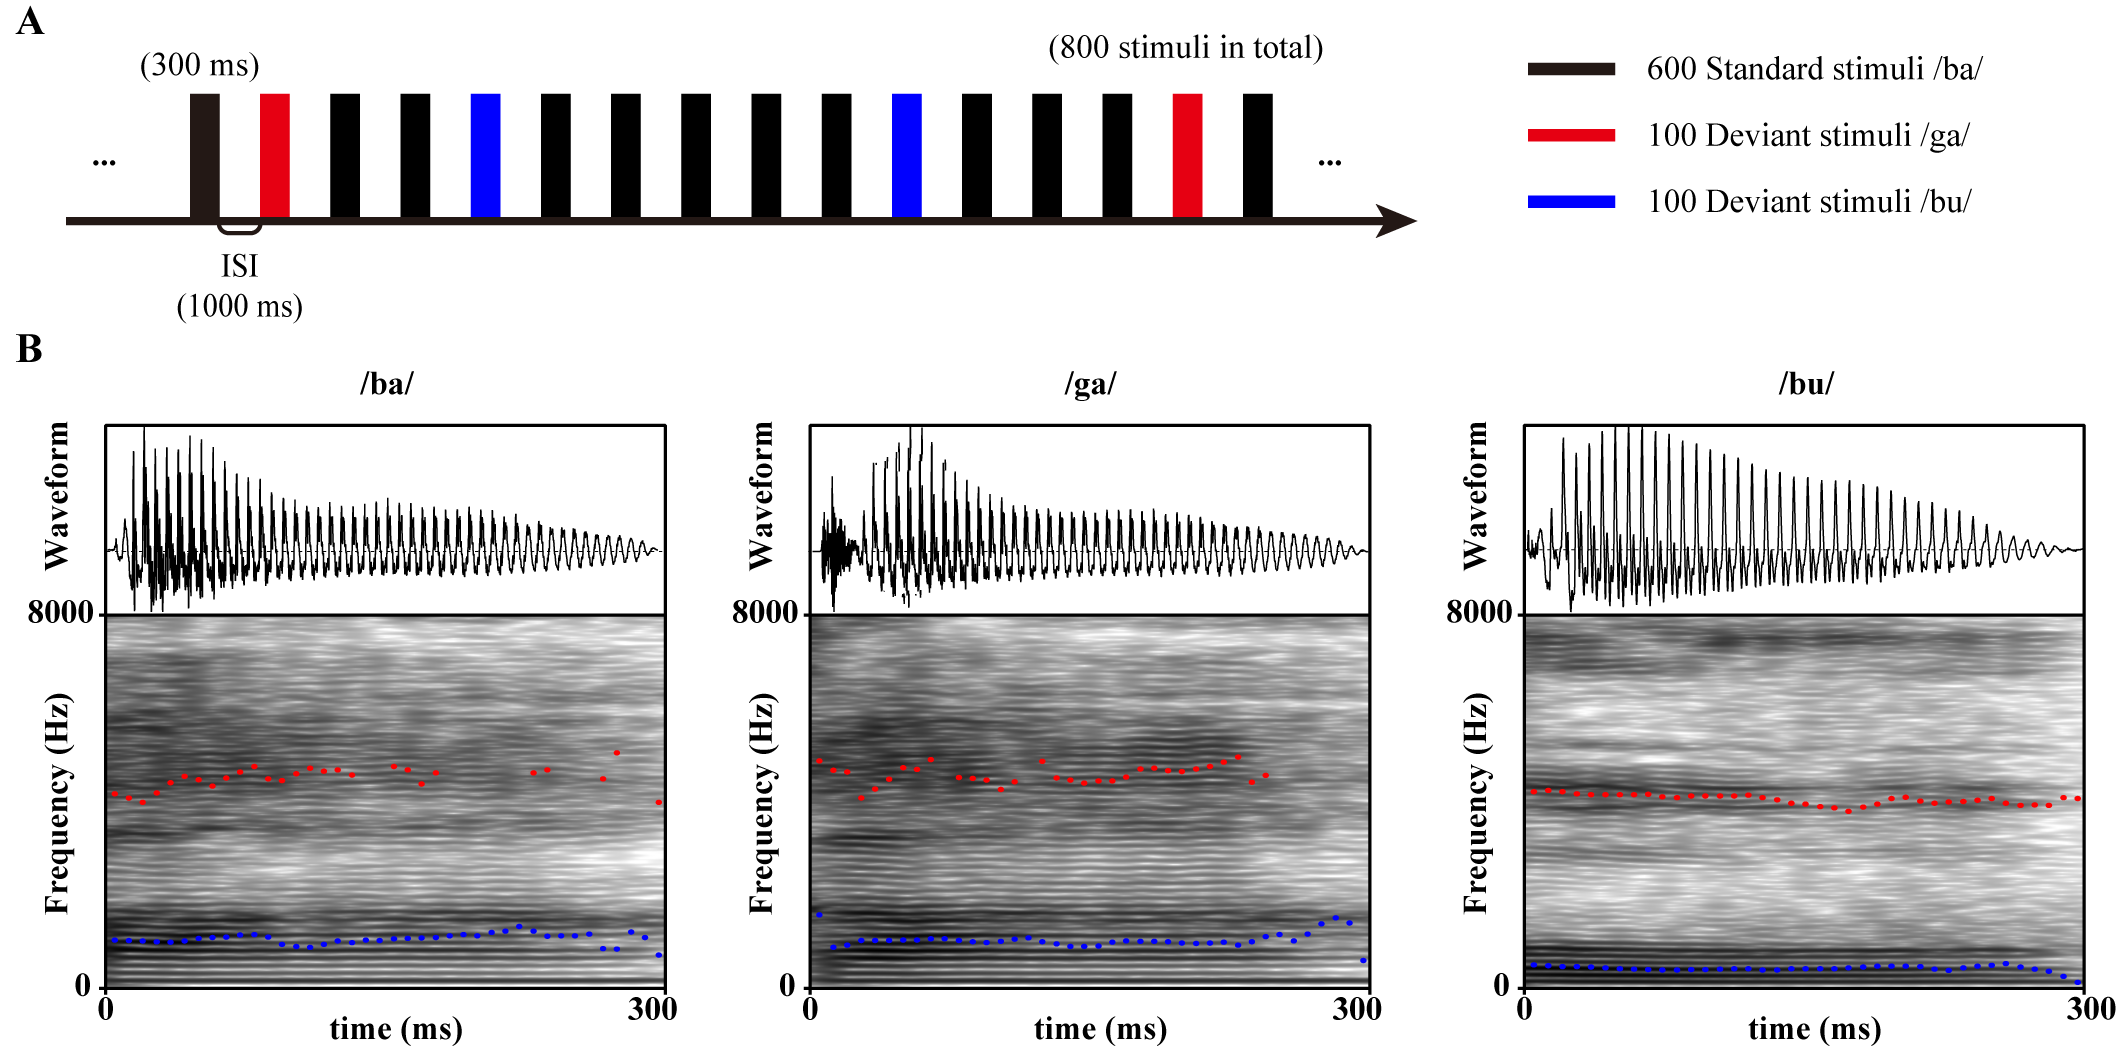 Fig. 1.
Oddball paradigm stimulus patterns and speech materials. (A) Number, duration, and trial interval of standard and deviant stimuli in the oddball paradigm. (B) Acoustic waveforms and speech spectrograms of stimuli /ba/, /ga/, and /bu/. The blue dashed line is the first resonance peak (F1), and the red dashed line is the second resonance peak (F2). ISI, interstimulus interval.
In addition to the quiet condition, a babble noise condition of +10 dB SNR was created using Adobe Audition 2019 (Adobe Systems, San Jose, CA, USA). The order of presentation of quiet and noisy blocks was counterbalanced between subjects to counteract the adaptation effect. Stimuli were presented at 30 dB HL above the averaged aided pure tone threshold of the better ear through a loudspeaker (Yamaha NS-AW194, Hamamatsu, Shizuoka, Japan) placed at 0 degrees azimuth 1 meter from the participant at ear height in both groups.
The participants sat in a shielded soundproof room and watched a silent movie. They were asked to ignore the stimuli from the loudspeaker (Yamaha NS-AW194, Hamamatsu, Shizuoka, Japan). Electroencephalogram (EEG) was acquired online using 32 Ag/AgCl electrodes (eego mylab; ANT Neuro, Enschede, Netherlands) following the international 10–20 system. The CPz electrode was used as an online reference. The sampling rate was 500 Hz.
EEG data were processed offline using EEGLAB 13.6.5b running under Matlab
(R2013b; Mathworks, Natick, MA, USA). The raw data were bandpass filtered to 0.5–30
Hz, a range commonly used in long latency AERP study [19]. Epochs between –100
and 800 ms were grand averaged. The 100 ms pre-stimulus was used as the baseline.
Independent component analysis (ICA) was performed to correct eye movement.
Epochs with amplitudes greater than
Previous studies showed that the Cz electrode located on the top of the head has the largest N1-P2 response [20] and that Fz located in the middle of the forehead has the largest MMN response [21, 22]. Therefore, N1-P2 of Cz and MMN of Fz were averaged to be analyzed. Peak amplitudes and peak latencies were extracted over time windows of 100–250 ms (N1), 150–370 ms (P2), 200–500 ms (MMN/ga/-/ba/), and 100–300 ms (MMN/bu/-/ba/), respectively. The waveforms of each individual were examined manually by three colleagues with experience in event-related potential (ERP) processing.
A three-factor ANOVA was performed. Group (NH and HL) was a between-participants
variable, environment (quiet and +10 dB SNR) and syllables (/ba/, /ga/, and /bu/
for N1 and P2, and /ga/-/ba/ and /bu/-/ba/ for MMN) were inter-subject variables.
The dependent variables were the peak latencies of N1, P2, and MMN, as well as
the peak-to-peak amplitude of N1-P2 and the mean amplitude of MMN. In the case of
violation of the sphericity assumption, a Greenhouse-Geisser correction was
applied. Holm-Bonferroni correction was applied to correct for multiple
comparisons. The effect size was calculated using the partial eta square.
p-values
Figs. 2,3,4 demonstrate the grand averaged waveform of N1-P2 and MMN. Detailed quantitative results (mean and standard deviation) for the amplitude and latency of each component are presented in Table 5.
 Fig. 2.
The grand average waveforms evoked by consonant-vowel syllables /ba/ (A), /ga/ (B), and /bu/ (C) for the hearing (blue, n = 20) and the participants with HL (red, n = 18). The solid line indicates the quiet condition, and the dashed line indicates the +10SNR noisy condition. NH, normal hearing; SNR, signal-to-noise ratio.
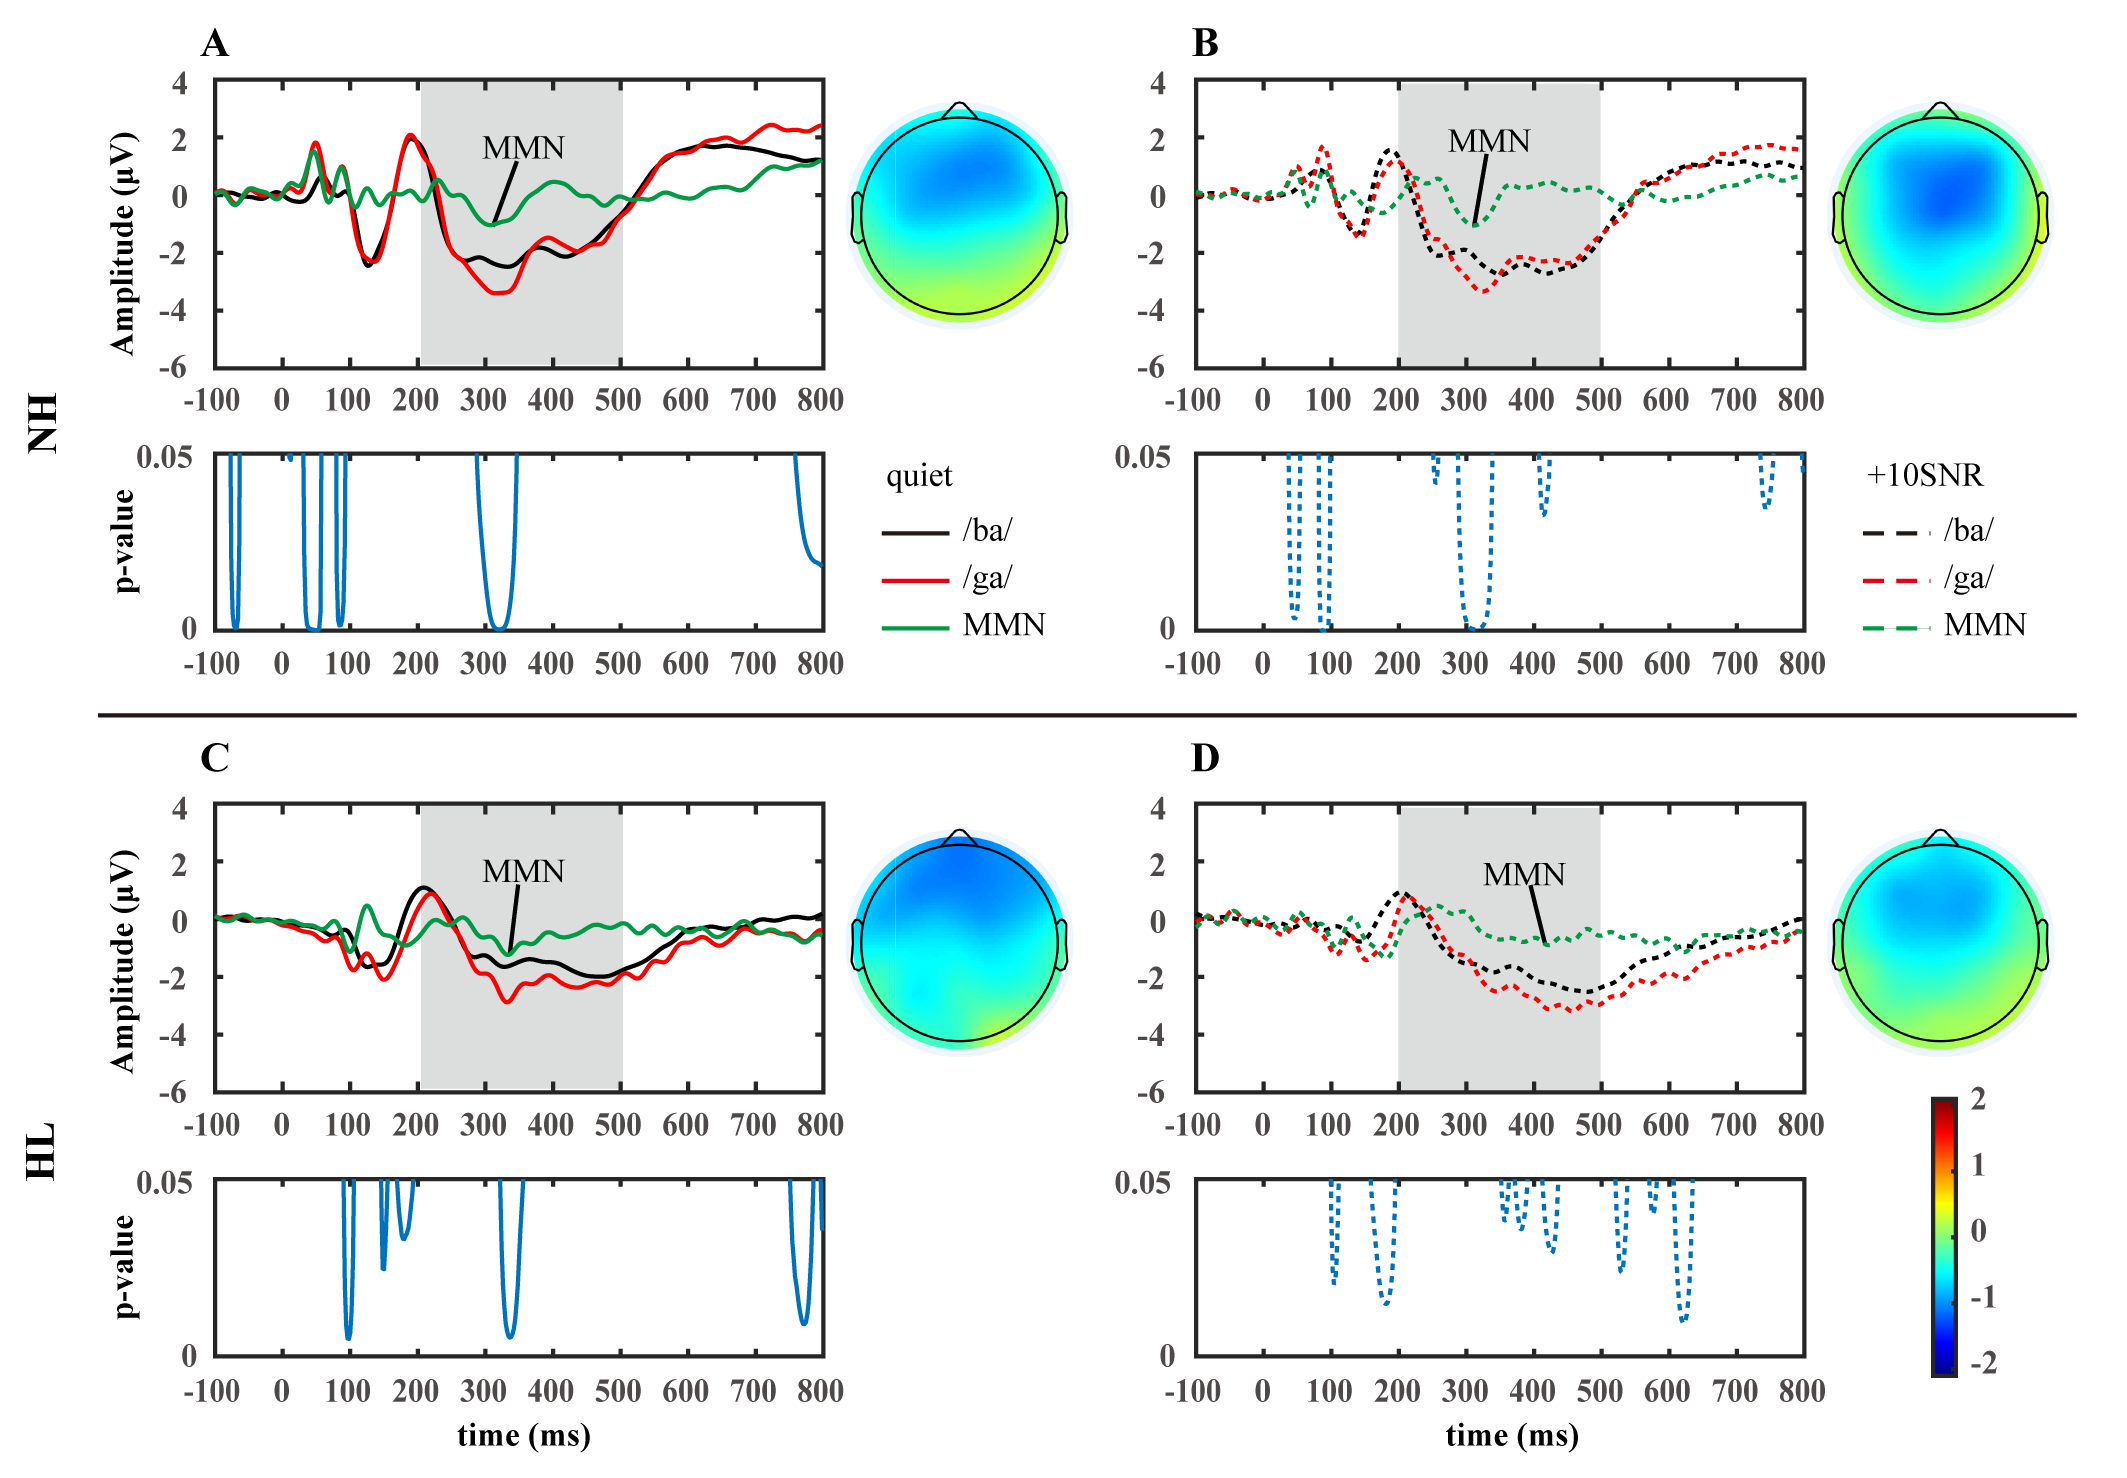 Fig. 3.
The grand average waveforms and topographic maps for standard (/ba/), deviant (/ga/), and difference (/ga/-/ba/) at the Fz site for participants with normal hearing (NH, n = 20, (A,B)) and participants with hearing loss (HL, n = 18, (C,D)). The topographic maps were generated based on the average topographies within a 20 ms interval around the peak of the grand-averaged waveform of MMN. The significance level (p-value) of the difference between /ba/ and /ga/ waveforms are shown below. Solid lines: quiet environment; dashed lines: +10SNR noisy environment. MMN, mismatch negativity.
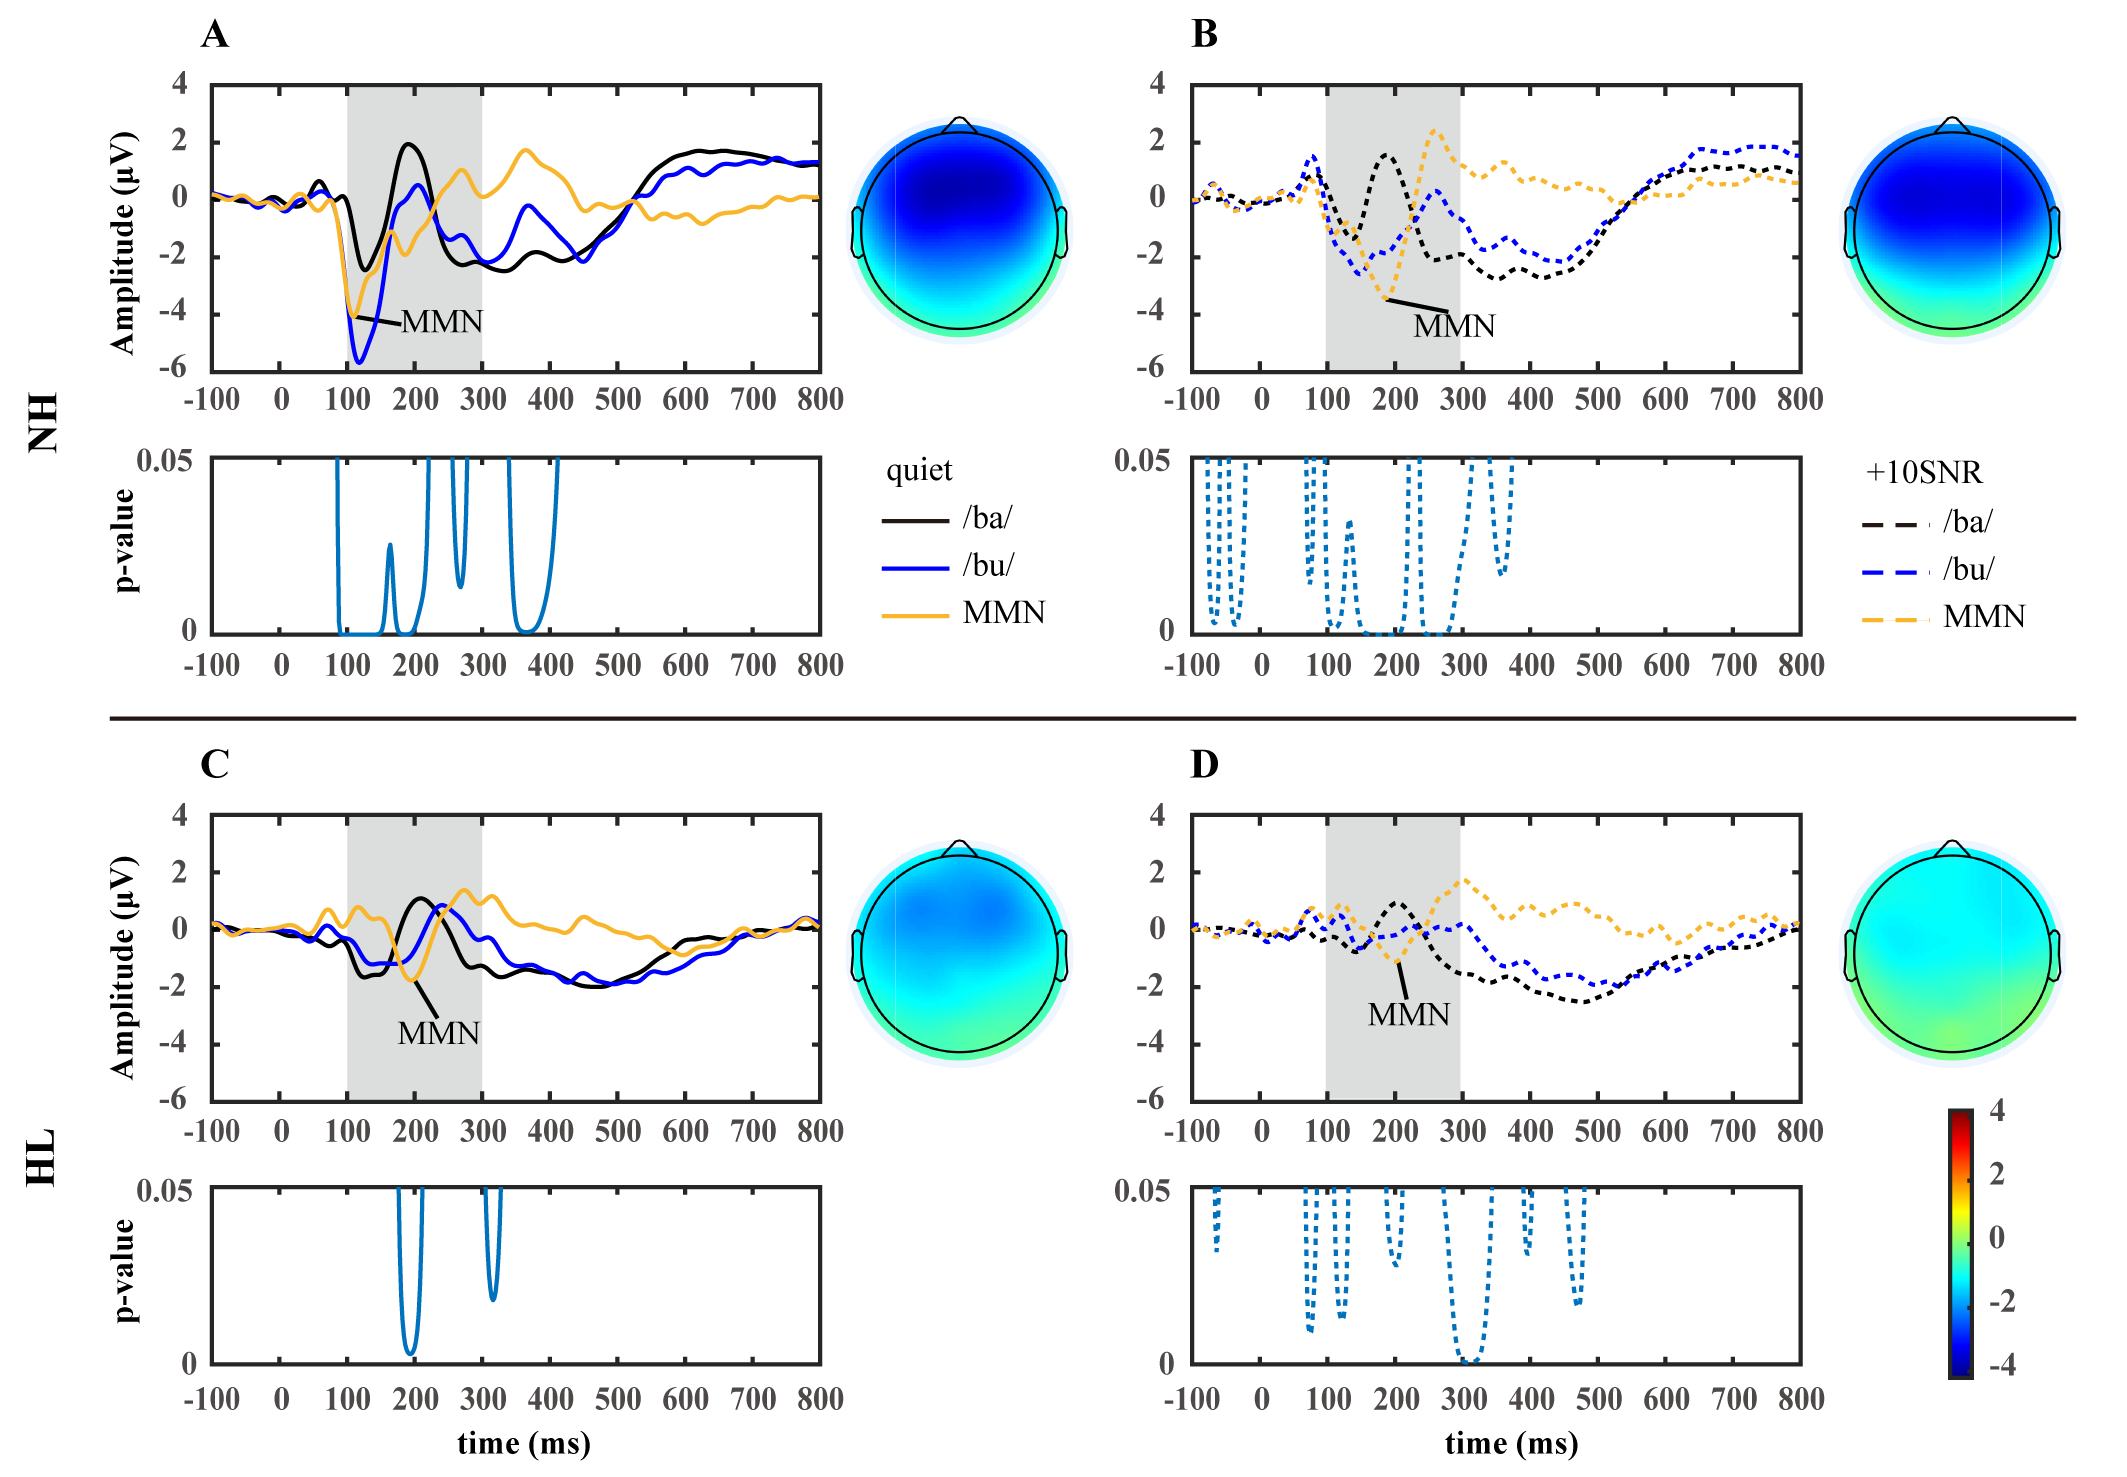 Fig. 4.
The grand average waveforms and topographic maps for standard (/ba/), deviant (/bu/), and difference (/bu/-/ba/) at the Fz site for participants with normal hearing (NH, n = 20, (A,B)) and participants with hearing loss (HL, n = 18, (C,D)). The topographic maps were generated based on the average topographies within a 20 ms interval around the peak of the grand-averaged waveform of MMN. The significance level (p-value) of the difference between /ba/ and /bu/ waveforms are shown below. Solid lines: quiet environment; dashed lines: +10SNR noisy environment.
| NH (n = 20) | HL (n = 18) | |||||||||||
| quiet | noisy | quiet | noisy | |||||||||
| /ba/ | /ga/ | /bu/ | /ba/ | /ga/ | /bu/ | /ba/ | /ga/ | /bu/ | /ba/ | /ga/ | /bu/ | |
| N1 latency (ms) | 127.90 (8.45) | 131.30 (11.17) | 123.70 (9.72) | 128.70 (12.25) | 134.40 (18.70) | 134.90 (22.24) | 134.11 (16.30) | 142.78 (31.37) | 143.00 (26.80) | 138.78 (31.95) | 154.22 (43.23) | 151.00 (33.76) |
| P2 latency (ms) | 197.10 (9.19) | 200.00 (13.96) | 203.50 (21.18) | 192.40 (20.15) | 203.50 (24.95) | 231.70 (36.90) | 207.11 (16.34) | 218.00 (18.59) | 218.67 (38.15) | 200.33 (22.18) | 214.22 (24.49) | 218.56 (45.29) |
| N1-P2 peak-to-peak amplitude (µV) | 6.16 (1.92) | 6.72 (2.48) | 8.16 (2.48) | 4.25 (1.61) | 4.64 (2.18) | 4.49 (2.05) | 4.96 (1.94) | 5.51 (2.35) | 5.15 (1.85) | 3.53 (1.33) | 4.39 (2.24) | 3.88 (1.76) |
| MMN latency (ms) | — | 332.50 (90.85) | 122.90 (24.13) | — | 331.10 (71.03) | 179.00 (32.69) | — | 324.78 (82.60) | 190.44 (44.74) | — | 363.33 (83.88) | 202.44 (41.35) |
| MMN amplitude (µV) | — | –1.96 (1.31) | –4.59 (2.02) | — | –1.94 (0.97) | –4.03 (2.01) | — | –2.29 (1.57) | –2.68 (1.62) | — | –2.37 (1.48) | –2.08 (1.56) |
—, not applicable.
As shown in Fig. 2, the main effect of the group [F(1, 28) = 10.171, p
= 0.003,
Syllables [F(1.474, 53.079) = 9.917, p
Although there was no significant main effect of the group [F(1, 36) = 2.252,
p = 0.142,
Additionally, a significant effect of the interaction effect of the environment
by syllable on P2 latency was found [F(1.558, 56.087) = 5.732, p =
0.009,
As shown in Fig. 2, the main effect of the
group [F(1, 36) = 5.336, p = 0.027,
In addition, a significant interaction between environment and group on N1-P2
amplitude was found [F(1, 36) = 9.057, p = 0.005,
As shown in Figs. 3,4, the main effect of the group [F(1, 36) = 7.479,
p = 0.010,
In addition, a three-way interaction effect of the group by syllables by the
environment on MMN latency was found [F(1, 36) = 6.097, p = 0.018,
As shown in Figs. 3,4 the main effect of the group [F(1, 36) = 7.030,
p = 0.012,
No significant main effect of environment [F(1, 36) = 1.817, p = 0.186,
We used consonant-vowel (CV) syllables (Fig. 1) overlaid with babble noise to investigate the characteristics of N1-P2 (Fig. 2) and MMN (Figs. 3,4) in young adults with bilateral HA and NH. In addition, we explored the relationship between the components (N1, P2, and MMN) of AERP and WRS in bilateral HA users. We intended to explore speech perception and discrimination in long-term bilateral HA users with prelingual severe to profound HL by discussing the effects of HL, syllables, and background noise on speech-evoked AERP.
Identifiable N1-P2 indicated that speech stimuli were processed in the auditory cortex. Prolonged latencies of AERP often represent complex information processing, damage to nerves, or developmental immaturity. Beynon et al. [23] (2002) used /i/-/a/ as stimuli and found that the N1 latency was longer in CI users than in NH controls. Similar to the result of Beynon et al. [23] (2002), we also found longer N1 latencies in long-term bilateral HA users than in the NH group. As for the amplitude, lower N1-P2 amplitudes in adults were often associated with auditory deprivation and decreased cortical perception. As shown in the study of Groenen et al. [24] (2001), speech (/bu/-/da/, /ba/-/pa/, and /i/-/a/) evoked smaller N1-P2 amplitudes in CI users compared to the hearing controls. Our study obtained similar results that the N1-P2 amplitude in bilateral HA users was significantly lower than the NH group. For the results above, we suspected an association with the fact that people with HL, regardless of the auditory compensation modalities, had fewer specialized functional synapses and lower functional inter-cortical coupling to encode auditory information owing to the lack of adequate auditory inputs during brain development [25]. As shown in Table 2, all of the 18 participants in the HL group in our study had prelingual HL. The immaturity of cortical development caused inefficient early auditory encoding of speech and the missing encoding of speech feature details in the HL group [26].
Consistent with expectations, the two groups showed inconsistent AERP characteristics for different syllables in the early speech perception stage. Although the N1 latency showed no difference either in quiet or noisy conditions, P2 latency evoked by /ba/ was shorter than /bu/ and /ga/. Firstly, this might be related to the fact that N1 and P2 originated from different anatomic sources, and reflected different functional properties of the cortical auditory processing mechanisms. N1, a front-centrally component generated bilaterally mainly in the auditory cortices, corresponds to the first stage of detection and recognition of acoustic features of speech [27]. P2 appears more susceptible to being modulated by cognitive factors and reflects further stimulus evaluation and classification [28]. For our findings, we assumed that the acoustic properties of speech were crudely encoded in the primary auditory cortex during the early perception stage and then were further elaborated during the late perception stage to emphasize the differences in the speech. On the other hand, the reduction of neural responses in the brain when repeatedly exposed to the same stimulus, referred to as adaptation, is usually presented in ERP study as decreased amplitudes and earlier latencies of N1-P2 [29]. In our study both deviant stimuli /ga/ and /bu/ evoked higher N1-P2 than the standard stimulus /ba/, which might be due to the adaptation effect. However, it was only in the P2 latency that we found /ba/ to be shorter than those evoked by the other two stimuli, while no such effect was found in the N1 latency, which might be explained by the fact that P2 seemed to be more sensitive to the adaptation effects than N1 [30]. A most recent study found that children with higher cognitive abilities showed adaptations in P2 amplitude to the syllable /ta/ [28]. Thus, in addition to being related to the progressive processing of speech, the earliest P2 latency evoked by /ba/ might also be attributed to the adaptations shown by the cortex to frequent standard stimuli.
Although HL and different syllables resulted in significant differences in the latencies of N1 and P2, our study did not show much longer latencies of N1 or P2 in the noisy condition. Inconsistent with our results, Small et al. [31] (2018) used /t/ and /m/ as stimuli and found that N1-P2 latencies in NH adults were longer under the same 10 dB and even higher SNR conditions (15 and 20 dB SNR). It is worth noting that our study used CV syllables in babble noise as stimuli, while Small et al. [31] (2018) used separate consonants in white noise as stimuli, which were weaker in energy and more susceptible to poor listening environments. Thus, differences in stimulus signal and noise type might account for the discrepancy between our findings and those of Small et al. [31] (2018). As for the HL group, Korczak et al. [11] (2005) suggested that maintaining individual parameters of HA for HL patients in speech discrimination experiments might provide more meaningful and typical responses to aided speech signals. Therefore, participants in the HL group perhaps benefited from being given a speech signal optimized by the noise reduction procedure, resulting in the N1-P2 latency not suffering from the interference of noise.
Noticeably, the effect of noise attenuating speech encoding in the auditory cortex was consistent across hearing levels. We found that both the NH and the HL groups showed lower N1-P2 amplitude in the noisy condition than in the quiet condition, and it was only in the quiet condition that higher N1-P2 amplitude was found in the NH group than in the HL group, while the differences in speech central encoding between the two groups seemed to be obscured in the noisy condition. These suggested that even individuals with NH were not immune to noise interference and showed a diminished central response to speech. Furthermore, as an objective marker of speech processing in the primary auditory cortex, the integral change of N1-P2 amplitude seems more stable than that of a single component [32]. As shown in Fig. 2, we found that the N1-P2 amplitudes evoked by all three syllables consistently attenuated in the noisy condition, which might be attributed to noise-induced cognitive resource streaming [33]. That is, the auditory cortex is unable to reconcile the simultaneous encoding of noise and target speech signals, consequently impairing the processing of target auditory information. In conclusion, noise is an essential factor affecting the sensitivity of the primary auditory cortex to speech perception.
The MMN is a valuable tool in assessing the integrity of the speech discrimination process in the auditory cortex of people with HL. Long-term auditory deprivation made it difficult for people with HL to perceive small changes in sound signals and required a longer central response time to discriminate sound details [34]. Similar to the study by Boo et al. [34] (2022), we found that the MMN latencies were longer in the HL group than in the NH group, indicating that individuals with prelingual HL, even if they received bilateral HA under the chronological age of 6 years, still have difficulty in recognizing speech sounds after long-term usage and that the effects of prelingual HL can persist throughout adulthood.
As for MMN amplitude, Turgeon et al. [35] (2014) found that the MMN evoked by syllable /ba/-/ga/ showed much lower amplitude in CI users with poorer speech recognition compared to NH controls. In our study, as shown in Figs. 3,4, the HL group showed lower MMN amplitude than the NH group, and the MMN evoked by the vowel contrast in the HL group showed lower prefrontal negative energy compared to the NH group. In addition, it was only in the NH group that we observed that the vowel contrast evoked higher MMN than that of the consonant contrast, whereas in the HL group the vowel contrast and the consonant contrast evoked approximate MMN amplitudes. These results suggested that long-term bilateral HA users with prelingual severe to profound HL, in a way similar to CI users, varied from those with NH in automatic speech discrimination at the pre-cognitive stage, even though the hearing level has been compensated or constructed adequately in the HL group. This deficit in central encoding of speech differences might further affect the recognition and intelligibility of speech in the HL people.
Discerning differences in phonemes is a prerequisite for accurate speech recognition. A previous study used /bi/-/bu/, /ba/-/da/, and /da/-/ta/ as stimulus signals and found that MMNs induced by vowel contrasts all had greater amplitudes as well as shorter latencies than consonant contrasts [36]. Similarly, our study also showed longer MMN latencies evoked by the consonant contrasts than vowel contrasts in both groups and listening conditions. Moreover, MMN amplitudes induced by the vowel contrast were higher, and the negative prefrontal component of the scalp topography was more pronounced than the consonant contrast. The findings above suggested that the auditory cortex automatically evaluated and classified consonants and vowels at the early pre-attentive phase. When pronouncing consonants, the airflow was obstructed to varying degrees in various organs of phonation, whereas when pronouncing vowels, the airflow was not obstructed by any of the organs. Differences in pronunciation patterns made consonants show rapidly shifting resonance peaks and faint loudness, while vowels showed a relatively steady-state spectrum and were much louder [37]. Furthermore, as shown in Fig. 1B and Table 4, the F0, F1, and F2, as well as the envelope, were more similar between /ba/ and /ga/ than between /ba/ and /bu/. It has been reported that the variability influenced the MMN in stimulus characteristics. The greater the variability between deviant and standard stimuli, the earlier and greater the MMN appeared [38]. Thus, it was easy to explain why vowel contrasts, compared to subtle consonant contrasts, were more easily processed by the cortex in our study. Moreover, probably owing to more challenging discrimination of consonant contrasts, it was only the vowel contrast that evoked higher MMN in the NH group than in the HL group in our study.
It is noteworthy that, when processing speech in noisy environments, we observed a significant decrease in the amplitude but no significant delay in the latency of the N1 and P2 components during the original speech perception stage (Fig. 2), whereas during the discrimination stage in which speech subtle differences were processed, a significant delay in the latency of the MMN occurred in both groups but only a slight and insignificant decrease in the amplitude (Figs. 3,4). These results might indicate that noise affects processes of speech and speech differences differently, with the latency of the endogenous component MMN and the amplitude of the exogenous component N1-P2 being more sensitive to noise [39]. Therefore, N1-P2 and MMN should be combined as an objective electrophysiological index for evaluating speech auditory performance in noisy environments.
This study examined the cortical electrophysiological characteristics of noise on speech recognition by bilateral HA users with prelingual severe to profound HL. In real life, SNR are varied. In the future, we plan to increase the gradient of the SNR to explore central processing at different noise levels further.
Secondly, we selected only three CV syllables for the stimuli: /ba/, /ga/, and /bu/. To explore the response characteristics of the auditory cortex to syllables composed of different unitary and consonant sounds in Mandarin Chinese, we need to add more syllable types. Re-choose a suitable experimental paradigm, such as a multi-feature paradigm, might be necessary.
Finally, although the N1-P2 and MMN have been proposed as electrophysiological metrics for assessing speech perception and behavioral outcomes, speech recognition can provide a more direct, simple, and valid reflection of participants’ speech discrimination abilities. We consider the addition of an active speech recognition paradigm in future studies that have been conducted with more ERP components as well as intuitive speech perception results.
Long-term use of bilateral HA provides young participants with severe or profound HL with a certain degree of auditory compensation. However, at the level of the auditory cortex, people with prelingual HL remain poor at perceiving and discriminating speech sounds due to inadequate development of the auditory cortex resulting from long-term hearing deprivation. Differences in the sensitivity of endogenous and exogenous AERP components to speech reveal the effects of noise and HL on different stages of speech cortical encoding.
It is certain that neither HL people with bilateral HA nor NH people are immune to noise interference and that both groups were better at automatically discriminating vowel differences than distinguishing consonant differences. Therefore, in addition to the auditory ability, variations in the listening environment and the acoustic characteristics of the speech are also factors that contribute to the differences in auditory cortical coding.
Our study has furnished objective evidence regarding the processing of speech signals in quiet and noisy environments for long-term bilateral HA users with severe to profound HL.
The raw data supporting the conclusions of this article are available at the request of the author, without undue reservation.
YY and YL conceptualized and designed the research study. YZ, YL, and QL performed the research. All authors provided help and advice on this ERP study. YZ, YL, and QL analyzed the data. YZ and YY wrote the manuscript. YZ and YY designed the figures. All authors contributed to editorial changes in the manuscript. All authors read and approved the final manuscript. All authors have participated sufficiently in the work and agreed to be accountable for all aspects of the work.
This study was approved by the Ethics Committee of Binzhou Medical University (protocol code BMU-IRB-2021-171, approved on 5 March 2021). The study was carried out in accordance with the guidelines of the Declaration of Helsinki. All subjects gave their informed consent for inclusion before they participated in the study.
We would like to express our sincere gratitude to all the participants in the study.
This work was supported by the National Natural Science Foundation of China (82301327); National Natural Science Foundation of Shandong Province (ZR2021MC052).
The authors declare no conflict of interest.
References
Publisher’s Note: IMR Press stays neutral with regard to jurisdictional claims in published maps and institutional affiliations.