


 , Ankush Sharma 2,3, Monia Taranta 1, Caterina Cinti 4,*
1 Institute of Clinical Physiology, National Research Council of Italy, 53100 Siena, Italy
2 Department of Cancer Immunology, Institute for Cancer Research, Oslo University Hospital, 0450 Oslo, Norway
3 KG Jebsen Centre for B-cell malignancies, Institute of Clinical Medicine, University of Oslo, 0313 Oslo, Norway
4 Institute for Organic Synthesis and Photoreactivity, National Research Council of Italy, 40129 Bologna, Italy
Abstract
Retinoblastoma (Rb) is a rare cancer, yet it is the most common eye tumor in children. It can occur in either a familial or sporadic form, with the sporadic variant being more prevalent, though its downstream effects on epigenetic markers remain largely unclear. Currently, the treatment for retinoblastoma typically involves aggressive chemotherapy and surgical resection. The identification of specific epigenetic characteristics of non-hereditary (sporadic) Rb has led to the development of advanced, high-throughput methods to explore its epigenetic profile. Our previous research demonstrated that treatment with the demethylating agent 5-Aza-2′-deoxycytidine (decitabine; DAC) induced cell cycle arrest and apoptosis in a well-characterized retinoblastoma model (WERI-Rb-1). Our analysis of time-dependent gene expression in WERI-Rb-1 cells following DAC exposure has led to the development of testable hypotheses to further investigate the epigenetic impact on the initiation and progression of retinoblastoma tumors.
Gene expression analysis of publicly available datasets from patients’ primary tumors and normal retina have been compared with those found in WERI-Rb-1 cells to assess the relevance of DAC-driven genes as markers of primary retinoblastoma tumors. The effect of DAC treatment has been evaluated in vivo, both in subcutaneous xenografts and in orthotopic models. qPCR analysis of gene expression and Methylation-Specific PCR (MSP) was performed.
Our analysis of network maps for differentially expressed genes in primary tumors compared to DAC-driven genes identified 15 hub/driver genes that may play a pivotal role in the genesis and progression of retinoblastoma. DAC treatment induced significant tumor growth arrest in vivo in both subcutaneous and orthotopic xenograft retinoblastoma models. This was associated with changes in gene expression, either through the direct switching-on of epigenetically locked genes or through the indirect regulation of linked genes, suggesting the potential use of DAC as an epigenetic anti-cancer drug for the treatment of retinoblastoma patients.
There is a pressing need to develop innovative treatments for retinoblastoma. Our research revealed that DAC can effectively suppress the growth and progression of retinoblastoma in in vivo models, offering a potential new therapeutic approach to battle this destructive disease. This discovery highlights the impact of this epigenetic therapy in reprogramming tumor dynamics, and thus its potential to preserve both the vision and lives of affected children.
Keywords
- retinoblastoma
- epigenetic reprogramming
- cancer therapy
- epigenetic therapy
- DNA methyltransferase (DNMT) inhibitors
Retinoblastoma (Rb) is a rare aggressive pediatric ocular cancer that represents the most common ocular tumor in children and its therapies and management often require intensive chemotherapy and sometimes surgery. Survivors are often challenged with long-term morbidity and poor quality of life related to their vision [1]. Retinoblastoma rapidly develops in immature retinal cells following biallelic inactivation of the RB1 gene, resulting in the loss of RB1 function in more than 95% of cases [2]. Subsequent mutations and/or epigenetic modifications of other RB gene family members have been reported to play an important role in retinoblastoma tumorigenesis [3, 4]. Given these observations, an integrated analysis of genomic and epigenetic modifications could help to identify new therapeutic approaches in attempts to spare children’s sight and lives.
Epigenetic mechanisms can shape cell phenotype without modifying the DNA sequence and contribute to the regulation of tissue-specific gene expression. DNA methylation is one of the mechanisms for gene silencing, as dense methylation of DNA in promoter regions has been associated with transcriptional repression of chromatin [5]. This epigenetic phenomenon allows cells to respond to environmental changes in a transient manner, facilitating a functional reorganization of the genome while preserving DNA integrity. Recent advances in epigenomics have identified DNA methylation as one of the key mechanisms by which epigenetic regulation contributes to cancer progression, making it a target to interfere with cancer development and progression [6]. Thus, cancer therapy targeting epigenetic mechanisms holds significant promise, as it capitalizes on the reversible nature of epigenetically mediated alterations in gene expression.
Epigenetic-modulating drugs are already a reality in hematological malignancies
and deserve adequate attention in solid tumors [7, 8, 9]. The DNA methyltransferase
inhibitor DAC (decitabine; 5-aza-2′-deoxycytidine) functions as a
demethylating agent aimed at correcting epigenetic abnormalities. It facilitates
the reactivation of silenced genes, particularly tumor suppressor genes, which
play critical roles in regulating apoptosis and other key biological processes
implicated in cancer development [10, 11, 12, 13]. Recent studies have revealed that DNA
methylation regulates multiple pathways in retinoblastoma [14, 15, 16, 17]. However, the
timeframe for demethylating agents to reverse the transcriptional inactivation of
tumor suppressor genes remains poorly understood. In our previous study, we
demonstrated the role of aberrant hypermethylation in primary sporadic
retinoblastoma in patients [3], reinforcing the notion that treatment with
demethylating agents could serve as an effective therapeutic strategy.
Additionally, we have shown the efficacy of DAC in regulating gene expression in
a retinoblastoma model (WERI-Rb-1) in a time-dependent manner [18]. We found that
the antiproliferative effect of DAC is based on its influence on the expression
of genes mainly involved in the regulatory pathways of TNF-, fatty acid synthase
(FAS)-, p53-dependent apoptosis, and NF-
Publicly available Gene Expression Omnibus (GEO) database GSE59983 (https://www.ncbi.nlm.nih.gov/geo/) [19] from 76 retinoblastoma tissue samples, collected from patients who underwent primary enucleation without receiving previous treatment and profiled with Affymetrix human genome u133 plus 2.0 PM microarray, were analyzed using R package GEOquery [20]. Differentially expressed genes (DEGs) among primary tumors (N = 72) vs normal retinal (N = 4) were matched with previously obtained data of DAC-driven co-regulated genes from the WERI-Rb-1 cell line profiled using PIQORTM Cell Death Human Sense Microarrays [18].
GeneMania algorithm (http://www.genemania.org) was used to generate network maps of DEGs showing co-expression among connected genes. Functional enrichment analysis was obtained by the DAVID tool [21]. The resulting networks were exported to the Cytoscape platform (https://cytoscape.org/) for gene mapping and proper visualization of highlighted DEGs and their relationships. Gene ontology analysis for functional annotations of the differentially expressed genes was carried out using the Biological Networks Gene Ontology (BiNGO) and DAVID tools [21, 22]. Cytoscape was also used to properly visualize the connections among genes and their biological functions.
Public available single-cell transcriptome data from GEO database GSE142526 [23]
of normal retina cells (human retinal organoids ORG_D104; ORG_D110 and
retinospheres derived from human fetal retina RS_D134_pl_26FV) and from GEO
database GSE196420 [24] of patient-derived non-familial retinoblastoma cells
classified as E and D (Supplementary Table 1) according to the
intraocular retinoblastoma classification (IIRC) (wRB6, RB006, RB010, RB015,
RB016, RB018, RB020, and RB021) were also analyzed using the Seurat package [25]
with a state-of-the-art pipeline previously utilized in [26, 27]. Single-cell
transcriptomes data were filtered based on defined criteria when genes expressed
in cells
The Weighted Gene Co-expression Network Analysis package (WGCNA) [30, 31] was used to reconstruct weighted gene co-expression networks for the differentially expressed genes in primary tumor and normal retinal cells. Edge weights, computed based on topology overlap measures, assigned co-expression correlation values between 0 and 1 to two connected genes (GEOquery). Subnetworks of 15 retinoblastoma hub genes were extracted from the co-expression networks of primary tumors using a threshold cutoff of 0.05 on edge weights among co-expressing genes. Cytoscape version 3.3 was used to visualize, and topological parameters were computed using Centiscape [27].
WERI-Rb-1 cells (ATCC, Manassas, VA, USA) were maintained in RPMI1640 medium
(EuroClone, Milan, Italy) supplemented with 10% fetal bovine serum (EuroClone,
Milan, Italy) and 2 mM L-glutamine, plus penicillin (100 U/mL) and streptomycin
(100 mg/mL). The manufacture guarantee the cells are Mycoplasma Free and authenticated. Cells were split twice a week by resuspension in fresh media at a
concentration of 3
Total RNA was extracted from WERI-Rb-1 cells using the NucleoSpin RNA isolation
kit (Macherey-Nagel, Duren, Germany) and from subcutaneous xenograft tumor
samples using TRIzol reagent (Thermo Fisher Scientific, Waltham, MA, USA),
according to the manufacturer’s instructions. RNA concentration and purity were
determined using a NanoDrop spectrophotometer (Thermo Fisher Scientific, Waltham,
MA, USA). For each sample, 1 µg of total RNA was reverse transcribed using
the Maxima H Minus First Strand cDNA Synthesis Kit (Thermo Fisher Scientific,
Waltham, MA, USA). For the selected set of genes, qPCR validation was performed
using the DyNAmo Flash SYBR Green qPCR Kit (Thermo Fisher Scientific, Waltham,
MA, USA) with the PikoReal Real-Time PCR System (Thermo Fisher Scientific,
Waltham, MA, USA). Primer specificity was checked using primer-BLAST
(https://www.ncbi.nlm.nih.gov/tools/primer-blast) and confirmed by melting curve
analysis. Primer pairs sequences are reported in Supplementary Table 2a.
Amplification conditions were as follows: 7 minutes at 95 °C, followed
by 40 cycles of 10 seconds at 95 °C, 20 seconds at 60 °C and 20
seconds at 72 °C. All samples were analyzed in triplicate. The relative
expression of target genes was evaluated using the comparative cycle threshold
method (
DNA methylation in the promoter regions of selected genes (CASP8, FAS, BIK, TP73, DAP3, and RRAD) was analyzed by MSP, based on the differences between methylated and unmethylated DNA sequences, following sodium bisulfite treatment. Genomic DNA was extracted from WERI-Rb-1 cells and subjected to bisulfite modification using the EpiJET Bisulfite Conversion Kit (Thermo Fisher Scientific, Waltham, MA, USA). Modified DNA was then used for PCR reactions. Primer pairs for methylated (M) and un-methylated (U) sequences were designed to target CpG islands in promoter regions of the selected genes, using sequence data obtained from UCSC GENOME Browser (http://genome.ucsc.edu/cgi-bin/hgGateway). Primer specificity was validated through agarose gel electrophoresis of the PCR products, confirming the presence of a single band with the expected molecular weight. Detailed primer sequences are reported in Supplementary Table 2b.
Experiments were conducted on opportunistic pathogen-free the Naval Medical Research Institute (NMRI) male athymic BALB/c Nude mice, aged six to seven weeks (Harlan Laboratories, Udine, Italy), in accordance with EU Directive 2010/63/EU and the regulation of the Italian Ministry of Health. The mice were maintained on standard laboratory food and water that were available at all times, under a 12 h artificial light/dark cycle. After induction of deep anesthesia by inhalation of isoflurane in an induction chamber, the mice were euthanized using CO2, as recommended by attachment IV Table 3 of EU Directive 2010/63/EU; 14G00036, GU Serie Generale n.61 del 14-03-2014, and Italian Ministry of Health. All the procedures were verified by the Ethics Committees of the Toscana Life Sciences and the Istituto Superiore di Sanità (ISS) on behalf of the Italian Minister of Health (Permit Number: # CNR-030314 and # CNR-101013) following ethical ICLAS and ARRIVE guidelines.
For the subcutaneous implants, animals were anesthetized using 2.5% isoflurane
during the manipulation. WERI-Rb-1 cells, at a concentration of 3.6
The orthotopic retinoblastoma model was established unilaterally in one eye by
injecting 1
In both experimental settings (xenograft and orthotopic retinoblastoma models), the treated groups received biweekly I.V. injections of 300 µL of 75 µg DAC in PBS buffer (meaning a therapeutic dose of 2.5 mg/kg), while the control groups received the vehicle. At the end of each measurement and treatment session, the animals were monitored for signs of distress and allowed to recover in the original cages. After 3 weeks of treatment, the mice were euthanized via CO2 inhalation. No signs of distress were observed [32] and no animals died during the treatments. Resected tumor masses from subcutaneous xenografts were processed using TRIzol reagent (Thermo Fisher Scientific, Waltham, MA, USA) and stored at –20 °C for further qPCR analysis.
The VisualSonics Vevo 2100 imaging system (VisualSonics VEVO 2100, Fujifilm
Sonosite Inc., Bothell, WA, USA) was utilized to measure retinoblastoma growth
within the eye. Animals were anesthetized with 5% isoflurane at an oxygen flow
rate of 2 L/min (maintained at 2.5% isoflurane at an oxygen flow rate of 2
L/min) and placed on a warming pad in a prone position to facilitate signal
acquisition while monitoring temperature, respiratory and heart rate. B-mode
images were acquired using the MS-550 Blue transducer (central frequency, 40 MHz)
connected to a 3-dimensional motor collecting frames 0.5 mm apart in the eye
region. In the orthotopic model, for off-line analysis, a field of interest (FOI)
outlining the tumor boundaries in the eye was drawn for reconstruction in 3D
B-mode. These results were normalized to baseline (volume at tumor appearance)
and expressed as fold increase (V = Vtx/Vt0)
For the in vitro experiments the results represent the mean
To assess whether the co-regulated clusters of genes (Supplementary Fig. 1), previously identified in DAC-treated WERI-Rb-1 cells [18], could represent candidate markers and potential therapeutic targets of DAC for primary retinoblastoma tumors, we performed a comparative analysis of differentially expressed genes (DEGs) in primary tumors versus WERI-Rb-1 cells. Publicly available transcriptome datasets from patient-derived samples and low-passage patient-derived single-cells were analyzed [19, 23, 24].
Table 1 reports the most significant time-related DEGs in WERI-Rb-1 cells after exposure to DAC within the co-regulated genes clusters, previously identified through the analysis of PIQORTM Cell Death Human Sense Microarrays data [18].
| Cluster | Name | 48 h | 72 h | 96 h |
| 0 | JUNB (AP-1) JunB proto-oncogene, AP-1 transcription factor subunit | –3.32 | –1.20 | 0 |
| 0 | FOS (AP-1; C-FOS; p55) Fos proto-oncogene, AP-1 transcription factor subunit | –2.18 | 0 | 0 |
| 0 | MAPK8IP2 (IB2; JIP2; PRKM8IPL) C-JUN amino-terminal mitogen activated protein kinase 8-interacting protein 2 | –2.25 | –1.18 | 0 |
| 0 | MAPK8IP1 (B1; JIP1; JIP-1; PRKM8IP) C-JUN amino-terminal mitogen-activated protein kinase 8-Interacting protein 1 | –2.89 | –1.00 | 0 |
| 0 | RASL10B (RRP17; VTS58635) RAS-like family 10, member B | –2.32 | –1.50 | 0 |
| 0 | MAPK12 (ERK3; ERK6; SAPK3; PRKM12; SAPK3; P38GAMMA) mitogen-activated protein kinase 12 | –2.73 | –1.00 | 0 |
| 0 | MRTFA (MAL; MKL; BSAC; MKL1; MRTF-A) Megakaryoblastic leukemia-1 protein | –2.32 | –1.50 | 0 |
| 0 | RELA (NFKB3) RELA proto-oncogene, NF-κB subunit | –2.89 | –1.00 | 0 |
| 0 | BCL2L1 (BCL-XL) apoptosis regulator BCL2 Like 1 | –2.52 | –1.82 | 0 |
| 0 | TRAF2 (MGC:45012, RNF117, TRAP) TNF receptor associated factor 2 | –2.73 | –1.77 | 0 |
| 0 | TOLLIP (IL-1RAcPIP) Toll interacting protein | –2.65 | –1.00 | 0 |
| 0 | IKBKG (IKKG; IP; FP3; NEMO) Inhibitor of nuclear factor kappa B kinase regulatory subunit gamma | –2.69 | –1.00 | 0 |
| 0 | HSF1 (HSTF1) Heat-shock transcription factor | –2.00 | –1.00 | 0 |
| 0 | IRAK1 Interleukin-1 receptor-associated kinase 1 | –2.74 | –1.18 | 0 |
| 0 | TICAM1 (TRIF, IIAE6; MyD88-3) TIR domain containing adaptor molecule 1 | –1.98 | –1.00 | 0 |
| 0 | TRIM28 (KAP1 PPP1R157, RNF96, TF1B, TIF1B, TIF1beta) tripartite motif containing 28 | –2.64 | –1.00 | 0 |
| 0 | DAXX (BING2, DAP6, EAP1, SMIM40) FAS death domain-associated protein | –2.00 | –1.00 | 0 |
| 0 | BIRC5 (API4; EPR-1; SURVIVIN) baculoviral IAP repeat containing 5 | –2.00 | –1.00 | 0 |
| 1 | CASP8 (CAP4; MACH; MCH5; FLICE; ALPS2B; Casp-8) caspase | 1.00 | 2.90 | 0 |
| 2 | BAX (BCL2L4) BCL2 associated X, apoptosis regulator | 0 | 0 | 2.15 |
| 2 | CDKN1A (P21; CIP1; SDI1; WAF1; CAP20; CDKN1; MDA-6; p21CIP1) Cyclin-dependent kinase inhibitor 1A | 0 | 1.00 | 2.05 |
| 2 | MAPK6 (ERK3, HsT17250, PRKM6, p97MAPK) Mitogen-activated protein kinase 6 | 0 | 0 | 1.85 |
| 2 | PPP1R15A (GADD34) Protein phosphatase 1 regulatory subunit 15A | 1.00 | 0 | 1.75 |
| 2 | DAP3 (DKFZp686G12159, MGC126058, MGC126059, MRP-S29, MRPS29, bMRP-10) Mitochondrial ribosome small 28s subunit | 0 | 0 | 2.08 |
| 2 | GAPDH (G3PD, GAPD, HEL-S-162eP) Glyceraldehyde-3-phosphate dehydrogenase | 0 | 0 | 2.00 |
| 2 | SEPT7 (CDC10; CDC3; Nbla02942) Septin7 | 1.00 | 1.00 | 1.77 |
| 2 | TNFRSF25 (APO-3, DDR3, DR3, GEF720, LARD, PLEKHG5, TNFRSF12, TR3, TRAMP, WSL-1, WSL-LR) TNF receptor superfamily member 25 apoptosis mediator | 1.00 | 1.00 | 1.74 |
| 2 | ALG2 (PDCD6; CDG1I; CDGIi; CMS14; CMSTA3; NET38; hALPG2) Programed cell death 6 | 1.00 | 0 | 1.75 |
| 2 | TP53 (P53; BCC7; LFS1; BMFS5) Tumor protein p53 | 0 | 1.00 | 1.95 |
| 2 | TP73 (P73; CILD47) Tumor protein p73 | 0 | 1.00 | 1.95 |
| 2 | CASP6 (MCH2; CSP-6; caspase-6) Caspase 6 | 0 | 0 | 2.15 |
| 2 | STAT1 (CANDF7, IMD31A, IMD31B, IMD31C, ISGF-3, STAT91) Signal transducer and activator of transcription 1 | 1.00 | 0 | 1.57 |
| 2 | GPS1 (CSN1; SGN1; COPS1) G protein pathway suppressor 1 | 0 | 0 | 1.77 |
| 3 | CASP3 (CPP32; SCA-1; CPP32B) Caspase 3 | 0 | 1.00 | 2.86 |
| 3 | RERG (MGC15754) RAS like estrogen regulated growth inhibitor | 0 | 1.00 | 2.82 |
| 3 | PARP1 (PARP; PARS; PPOL; ADPRT; ARTD1; ADPRT1; ADPRT 1; pADPRT1; Poly-PARP) poly [ADP-ribose] polymerase-1 | 0 | 0 | 2.62 |
| 3 | LIG4 (LIG4S) DNA ligase 4 | 0 | 0 | 2.67 |
| 3 | EI24 (EPG4; PIG8; TP53I8) EI24 autophagy associated transmembrane protein | 0 | 0 | 2.74 |
| 3 | STAMBP (AMSH; MICCAP) STAM binding protein | 0 | 0 | 2.76 |
| 3 | RRAD (RAD; RAD1; REM3) Ras related glycolysis inhibitor and calcium channel regulator | 0 | 1.00 | 3.23 |
| 3 | PQBP1 (SHS; MRX55; MRXS3; MRXS8; NPW38; RENS1) Polyglutamine binding protein 1 | 0 | 0 | 4.80 |
| 3 | PPM1D (JDVS; WIP1; IDDGIP; PP2C-DELTA) protein phosphatase Mg2+/Mn2+ dependent 1D | 0 | 1.00 | 3.49 |
| 3 | CCNG2 Cyclin G2 | 1.00 | 1.00 | 3.53 |
| 3 | AKAP12 (SSECKS; AKAP250) A-kinase anchoring protein 12 | 1.00 | 1.00 | 2.48 |
| 3 | PSMD2 (S2; P97; RPN1; TRAP2) Proteasome 26S subunit ubiquitin receptor | 1.00 | 1.00 | 2.70 |
| 3 | FAS (APT1; CD95; FAS1; APO-1; FASTM; ALPS1A; TNFRS6) Fas cell surface death receptor | 1.00 | 2.00 | 2.80 |
| 3 | BIK (BP4; NBK; BIP1) BCL-2 interacting killer | 2.22 | 2.86 | 1.45 |
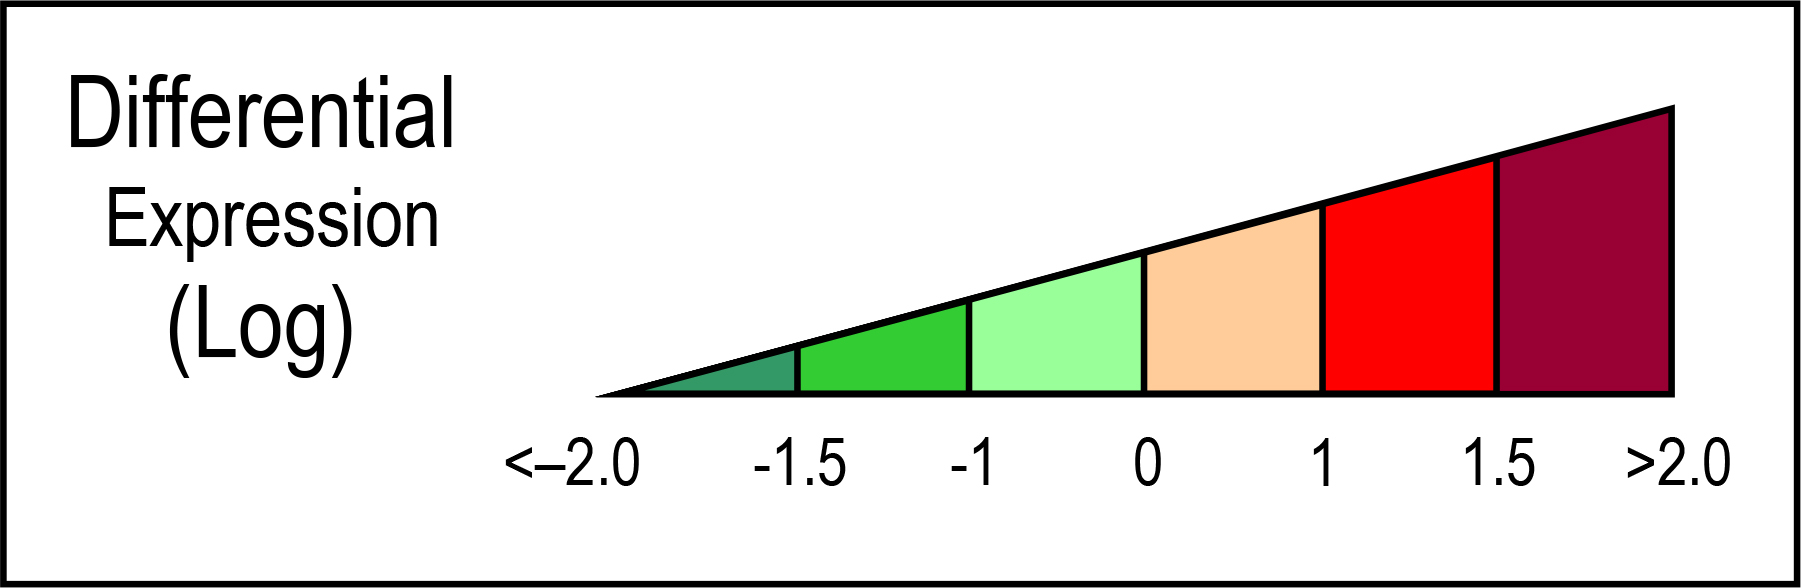 | ||||
For each gene the Log fold change expression value is reported after 48 h, 72 h, and 96 h of DAC treatment. Cluster 0 includes the genes whose expression is downregulated earliest at 48 and 72 h after DAC treatment, with logarithmic values ranging from –1.5 to –3.30. Clusters 1, 2, and 3 include the genes whose expression is upregulated starting at the earliest stage (48 h) and increasing over time, reaching a maximum at 96 h, with logarithmic expression values ranging from +1 to +4.8. The color gradation of each square (green down-regulated and red up-regulated genes) represents the measured differential expression value referred to the logarithmic scale (Log). DAC, 5-Aza-2′-deoxycytidine (decitabine).
A strong down-regulation of pro-survival signals is observed at a short latency (48 h) following DAC treatment. These signals include several pro-mitogenic mediator surface molecules (RASL10B, TOLLIP, and TRAF2), intracellular MAPK members (MAPK8IP1, MAPK8IP2, MAPK12, IRAK1, IKKB, and NFKB3), and intracellular anti-apoptotic mediators (BCL2L1, MKL1, JUNB, BIRC5, and FOS). Conversely, genes playing a role in cell cycle arrest, like PPP1R15A, STAT1, and CDKN1A, are overexpressed starting 48 h after DAC treatment. Furthermore, significant activation of pathways associated with pro-apoptotic signals becomes evident 72 h after DAC treatment. In particular, a significant over-expression of several apoptotic mediator surface antigens, such as FAS, DAP3, and TRAMP receptors as well as intracellular pro-apoptotic members like PSMD2, ALG2, and GAPD, along with members of the caspases cascade (e.g., CASP8, CASP3, and CASP6) is observed. Concurrently, the p53-dependent pathway, which includes CDKN1A, CDC10, PIG8, and BAX, is activated, indicating a potential triggering of cytochrome C release in combination with other mechanisms (e.g., p73-dependent BCL2L1 repression via BIK). The simultaneous down- and up-regulation of all these pathways may explain the effective anti-cancer activity of DAC in WERI-Rb-1 cells.
Interestingly, a notable overexpression of genes associated with DNA repair
signaling, such as PARP1 and LIG4 (DNA LIGASE IV), along with
tissue-specific genes like PPM1D (a photoreceptor-related gene) and
AKAP12 (a gene related to hemato-retinal barrier), both involved in
visual signals [19, 33], was observed at a later time point (96 h), suggesting a
possible reprogramming action of DAC in the surviving cells. To investigate the
potential of these DAC-driven genes as markers of primary retinoblastoma tumors,
a gene expression profile analysis was performed comparing whole transcriptome
microarray datasets of tumor cone photoreceptor lineages vs normal retinal cells.
Both cell types were derived from frozen tissue samples collected after primary
enucleation in patients with familial retinoblastoma [19]. The analysis
identified 463 up-regulated genes, with a Log fold change greater than 2,
and 282 down-regulated genes, with a Log FC
Among the 463 up-regulated genes, 136 are mainly linked to biological processes
involved in cell proliferation, including RASL10B, TRAF2,
RELA, FOS, BCL2L1, MAPKs, and NFKBs.
These genes were found to be highly down-regulated in WERI-Rb-1 cells after DAC
treatment. Additionally, 24 genes that act as positive regulators of DNA damage
and repair signaling, including PARP1 and LIG4, were
up-regulated in the surviving WERI-Rb-1 cells after 96 h of DAC treatment.
Interestingly, in the cone photoreceptor lineages of primary tumors, the top
up-regulated genes (Log FC
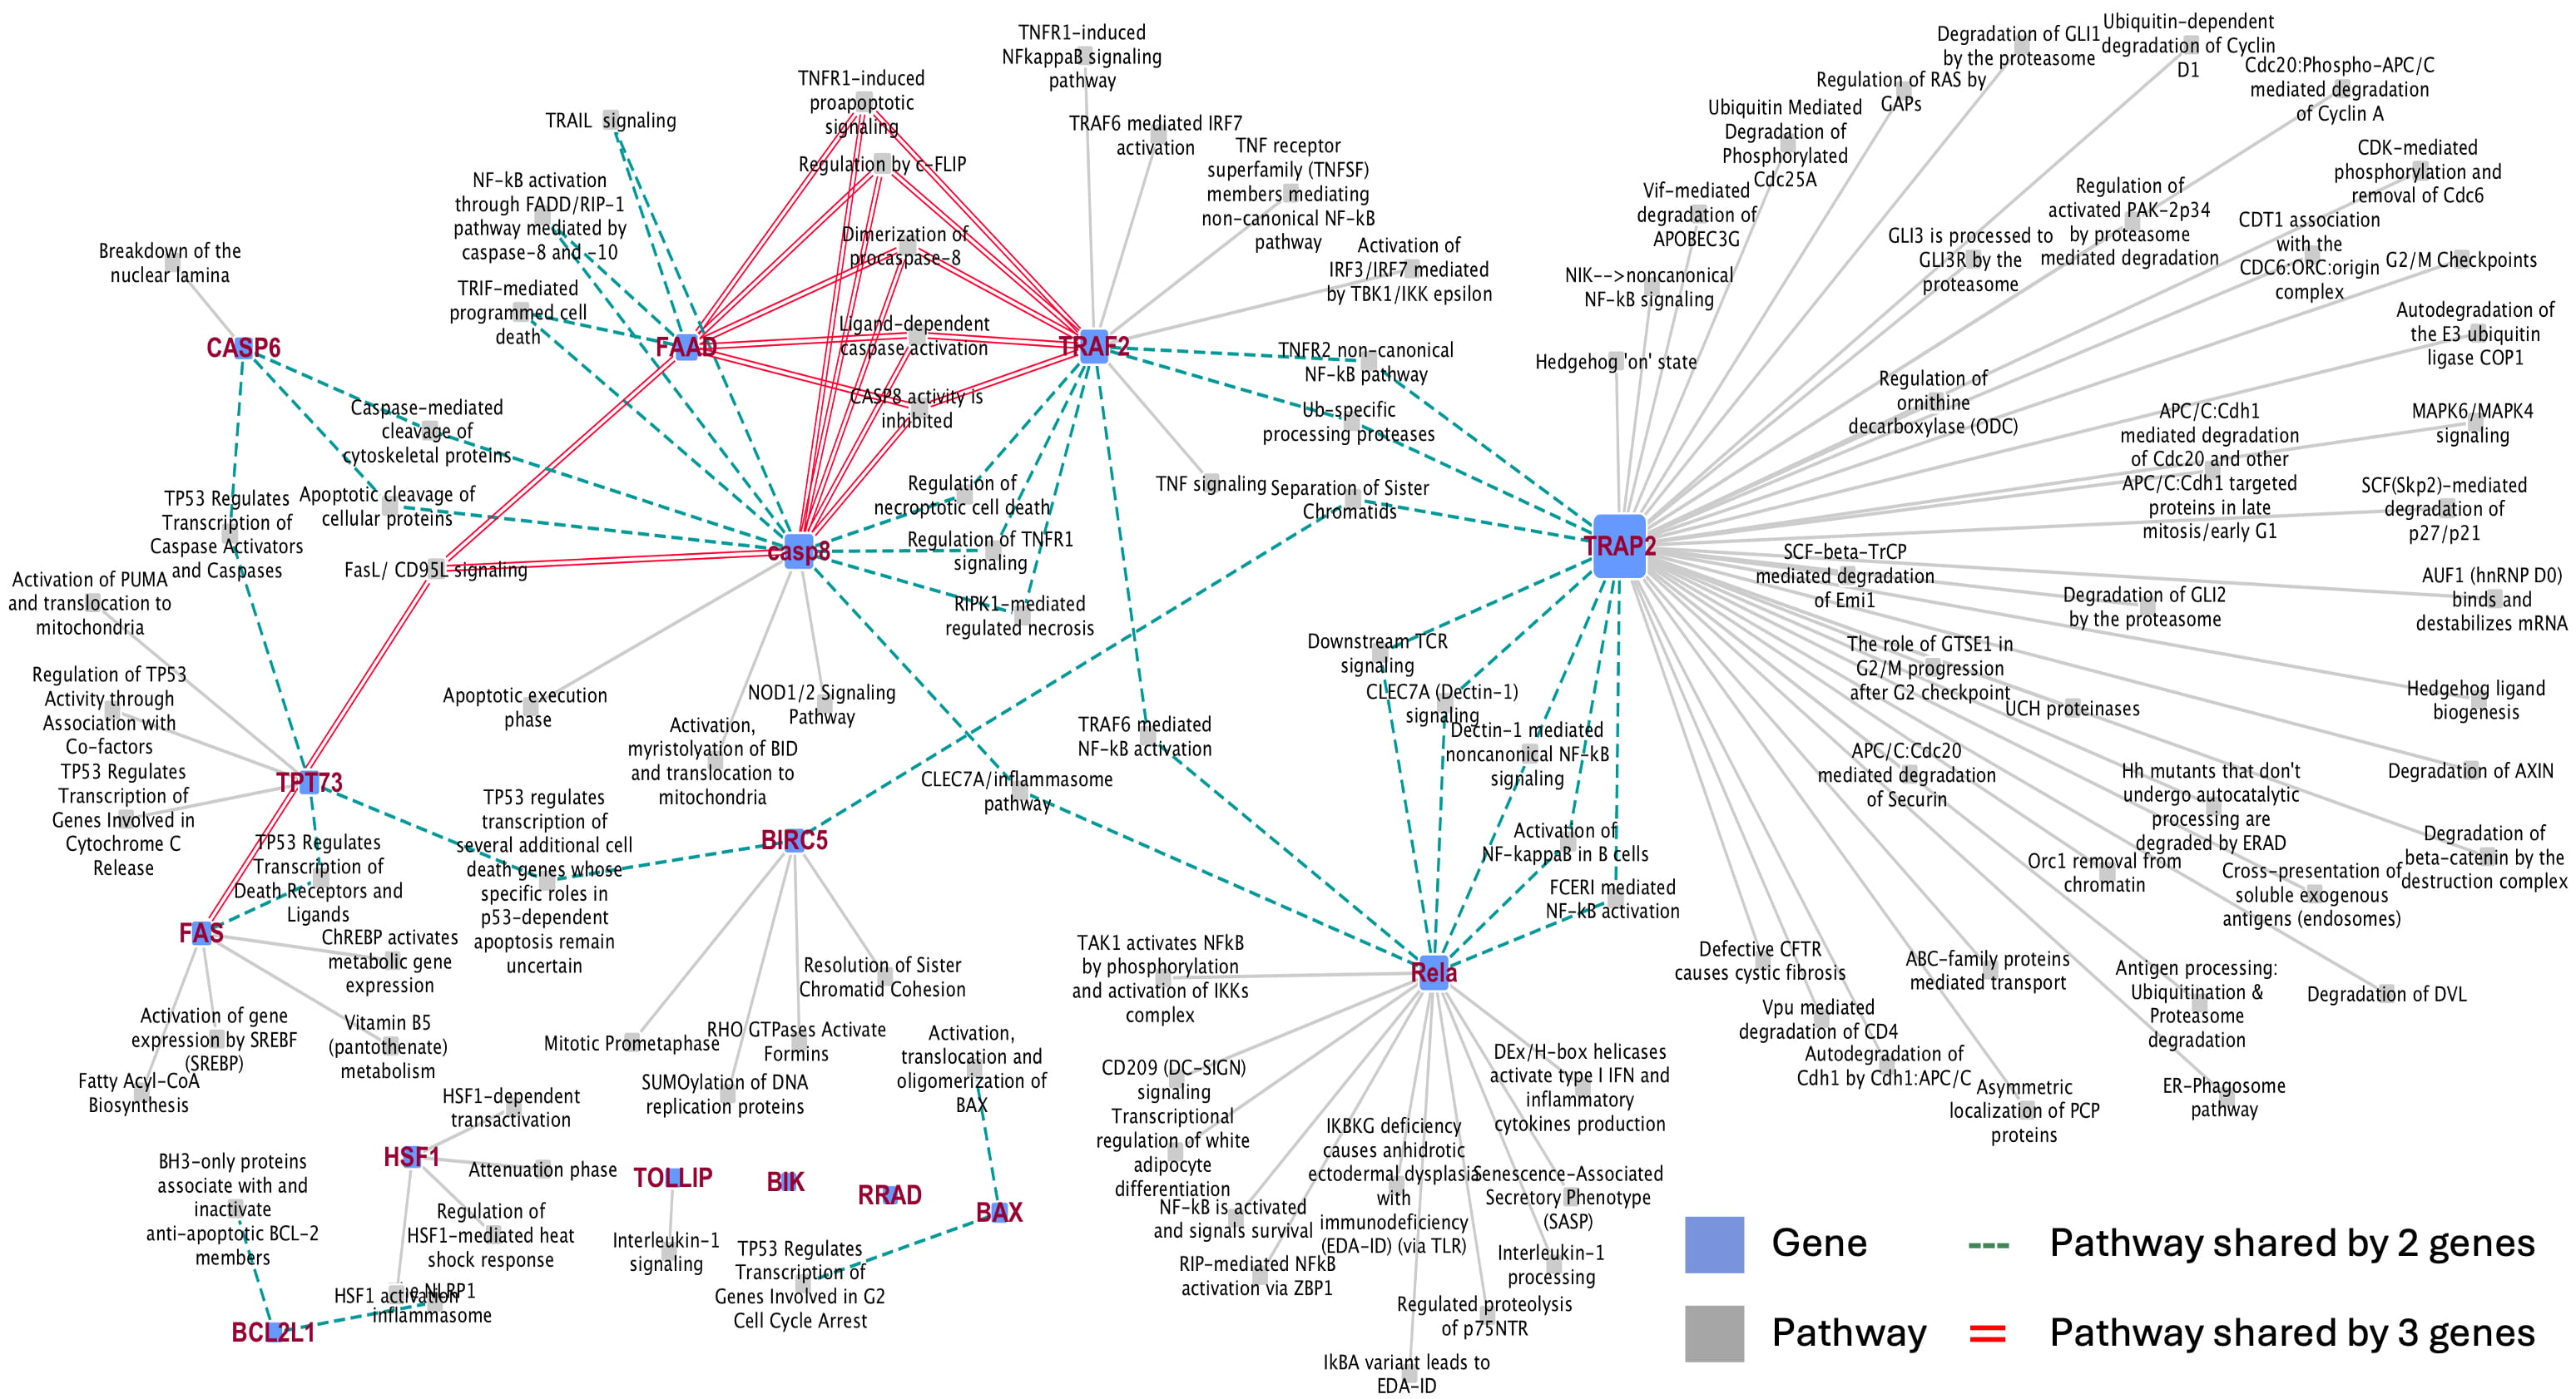 Fig. 1.
Interaction network maps of 15 hub genes and their crosstalk among the pathways. The hub genes are represented as squared nodes (blue). The node size grows in relation to their “connectedness” according to the number of pathways they interact with. The grey lines represent those pathways exclusively related to one of the 15 selected genes. The dotted cyan lines connect the pathways shared by two genes. The double red lines connect pathways shared by at least three genes.
In addition, we developed a protein-protein interaction network map that highlights the central role of these 15 hub genes in regulating numerous proteins/factors (Supplementary Fig. 2). Notably, the oncogenes TRAF2, RELA, and BIRC5, which play pivotal pro-survival roles and exhibit numerous interactions with their neighboring proteins, are highly up-regulated in primary tumors but down-regulated early after DAC treatment. Conversely, FAS and CASP8, which are involved in regulating extrinsic apoptosis pathways, along with BAX, BCL2L1, HSF, and CASP6, key players in intrinsic apoptosis, are highly up-regulated in DAC-treated WERI-Rb-1 cells and are expressed at lower levels in primary tumors. These genes exhibit numerous interactions with proteins/factors that regulate cell fate. Since bulk RNA-seq studies are primarily designed to provide general transcriptomic data for entire tissue samples, they inherently do not capture the tumor heterogeneity of Rb [34]. Therefore, single-cell RNA sequencing (scRNA-seq) analysis was applied to verify the central role of the 15 hub/DAC-driven genes in the genesis and malignant progression of retinoblastoma. Two publicly available single-cell transcriptome datasets [23, 24], comprising human normal retina cells (organoids and retinospheres) and patient-derived sporadic retinoblastoma cells of different intraocular retinoblastoma classification (IIRC) were analyzed (Supplementary Table 1). Comparative computational analysis at the single-cell level identified 25 subclusters annotated with highly expressed genes (see https://ankushs.shinyapps.io/Retinoblastoma_GSE196420/). For each set of normal cells (ORG_D104; ORG_D1110; and RS_D134_pl_26FV) and primary retinoblastoma cells (RB025; RB026; RB027; RB028; RB029) (Fig. 2a) we describe the expression profiles of DEGs, including the 15 hub genes. UMAP images in Fig. 2b,c illustrate the expression of two representative genes, namely BIRC5 and CASP8.
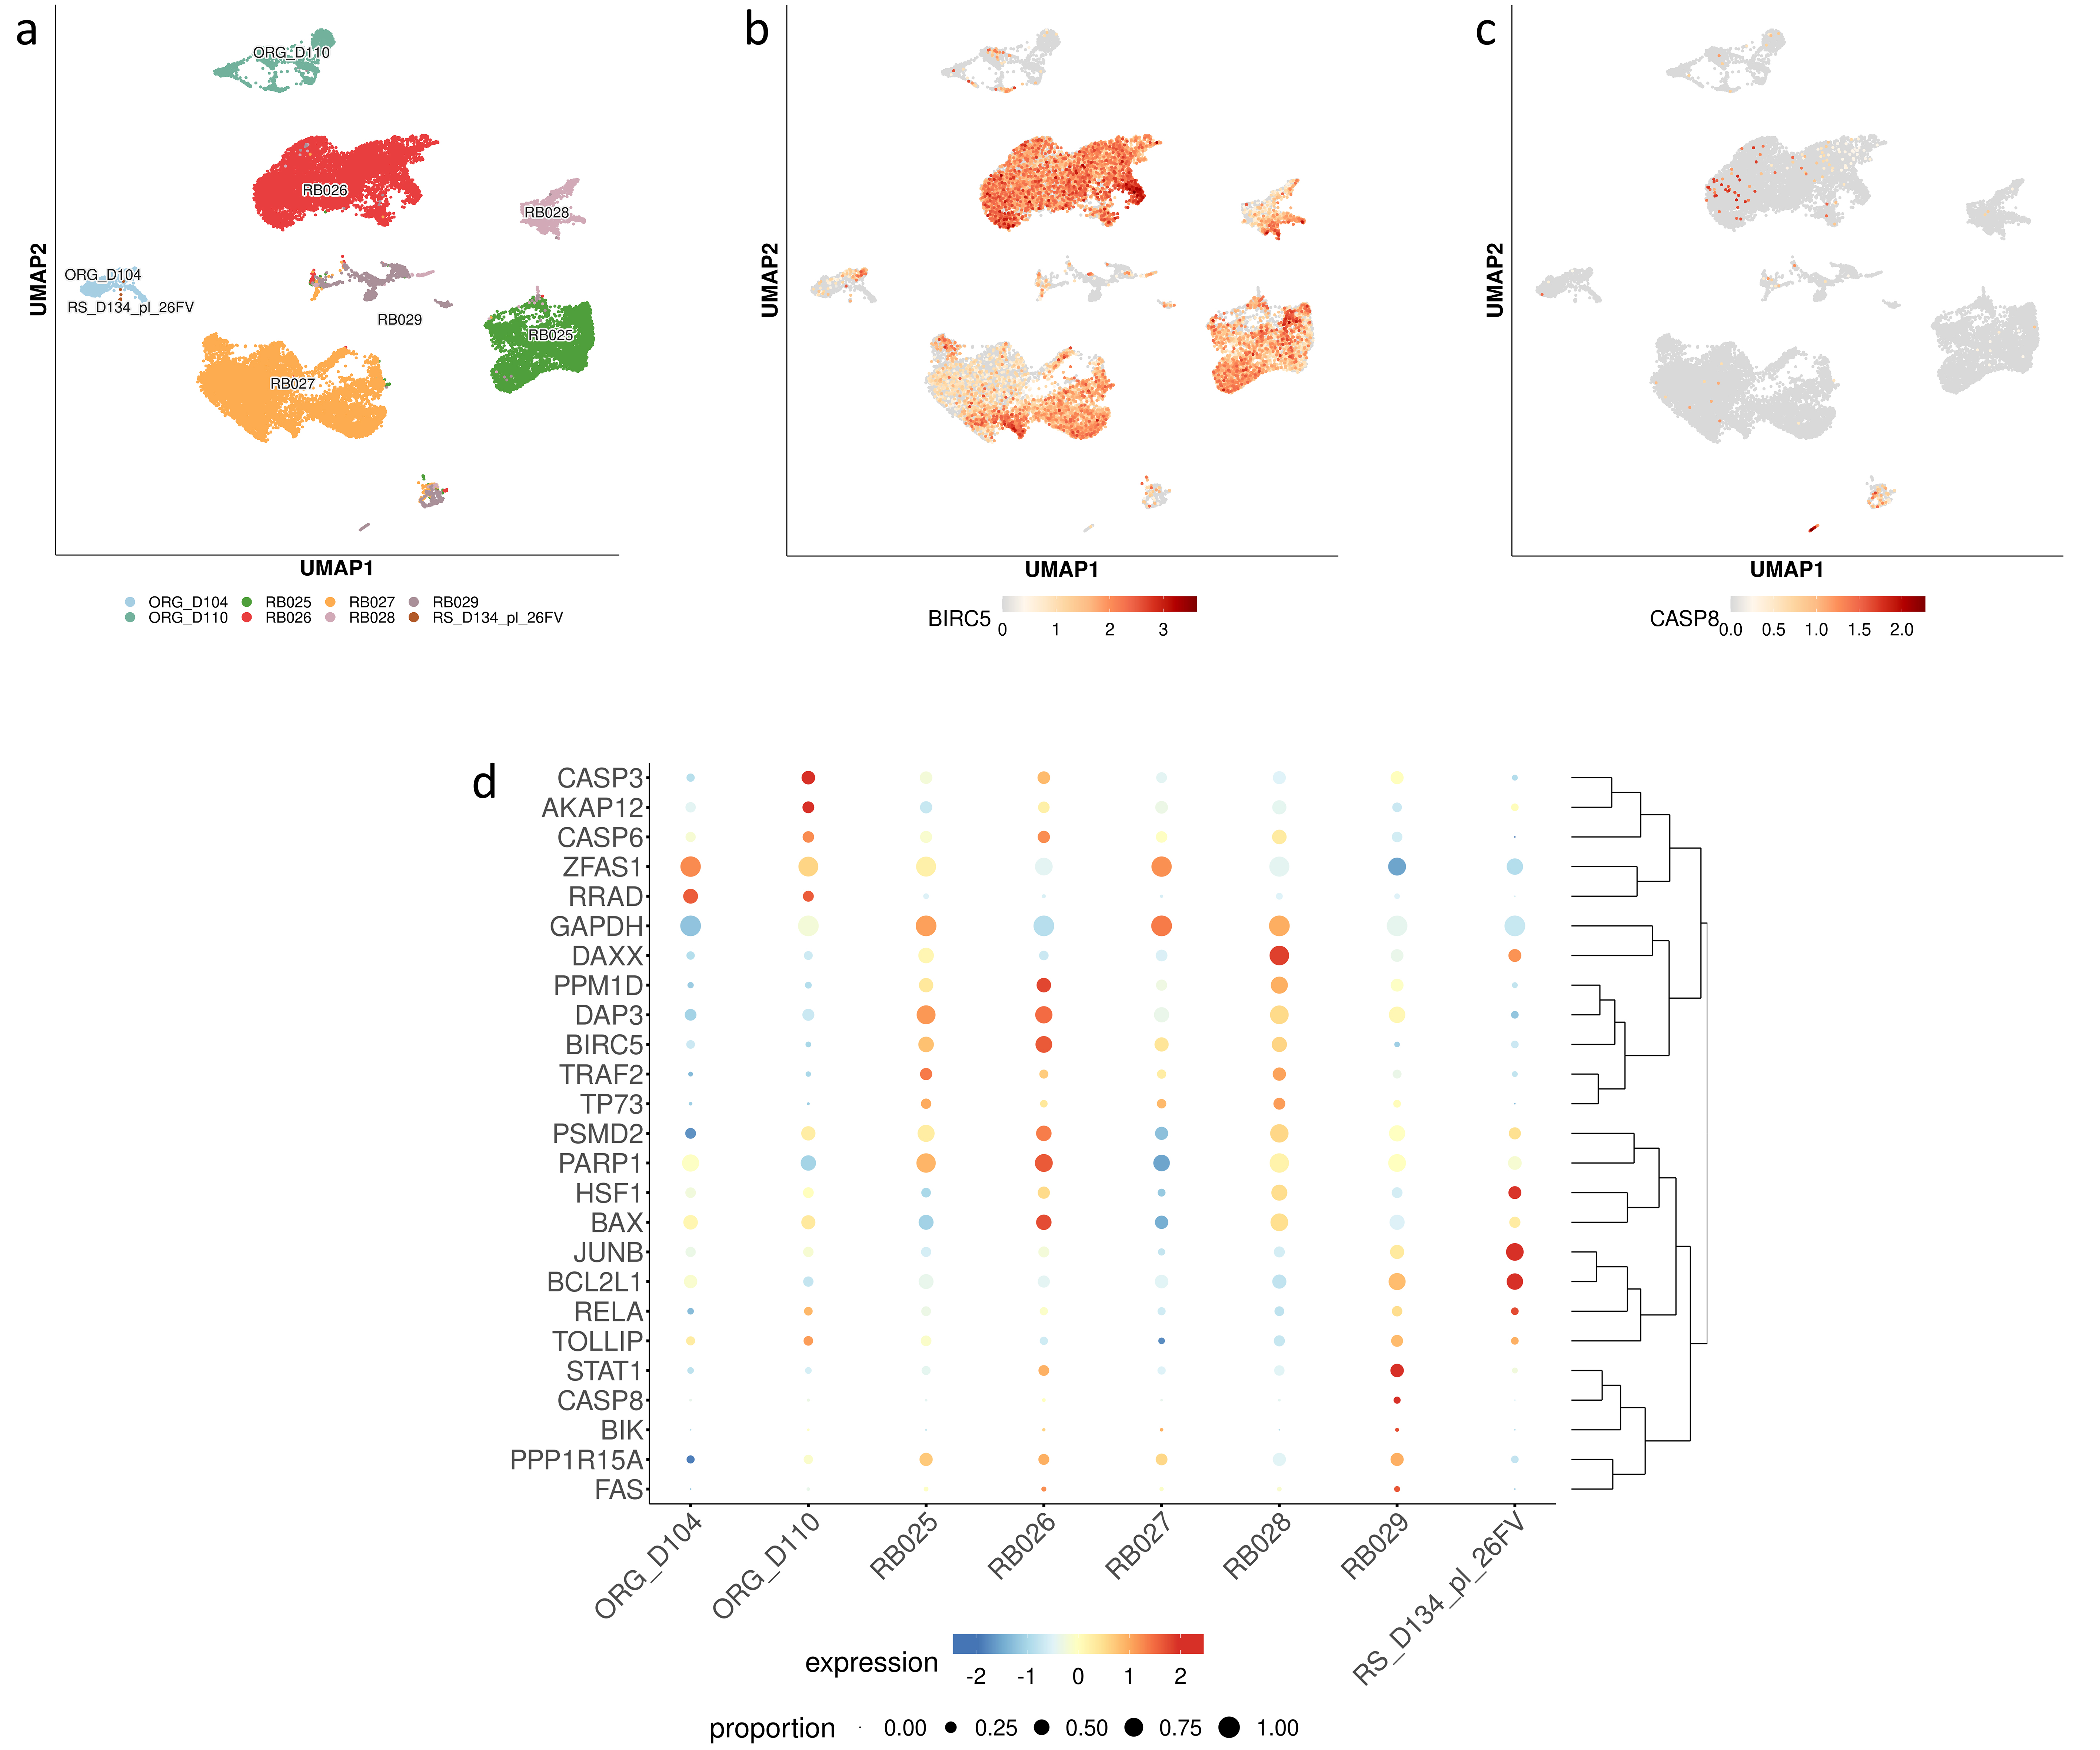 Fig. 2.
Single cells expression profiles of DEGs including the 15 key/hub genes in selected normal and primary tumor samples. (a) Selected patient’s derived retinoblastoma samples (RB025; RB026; RB027; RB028; RB029), human normal retina organoids (ORG_D104; ORG_D110) and single cell fetal retina (RS_D134_pl_26FV). Representative gene expression of selected genes: (b) restricted clusters (cells cut SCT_snn_res.0.35) for BIRC5 gene expression and (c) restricted clusters (cells cut SCT_snn_res.0.35) for CASP8 gene expression. (d) Bubble plot showing expression of several genes (listed in Table 1) in patient-derived retinoblastoma and normal retinal single-cell RNA-seq. The radium of the bubble indicates the prevalence of expression, the color represents the log of up and down expression in any of the sample datasets. DEGs, differentially expressed genes.
Most of the key genes found to be up- or down-regulated in WERI-Rb-1 after DAC treatment, as listed in Table 1, show an inverse correlation in expression compared to those identified in subclusters of patient-derived single-cells (Fig. 2d). Among the 15 hub genes shown in Fig. 1, the BIRC5 and TRAF2 genes, are mostly overexpressed in primary tumor cells (RB025, RB026, RB027, RB028) and are highly down-regulated in DAC-treated WERI-Rb-1 cells. Similarly, DAXX and HSF1, which are down-regulated after DAC treatment, are primarily overexpressed in primary tumors (e.g., RB028) and in fetal retinas (RS-D134_lp_26FV). Meanwhile, the regulation of PPP1R15A, RRAD, FAS, CASP6, CASP3, BAX, CASP8, and BIK genes, mainly involved in cell growth arrest and apoptotic signaling and significantly overexpressed in DAC-treated WERI-Rb-1 cells, are expressed at low levels in organoids (ORG_D104 and ORG_D110) and in all primary tumor samples (RB025, RB026, RB027, RB028, and RB029) (Fig. 2d). The overall data suggest that the epigenetic alterations may be involved in tumor progression and that the identified 15 hub/driver genes could serve as key targets for DAC treatment in primary retinoblastoma tumors.
To test the robustness of the computational data analysis, quantitative PCR was performed on the selected set of 15 hub/driver genes, which showed high differential expression in WERI-Rb-1 cells after DAC epigenetic treatment (Fig. 3).
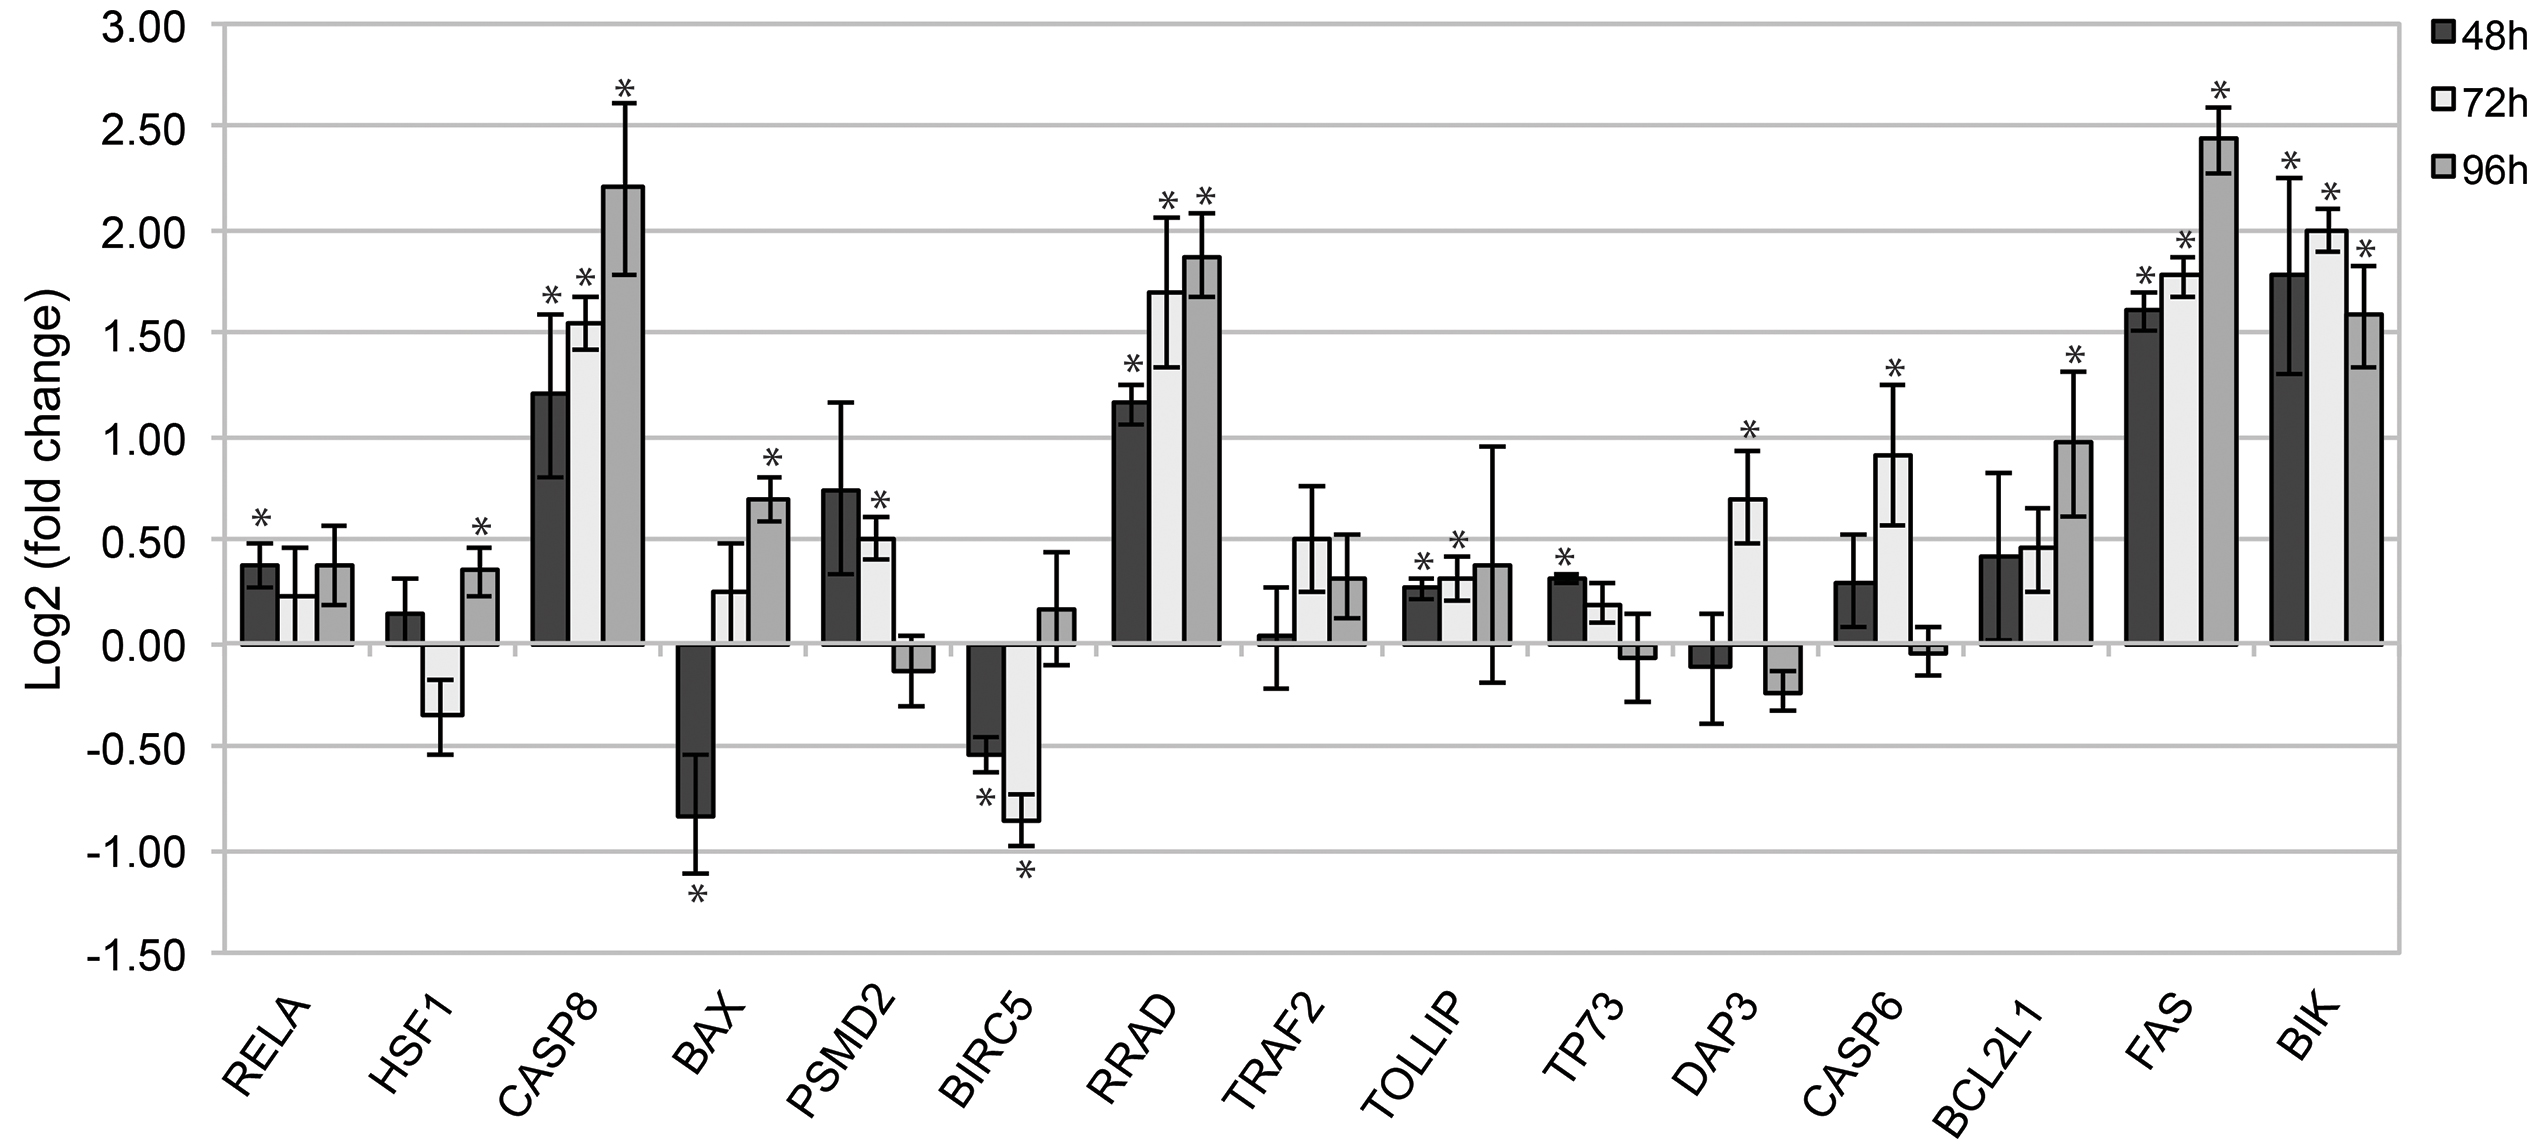 Fig. 3.
Gene expression analysis by qPCR of WERI-Rb-1 cells treated with
DAC. The histogram shows the relative expression of target genes in DAC-treated
WERI-Rb-1 samples, compared to the control untreated samples, after 48, 72, and
96 h of treatment. Data were analyzed using the comparative cycle threshold
method (
We noted a significant up-regulation of several pro-apoptotic genes, namely
FAS, CASP8, BIK, and the tumor suppressor gene
RRAD, at all time-points analyzed (p
To assess the potential effect of DAC on modulating the expression of key genes, we employed Methylation-Specific PCR (MSP) to examine the epigenetic status of selected up-regulated genes, that are commonly epigenetically silenced in tumors. As shown in Fig. 4, changes in DNA methylation patterns in CpG-rich regions of promoters were observed for the CASP8 and BIK genes. For both genes, the promoter methylation levels (M) in untreated samples (CTRL) shifted to unmethylated patterns (U) following DAC treatment. Interestingly, for BIK, two bands of similar intensity appeared in the control sample: one corresponding to the methylated pattern and the other to the unmethylated one, indicating the possibility of allele-specific methylation, a common occurrence in tumors. In contrast, the CpG islands of FAS, TP73, DAP3, and RRAD gene promoters appeared unmethylated in both control and DAC-treated cells. Overall, these results suggest that DAC modulates gene expression in WERI-Rb-1 cells through a dual mechanism: direct, locus-specific changes in CpG islands methylation, as seen for CASP8 and BIK, and an indirect or nonspecific effect leading to the activation of downstream effectors, without altering cytosines methylation, as previously suggested in the literature [29].
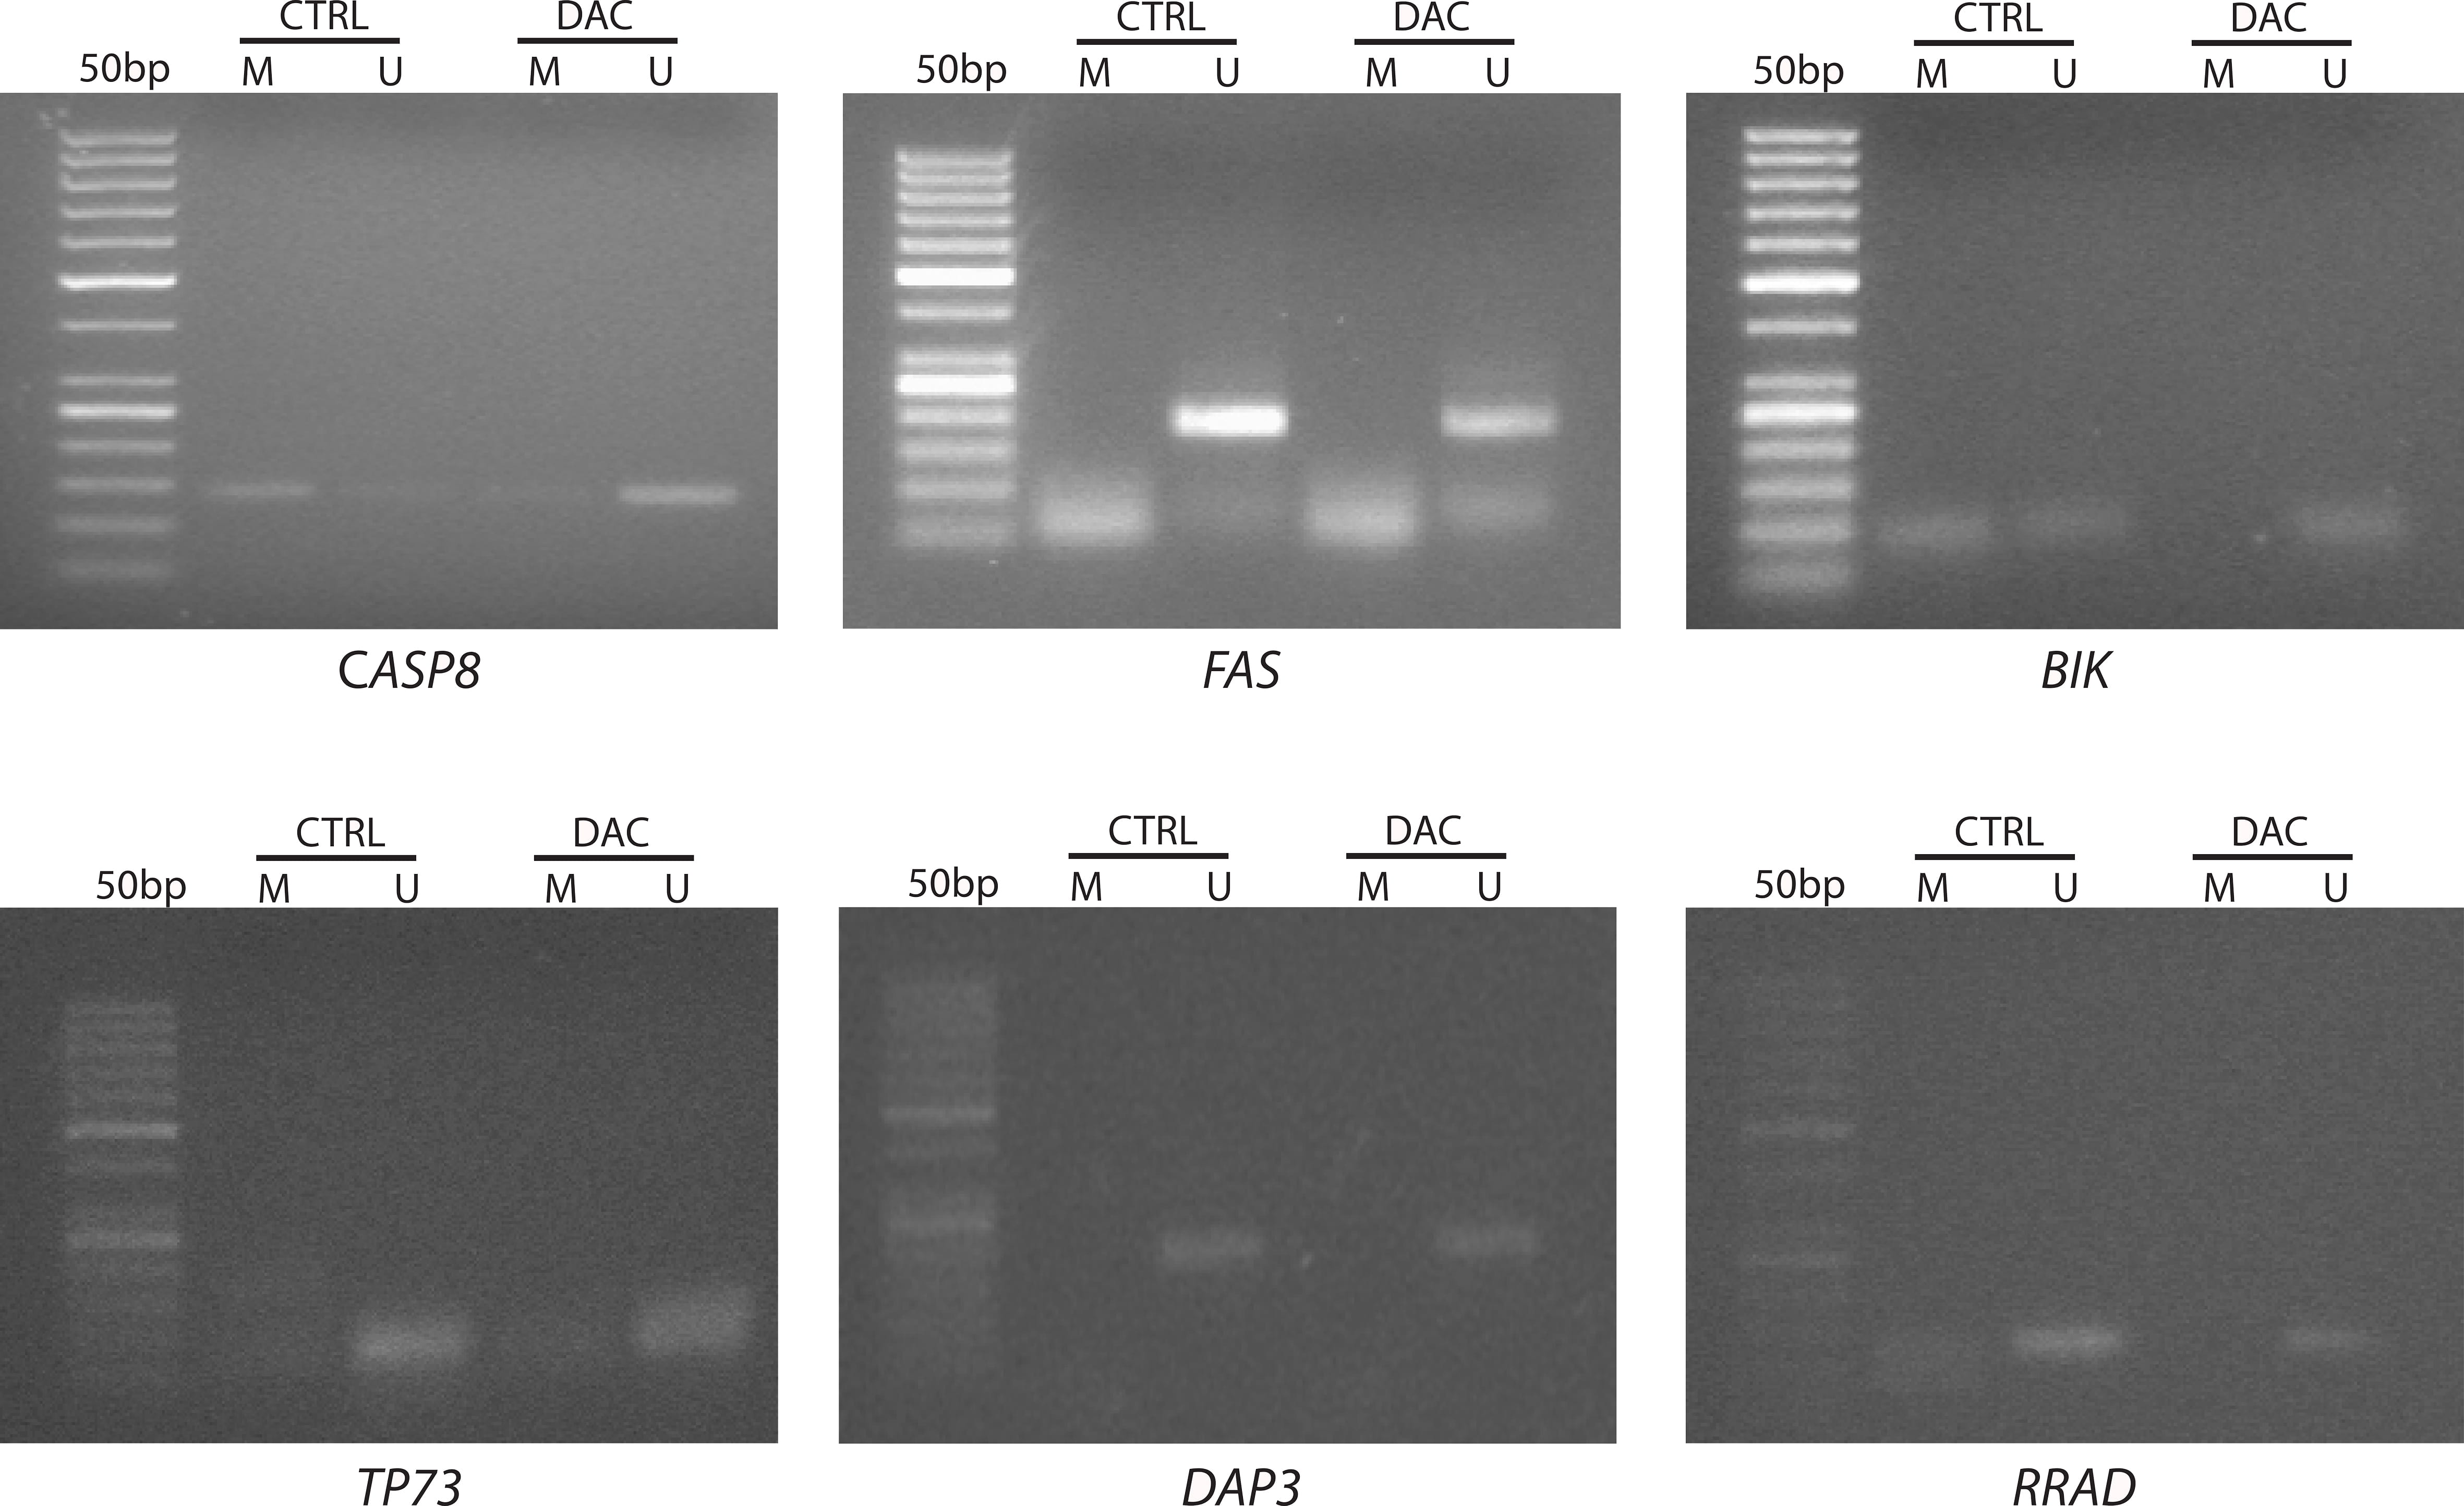 Fig. 4.
Agarose gels displaying the promoter’s methylation status of selected genes in WERI-Rb-1 samples. Representative Methylation-Specific PCR images show amplified products in untreated (CTRL) and DAC-treated (DAC) samples using specific primer pairs for methylated (M) and unmethylated (U) DNA. The gel images show the presence of a methylated band for CASP8 and BIK genes in untreated WERI-Rb-1 cells (CTRL), indicating promoters’ methylation in this retinoblastoma cell line.
To better mirror the pathology and clinical therapeutic response, we first
evaluated the biological anticancer performance of DAC in vivo, using a
xenograft mouse model (Fig. 5). DAC was administered systemically (i.v.) to
WERI-Rb-1 xenografted immunosuppressed mice twice a week for 3 weeks. At the end
of the treatment, a significant reduction in the tumor volume was measured in
treated (155.90
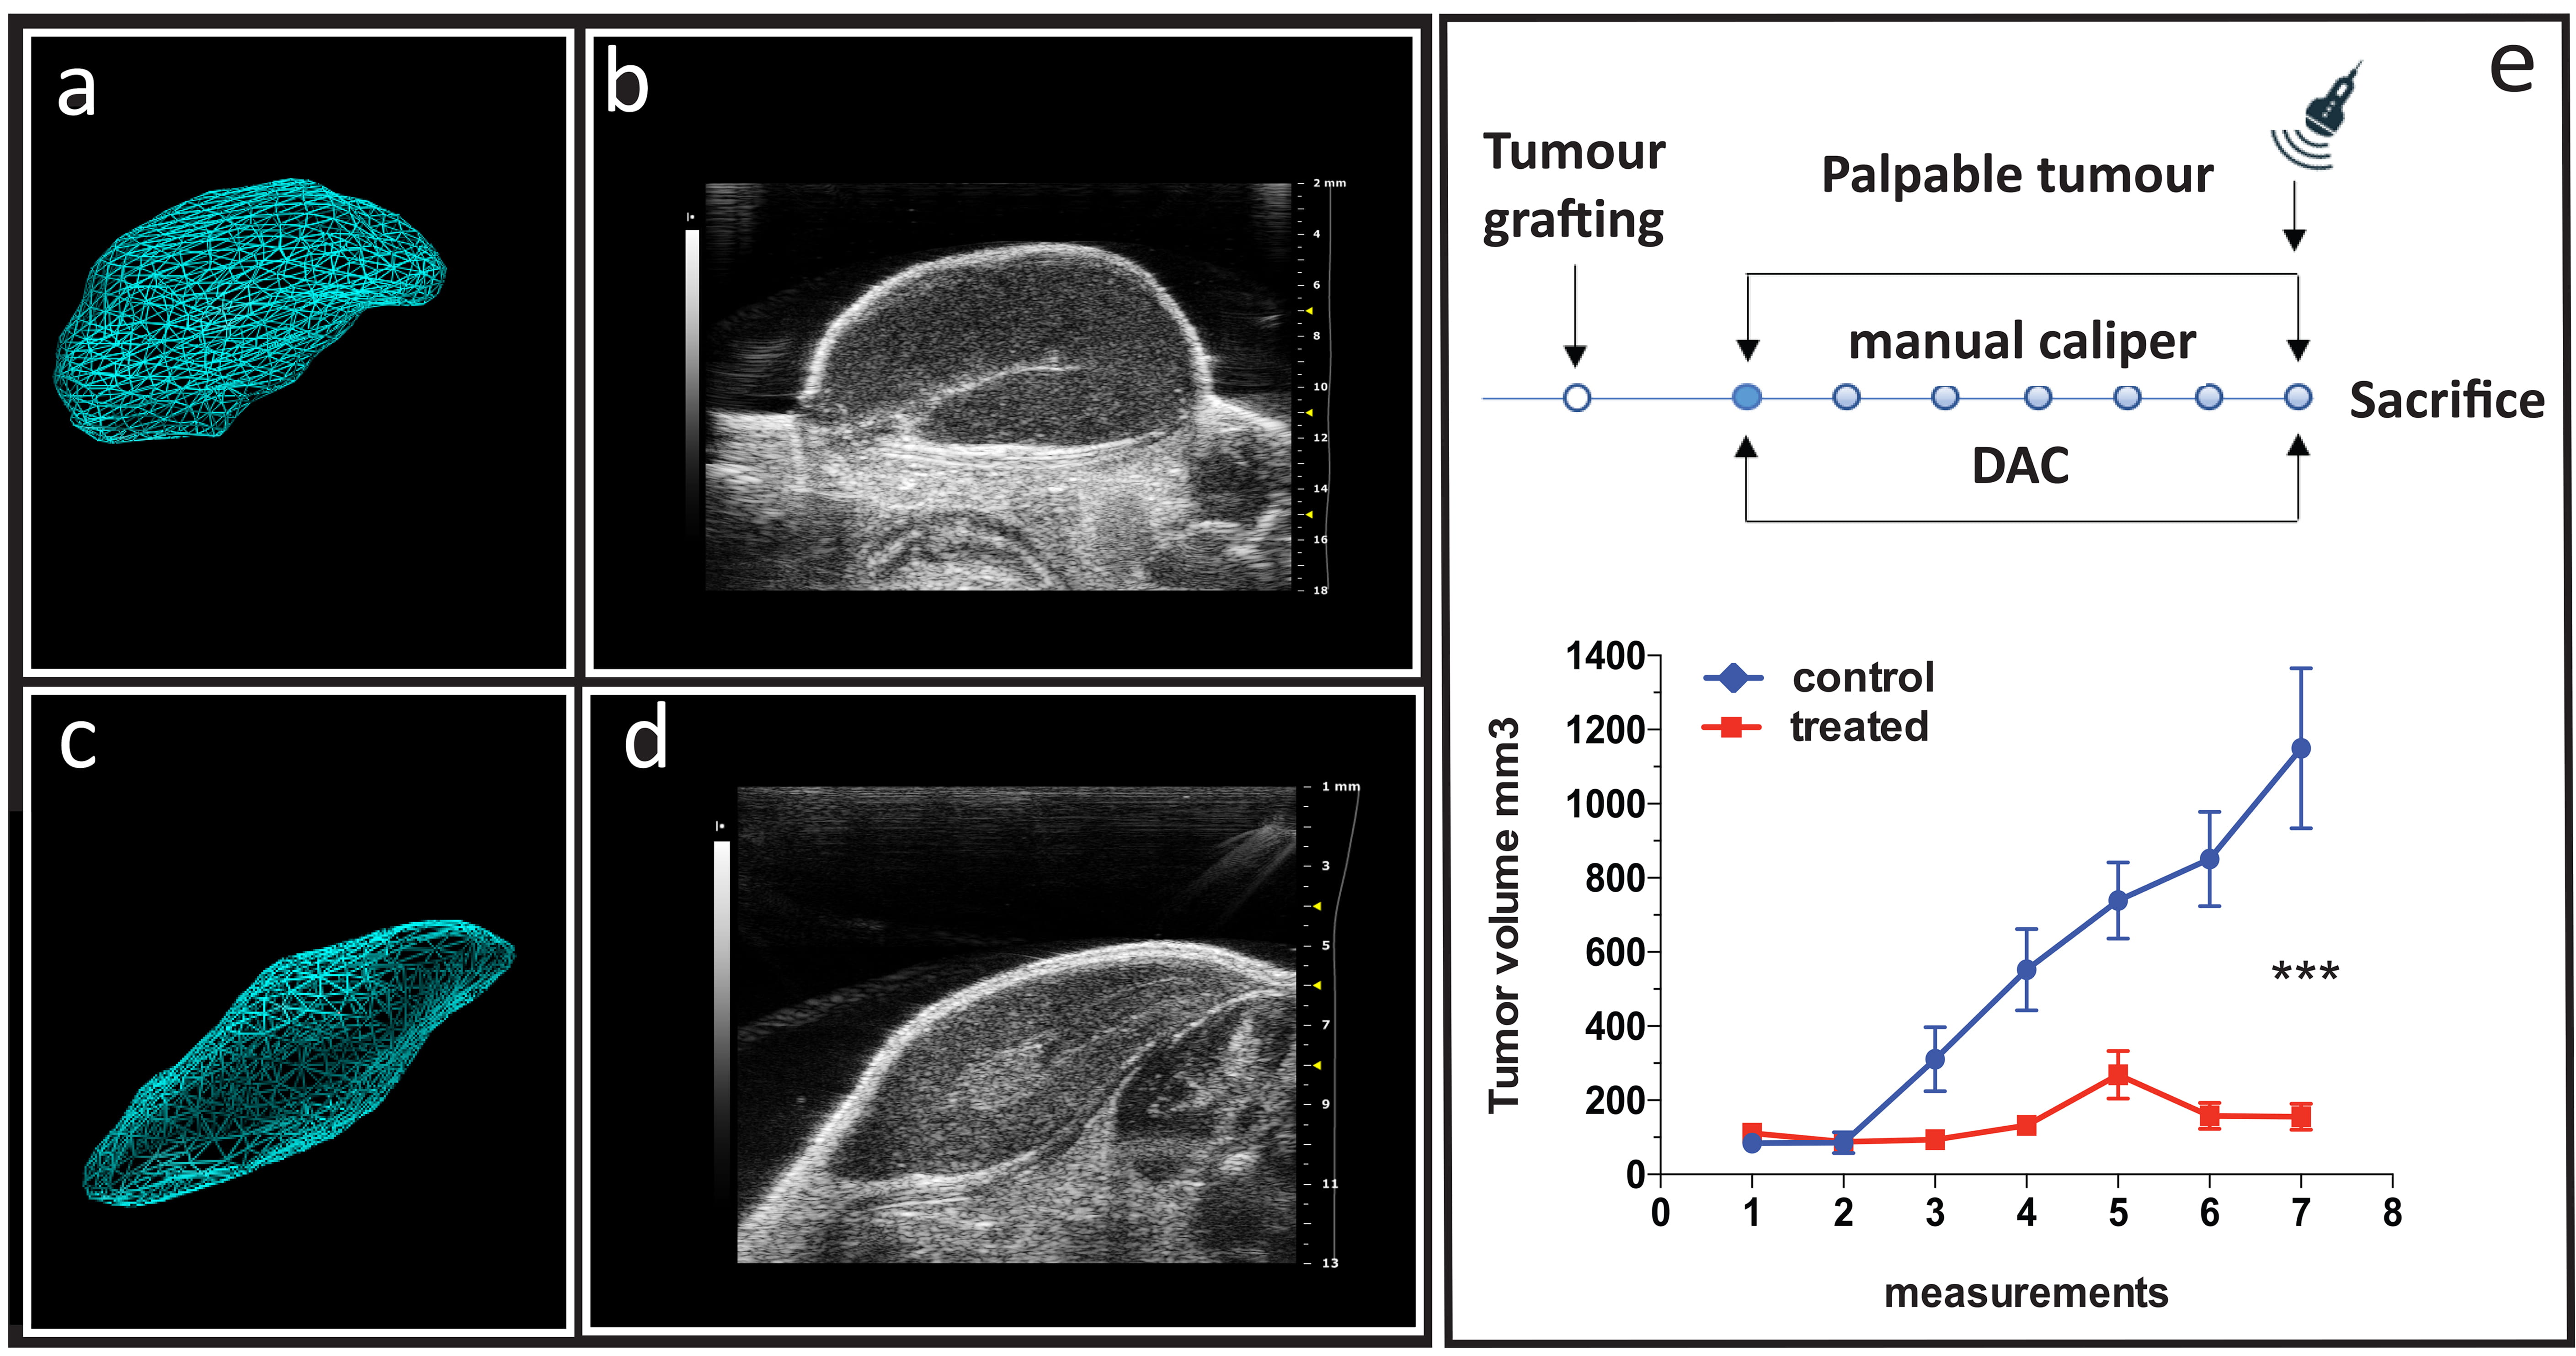 Fig. 5.
The effect of DAC treatment on cancer growth in WERI-Rb-1
xenografts. (a) Representative images of echo-graphic acquisition and (b) 3D
reconstruction images of control xenograft tumors (n = 7). (c) Representative
images of echo-graphic acquisition and (d) 3D reconstruction images of treated
xenograft tumors (n = 7). Images were collected during the last in vivo
confirmatory session of echo-graphic acquisition using the VEVO 2100 imaging
system (frame acquisition by length, 0.11 mm frame step for 3D reconstruction
measurement). (e) Top panel: experimental protocol sketch with dots representing
sections of manual caliper measurements and DAC treatment injections; bottom
panel: tumor growth curve in control (blue line) and treated (red line)
experimental groups. Volumes (mm3) were collected bi-weekly by manual
caliper throughout the experiment and expressed as mean values
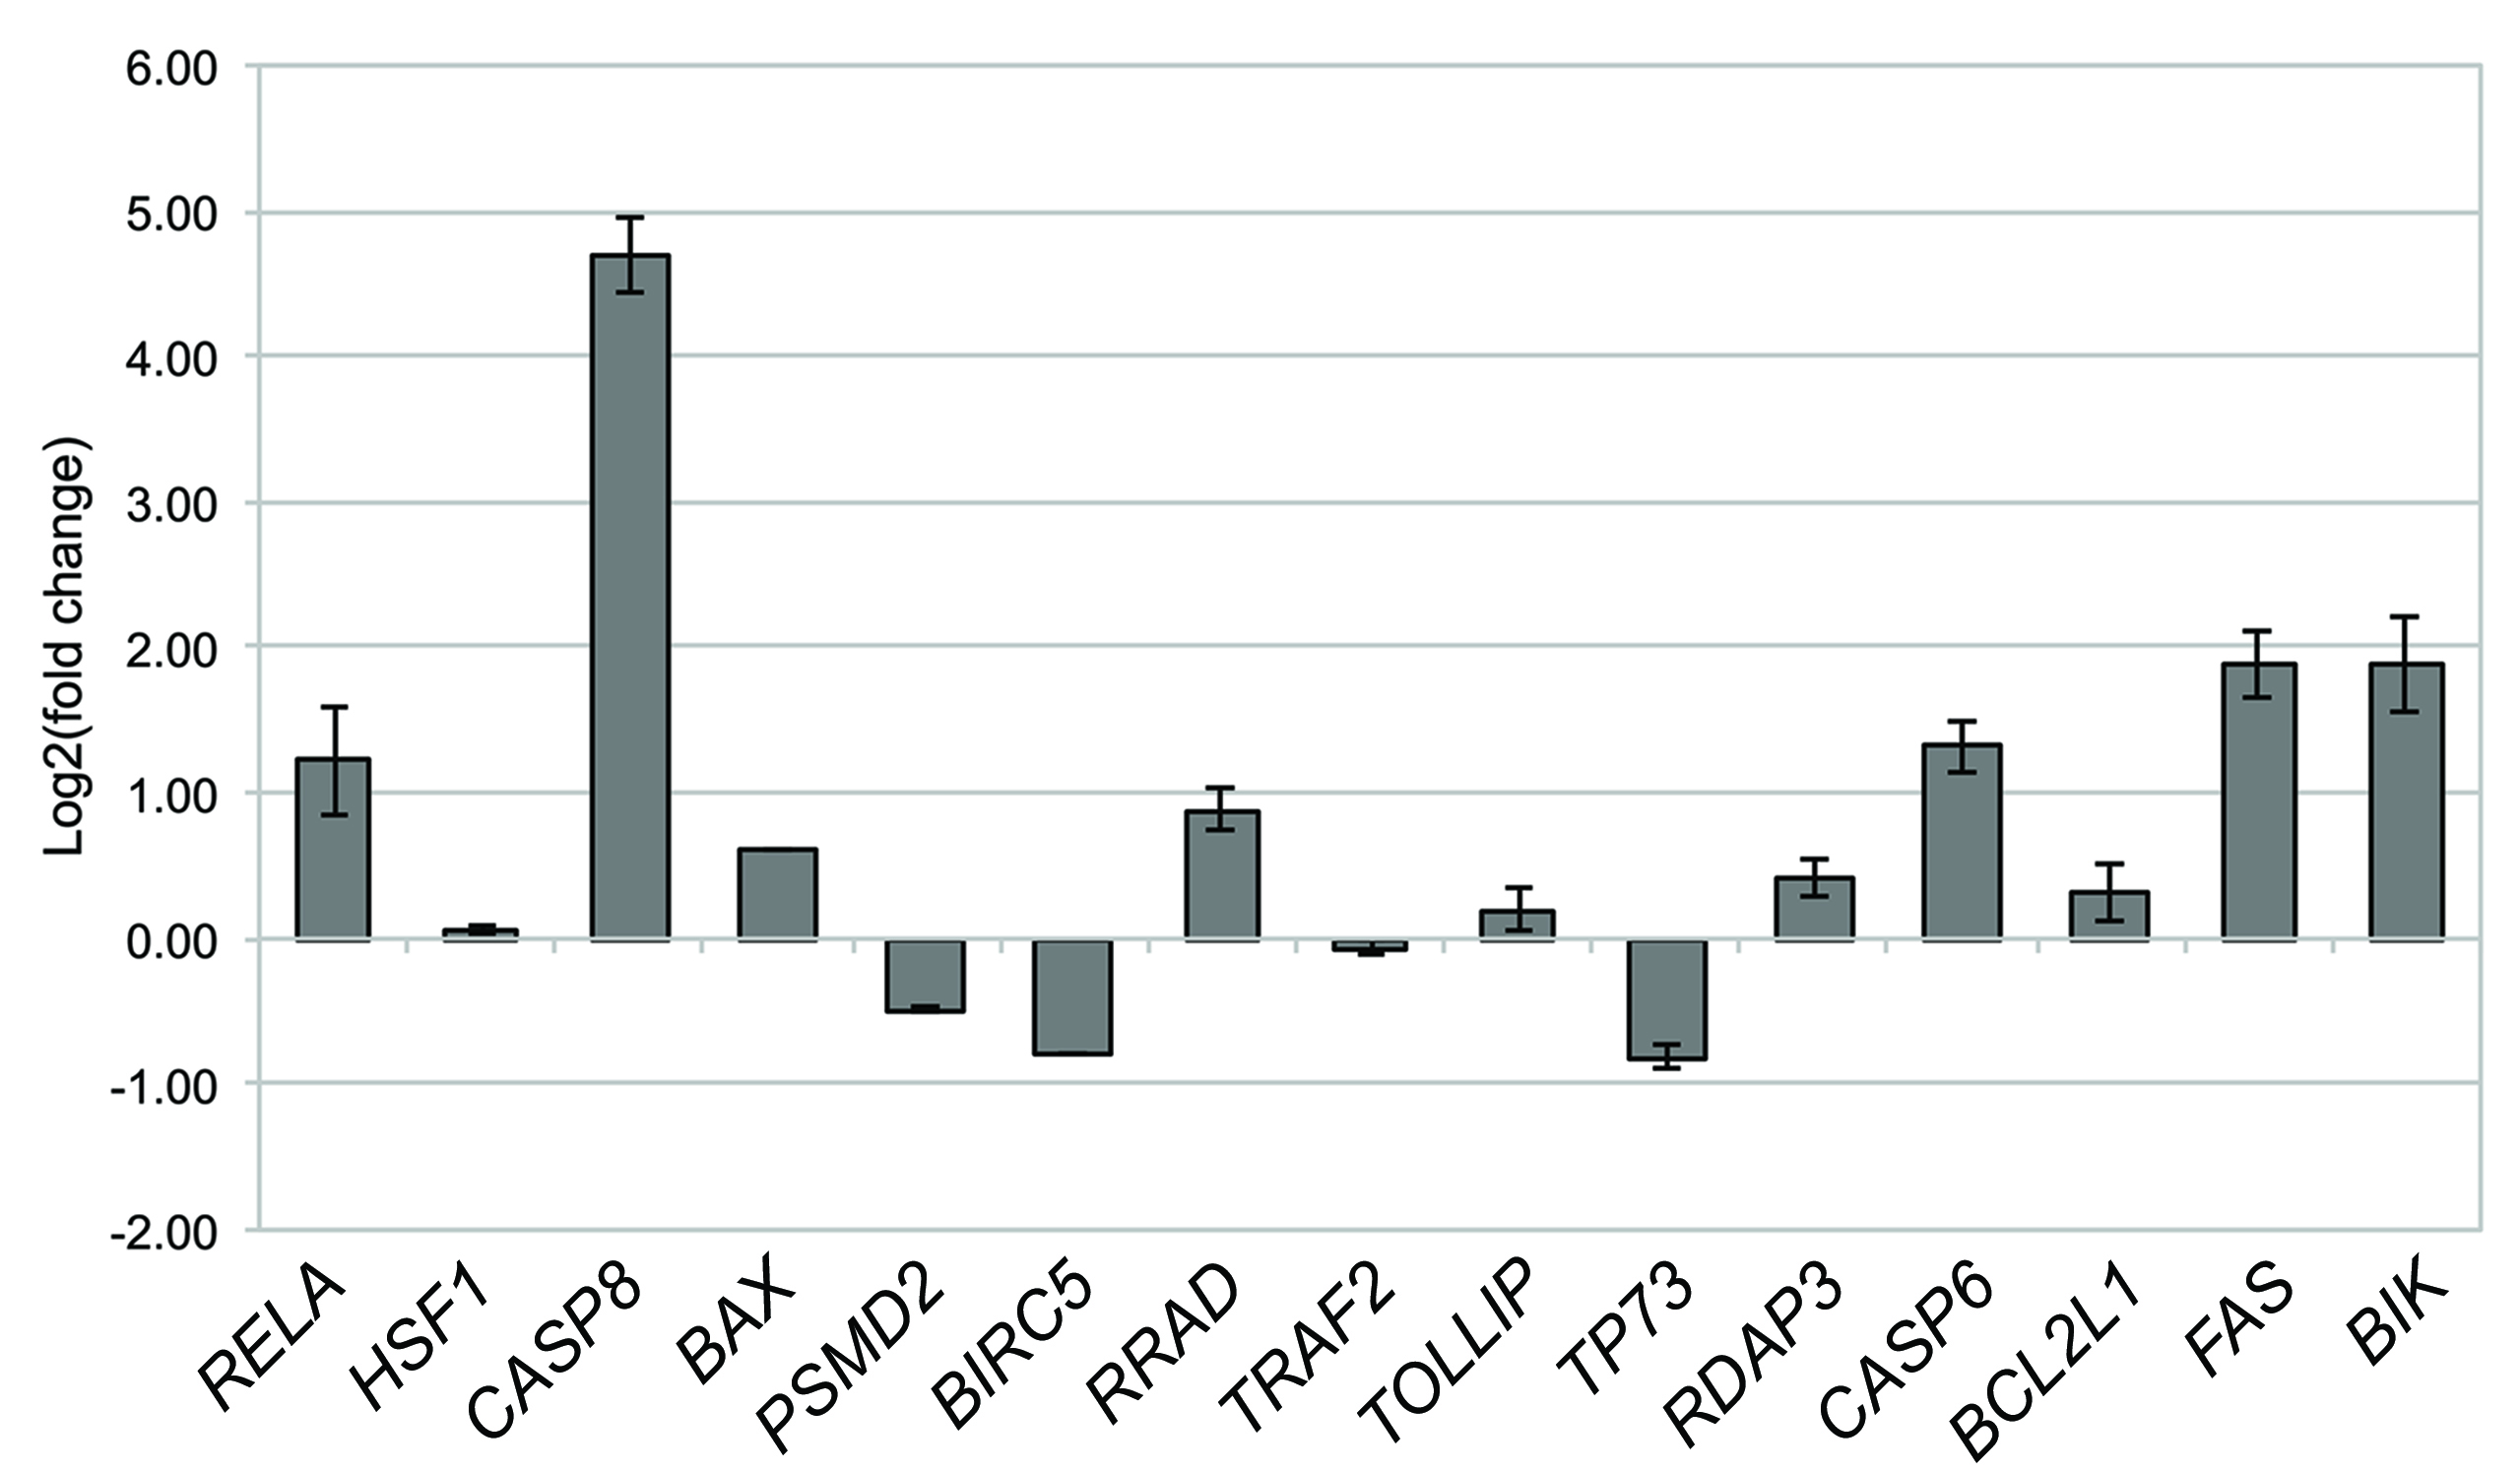 Fig. 6.
Gene expression analysis by qPCR of tumor xenografts. The
histogram shows the relative expression of target genes in DAC-treated tumor
xenograft samples, referred to the control untreated samples. Data were analyzed
using the comparative cycle threshold method (
To better recapitulate the features of retinoblastoma tumors, and mimic the
native tumor microenvironment, including stromal cell components and local
nutrient supply [35], a mono-ocular orthotopic retinoblastoma model was created.
The contralateral, non-implanted eyes served as internal controls to rule out
systemic treatment effects (Fig. 7a). Echo-graphic 3D reconstruction imaging of
the tumor mass inside the ocular bulb in control (Fig. 7b,c) and treated eyes
(Fig. 7d,e) allowed for the longitudinal tumor growth analysis over the three
weeks treatment period. We observed reduced tumor growth of intra eye tumor in
treated animals (1.16
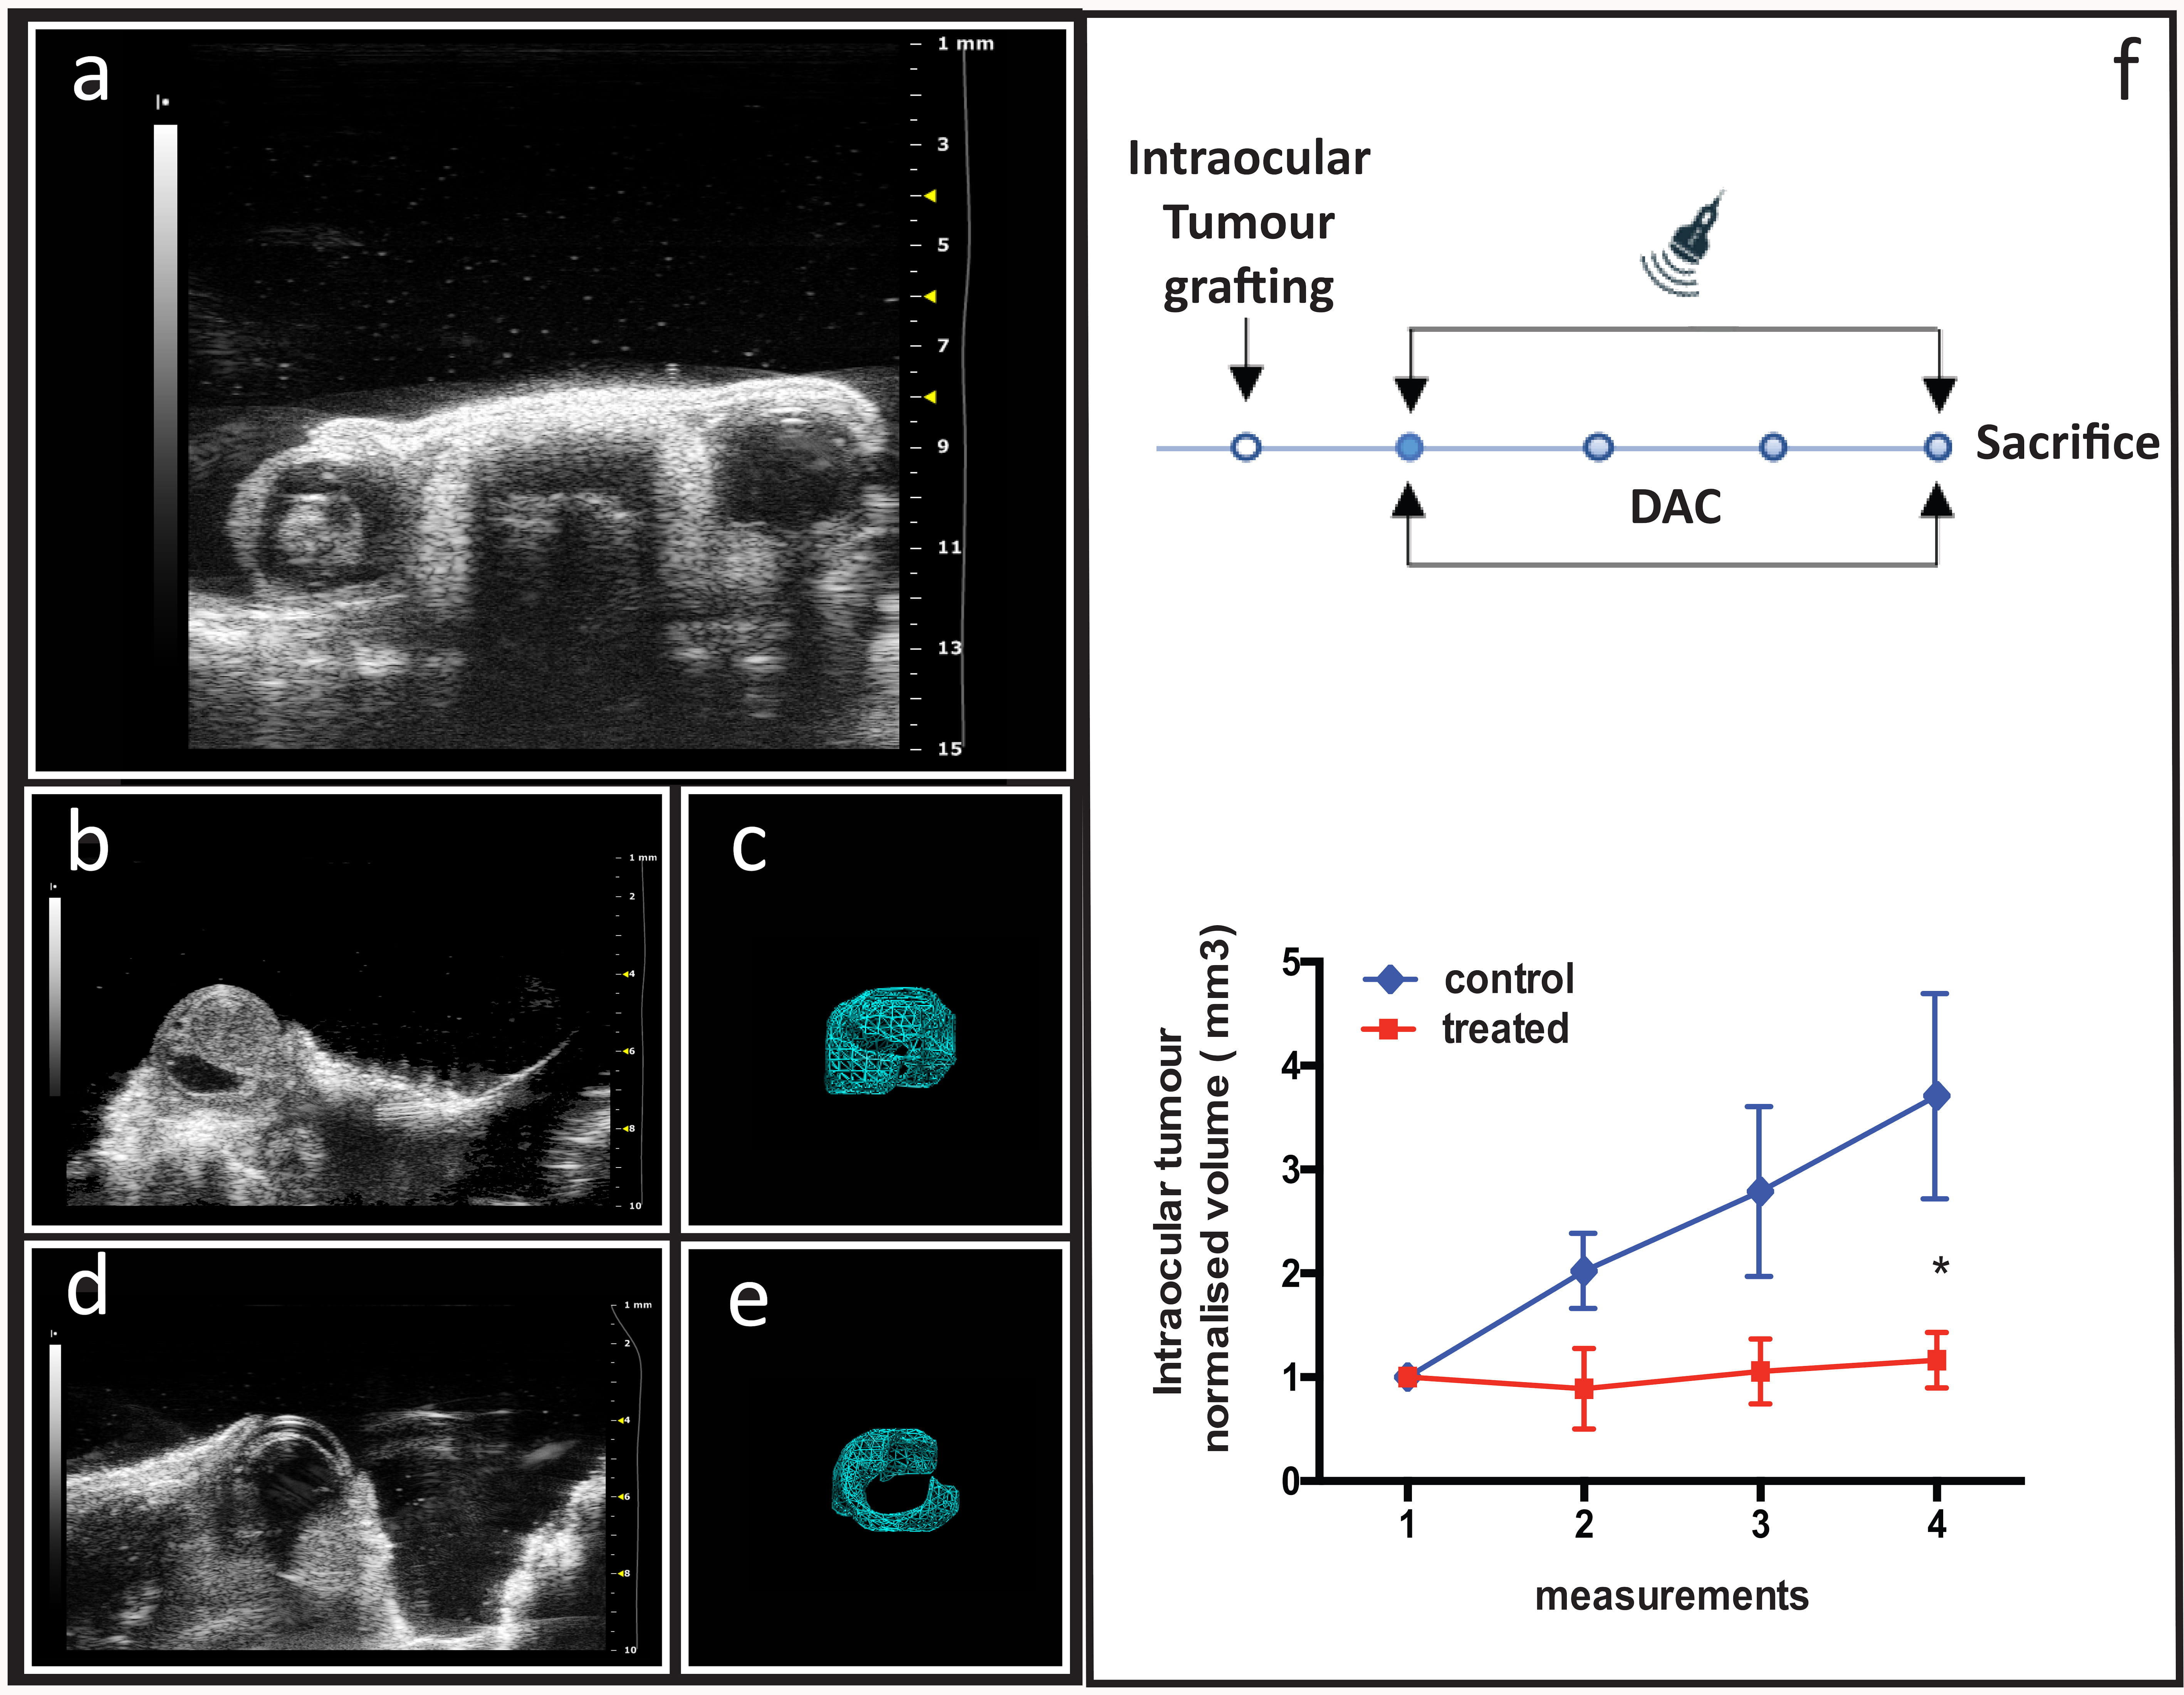 Fig. 7.
The effect of systemic DAC treatment on the growth of
intraocular retinoblastoma in an orthotopic mouse model. (a) Ocular district of
a mono-laterally established model where retinoblastoma tumor mass is growing in
the left eye while the right eye is not affected. (b) Representative images of
affected eye in control (saline injected) animals (n = 3) and (c) its relative
off-line 3D reconstruction used for volume measurement. (d) Representative images
of affected eye in treated animals (n = 3) and (e) its relative off-line 3D
reconstruction used for volume measurement. (f) Top panel: experimental protocol
sketch with dots representing the weekly sections of echo-graphic measurements;
bottom panel: tumor growth curve in control (blue line) and treated (red line)
experimental groups. Normalized volume values are expressed as mean
The study on the genomic and molecular landscape underlying eye cancer development remains a hot topic in the fight against childhood tumors [36, 37, 38]. Growing evidence indicates that retinoblastoma arises from epigenetic changes and genetic mutations [3, 39] and that reprogramming strategies aimed at restoring the expression of epigenetically silenced genes could serve as promising anti-tumor therapies [14, 38, 40, 41, 42]. In this regard, there is some evidence that decitabine may have a role in the treatment of Retinoblastoma [10, 18]; however, this is the first study correlating DAC treatment effect with the epigenetic restoration of gene expression. Indeed, our in vivo preclinical data strongly support this hypothesis. It is known that epigenetic-modifying drugs can alter gene expression by directly or indirectly targeting the epigenetic editors [29]. It has been shown that decitabine operates through a dual mechanism of action. Its incorporation into newly synthesized DNA leads to covalent trapping of the DNA methyltransferase I enzyme and subsequent depletion of cytosine methylation. However, DAC can also induce a rapid and substantial remodeling of the heterochromatic domains of gene loci enhancing histone acetylation and H3-K4 methylation at unmethylated promoters of oncogenes independently of its effects on cytosine methylation [43]. DAC has previously been used to investigate the impact of promoter hypermethylation effects on human eye development [44]. Here we present a coherent picture in which this demethylating agent modulates the expression of many pro-apoptotic and pro-survival genes together with genes involved in DNA damage and repair signaling by rewriting epigenetic marks in retinoblastoma cells. Furthermore, we demonstrated that the most significant DAC-driven genes may serve as predictive candidate markers for primary retinoblastoma tumors, with 15 key genes acting as hubs or driver genes, conferring a selective advantage to cancer cells.
Notwithstanding the limitations of the preclinical modeling of the flank xenograft, which we emended by using the orthotopic eye tumors, our results show, for the first time, that systemic DAC administration leads to significant tumor growth reduction. Furthermore, our gene expression and methylation analyses indicate that this effect is largely due to the reactivation of pro-apoptotic CASP8 and BIK genes. This re-expression is believed to be the consequence of the direct action of DAC on their promoters’ methylation. Conversely for other genes, where no changes in the methylation status of cytosines were observed, an indirect regulatory mechanism of DAC is hypothesized, likely through the alteration of multiple targets in heterochromatin domains such as reversing the silenced histone code at least in the promoter region [43, 44, 45, 46]. This could be the case of FAS, a pro-apoptotic gene that closely interacts with CASP8, and which was found to be overexpressed both in vitro and in vivo after DAC treatment. Similarly, an indirect regulation can be hypothesized for BIRC5, a pro-survival gene found overexpressed in primary tumors but downregulated both in vitro and in vivo by DAC treatment.
Ultimately, DAC treatment also restored the expression of tissue-specific genes related to photoreceptor function and hemato-retinal barrier development [19, 33], further highlighting its potential in treating retina dysfunctions.
Computational analysis of the gene expression profiles after DAC treatment has provided a list of co-regulated gene clusters that may represent potential fingerprints of retinoblastoma phenotype, as well as markers of DAC treatment. In fact, most of these genes have been found as differentially expressed in clusters obtained by the comparative analysis of publicly available datasets of patient-derived tumor samples vs normal retina [19, 23, 24] validating the hypothesis that they may represent markers/candidate drivers of retinoblastoma genesis and progression. Furthermore, the network maps of DEGs highlighted 15 highly interconnected genes that share a high number of pathways and play a pivotal role in regulating numerous proteins/factors. The DAC-induced co-regulated expression of these 15 hubs/driver genes does not seem to be influenced in vivo by the complex interplay known to exist between tumor cell-intrinsic, cell-extrinsic, and systemic mediators [47, 48, 49, 50]. This evidence suggests that unlike other hypermethylated genes associated with protein signal transduction and external stimulus perception [44], the intracellular reprogramming dynamics of these genes by DAC may be independent from the influence of the tumor microenvironment. In fact, in both subcutaneous and orthotopic xenograft models, our preliminary preclinical data demonstrate a substantial growth arrest in response to DAC treatment. These observations thus lay the foundations for a rational development of effective epigenetic anti-cancer treatments for patients with retinoblastoma.
We have described the effects of DAC on the modulation of gene expression encompassing many pro-apoptotic and pro-survival genes, along with genes involved in DNA damage and repair signaling, as well as tissue-specific genes associated with visual signaling in retinoblastoma cells, through rewriting epigenetic marks. Most of the key genes found to be upregulated or downregulated in WERI-Rb-1 cells following DAC treatment exhibit an inverse correlation in expression levels with those identified in primary tumors, highlighting the relevance of the DAC-driven genes as potential actionable markers for primary retinoblastoma tumors. Consistently, DAC induces a significant reduction of tumor growth in in vivo retinoblastoma models suggesting that the epigenetic alterations are the essential players in cancer progression and that DAC-driven genes could represent novel key targets of an epigenetic therapy in primary retinoblastoma tumors.
The paper is listed as, “Epigenetic Reprogramming by Decitabine in Retinoblastoma” as a preprint on (Preprints.org) at: https://www.preprints.org/manuscript/202404.1746/v1.
The datasets used and/or analyzed during the current study are available from the corresponding authors on reasonable request.
CC and LG designed the research study. LG, AS, MT, performed the research. LG provided advice on the in vivo experiments; MT provided advice of in vitro and molecular biology experiments. AS took care of the bioinformatic analysis. CC designed the study and finalised the production of the manuscript. All authors contributed to editorial changes in the manuscript. All authors read and approved the final manuscript. All authors have participated sufficiently in the work and agreed to be accountable for all aspects of the work.
All the experiment involving animals were carried out in accordance with EU Directive 2010/63/EU and Italian Ministry of Heath rules and Ethics Committees of the Toscana Life Sciences and the Istituto Superiore di Sanità (ISS) on behalf of Italian Minister of Health (Permit Number: # CNR-030314 and # CNR-101013).
We would like to express our gratitude to Dr. Ilaria Naldi and all those who helped us during the writing of this manuscript.
This research received no external funding.
The authors declare no conflict of interest.
Supplementary material associated with this article can be found, in the online version, at https://doi.org/10.31083/FBL33386.
References
Publisher’s Note: IMR Press stays neutral with regard to jurisdictional claims in published maps and institutional affiliations.