


 , Xiaoyu Zhang 1,†, Jie Zhu 2, Zhuoya Yi 2, Huijiao Cao 1, Hailin Tang 1, Huan Zhang 1,*
 , Guoxian Huang 1,*
1 State Key Laboratory of Oncology in South China, Guangdong Provincial Clinical Research Center for Cancer, Sun Yat-Sen University Cancer Center, 510060 Guangzhou, Guangdong, China
2 Department of Radiology, The Third Affiliated Hospital, Sun Yat-Sen University, 510620 Guangzhou, Guangdong, China
†These authors contributed equally.
Abstract
The study sought to establish a radiogenomic signature to evaluate the transcriptional heterogeneity that reflects the prognosis and tumour-related biological functions of patients with glioblastoma.
Transcriptional subclones were identified via fully unsupervised deconvolution of RNA sequencing. A genomic prognostic risk score was developed from transcriptional subclone proportions in the development dataset (n = 532) and independently verified in the testing dataset (n = 225). Multimodal magnetic resonance imaging (MRI) analysis involved feature extraction from three distinct anatomical regions across four imaging sequences. Key features were selected to construct a radiogenomic signature predictive of the genomic risk score in the radiogenomic dataset (n = 99), with subsequent survival analysis conducted in the image testing dataset (n = 233).
A total of 8 transcriptional subclones were identified, of which the metabolic pathway subclone and spinocerebellar ataxia subclone were independent risk factors for overall survival. The genomic risk score effectively differentiated patient subgroups with divergent survival outcomes in both development (p < 0.001) and testing datasets (p = 0.0003). Nineteen radiomic features were selected to construct a radiogenomic signature, with these features being linked to hallmark cancer pathways and the malignant behaviours of cancer cells. The radiogenomic signature predicted overall survival in the image testing dataset (hazard ratios (HR) = 1.67, p = 0.011).
A prognostic radiogenomic signature was established and verified to characterize transcriptional subclones with underlying biological functions in glioblastoma.
Keywords
- radiogenomics
- intratumoral heterogeneity
- glioblastoma
- MRI
Glioblastoma (GBM), recognized as the most prevalent form of primary brain cancer, exhibits aggressive malignancy with a persistently dismal 5-year survival rate that has only risen from 4% to 7% across four decades of research [1]. The high malignancy of GBM is often linked to intratumoral heterogeneity (ITH), which provides a diverse environment that allows treatment-resistant clones [2]. ITH in GBM represents complex spatial and temporal variations and encompasses genetic ITH, histologic ITH, and macroscopic ITH. Vast spatial and temporal ITH prompts treatment failure and indicates a poor prognosis [3].
Genetic ITH describes the simultaneous presence of multiple distinct subclones within individual tumour foci. Distinct subclonal expansions are observed across cancer types, and the frequent interactions among subclones are fundamental to both driver mutations and tumour evolution [4]. Transcriptional heterogeneity can be characterized by a fully unsupervised deconvolution method that identifies distinct genomic subclones and their marker genes from bulk tumor samples [5], and transcriptional heterogeneity can predict prognosis in malignancies such as breast and colorectal cancer [6, 7]. However, gene expression profiles are limited due to the difficulty of gathering sufficient high-quality samples. Complementary noninvasive alternatives that correlate genetic information are therefore gaining focus.
The macroscopic alterations of GBM on magnetic resonance imaging (MRI) typically involve various heterogeneous subregions (i.e., edema, enhancing and non-enhancing tumour cores). Cellular alterations related to the tumor are not confined to the visible enhanced areas in GBM but also extend beyond the tumor margins into the surrounding brain tissue [8]. A link between transcriptional and macroscopic tumour heterogeneity through gene expression profiles and magnetic resonance (MR) images is likely. Radiogenomics, which examines the links between radiomic features and gene expression data [9], has been validated in studies for its ability to predict molecular subtypes [10], identify key signaling pathways [11], and determine prognostic radiomic phenotypes in GBM [12].
Therefore, our study aimed to identify the transcriptional heterogeneity associated with prognosis in GBM patients and to develop and verify a radiogenomic signature derived from multimodal MR data that could be used to stratify patients with different transcriptional subclones precisely.
This multicohort study utilized data from two sources: transcriptome data and MR images. The study was structured into three main stages (Fig. 1). Stage 1: Datasets with matched RNA sequencing and survival data formed a genomic development dataset (n = 532) and a genomic testing dataset (n = 225). Transcriptional subclones were identified, and relevant biological significance was explored from the genomic development dataset. Prognostic genomic risk scores were developed from the key subclones via Cox regression analysis. Stage 2: Subgroups with matched RNA sequencing and MR images in the genomic development dataset were extracted as the radiogenomic dataset (n = 99). By mapping radiomic features onto genetic risk scores, a radiogenomic signature was established to predict prognostic risk scores derived from transcriptional subclones. Stage 3: Datasets with matched MR images and survival data formed an independent image testing dataset (n = 233). Patients were classified using the trained radiogenomic signature to validate its prognostic performance. The details of the data sources are provided in the first part of the Supplementary Material.
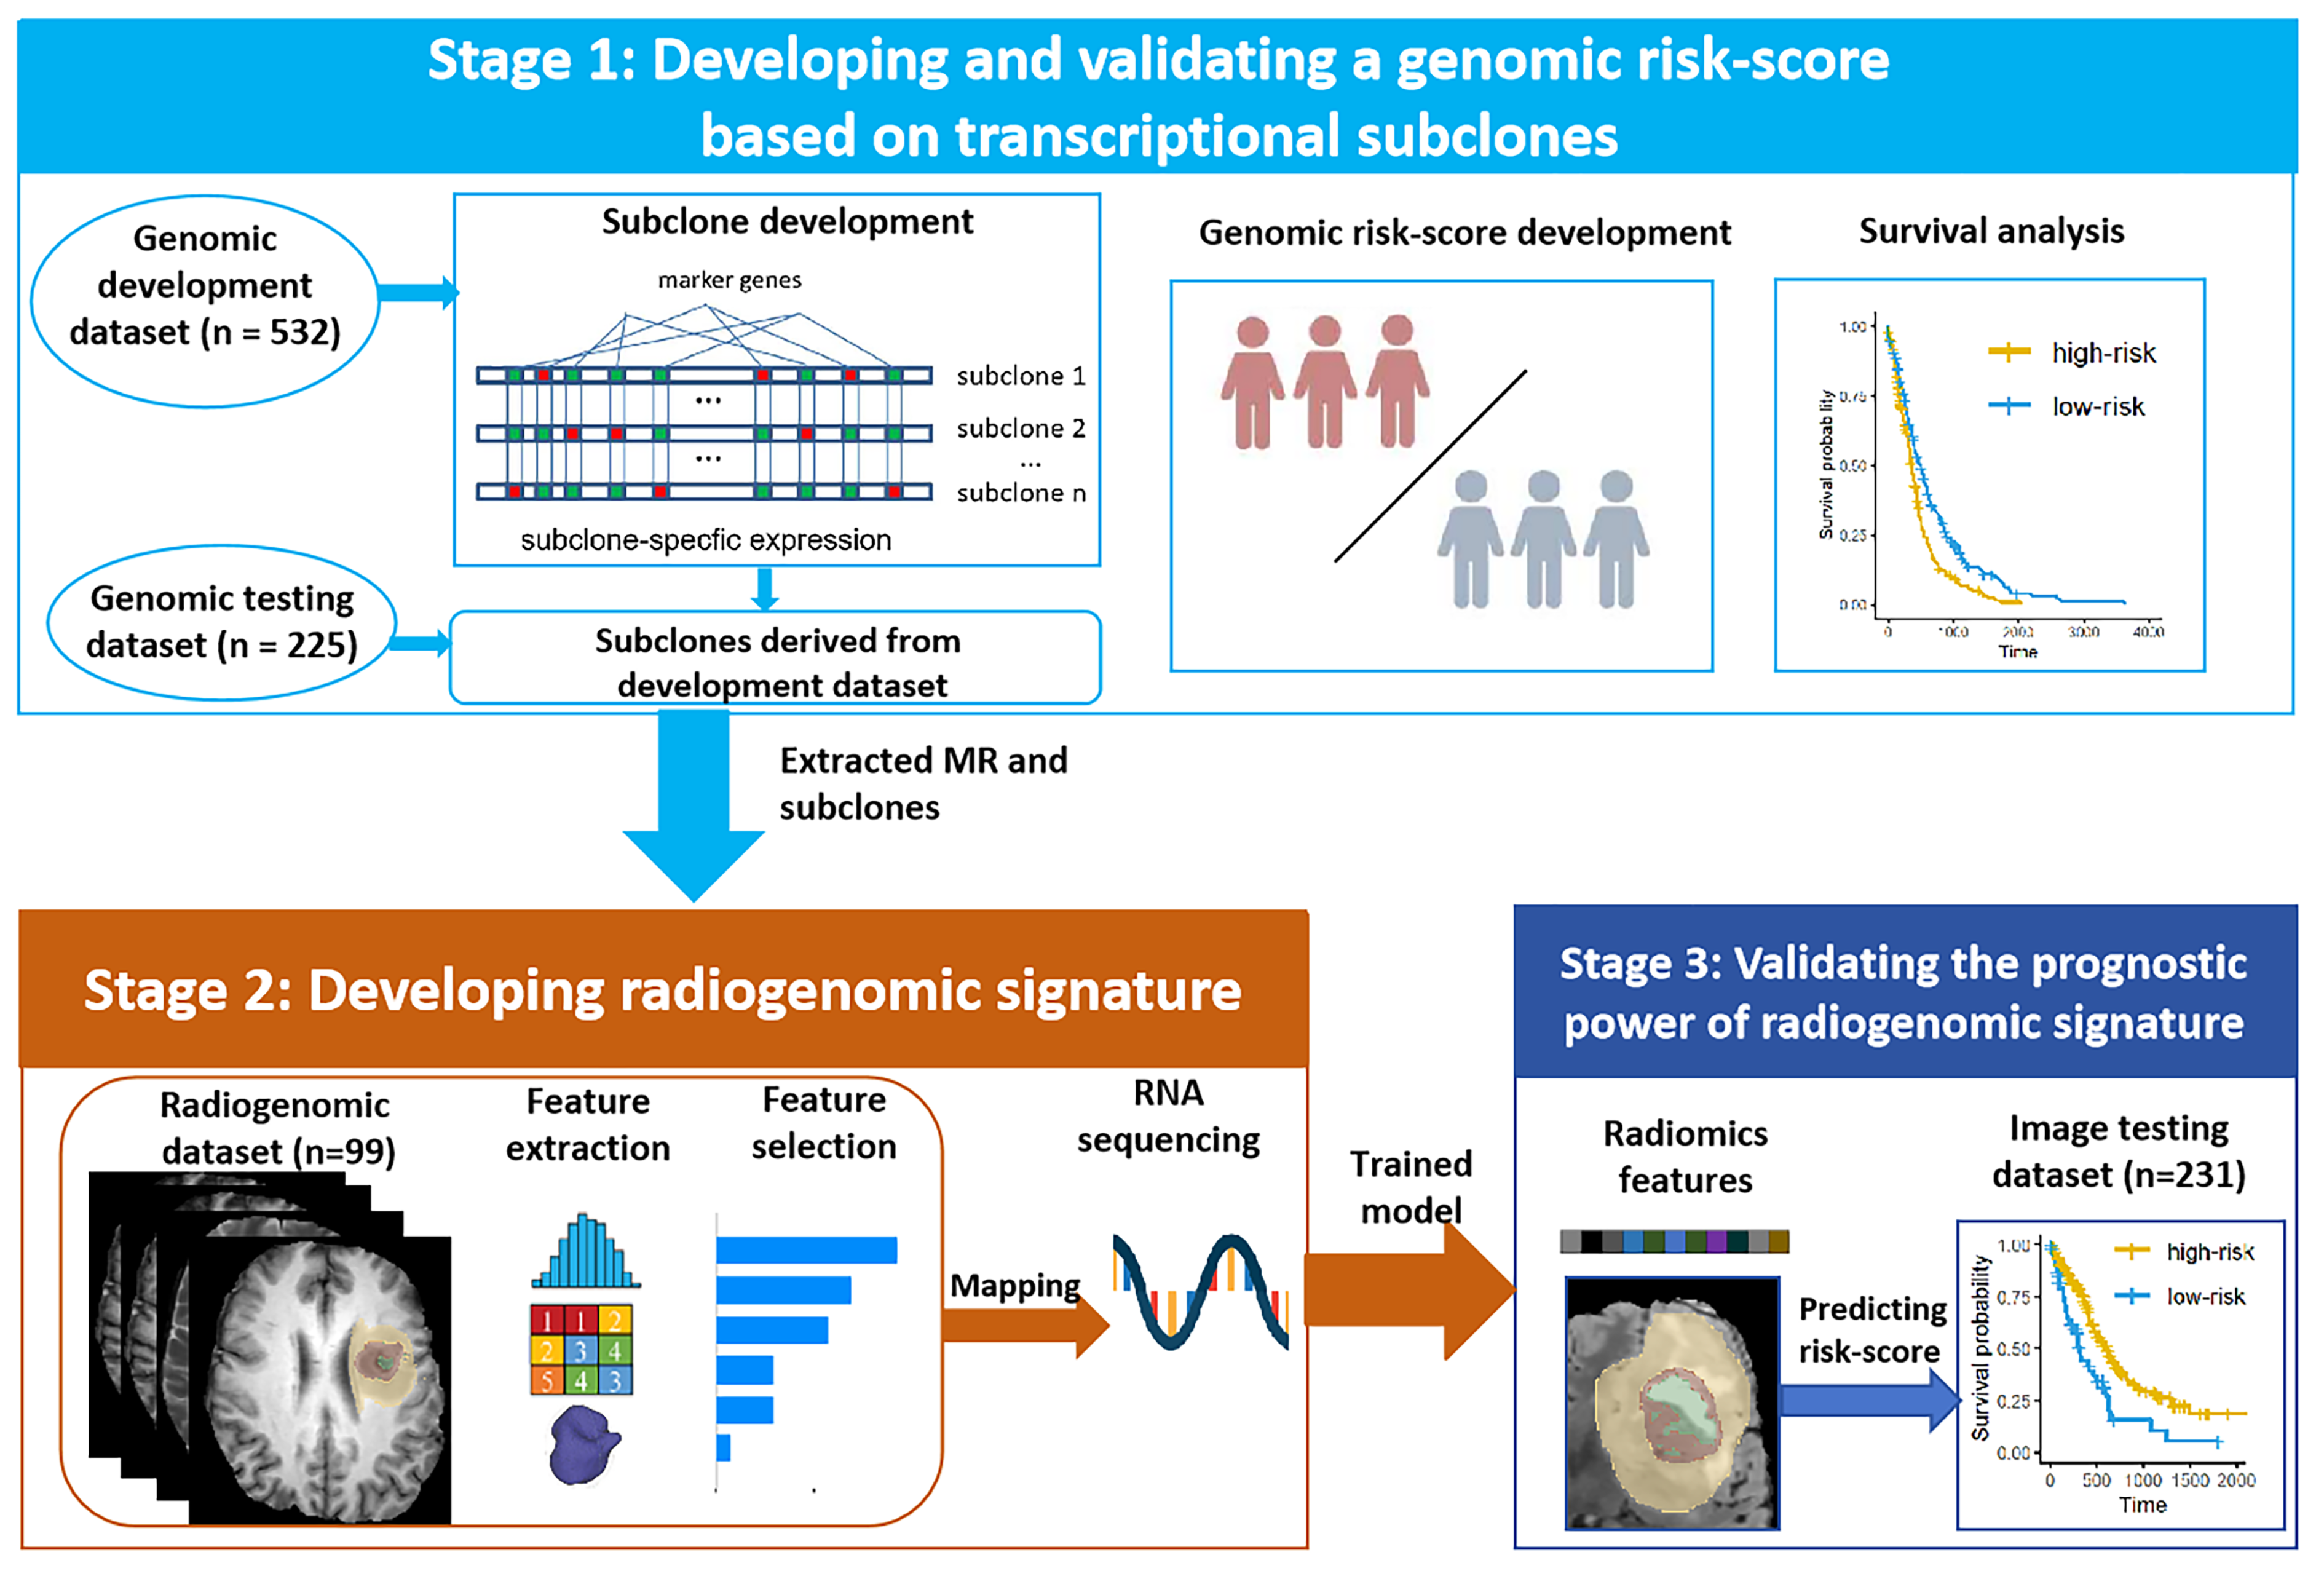 Fig. 1.
Overview of the study design. Stage 1: The genomic risk-scores for prognosis were developed and validated using transcriptional subclones in the genomic development and testing dataset. Stage 2: Radiogenomic signatures were created by linking radiomic features to genomic risk scores in radiogenomic dataset. Stage 3: The prognostic utility of the radiogenomic signature was confirmed in the image testing dataset.
The transcriptional subclones were identified via convex analysis of mixtures (CAM) and the minimum description length (MDL) criterion and the detailed process of CAM and MDL to identify subclones were explianed in the second part of the Supplementary Material [5, 13].
After transcriptional subclones and their fractions of the total subclones were obtained, Cox regression analyses were employed to identify risk factors associated with overall survival (OS) and to develop a prognostic genomic risk score.
MRI scans in the radiogenomic dataset include four modalities: T1-weighted precontrast (T1), T1-weighted postcontrast (T1ce), T2-weighted (T2), and fluid-attenuated inversion recovery (FLAIR) volumes. All the images were realigned to the LPS (left‒posterior‒superior) coordinate system, resampled to a voxel size of 1 mm3, and underwent skull stripping using the Cancer Imaging Phenomics Toolkit (Center for Biomedical Image Computing and Analytics, University of Pennsylvania, Philadelphia, PA, USA; https://www.cbica.upenn.edu/captk).
Three regions of interest (ROIs) were delineated, comprising (a) the enhancing part of the tumour core (ET), (b) the nonenhancing part of the tumour core (NET), and (c) the peritumoral edema (ED) (Fig. 2). The ET corresponds to areas where contrast agent leaks through the disrupted blood‒brain barrier. The NET includes non-enhancing tumor regions, as well as transitional and necrotic areas within the tumor. The ET and NET are identified by hyperintense and hypointense signals on T1ce compared with to T1, respectively, while the ED is identified by the hyperintense signal on T2 and FLAIR. These ROIs were delineated using semiautomatic tools from CaPTK (Center for Biomedical Image Computing and Analytics, University of Pennsylvania, Philadelphia, PA, USA; https://www.cbica.upenn.edu/captk) by a radiologist (Zhang XQ) with five years of experience.
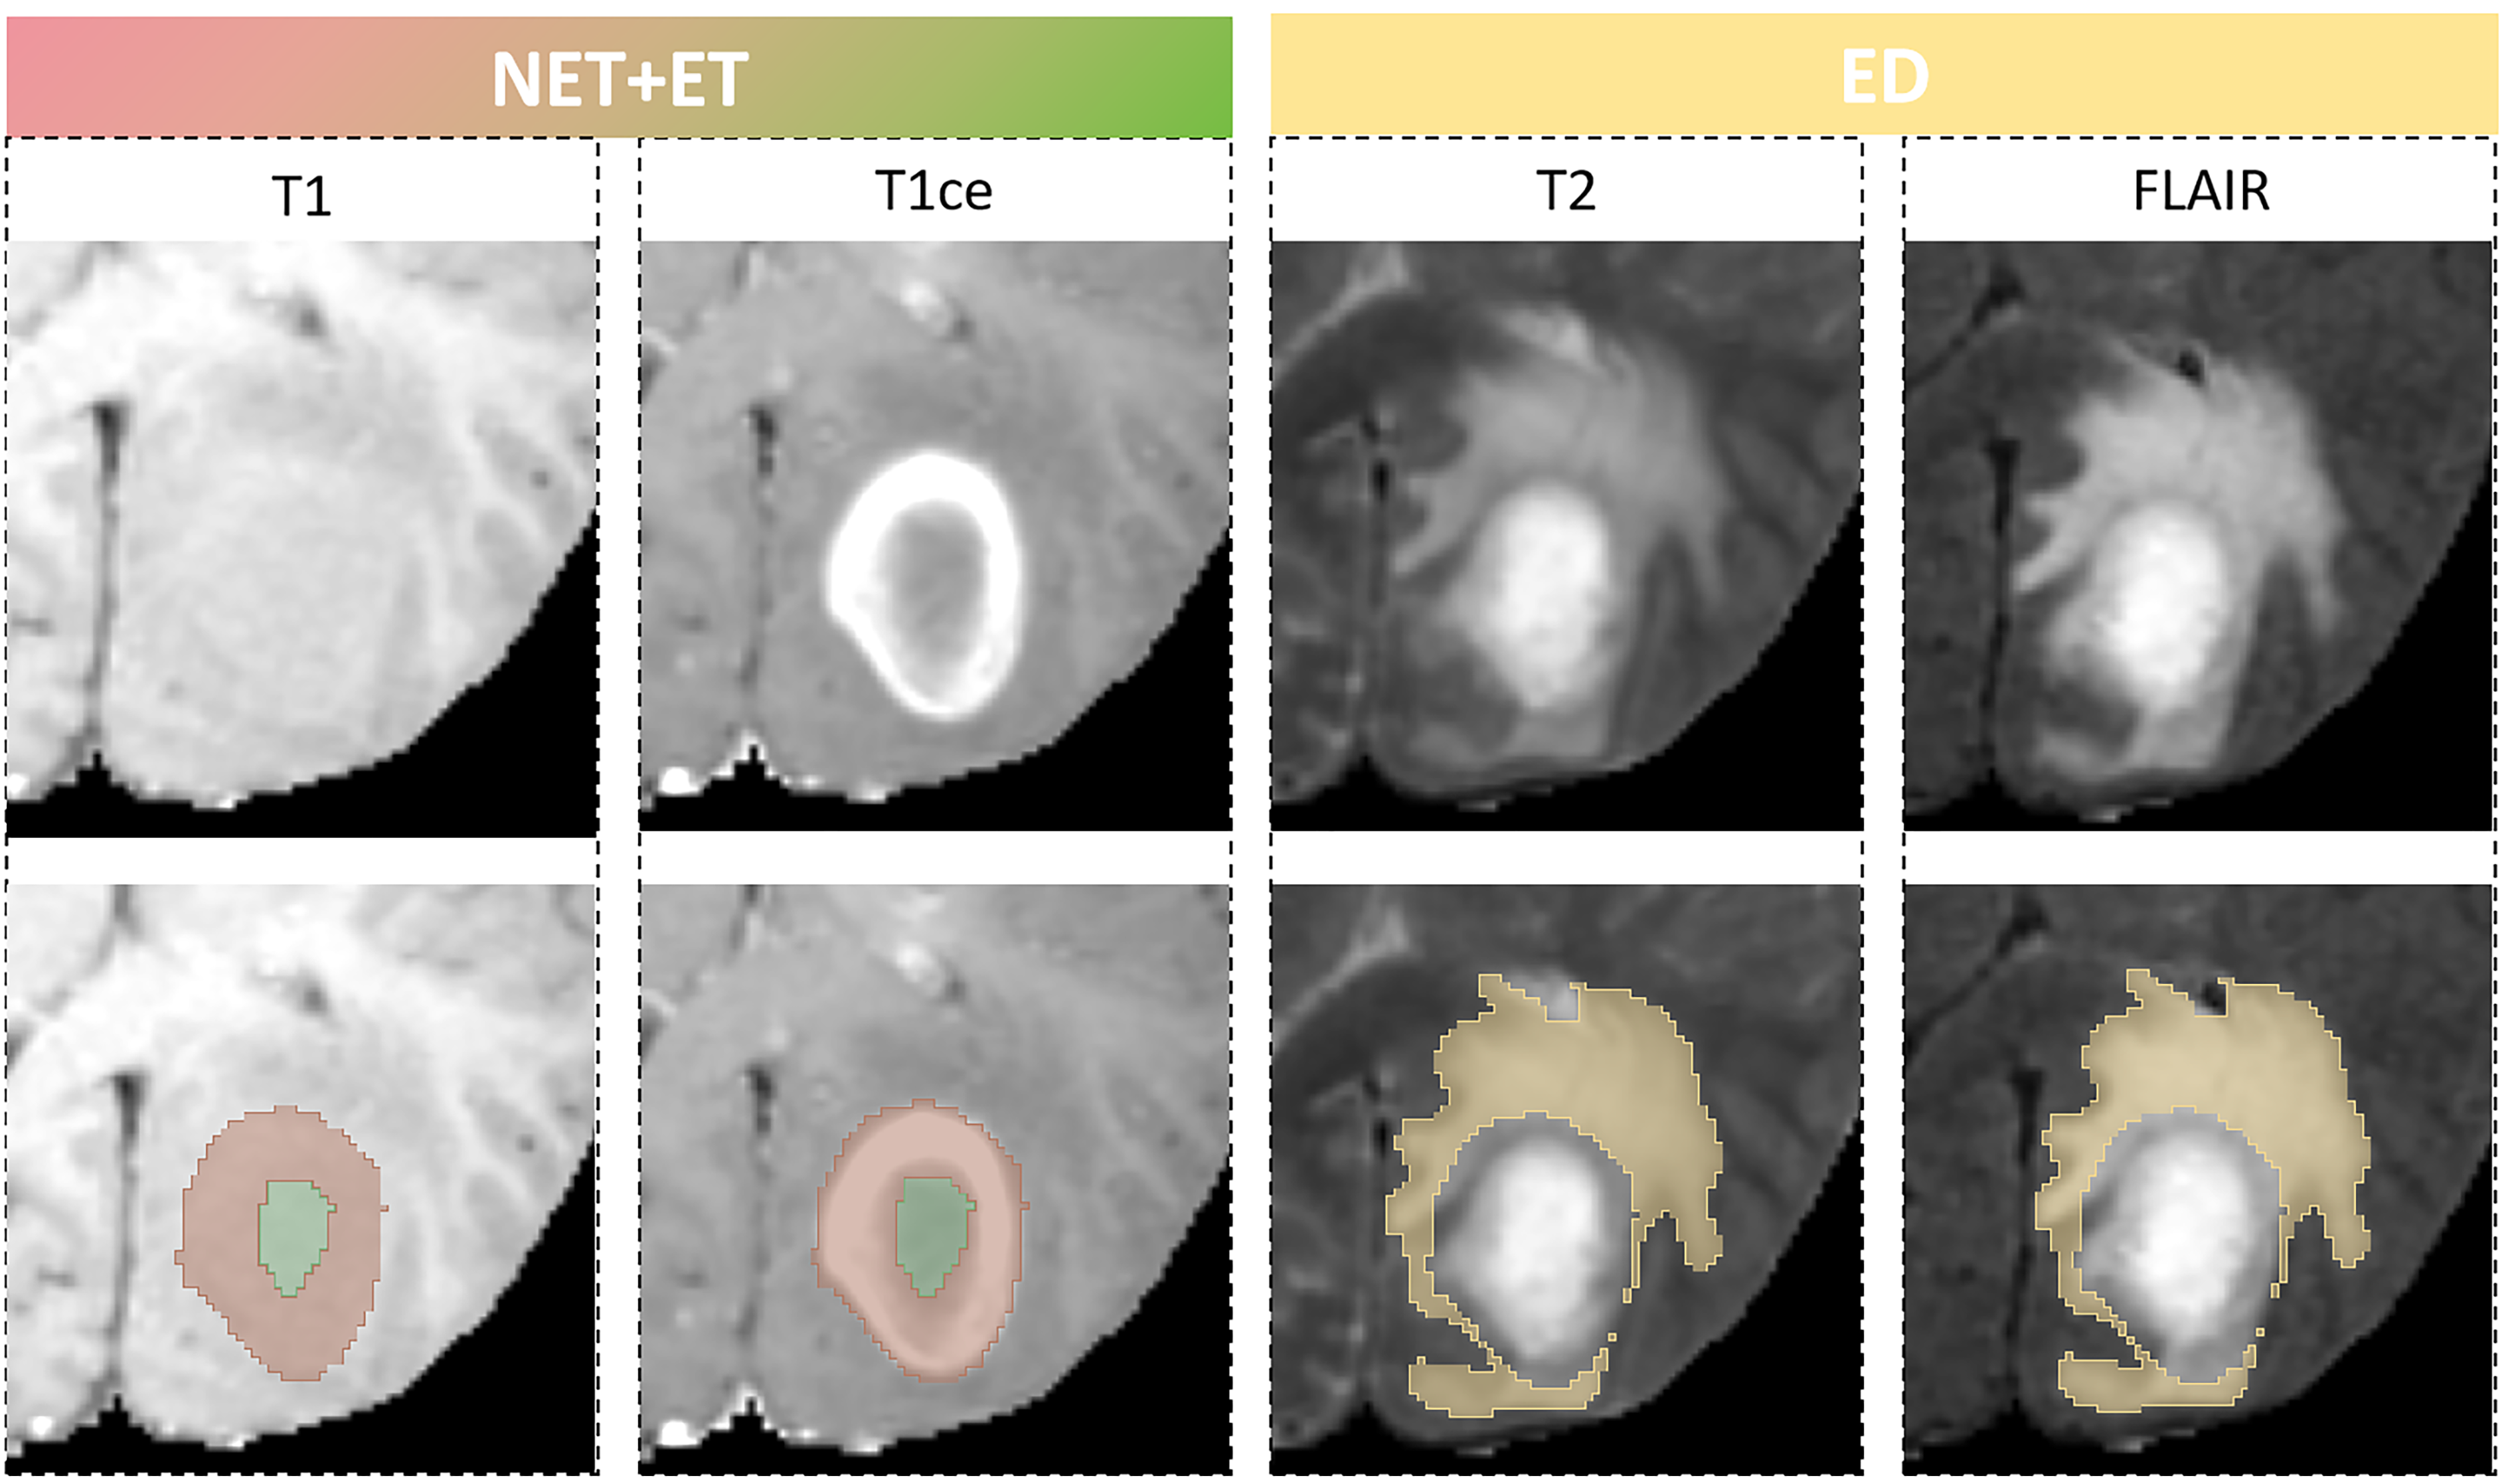 Fig. 2.
Sub-region labeling of four magnetic resonance imaging (MRI) modality. An example of the segmented glioblastoma sub-regions labels overlaid on four MRI modalities. The enhancing part of the tumour core (ET-red) and the non-enhancing part of the tumour core (NET-green) superimposed on T1ce and T1 scans, and the peritumoral edema (ED-yellow) superimposed on T2 and FLAIR scans. T1, T1-weighted precontrast; T1ce, T1-weighted postcontrast; T2, T2-weighted; FLAIR, fluid-attenuated inversion recovery.
Radiomic features (RF) were extracted from the ROIs via the PyRadiomics implemented in Python (version 3.11.7, Python Software Foundation, Wilmington, DE, USA), and 982 features were extracted for each ROI on each MRI modality. The feature categories include 2D/3D shape features, first-order features, grey level co-occurrence matrix, grey level run length matrix, grey level size zone matrix, and grey level dependence matrix on the original, wavelet, and Laplacian of Gaussian filtered images.
Initial radiomic feature selection was performed via the Boruta algorithm combined with SHAP values to assess the importance of features more accurately, ultimately reducing the dimensionality of the input model. In optimizing the Boruta algorithm and SHAP values, key parameters include the number of trees (n_estimators = 1000) and maximum iterations (max_iter = 100) for Boruta, and the number of samples (1000) for SHAP. We used grid search (max_depth = 5) for model tuning and leveraged parallel computing (setting n_jobs = –1) to optimize a balance between computational efficiency and accuracy. After feature selection, the radiogenomic signature was constructed using the genomic risk score of the radiogenomic dataset as the input and the gradient boosting decision tree as the regressor. Using threefold cross-validation as the standard, iterative optimization was performed, and the optimal radiogenomic signature was ultimately established and trained. The parameters of the gradient boosting decision tree model were fine-tuned during the training via the GridSearchCV in Scikit-learn (https://scikit-learn.org).
After the transcriptional subclones and their marker genes were obtained, the list of marker genes was analyzed via Kyoto Encyclopedia of Genes and Genomes (KEGG) pathway analysis to identify the significantly enriched molecular pathways. The KEGG analysis was conducted via DAVID (version 6.8; https://david.ncifcrf.gov). Following the division of patients in the genomic development dataset into high- and low-risk groups based on their genomic risk scores, misregulated hallmark pathways related to high- vs. low-risk group average gene set variation analysis (GSVA) was performed based on hallmark databases collected from the MSigDB 3.0 (Broad Institute, Cambridge, MA, USA; https://www.gsea-msigdb.org).
The functional annotation of radiomic features was performed via single-sample gene set enrichment analysis (ssGSEA) and Pearson correlation analysis. Within the radiogenomic dataset, ssGSEA was performed for hallmark pathways to calculate a patient-specific enrichment score, and a Pearson correlation coefficient matrix was subsequently constructed to identify the contributions of the selected radiomic features.
All analyses were performed via Python (version 3.11.7, Python Software
Foundation, Wilmington, DE, USA), R (version 4.3.3, R Foundation for Statistical
Computing, Vienna, Austria) and Office 2021 (Microsoft, Microsoft Corporation,
Redmond, WA, USA). The Mann‒Whitney U test was used for two-group comparisons,
while the Kruskal‒Wallis test was applied for multi-group comparisons. Cox
proportional hazards regression models generated hazard ratios (HR) and 95%
confidence intervals (CI) to identify survival-associated factors. Univariate Cox
regression analyses were initially conducted for each variable. Variables with
p-values less than 0.05 were selected and incorporated into a
multivariate Cox regression model. Subsequently, these candidate variables were
further refined and integrated into a comprehensive model using forward stepwise
regression. We used five - fold cross - validation and calculated the mean
concordance index (c-index) to assess model accuracy. All patients were
stratified into low- or high-risk groups based on the threshold determined by the
“surv_cutpoint” function in the “survminer” package
(https://cran.r-project.org/package=survminer). Intervariable correlations were
quantified using Pearson correlation analysis, with two-tailed p-values
ITH was estimated from the genomic development datasets, and the optimal number
of GBM subclones was eight (Fig. 3a). In each of the eight genomic subclones,
enriched pathways for the subclone-specific marker genes were identified by KEGG
(corrected p values
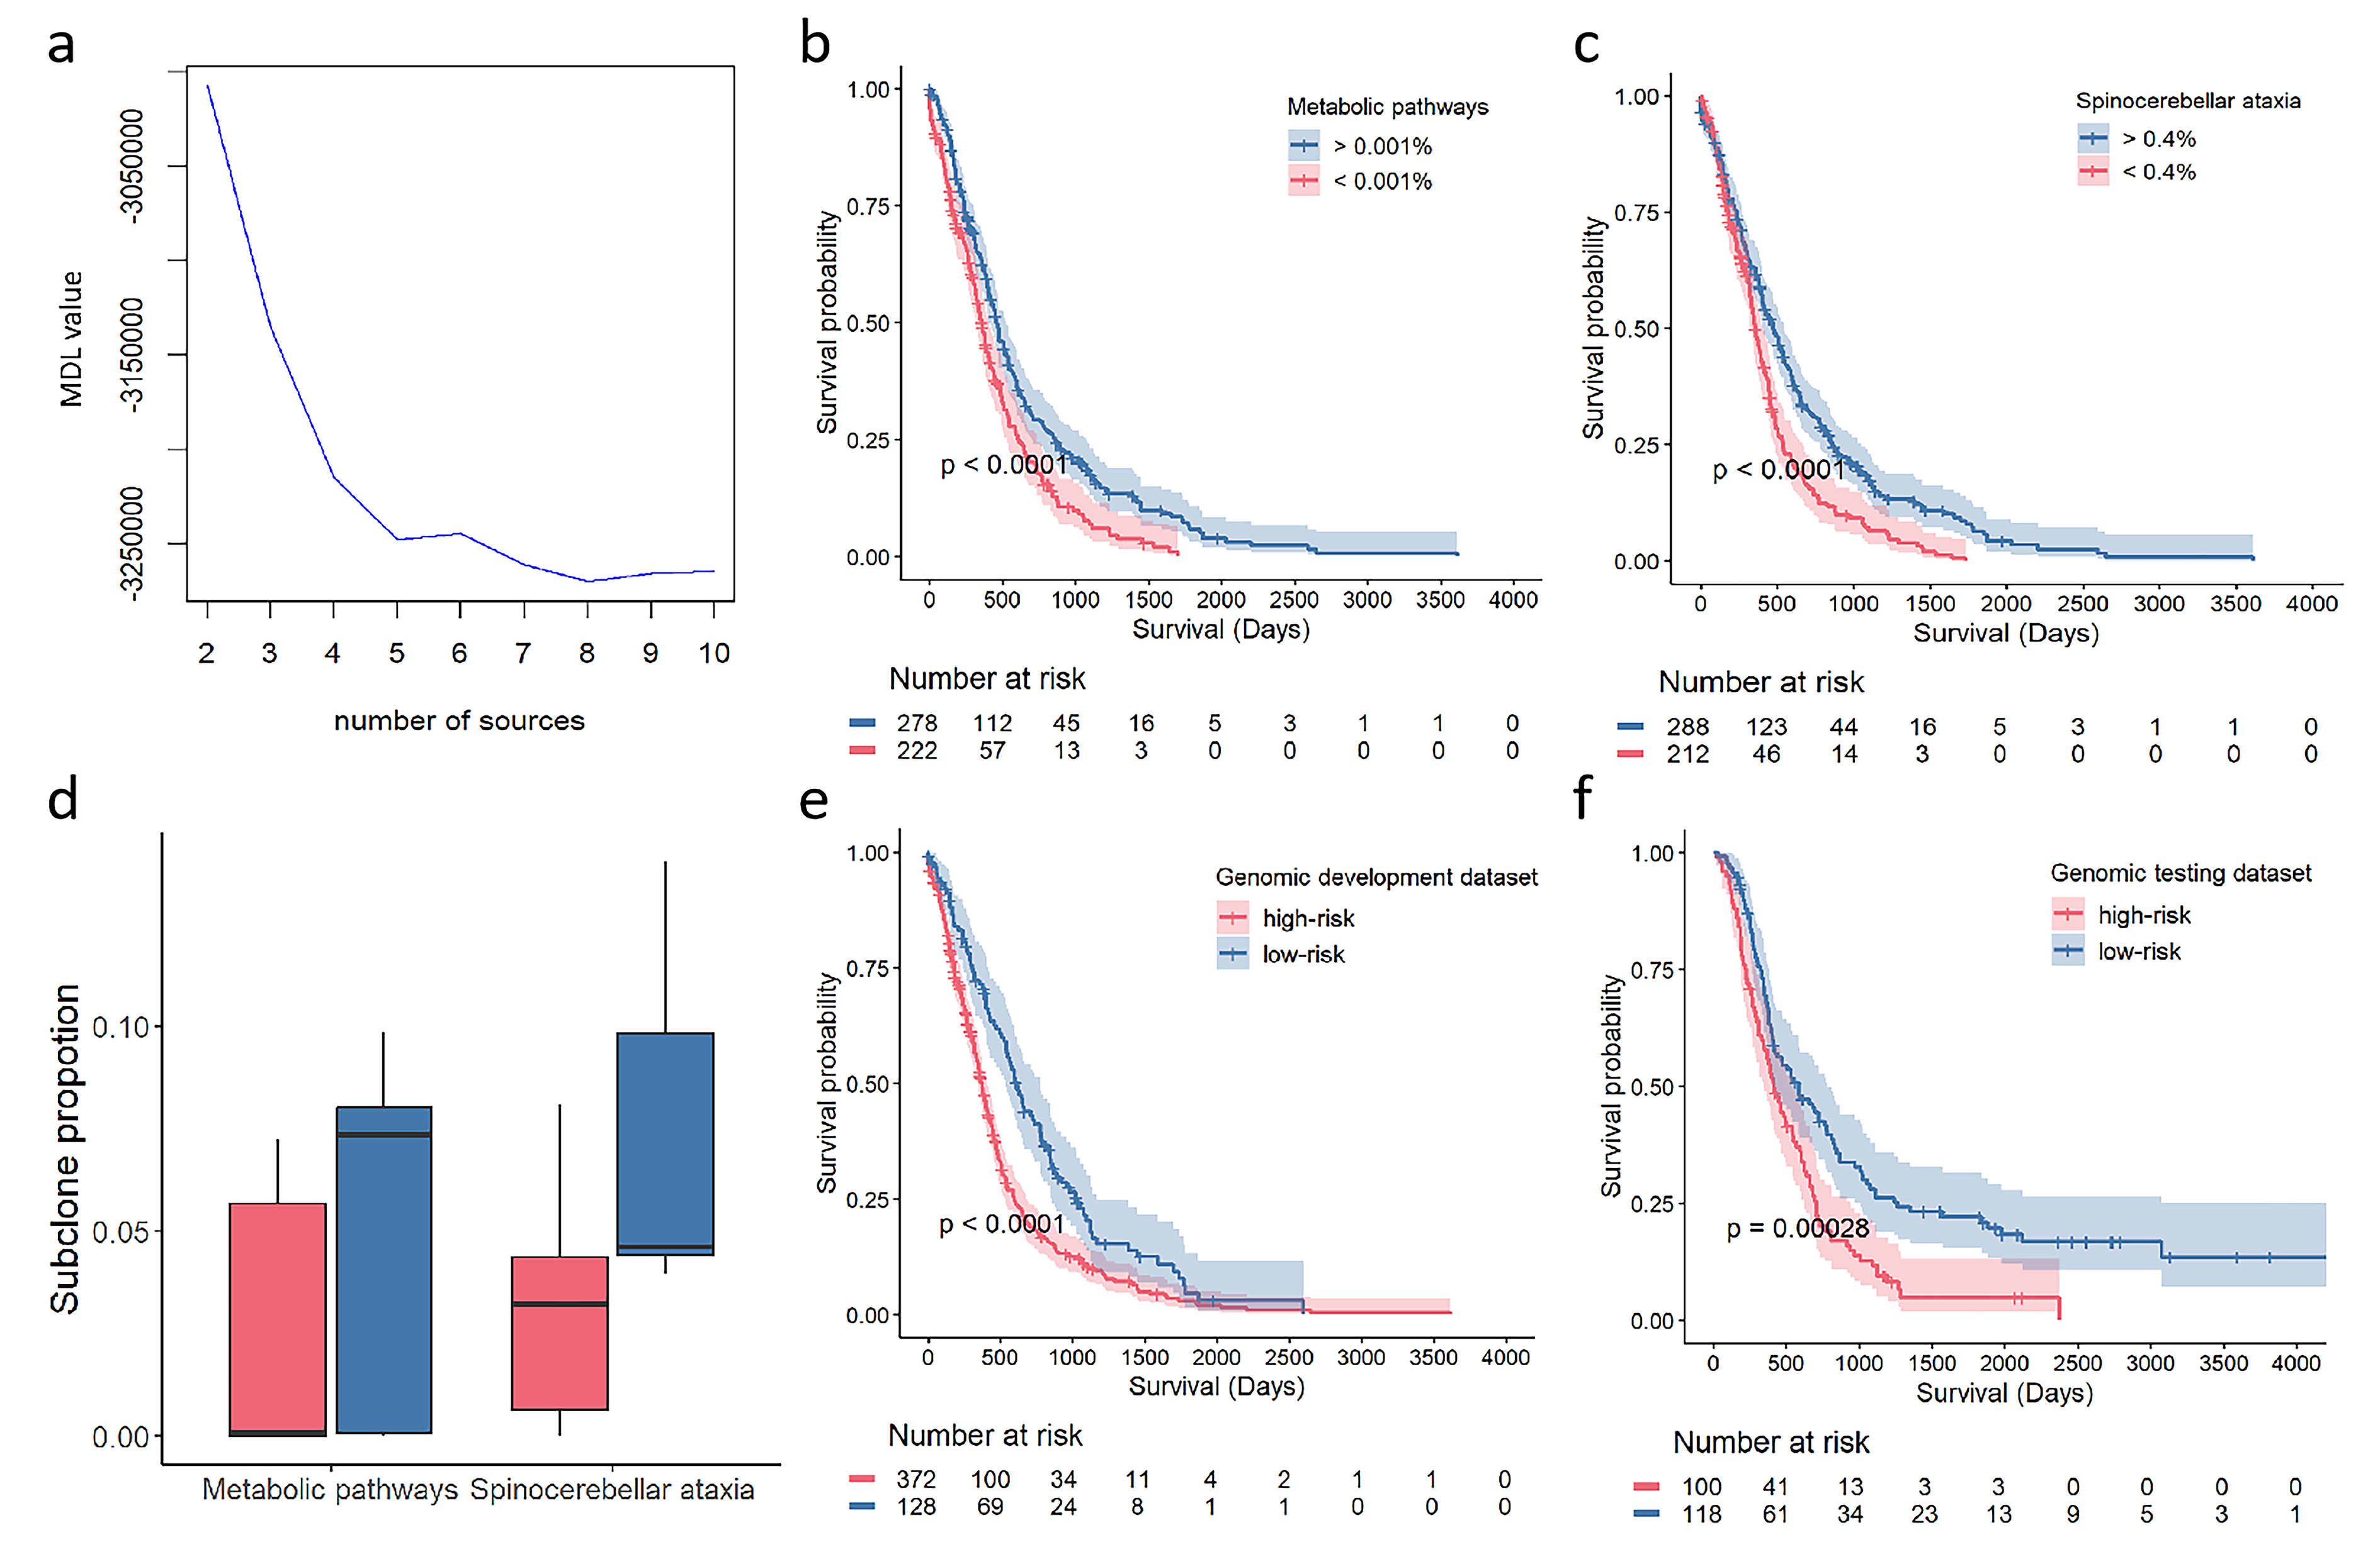 Fig. 3.
The identification of Glioblastoma (GBM) subclones for prognosis. (a) The optimal subclone number of 8 was determined by the minimum description length curve. (b,c) Kaplan-Meier curves show the significant association of proportion in metabolic pathways subclone and spinocerebellar ataxia subclone with overall survival. (d) Comparison of the proportion of the metabolic pathways and spinocerebellar ataxia. (e,f) Kaplan-Meier curves show the overall survival of patients in low-risk and high-risk groups stratified by genomic risk-score in the development dataset and testing dataset.
| Subclone index | Number of total genes | KEGG analysis | Univariate Cox analysis | Multivariate Cox analysis | |||
| Key pathways | Key pathway genes | HR (95% CI) | p value | HR (95% CI) | p value | ||
| 1 | 21 | Metabolic pathways | MVK| NT5DC4| INPP5J| MGAT2 | 0.02 (0.001, 0.28) | 0.005 | 2.27 × 10⁻⁴ (1.42 × 10⁻⁷, 0.36) | 0.026 |
| 2 | 46 | Spliceosome | SF3B4| PUF60| ALYREF| SRSF3| LSM2 | 1.001 (0.99, 1.008) | 0.798 | ||
| 3 | 29 | Histidine metabolism | ASPA| CNDP1 | 0.05 (0.003, 0.87) | 0.040 | 0.75 (0.13, 2.3) | 0.159 |
| 4 | 25 | Tuberculosis | CEBPB| ITGB2| CTSS | 0.03 (0.001, 1.23) | 0.065 | ||
| 5 | 33 | Spinocerebellar ataxia | ATP2A2| PIK3R1| PUM2 | 0.001 (2.57 × 10⁻⁵, 0.032) | 0.0001 | 2.03 × 10⁻³ (6.56 × 10⁻⁵, 6.28 × 10⁻²) | 0.0004 |
| 6 | 28 | Huntington disease | DCTN6| COX7A2L| PSMC6| NDUFB5| POLR2I | 0.09 (0.004, 2.27) | 0.144 | ||
| 7 | 23 | Epithelial cell signaling in Helicobacter pylori infection | PAK1| ATP6V1G2 | 1.11 (0.03, 37.94) | 0.95 | ||
| 8 | 38 | Regulation of actin cytoskeleton | GSN| RDX| ITGA7| ARHGEF6 | 0.999 (0.992, 1.006) | 0.82 | ||
HR, hazard ratio; CI, confidence interval; KEGG, Kyoto Encyclopedia of Genes and Genomes.
The prognostic power was assessed by the proportion of each tumor subclone in
the total subclones (Table 2). Cox regression analyses identified that the
metabolic pathway subclone and spinocerebellar ataxia subclone were independent
protective factors. Patients stratified into two groups exhibited significantly
divergent survival outcomes (Fig. 3b, p
| Name | Feature Description | Modality | Sub-region |
| RF1 | log-sigma-1-0-mm-3D glszm SizeZoneNonUniformityNormalized | T1ce | ED |
| RF2 | log-sigma-1-0-mm-3D glszm SmallAreaEmphasis | T1ce | ED |
| RF3 | wavelet-LLH glcm MaximumProbability | T1ce | ED |
| RF4 | log-sigma-3-0-mm-3D gldm SmallDependenceEmphasis | T1 | ED |
| RF5 | wavelet-LLH glcm MaximumProbability | FLAIR | ED |
| RF6 | diagnostics Image-original Mean | T1 | NET |
| RF7 | log-sigma-1-0-mm-3D glrlm LongRunLowGrayLevelEmphasis | T1ce | ED |
| RF8 | wavelet-HLH glcm MaximumProbability | T1ce | ED |
| RF9 | wavelet-LLH glcm InverseVariance | T2 | ED |
| RF10 | wavelet-HHH glszm SmallAreaEmphasis | T2 | ET |
| RF11 | wavelet-LLH glcm Id | FLAIR | ED |
| RF12 | log-sigma-3-0-mm-3D glszm ZonePercentage | T1ce | ED |
| RF13 | log-sigma-3-0-mm-3D glszm GrayLevelNonUniformityNormalized | T1 | ET |
| RF14 | wavelet-LLL firstorder Skewness | FLAIR | ED |
| RF15 | wavelet-LLL glszm SmallAreaLowGrayLevelEmphasis | T1ce | ET |
| RF16 | wavelet-LLH glcm JointEnergy | T1 | ED |
| RF17 | wavelet-LLH gldm DependenceEntropy | T1 | ED |
| RF18 | log-sigma-3-0-mm-3D glszm SmallAreaEmphasis | T1ce | ED |
| RF19 | wavelet-HHH glcm MaximumProbability | T1ce | ED |
Note: T1, T1-weighted precontrast; T1ce, T1-weighted postcontrast; T2, T2-weighted; FLAIR, fluid-attenuated inversion recovery; ED, Edema; ET, Enhancing part of the tumour core; NET, non-enhancing part of the tumour core. RF, radiomic features.
A transcriptional subclone-derived risk score was developed via multivariate Cox
regression analysis for prognostic prediction, which used the metabolic pathway
subclone and spinocerebellar ataxia subclone. The risk score categorized patients
into high- and low-risk groups with significantly divergent survival outcomes
with a c-index of 0.702 (Fig. 3e, p
To dissect the biological function of heterogeneity, we conducted a gene set variation analysis (GSVA) of the hallmark gene signatures in the genomic development dataset. Oncogenic and cancer hallmark pathways, including the mammalian target of rapamycin (mTOR) and Myc proto-oncogene transcription factor (Myc) pathways, were significantly upregulated in the high-risk group. Moreover, pathways associated with tumour malignancy, such as protein processing, DNA repair, apoptosis, and reactive oxygen species, were also enriched in the high-risk groups. In contrast, pathways related to hedgehog signalling and KRAS (Kirsten rat sarcoma viral oncogene homolog) signalling were downregulated. We ranked the enriched pathways and identified the most prominent biological processes. mTOR complex Ⅰ (MTORCⅠ), Myc Target Ⅰ, unfolded protein response and protein secretion were the pathways associated with the greatest number of upregulated genes in the high-risk group, whereas KRAS_SIGNALING_DN (KRAS signaling downregulation) was upregulated in the low-risk group (Fig. 4). These observations highlight the distinct biological profiles of the two patient subgroups stratified by transcriptional subclones, wherein many hallmark pathways were upregulated in the high-risk group, which mostly involved oncogenic or cancer-related pathways, whereas only a few hallmarks were upregulated in the low-risk group.
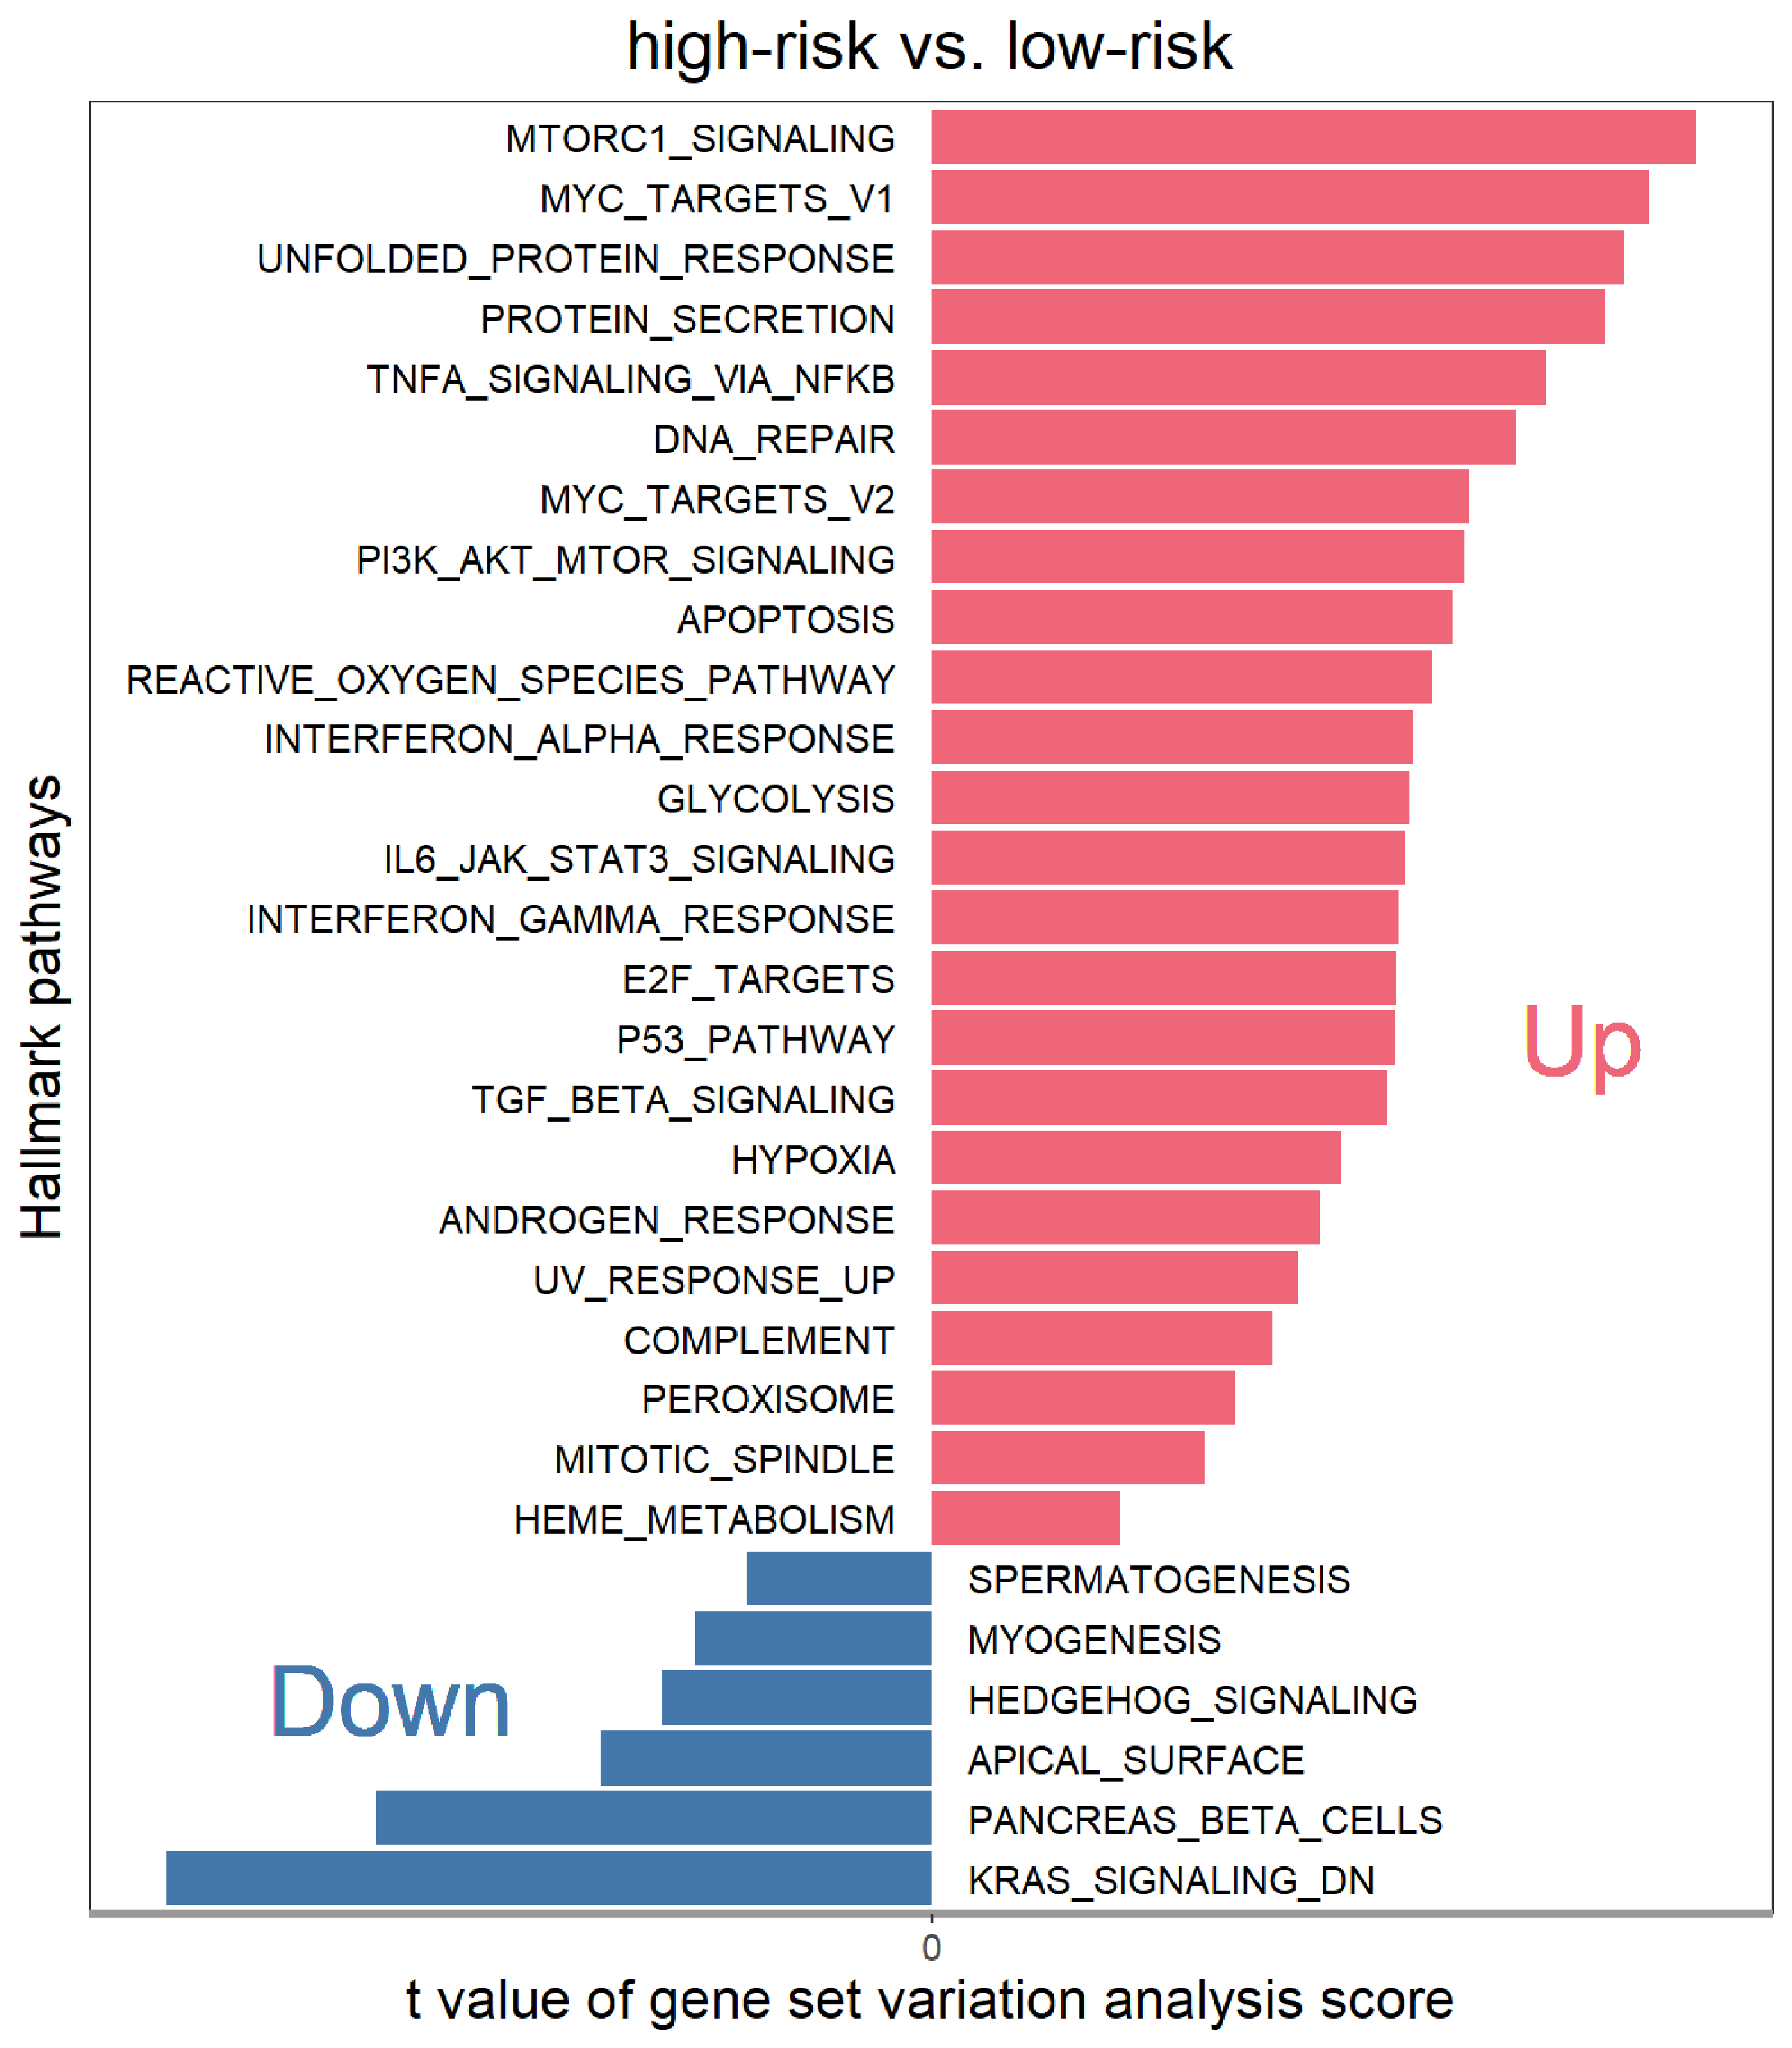 Fig. 4.
Bar plot illustrating the top enriched hallmark gene sets, ranked by gene set variation analysis scores, comparing the high-risk group with the low-risk group. Up- and down-regulated signaling pathways are shown in red and blue, respectively.
The MR images and matched transcriptomic data were derived from the genomic development dataset, and a total of 99 cases had matched MR images and genomic risk scores.
The Boruta algorithm identified 19 significant features related to the risk score across all the features from 3 ROIs, and a comprehensive depiction of the visual characteristics of the 19 radiomic features is provided in Table 2. The Shap method was applied to visualize the contributions of the 19 features to model decision-making (Fig. 5a). The bars represent the radiomics features sorted by impact on model output on the basis of the mean Shapley value, and the summary plot represents the prediction results for each feature. The red dots indicate that the feature for each patient has a positive impact on the model prediction, whereas the blue points indicate that the feature negatively influences the model prediction. The further the dot is from the centre line (zero), the greater the influence of the feature on the model output.
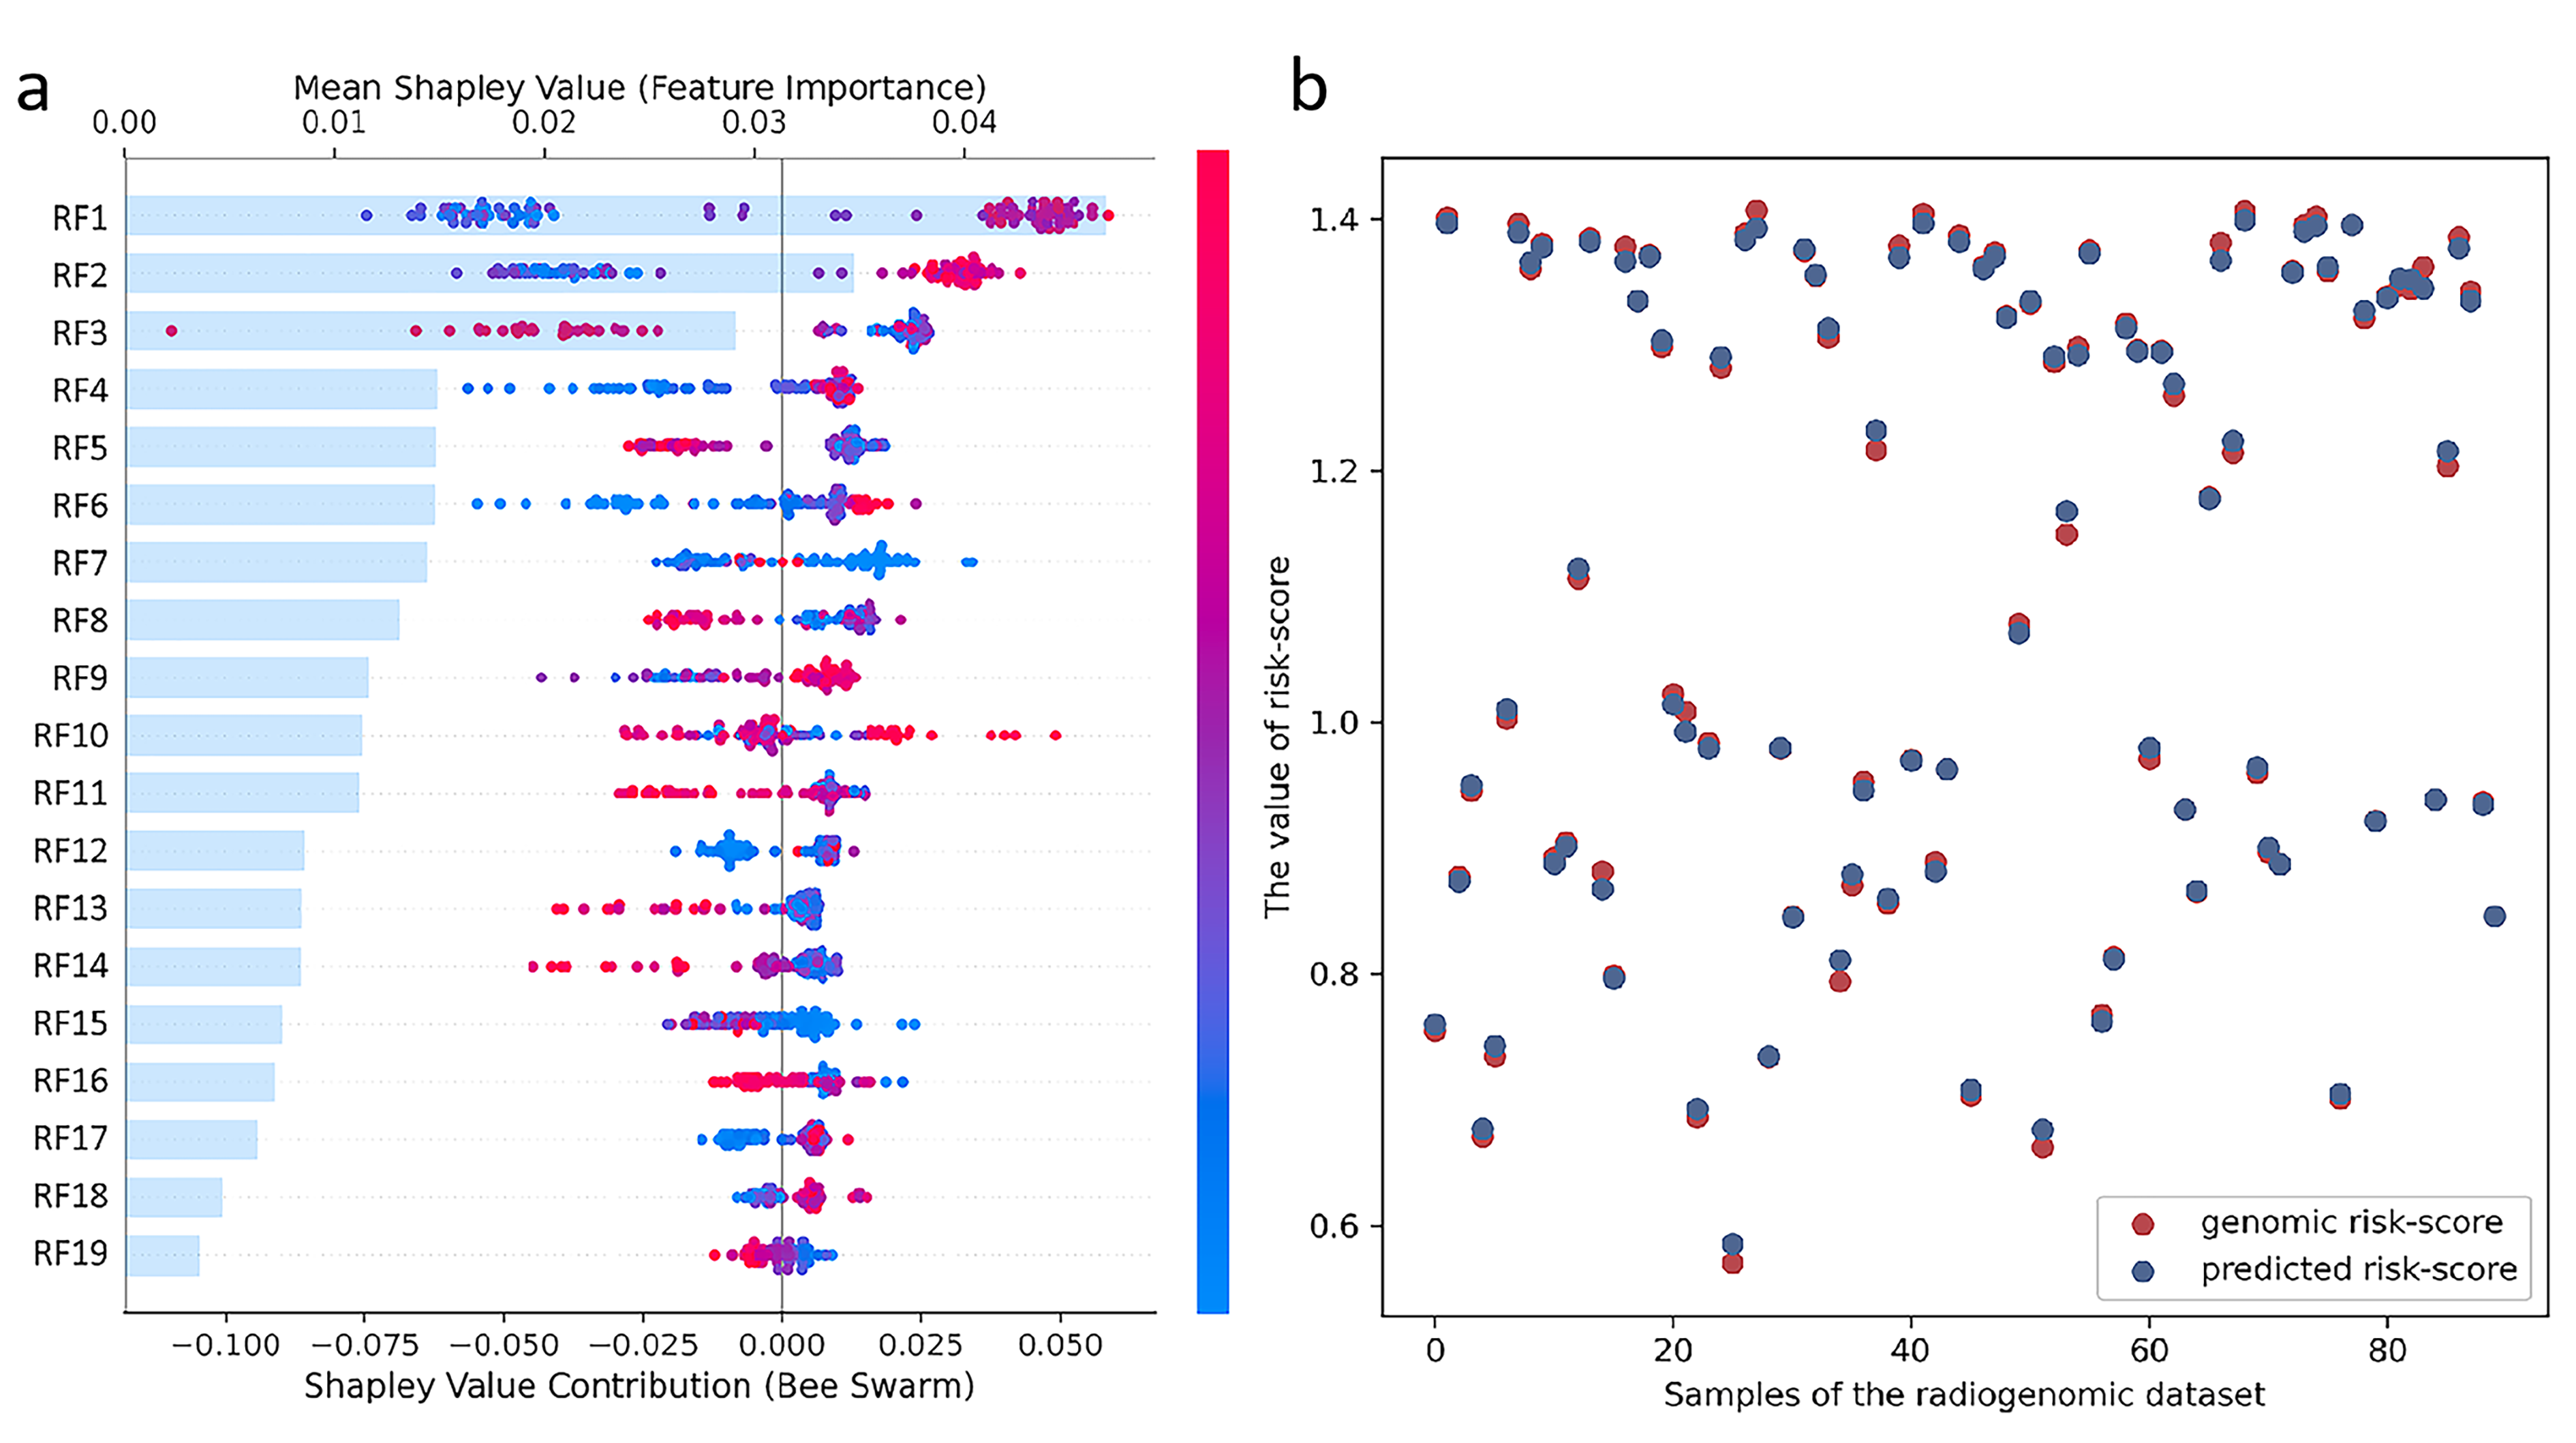 Fig. 5.
Feature selection and model constrction of the radiogenomic signature. (a) The shap feature importance summary plots of the 19 radiomic features. The bar plots (left panel) show the radiomic feature were sorted from the most important in the model (top) to the least important (bottom) (RF1-RF19), based on decreasing importance measured by the mean absolute SHAP values. The SHAP summary plots (right panel) depict the distribution of each feature’s impact on the model output. Each dot indicates an attribution of a given radiomic feature to the probability model output. (b) The dot plot of radiogenomic signature predicted risk-score compared with genomic risk-score.
The 19 selected radiomic features were used to develop the radiogenomic signature for genomic risk score prediction via the gradient boosting decision tree regressor in the radiogenomic dataset. The line plots revealed that the radiogenomic signature predicted by the model was very close to the actual genomic risk score (Fig. 5b).
The heatmap revealed that the distributions of 19 selected radiomic features were significantly different from those of the genomic risk scores in the radiogenomic dataset (Fig. 6a). Patients were ranked in ascending order of genomic risk score; some radiomic features, such as RF1 and RF2, exhibited positive correlations with the risk scores, whereas some radiomic features, such as RF3 and RF16, exhibited negative correlations.
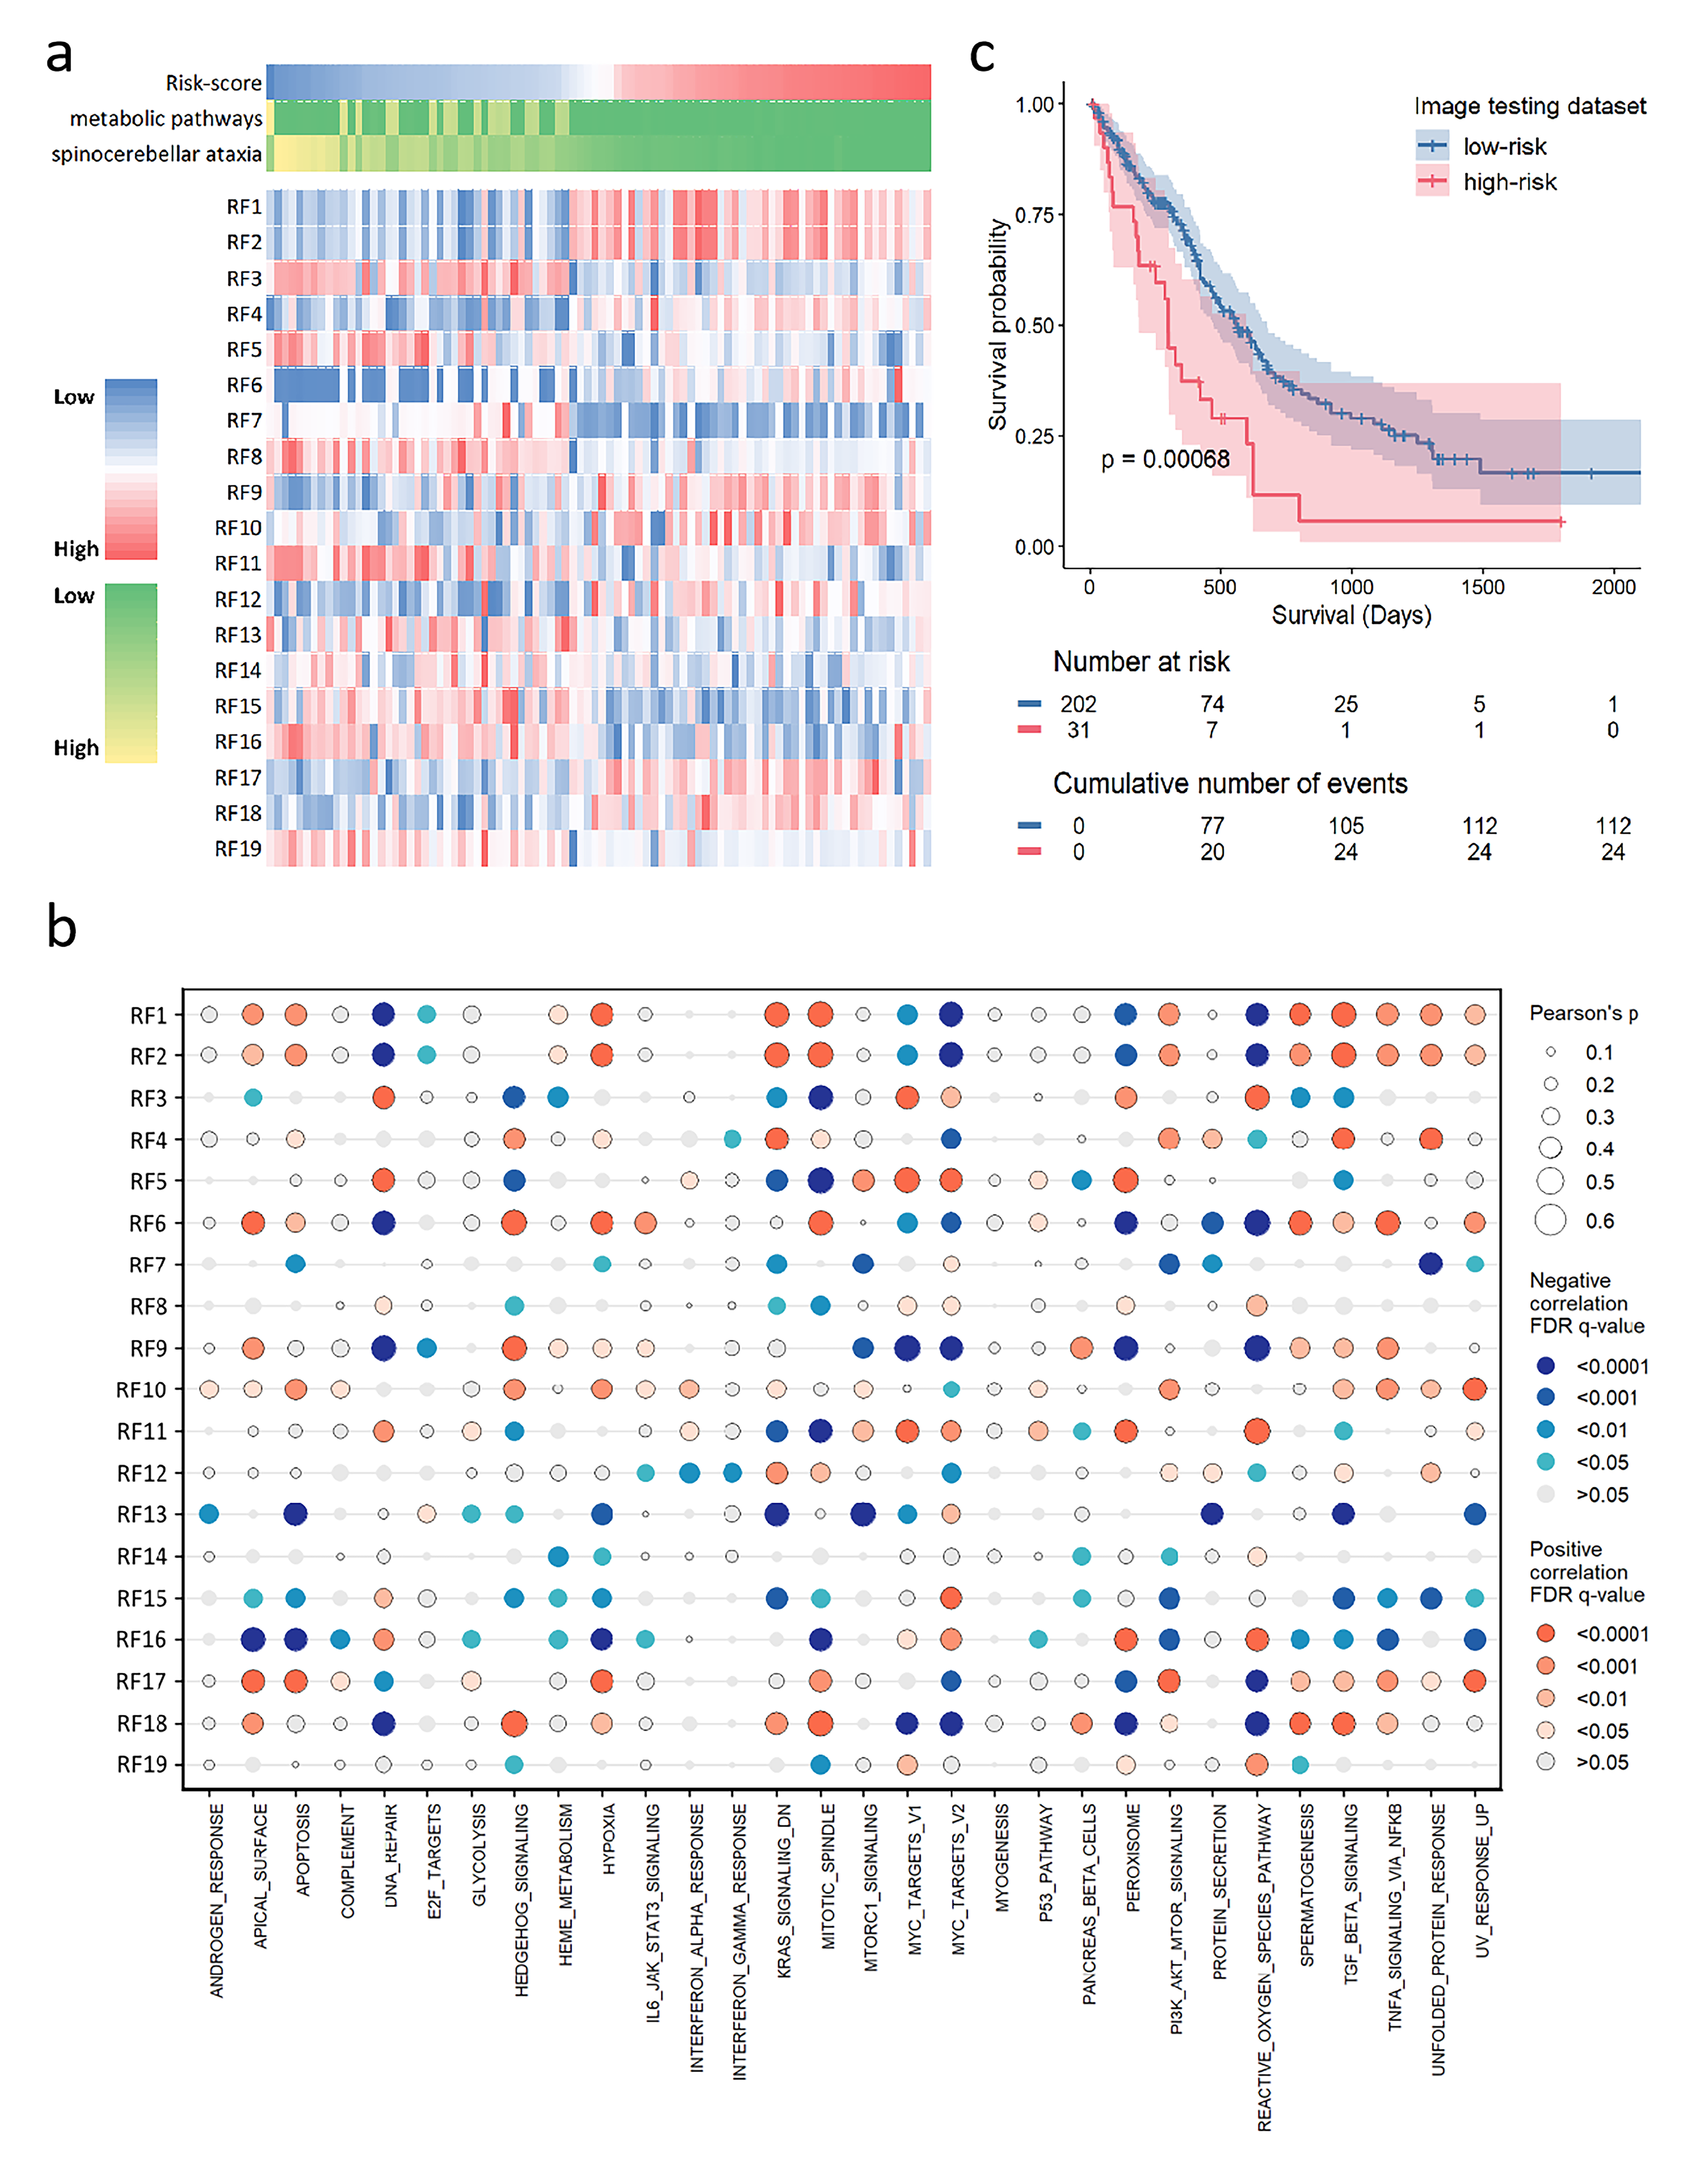 Fig. 6.
The validation and biological significance of radiogenomic signatures for prognosis. (a) The heatmap shows the distributions of radiomic features with ascending order of genomic risk-score in the radiogenomic dataset. (b) The dot map shows the pearson correlation coefficient matrix between the single-sample gene set enrichment analysis scores and the selected radiomic features. (c) Kaplan-Meier curves show the overall survival of patients in low-risk and high-risk groups stratified by predicted risk-score in the image testing dataset. FDR, false discovery rate.
To explore the connections between the 19 selected radiomic features and biological functions, we computed the enrichment scores of hallmark pathways per patient in the radiogenomic dataset. Pearson correlations were then assessed radiomic-to-pathway associations (Fig. 6b). Radiomics features such as RF1 and RF2, which are positively associated with risk scores, are positively associated with cancer hallmark pathways and the malignant behaviours of cancer cells, including apoptosis and hypoxia. Radiomics features such as RF3 and RF16, which exhibited negative correlations with risk scores, exhibited positive correlations with DNA repair and reactive oxygen species.
The trained radiogenomic models from the radiogenomic dataset were applied to the image testing dataset to obtain a predicted risk score. The predicted risk score stratified patients into high-risk and low-risk groups with significantly divergent survival outcomes (Fig. 6c, p = 0.0007). Univariate Cox analysis confirmed that the predicted risk score was a risk factor of OS in the image testing dataset with a c-index of 0.668 (HR = 1.67, 95% CI: 1.12–2.5, p = 0.011).
In this study, the intratumoral heterogeneity of transcriptional subclones in glioblastoma (GBM) was identified via an unsupervised RNA sequencing deconvolution approach. The cancer-related biological functions of the genes that defined the metabolic pathways and spinocerebellar ataxia subclones provided insights into the associations between subclones and overall survival in GBM patients. Radiogenomic signatures established a link between image heterogeneity and the transcriptional subclone-derived risk score, and associations of the prognostic radiomic features with specific hallmark pathways were explored. The clinical validity of the radiogenomic signatures was independently confirmed across external validation cohorts. In summary, radiogenomic signatures are potential non-invasive surrogate markers for assessing transcriptional heterogeneity and prognosis in patients with GBM.
GBM is a highly aggressive cancer with unmet therapeutic needs [14], which can be explained by extensive intratumoral heterogeneity (ITH). While prior studies have explored ITH through genomic profiling [15, 16], the clinical utility of such approaches faces challenges including cost, invasiveness, and spatial sampling bias. Radiomics noninvasively characterizes tumour phenotypes by extracting high-dimensional imaging features [17], and radiogenomics bridges radiomic features with molecular profiles to uncover biological correlations [18]. The study identified a radiogenomic signature, which reflected the transcriptional heterogeneity associated with overall survival, with underlying biological properties. The radiogenomic signatures demonstrate translational potential as readily applicable prognostic tools, particularly advantageous for patients ineligible for surgical resection or biopsy. The C-index of the radiogenomic signature in our study reached 0.702, which is higher than the pooled C-index of 0.65 derived from MR-based radiomics across nine studies [19].
Our study revealed that tumours with low proportions of the metabolic pathway subclone and spinocerebellar ataxia subclone were associated with poor survival. Metabolic dysregulation represents a hallmark of many advanced cancers. In GBM, numerous point mutations and copy number variations drive the metabolic state of glioma cells, affecting tumour growth and patient prognosis [20]. The metabolic pathway subclone includes key genes of MVK, which encodes the mevalonate kinase. Mevalonate pathway enzymes were preferentially expressed in brain tumour-initiating cells and are regulated by MYC-binding sites [21, 22]. The metabolic pathway subclone includes the key gene INPP5J, and downregulation of INPP5J expression has been found to cause an imbalance in the phosphatidylinositol-3-kinase and Protein Kinase B (PI3K/Akt) signalling pathway and ultimately lead to cancer development and poor prognosis in oesophageal cancer patients [23]. The metabolic pathway subclone includes the key gene MGAT2, which impacts the invasiveness of rat neuroblastoma cells [24]. Therefore, abnormalities in metabolic pathway subclones have prognostic significance in GBM. Although spinocerebellar ataxia is not associated with GBM, the spinocerebellar ataxia subclone includes the key gene ATP2A2, the overexpression of which significantly suppresses the clonogenic growth of glioblastoma cells and is associated with a better prognosis [25]. The spinocerebellar ataxia subclone includes the key gene PIK3R1, which is one of the mesenchymal subtype-specific prognostic genes and one of the tumor-associated antigens genes in GBM [26, 27], which is the most commonly mutated gene in the PI3K-AKT pathway and is expressed at low levels in most tumours [28, 29].
Radiomics is a noninvasive and global method for identifying ITH. Emerging spatial transcriptomic research has demonstrated that tumor spatial architecture serves as a prognostic determinant in glioblastoma [30]. Specifically, a previous study has focused on two major anatomical regions in GBM: the tumour core, which includes perivascular and hypoxic areas, and the tumour periphery, which includes the infiltrative/invasive edge [15]. Our study delineated three subregions on MR images, including the NET, ET and ED, and NETs and ETs make up the tumour core. There were 19 radiomic features selected to construct the radiogenomic signature in our study, and 15 out of the 19 radiomic features were from the peritumoral edema. This aligns with GBM’s hallmark invasive propensity, where approximately 90% of recurrences localize to macroscopically normal peritumoral regions adjacent to resection cavities [8]. Radiomics noninvasively captures subvisual features of morphological diversity, and peritumoral features, along with intratumoral features of the tumour habitat, are used to predict survival and glioma grade [31, 32].
Radiomic features can be used to understand the biological significance underlying the development of ITH and its association with survival. For example, RF1 is the nonuniformity of the graylevel size zone matrix, with a lower value indicating more homogeneity among zone size volumes in the image. RF1 exhibited high intratumour heterogeneity and was correlated with a high genomic risk score, a low metabolic pathway subclone and a spinocerebellar ataxia subclone fraction. Most hallmark pathways, including oncogenic or cancer-related pathways, were upregulated in the high-risk group, and RF1 was also positively correlated with cancer hallmark pathways and the malignant behaviours of cancer cells. RF 16 is the energy of the grey-level co-occurrence matrix, and a large energy value indicates a stable texture with regular variations. RF16 exhibited low intratumour heterogeneity and was correlated with a low genomic risk score, a high metabolic pathway subclone and a spinocerebellar ataxia subclone fraction. The stronger the proliferation ability of tumor cells, the greater the heterogeneity within them, which can be reflected by the heterogeneity in imaging features. Therefore, RF1 representing stronger heterogeneity and RF16 representing weaker heterogeneity are positively and negatively correlated with hallmark cancer pathways, respectively.
Our study had several limitations. First, the number of radiogenomic datasets is relatively small. It should be noted that obtaining concurrent gene expression and imaging data is particularly difficult, and such datasets are scarce. Second, the multicentre dataset contributed to data heterogeneity in both MRI and RNA sequencing data; although our study used standardized preprocessing and batch-effect adjustment, the results nonetheless require further validation in large prospective studies. Third, The Boruta algorithm is predicated on the assumption that the original radiomic features are independent of one another during feature selection. However, many radiomic features often exhibit certain degrees of correlation. This underlying correlation can introduce potential biases in feature selection, thereby leading to inaccurate assessments of feature importance.
In conclusion, this study established and verified a prognostic radiogenomic signature to characterize transcriptional subclones with underlying biological functions in GBM. The radiogenomic signature provides great potential for prognostic power and noninvasive assessment of genomic intratumoral heterogeneity and may serve as an alternative to genomic signatures in the future.
CAM, convex analysis of mixtures; CI, confidence interval; ED, edema; ET, enhancing part of the tumour core; FLAIR, fluid-attenuated inversion recovery; GBM, glioblastoma; HR, hazard ratio; ITH, intratumoral heterogeneity; MDL, minimum description length; NET, nonenhancing part of the tumour core; OS, overall survival; RF, radiomic feature; ROI, regions of interest; T1, T1-weighted precontrast; T1ce, T1-weighted postcontrast; T2, T2-weighted.
Transcriptome data and MRI imaging data were obtained from The Cancer Genome Atlas (TCGA) project, The Cancer Imaging Archive (TCIA) database, the Repository of Molecular Brain Neoplasia Data, the Clinical Proteomic Tumor Analysis Consortium Glioblastoma Multiforme, the Ivy Glioblastoma Atlas project and the Chinese Glioma Genome Atlas (CGGA) database. The datasets used and/or analyzed during the current study are available from the corresponding author on reasonable request.
GXH and HZ designed the research study. XQZ and XYZ performed the research. JZ, ZYY, HJC and HLT provided help and advice on the radiomics analysis. XQZ analyzed the data. XQZ and XYZ wrote the manuscript. All authors contributed to editorial changes in the manuscript. All authors read and approved the final manuscript. All authors have participated sufficiently in the work and agreed to be accountable for all aspects of the work.
All the transcriptome data and MR images used in our study are obtained from public databases. The patients involved in the database have obtained ethical approval. Users can download relevant data for free for research and publish relevant articles. Our study is based on open source data, so there are no ethical issues and other conflicts of interest.
We acknowledge The Cancer Genome Atlas (TCGA) project, The Cancer Imaging Archive (TCIA) database, the Repository of Molecular Brain Neoplasia Data, the Clinical Proteomic Tumor Analysis Consortium Glioblastoma Multiforme, the Ivy Glioblastoma Atlas project and the Chinese Glioma Genome Atlas (CGGA) database for providing their platforms and contributors for uploading their meaningful datasets.
This research received no external funding.
The authors declare no conflict of interest. Given his role as the Editorial Board member, Hailin Tang had no involvement in the peer-review of this article and has no access to information regarding its peer review. Full responsibility for the editorial process for this article was delegated to Xudong Huang.
Supplementary material associated with this article can be found, in the online version, at https://doi.org/10.31083/FBL36348.
References
Publisher’s Note: IMR Press stays neutral with regard to jurisdictional claims in published maps and institutional affiliations.