


1 Department of Physiology, Gdansk University of Physical Education and Sport, 80-336 Gdansk, Poland
2 Department of Physiotherapy, Gdansk University of Physical Education and Sport, 80-336 Gdansk, Poland
3 Department of Physical Education and Lifelong Sports, Poznan University of Physical Education, 61-871 Poznan, Poland
4 Department of Health and Natural Science, Gdansk University of Physical Education and Sport, 80-336 Gdansk, Poland
5 Department of Bioenergetics and Physiology of Exercise, Medical University of Gdansk, 80-210 Gdansk, Poland
6 Laboratory of Experimental Biochemistry & Molecular Biology, Istituto Ortopedico Galeazzi (IRCCS), 20161 Milano, Italy
7 Department of Athletics, Strength and Conditioning, Poznan University of Physical Education, 61-871 Poznan, Poland
Abstract
Background: COVID-19 pandemic has exacerbated the problem of physical
inactivity and weight gain. Consequently, new strategies to counteract weight
gain are being sought. Because of their accessibility, interval training and cold
therapy are the most popular such strategies. We here aimed to examine the effect
of 6 units of high-intensity interval training (HIIT), applied alone or in
combination with 10 sessions of whole-body cryotherapy (WBC; 3 min at –110
Keywords
- Fibroblast growth factor 21
- Adiponectin
- Cold exposure
- Physical activity
- COVID-19
According to global estimates prior to the outbreak of COVID-19 pandemic, 27.5% of adults [1] and 81% of adolescents were physically inactive [2], and did not meet the recommended 150 min weekly dose of physical activity (PA). According to some authors, pandemic-related lockdown induced additional, major changes in lifestyle behavior among adults, with a 43% decrease in PA and 19% increase in unhealthy food consumption, ultimately resulting in weight gain [3]. The average weight gain among adults associated with the COVID-19 pandemic is 4.7 kg (unpublished, statistic data). Obese individuals with low cardiorespiratory fitness are typically a challenging population to be treated; in the presence of accompanying diseases, these individuals struggle to survive [4]. Further, obesity increases the risk of severe infection with SARS-CoV-2, the virus that causes COVID-19 [5]. Excessive fat accumulation, especially as visceral adipose tissue, impairs glucose homeostasis [6] and results in a low-grade inflammation that may, over time, lead to insulin resistance and type 2 diabetes (T2DM). Nonetheless, during the ongoing COVID-19 pandemic, home-based PA programs supported by digital solutions are commonly used to maintain an adequate level of PA and weight balance [7]. Further, limited access to fitness centers and infrastructure has focused the attention on intermittent forms of PA that could be performed at home, e.g., high-intensity interval training (HIIT). Among the different forms of physiotherapy, cold exposure is thought to enhance the beneficial effects of exercise. Consequently, cold water immersion in the sea or lake became popular in the winter of 2020/2021, when access to professional physiotherapy was limited. For these reasons, in this project we aimed to evaluate short- and long-term effects of interval training in combination with exposure to extreme cold, considering pro-health changes in the lipid profile, myokine profile and glucose homeostasis among overweight to obese, inactive participants.
Studies suggest that exercise [8] and cold exposure [9] elicit comparable muscle contractions, the latter in association with shivering, and induce similar endocrine responses, by stimulating the release of muscle-derived peptides. These act as endocrine-like factors, such as myokines [10] and exerkines [11], and are involved in the prevention or reversion of the negative effects of high food intake, being overweight, and obesity, as well as several other pathological conditions [12]. Fibroblast growth factor 21 (FGF21) [13] and irisin [14] are myokines modulated by cold exposure. They are important metabolic regulators that stimulate glucose uptake by adipocytes and myofibers, and improve glucose homeostasis. However, the physiology of the effects of physical exercise and cold exposure on myokine expression, in particular, that of FGF21, is still only marginally understood.
Costello et al. [15] studied the effect of whole-body cryotherapy (WBC;
–110
Considering the above, one may hypothesize that a combination of HIIT and cryostimulation would positively impact metabolic homeostasis, consequently improving the inflammatory (i.e., myokine) status and glucose metabolism. As maintaining a good health status may reduce the risk of developing a severe disease associated with diverse infections, the search for accessible and effective pro-health, non-pharmacological strategies during the ongoing COVID-19 pandemic offers a valuable insight. To the best of our knowledge, this specific aspect and in particular, the HIIT- and cryostimulation-dependent changes in FGF21 levels (as an emerging pivotal mediator of metabolic homeostasis), as well as myokine, incretins, and appetite-controlling hormone levels, have not yet been investigated. Accordingly, the aim of the current study was to understand if, and how, the combination of HIIT and extreme cold exposure, vs. the HIIT alone, affects FGF21 serum levels, and the adipo-myokine profile and metabolic status of overweight to obese subjects.
Sixty-five inactive, overweight to obese participants [body mass index (BMI) of
approximately 30 kg
Body composition analyses were performed and the blood was collected 1 week prior to the study, and 24 h directly after and 4 weeks after completion of the intervention. The training workload for each subject was determined before the first HIIT session. The participants were asked to maintain and not to change their usual daily habits during their participation in the study.
The study protocol was approved by the Bioethical Committee of the Regional Medical Society in Gdansk (approval number KB-28/17) and the study was conducted in accordance with the Declaration of Helsinki. All subjects provided written informed consent for the publication of any associated data after being informed about the procedures.
Body mass and composition (lean body mass, BMI, body fat, and visceral adipose
tissue) were determined using dual energy X-ray absorptiometry (DXA) with a Lunar
Prodigy whole-body scanner (GE HealthCare, Madison, WI, USA) and enCORE v16 SP1
software (version 3.1.9.4, Heinrich Heine University, Düsseldorf, Germany). Subjects were assessed using DXA in the morning, after an overnight
fast, prior to blood collection, usually within 1 h of arrival for clinical
assessment and after medical check-up. The day before each assessment, DXA was
calibrated using phantoms, according to the manufacturer’s guidelines. Scanning
mode was automatically chosen by the DXA apparatus. The subjects were exposed to
a radiation dose of approximately 2
Prior to the experiment, a pilot HIIT test was performed to establish individual
HR and the training workload. Each individual pedaled at 80–100 rpm with a load
of 1.5 W
Supervised HIIT sessions were performed according to a protocol of Little
et al. [24], three times a week for 2 weeks (6 sessions in total). In
the TR-WBC group, exercise training was performed at the Pomeranian Rheumatologic
Centre (Sopot, Poland) directly before WBC sessions 1, 3, 5, 6, 8, 9, and 11.
Each training comprised: (A) 3 min warm up at 50 W; (B) 10
WBC exposure took place at the Pomeranian Rheumatologic Centre. The center is
equipped with an electric cryochamber (Zimmer Medicine System, Cryochamber
ELECPOL, Poznan, Poland), located in a temperature- and humidity-controlled room.
The study schedule involved 10 treatments over 2 weeks, with a 2-day rest during
the weekend. Sessions took place at the same time of day (in the morning, between
8:30 AM and 9:00 AM, after a light breakfast). In the TR-WBC group, the WBC
session was conducted directly after the HIIT session, after careful sweat
removal from the body by wiping. During WBC, the participants were minimally
dressed (e.g., bathing suit, socks, clogs, headband, and a surgical mask), spent
30 s in a vestibule at –60
Blood samples were collected by standard venipuncture by a trained nurse, before
the study protocol was initiated, at the completion of the intervention, and 4
weeks after the completion of the intervention. However, most participants from
the TR group did not attend the sampling at the third time point; therefore, only
participants from the TR-WBC group (n = 35) were considered in the ensuing
analysis (Fig. 1). At each sampling time, 14 mL of blood was drawn into two plain
serum and two K
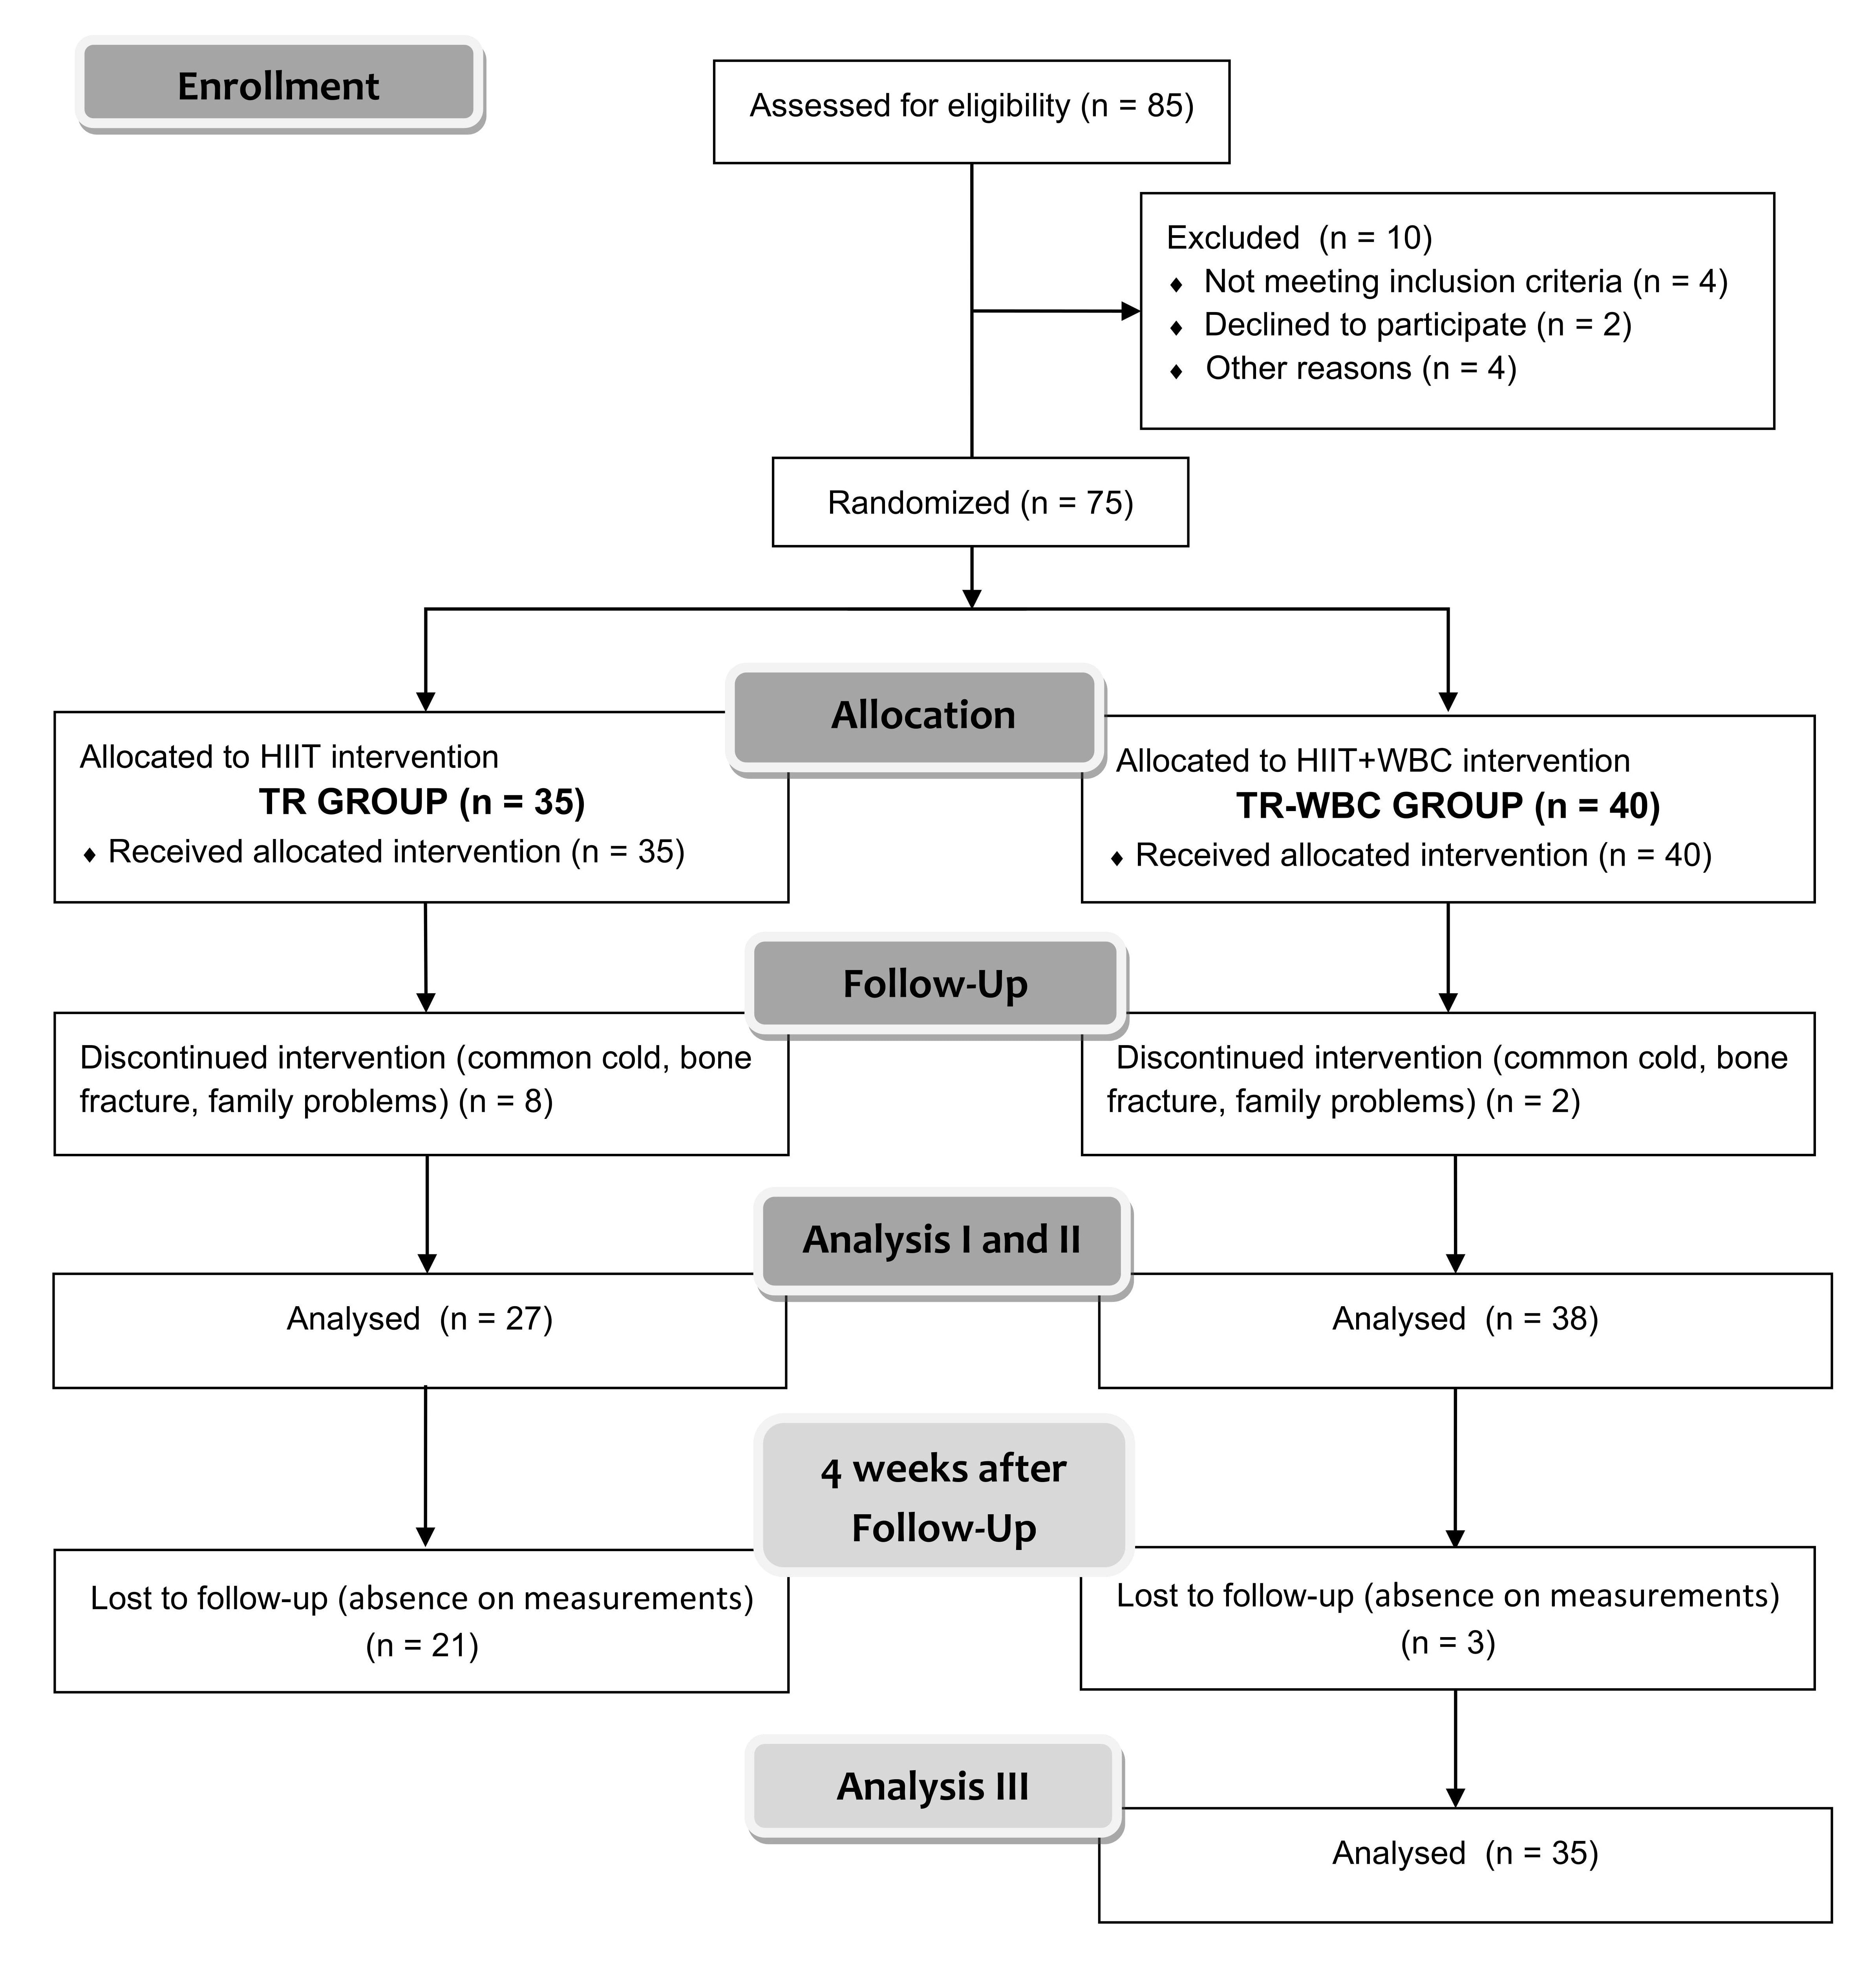 Fig. 1.
The schedule of examinations. Analysis: (I) before protocol, (II) directly after protocol and (III) 4 weeks post finishing the whole experimental protocol only in training with whole-body cryotherapy group (TR-WBC).
The serum lipid profile [total cholesterol (TC), high-density lipoprotein (HDL),
low-density lipoprotein (LDL), and triglycerides (TG)] was determined by enzyme
immunoassays using commercial kits (Alpha Diagnostics, Warsaw, Poland). Glucose
levels were determined using Cobas 6000 analyzer (Roche Diagnostics, Warsaw,
Poland) according to the manufacturer’s instructions. Insulin levels were
assessed using an immunoassay kit (Diametra, catalog no. DKO076, Perugia, Italy).
The intra-assay coefficient of variation (CV) for insulin was
Serum FGF21 levels were determined by enzyme immunoassay using a commercial kit
(R&D Systems, Minneapolis, USA, catalog no. DF2100), following the
manufacturer’s recommendations. The detection limit was 8.69 pg
The levels of other mediators [adiponectin, C-peptide, ghrelin, gastric
inhibitory peptide (GIP), glucagon-like peptide 1 (GLP-1), glucagon, leptin,
resistin, and visfatin] were assayed using multiplex immunofluorescence
technology and Bio-Plex Pro Diabetes Assay Panels (Bio-Rad, USA, catalog no.
171A7002M for adiponectin and 171A7001M for others). The detection limits were
31.0 pg
The sample size of the study group was predetermined using power calculations
with the software G*power (version 3.1.9.4, Heinrich Heine University,
Düsseldorf) [26] (a priori repeated-measures, within–between
interaction;
Statistical analyses were performed using the statistics software package
Statistica v13.1 (TIBCO Software, Palo Alto, CA, USA). Shapiro-Wilk test was used
to assess the homogeneity of dispersion from normal distribution. Brown-Forsythe
test was used to evaluate the homogeneity of variance. Repeated measures analysis
of variance (rANOVA) was calculated. In case of a significant time
Anthropometric data are presented in Fig. 2. No significant differences were noted among the participants at baseline. The interventions did not affect the participants’ body composition.
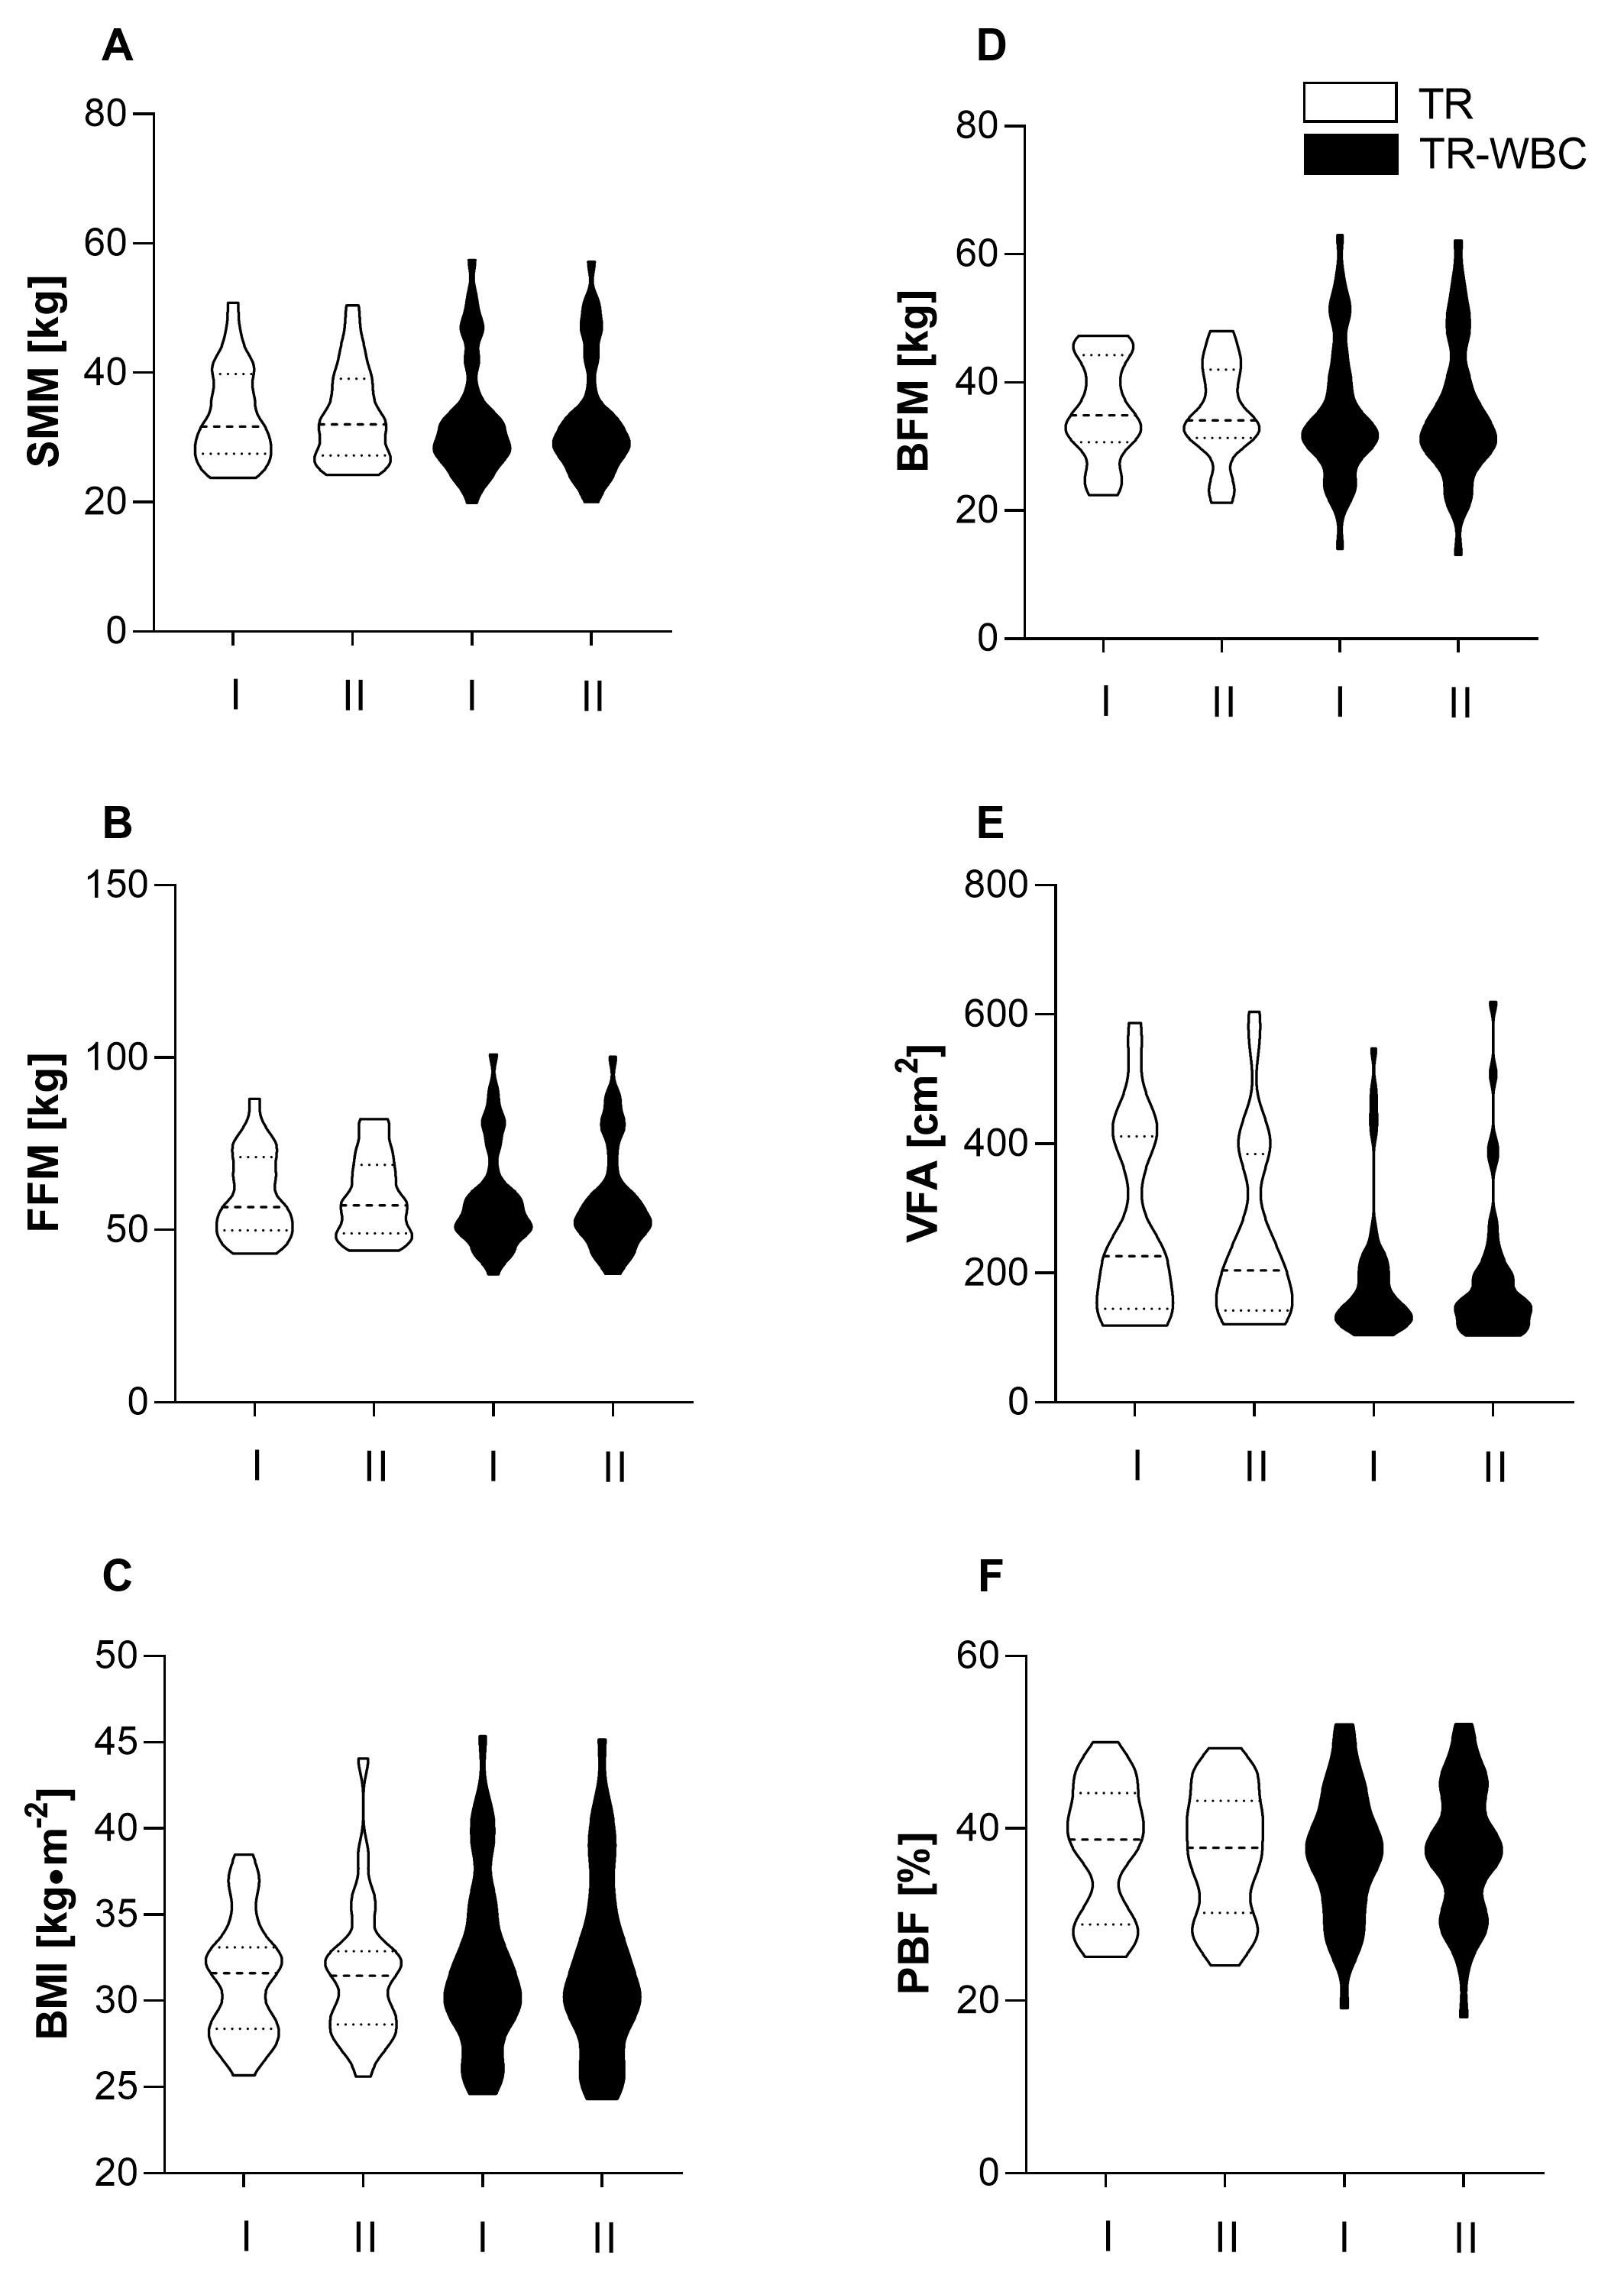 Fig. 2.
Anthropometric characteristics of participants. (A) Skeletal muscle mass (SMM). (B) Free fat mass (FFM). (C) Body mass index (BMI). (D) Body fat mass (BFM). (E) Visceral fat area (VFA) and (F) percent of body fat (PBF) recorded (I) before and (II) after experimental protocol in training group (TR; n = 27) and training with whole-body cryotherapy group (TR-WBC; n = 38). Data are presented as median and range.
The HIIT protocol, performed alone, lowered TG levels from 162.6
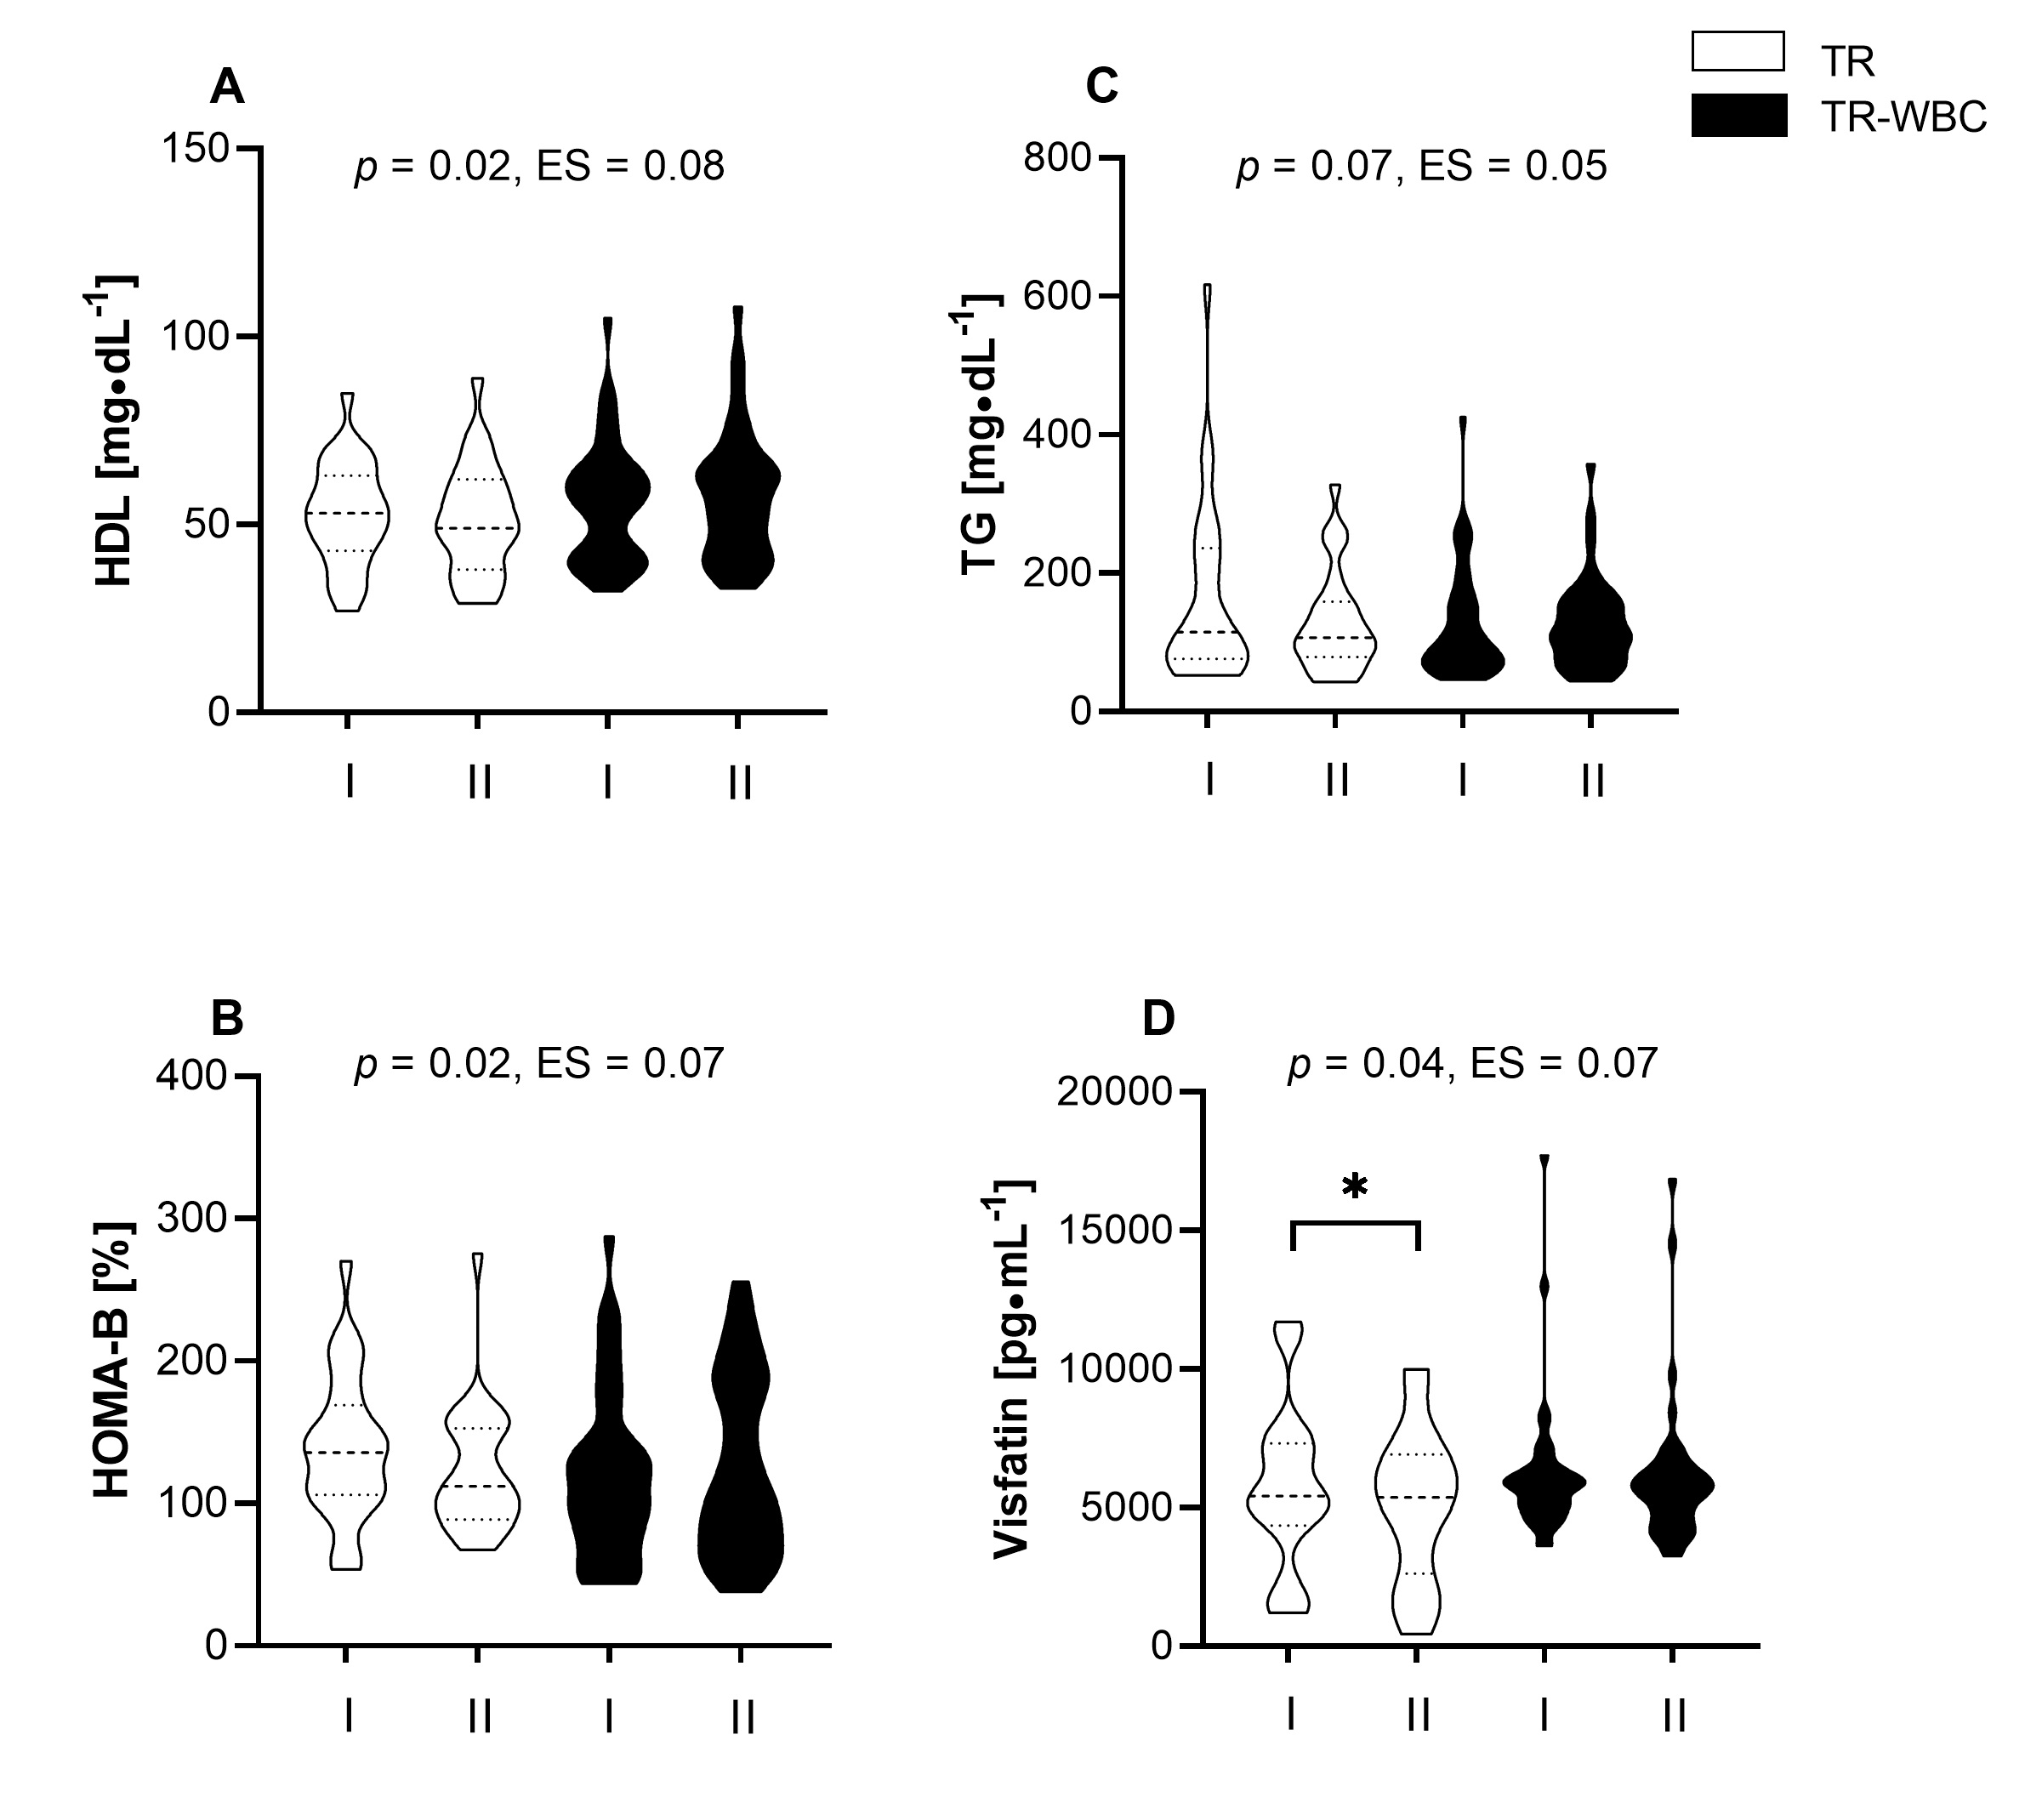 Fig. 3.
Changes in the concentration of selected metabolic
indicators. (A) High density lipoprotein cholesterol (HDL). (B) The level of
Homeostasis Model Assessment estimates
| TR | TR-WBC | ANOVA | ||||||||
| Before | After | 95% CI | Before | After | 95% CI | Group |
ES | |||
| TC [mg |
196.2 |
192.7 |
–3.56 | –11.96; 4.85 | 194.5 |
197.9 |
3.39 | –4.12; 10.91 | 0.22 | 0.02 |
| LDL [mg |
112.6 |
112.5 |
1.23 | –8.38; 10.84 | 113.8 |
114.7 |
0.93 | –5.39; 7.24 | 0.95 | 0.00 |
| Insulin [µIU |
17.5 |
16.1 |
–2.2 | –5.67; 1.27 | 18.3 |
17.6 |
–0.7 | –3.63; 2.24 | 0.50 | 0.01 |
| HOMA-S [%] | 106.5 |
114.2 |
7.66 | –11.56; 26.89 | 93.1 |
91.2 |
–1.87 | –13.1; 9.4 | 0.36 | 0.01 |
| HOMA-IR | 1.3 |
1.1 |
–0.17 | –0.46; 0.13 | 1.3 |
1.3 |
–0.05 | –0.2; 0.08 | 0.42 | 0.01 |
| Data are presented as mean | ||||||||||
| TR | TR-WBC | ANOVA | ||||||||
| Before | After | 95% CI | Before | After | 95% CI | Group |
ES | |||
| C-Peptide [pg |
1687.1 |
1457.8 |
–229.3 | –619.9; 161.4 | 1716.5 |
1678.4 |
–38.1 | –206.4; 1302 | 0.31 | 0.02 |
| Ghrelin [pg |
918.4 |
923.8 |
5.3 | –74.8; 85.5 | 601.9 |
657.7 |
55.8 | –15.3; 126.9 | 0.34 | 0.01 |
| GIP [pg |
430.1 |
392.3 |
–50.6 | –362.3; 261.1 | 224.0 |
243.1 |
19.1 | –54.8; 93.0 | 0.52 | 0.01 |
| GLP-1 [pg |
289.8 |
255.1 |
0.9 | –30.9; 32.7 | 297.4 |
294.9 |
–2.5 | –22.0; 16.9 | 0.85 | 0.00 |
| Glucagon [pg |
1087.0 |
1047.7 |
–39.3 | –108.8; 30.1 | 1413.8 |
1428.4 |
14.6 | –25.1; 54.4 | 0.15 | 0.03 |
| Leptin [pg |
13637.6 |
11736.5 |
–1901.1 | –4278.0; 475.8 | 11494.9 |
10766.7 |
–728.2 | –2051.7; 595.2 | 0.35 | 0.01 |
| Resistin [pg |
8311.8 |
7769.5 |
–542.3 | –1703.0; 618.4 | 8809.4 |
8777.9 |
–31.5 | –939.3; 876.3 | 0.48 | 0.01 |
| Irisin [ng |
26.1 |
24.1 |
–2.1 | –4.4; 0.2 | 23.4 |
24.6 |
1.1 | –2.4; 4.6 | 0.16 | 0.03 |
| Data are presented as mean | ||||||||||
| ∆HOMA-B [%] | ∆Glucose [mg |
∆FGF21 [pg | ||||
| TR | TR-WBC | TR | TR-WBC | TR | TR-WBC | |
| ∆C-peptide [pg |
0.74* | 0.69* | 0.10 | 0.26 | 0.10 | –0.13 |
| ∆GIP [pg |
0.46 | 0.33* | 0.14 | 0.34* | –0.13 | –0.33* |
| Values are Spearman correlation; *statistically significant correlations,
p | ||||||
The HIIT protocol resulted in a significant increase in FGF21 blood levels, from
191.0
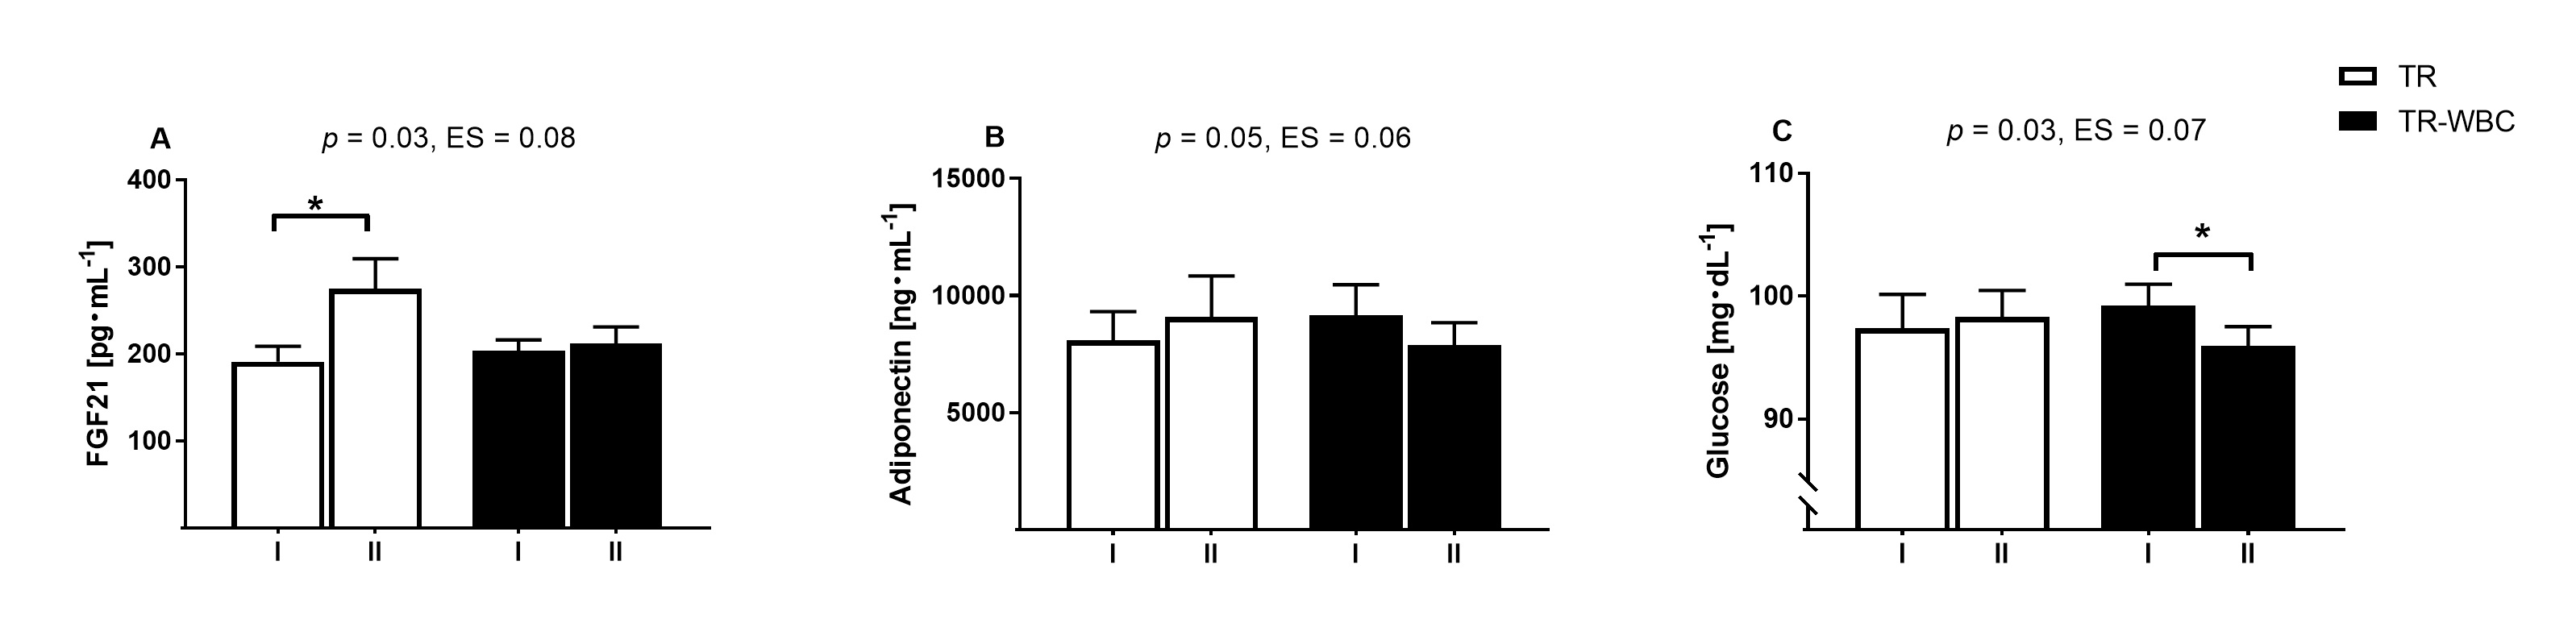 Fig. 4.
Changes in adipokines concentration and glucose level
before and after intervention. (A) Fibroblast growth factor 21 (FGF21). (B)
Adiponectin and (C) glucose recorded (I) before and (II) after experimental
protocol in training group (TR; n = 27) and training with whole- body cryotherapy
(TR-WBC; n = 38). Data are presented as mean
The HIIT protocol induced changes in the levels of proinflammatory cytokines,
namely, a drop in the visfatin from 5734.5
The combination of HIIT and WBC did not significantly alter the lipid profile (Table 1) but it improved glucose homeostasis indicators.
Nonetheless, the observed upward trend in HDL levels in the TR-WBC group (from
55.6
Of note, changes in TG (Fig. 3C) and FGF21 levels (from 204.0
Considering the diabetic panel markers, an upward trend in the levels of ghrelin
(TR-WBC: 8.5% vs. TR: –0.6%) and GIP (TR-WBC: 7.9% vs. TR:
–9.6%) was noted in the TR-WBC group, and the opposite was observed in the TR
group. The differences were not statistically significant (Table 2); however, in
the TR-WBC group,
Four weeks after the end of the training intervention, elevated skeletal muscle
mass (SMM) and free fat mass (FFM) were registered in the TR-WBC group
(p = 0.01 for both components, accordingly; Fig. 5A,B). At that time
point, the TC and HDL levels were significantly higher than the baseline levels
(194.5
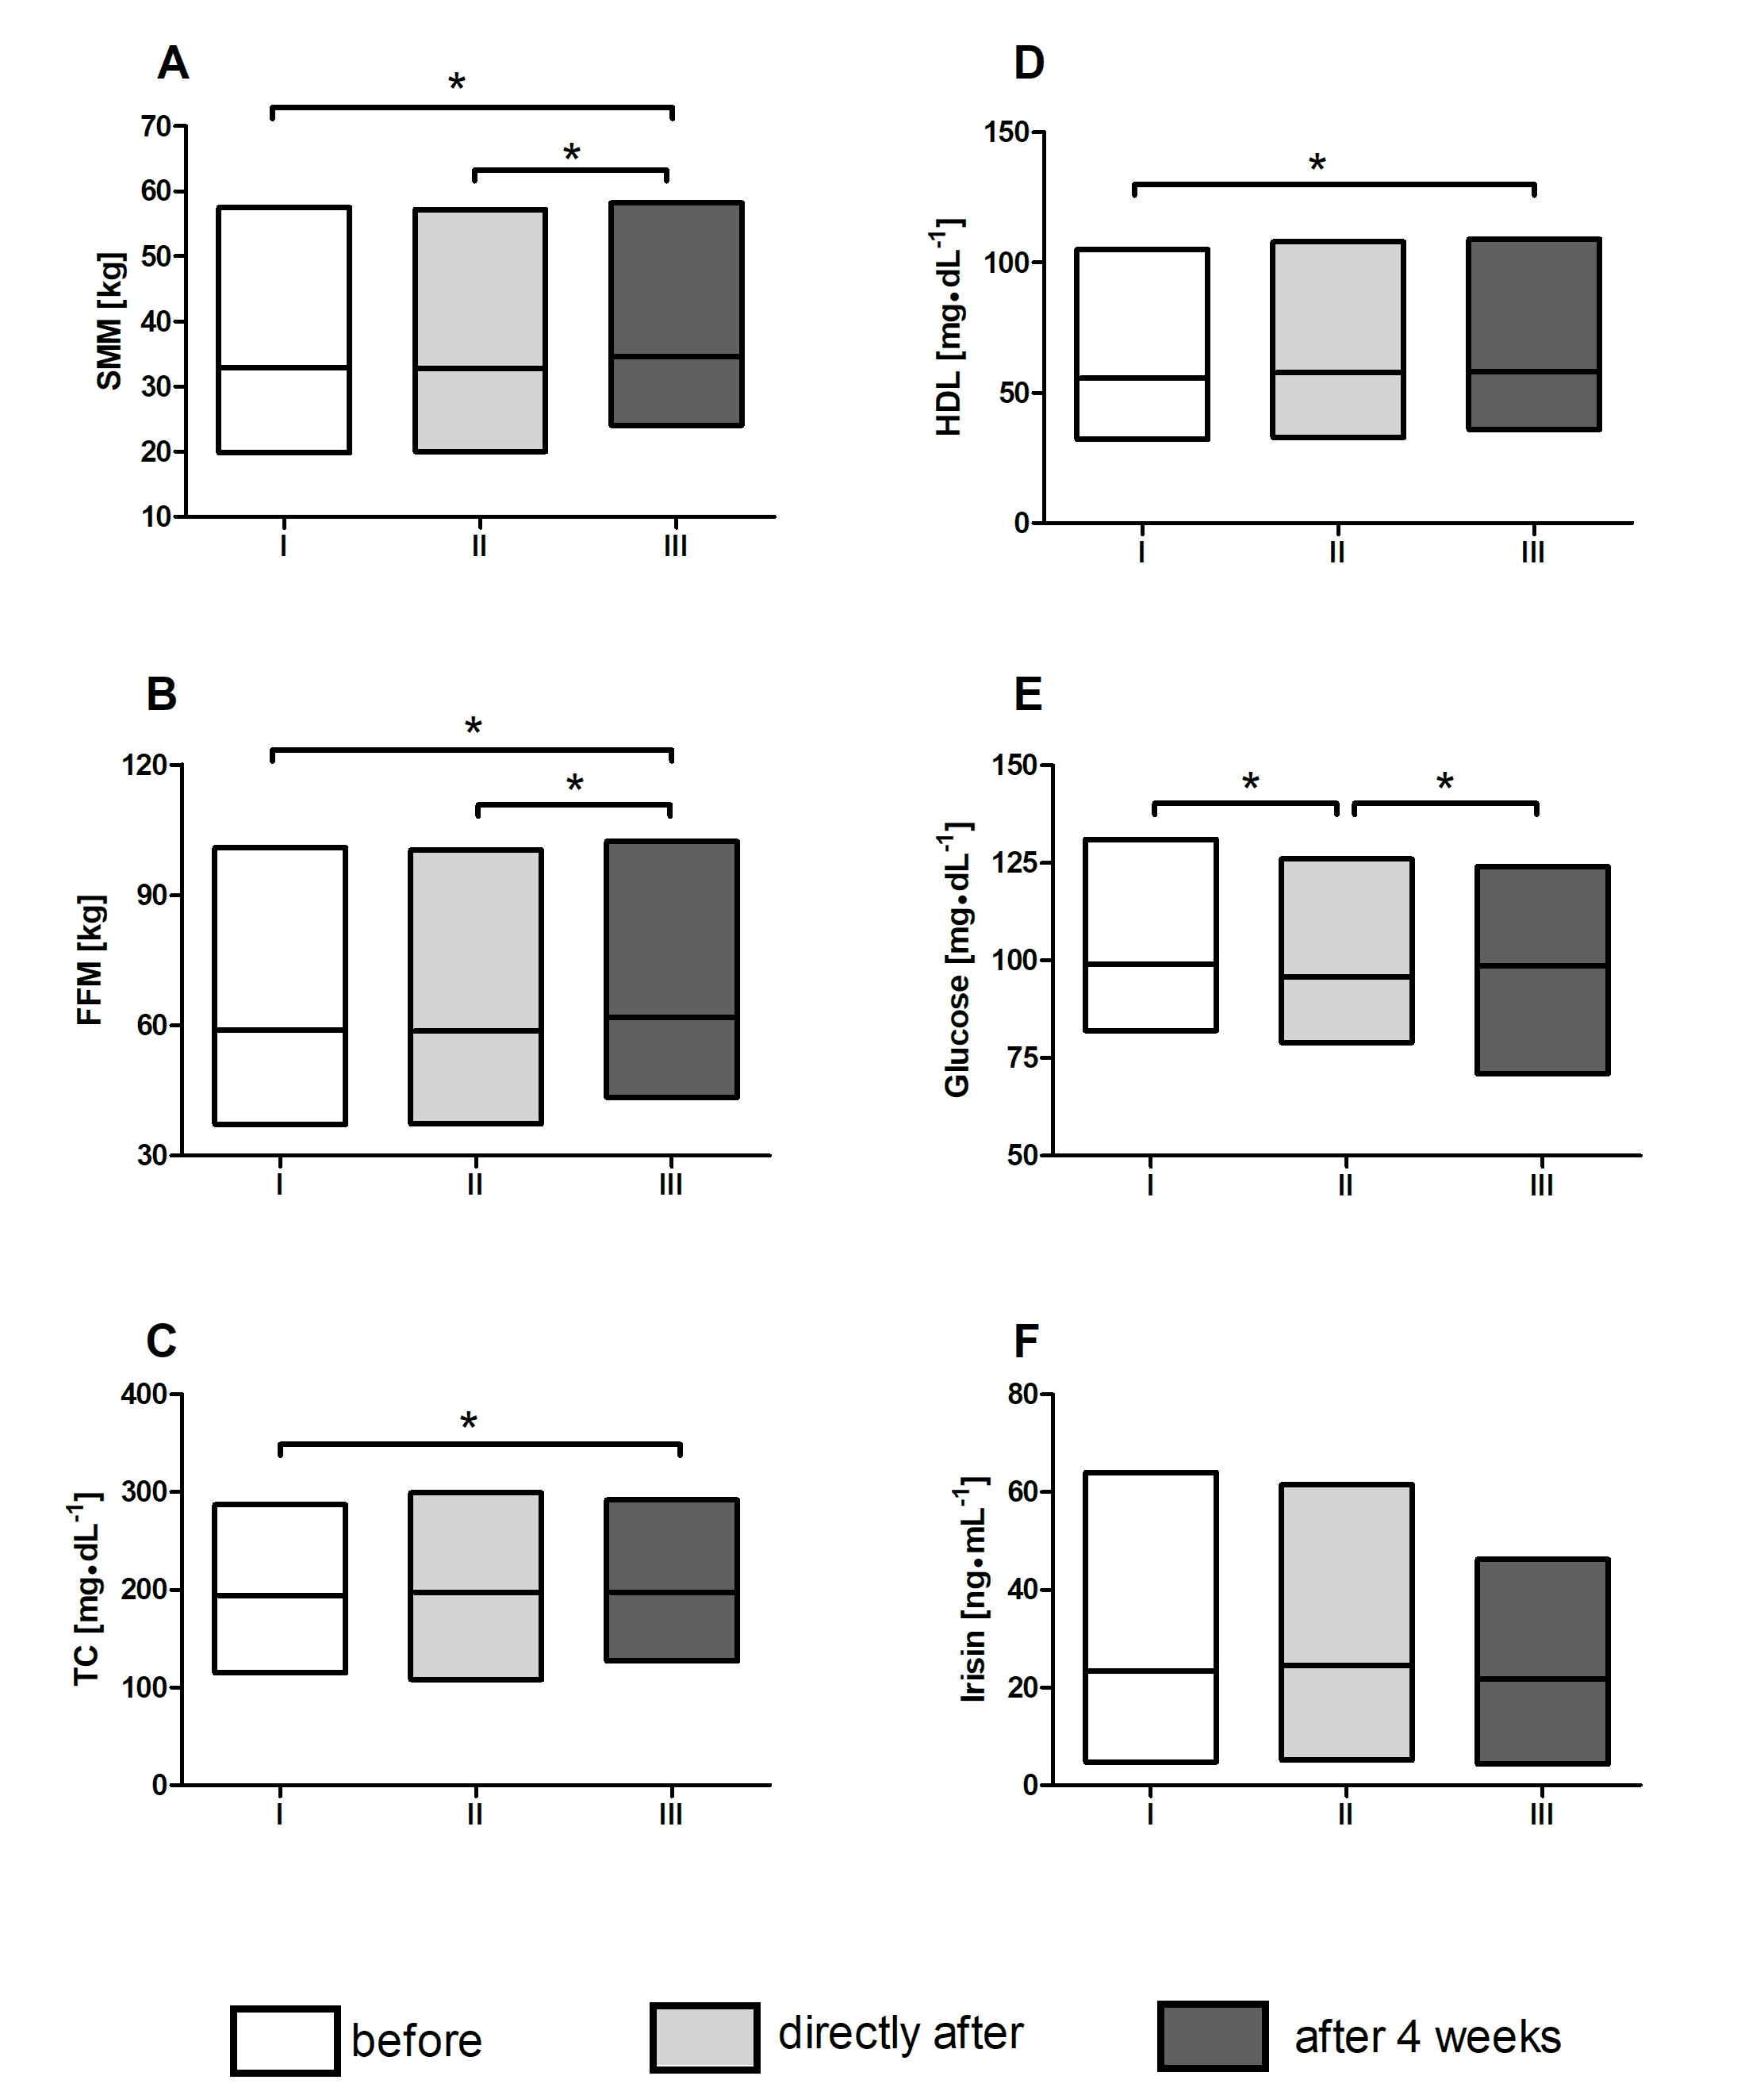 Fig. 5.
Changes of body composition and selected metabolic
indicators. Changes in the (A) skeletal muscle mass (SMM). (B) Free fat mass
(FFM). Concentration of (C) total cholesterol (TC). (D) High- density lipoprotein
cholesterol (HDL). (E) Glucose and (F) irisin at each point of blood collection:
(I) before protocol, (II) directly after protocol and (III) 4 weeks post
finishing the whole experimental protocol in training with whole-body cryotherapy
group (TR-WBC). Data are presented as mean, min and max value; *significant
differences between time point measurements, p
Physical exercise is an important and effective strategy for counteracting metabolic imbalance in overweight and obese individuals; this is of particular relevance in periods, such as the ongoing COVID-19 pandemic that sees overweight, obese and metabolically dysfunctional patients as one of the more vulnerable groups. In recent years, WBC has been described as a valuable form of physiotherapy because of its exercise-mimicking effects. However, as reported by different studies, WBC manifests its real potential only when combined with a physical exercise program [28, 29]. Accordingly, in the current study, we set out to determine the effect of HIIT in combination with WBC vs. HIIT alone, on FGF21 serum levels, adipo-myokine profile, and metabolic status of overweight to obese individuals as a preventative strategy against the most severe outcomes of SARS-CoV-2 infection.
Data presented in the current study only partially support the claim that the beneficial effects of WBC are fully realized only in combination with physical exercise. The main finding of the study is that 6 units of HIIT training (the TR intervention) suffice to cause a significant increase in FGF21 levels in obese inactive individuals. These changes were associated with an increase in the circulating levels of the anti-inflammatory adipokine adiponectin. At the same time, the metabolic profile improved, i.e., TG levels dropped and HOMA-B values improved. Of note, HIIT in conjunction with WBC did not induce such changes. As recently reported by Sun et al. [30], FGF21 acts as a hepatokine, adipokine, and myokine; however, the main tissue source of circulating FGF21 that mediates the effect of exercise is not known. Further, FGF21 responses to exercise are inconsistent, and different studies have reported a decrease [31], no change [32], and increase [33] in its levels upon exercise. Micielska et al. [34] demonstrated that 15 units of high-intensity circuit resistance training induce a drop and an increase in FGF21 levels. Only the drop was associated with an amelioration and impairment of cognitive function. The mechanisms underlying the diverse effects of exercise remain unclear and warrant further research.
Physical inactivity exerts a catabolic effect on muscle tissue [35]. Data on the
effect of physical inactivity alone on the blood levels of FGF21 are limited.
However, Asle et al. [36] reported that FGF21 levels increase after 12
weeks of HIIT (3 sets of 10
The high-intensity workload featured in the HIIT protocol applied in the current
study to overweight to obese inactive individuals, could be a stress-generating
factor contributing to the increase in blood FGF21 levels, with the growth factor
most likely released from the muscle. On the other hand, FGF21 expression in the
muscle is reportedly elevated during mitochondrial dysfunction, and protects
against obesity and insulin resistance [40, 41]. We here observed a strong,
positive correlation between the reduction of HOMA-B values and the downward
trend of C-peptide levels in the TR group participants. The changes in HOMA-B
values were significantly different from those in the TR-WBC group, where the
FGF21 levels remained unchanged. C-peptide is commonly used as a marker of
insulin resistance and metabolic syndrome [42]. The rate of C-peptide secretion
is more constant than that of insulin and, hence, it is a reliable marker of
pancreatic
The increase in FGF21 levels may be also caused by its enhanced expression in the liver [44] and white adipose tissue [45]. Indeed, liver-derived FGF21 improves glucose tolerance [46] and enhances oxidation of free fatty acids [47]. In the TR group, we observed a downward trend in the TG levels, while glucose levels remained unchanged. Therefore, we cannot rule out the possibility that the liver was the main source of FGF21 under these conditions. This response differed from the effect in the TR-WBC group. Savikj et al. [48] reported that the effect of HIIT training on blood glucose levels depends on the time of day the training is performed. Specifically, in their study, afternoon HIIT was more effective in improving blood glucose levels in men with T2DM than morning HIIT; by contrast, morning HIIT had an opposite effect, increasing blood glucose levels [48]. In the current study, the training sessions took place in the morning but we did not observe any changes in glucose levels. However, it is worth noting that blood glucose levels significantly decreased in the TR-WBC group. Hence, the beneficial changes in glucose homeostasis noted in this group may be associated with the activation of the sympathetic nervous system either by cold exposure [49, 50] or by physical activity. We have previously reported that changes in glucose levels may be related to fluctuating FGF21 levels [16]. Fisher et al. [51] reported that cold exposure induces expression of endogenous FGF21 in different adipose depots or browning of white adipose tissue (WAT). FGF21 was originally described as a factor that enhances insulin-independent glucose uptake in cultured adipocytes, acting via glucose transporter 1 (Glut1) [46]. Therefore, FGF21 can increase the uptake of glucose by adipose tissue in an autocrine manner, independently of insulin, causing its concentration to drop.
In the current study, cold exposure in conjunction with HIIT led to an increase in HDL cholesterol levels but did not affect TG levels. This partially agrees with previous observations of Lubkowska et al. [52], who noted a significant decrease of the LDL/HDL ratio after at least 10 WBC sessions. In the current study, changes in HDL levels were significantly different in the two experimental groups. Since HDL cholesterol levels did not change in the TR group, it is likely that WBC contributed to the changes in the TR-WBC group lipid profile. Similar, Rymaszewska et al. [53] showed that WBC positively affects the lipid profile, especially in individuals with high BMI. TG, TC, and LDL levels were reduced after WBC [53]. Consequently, it has been suggested that cryotherapy could be an effective treatment for lipid disorders.
Together with increased FGF21 levels, we here observed an increase in adiponectin levels in the TR group. While adiponectin is an adipokine [54], it also acts as a myokine as it is expressed by skeletal muscle during contraction [55], similarly to the previously described mediator, FGF21. Based on the data from a mouse model, FGF21 regulates adiponectin expression in adipocytes in endocrinal manner, de facto coupling FGF21 activity in WAT with metabolic effects in the liver and muscle [56]. Further, circulating FGF21 upregulates adiponectin expression in different fat depots (subcutaneous and visceral adipose tissue) and serum level in obese mouse, as a protective mechanism against systemic insulin resistance [57]. In the TR group in the present study, the increase in adiponectin and FGF21 levels was accompanied by a decrease in HOMA-B values, and a downward trend of C-peptide levels. Furthermore, we noted a decrease in proinflammatory adipokine levels (visfatin, leptin, and resistin) in the TR group. However, only changes in visfatin levels were statistically significant in comparison with those in the TR-WBC group.
Visfatin levels increase with obesity and elevated BMI [58]. In a recently
published review, Kumari and Yadav [58] concluded that visfatin modulates
obesity-related pathophysiological activities, contributing to the development of
disease, such as diabetes (by regulating pancreatic
Irisin is another factor that regulates glucose homeostasis [63]. It inhibits the development of obesity-related inflammatory phenotype in adipocytes and macrophages in vitro[64]. Accordingly, we evaluated irisin and inflammatory marker levels in the current study. Levels of circulating irisin are modulated by diet, obesity, exercise, and pharmacological agents [65]. Of note, Dulian et al. [66] showed that resting irisin levels increase in response to WBC in obese subjects. Nevertheless, in the current study, 10 sessions of WBC combined with HIIT, and HIIT alone, did not impact circulating levels of this myokine.
Incretins, including GIP and GLP-1, were also assayed herein, since their
secretion and activity are dysregulated in obesity and diabetes [67]. Incretins
are hormones that regulate insulin and glucagon secretion by pancreatic cells in
a glucose-dependent manner. Despite the significant decrease in blood glucose
levels in the TR-WBC group, no significant changes in GIP, GLP-1, or glucagon
levels were detected. These observations are in line with a report of Hindsø
et al. [68], who showed that fasting and oral glucose-stimulated
incretins levels are not affected in inactive and overweight to obese individuals
after 6 weeks of low-volume 3-time per week HIIT. However, in the current study,
an upward tendency in GIP levels was apparent in the TR-WBC group. This was
opposite to the changes observed in the TR group. A similar tendency was observed
for glucagon levels in the TR (a decrease) and TR-WBC (an increase) groups.
Although the differences between the groups were not statistically significant,
it is important to note that changes in GIP levels were positively correlated
with changes in glucose levels in the TR-WBC group. Hence, an increase in GIP
levels either causes a significant reduction in blood glucose levels or the
relationship is opposite. In rat models, hyperglycemia reduces GIP receptor
expression in
Ghrelin is a peptide-hormone that, similarly to GIP and GLP-1, is mainly
secreted by enteroendocrine cells [72], and plays an important role in the
development of obesity and metabolic-related disorders. It also promotes feeding
in cold environments [73, 74], a response associated with an increase in ghrelin
levels and a reduction in leptin levels [74, 75]. In the current study, ghrelin
levels were not affected in a statistically significant manner by either
intervention; however, we observed a tendency of ghrelin blood levels to increase
following WBC. This observation was partially in agreement with that of Kojima
and co-workers [76], who demonstrated that post-exercise WBC (–140
The current study has some limitations that should be addressed in the future. First, we did not assess the effects of WBC alone in the current study. This can be addressed by including a third, WBC-only, group in the study design, and comparing the effects of WBC on the various metabolic parameters with those of other interventions. Another potential limitation is the choice of the evaluated analytes. It is possible that the investigated panel of mediators, although broad, did not provide a complete overview of the body’s response to the tested interventions. Although we detected some metabolic and endocrine changes, it is possible that the effect would have been more pronounced upon a longer training program and, above all, additional WBC sessions. Hence, we are unable to recommend the minimum therapeutic number of cold exposures at this time. Secondly, we did not conduct any monitoring of changes in participants’ fitness level during and at the end of HIIT protocol which could have revealed more granular variation in the individual cardiorespiratory response to exercise protocol. On the other hand, in preliminary phase of our experiment, based on previously published studies [9, 78], we tried to select a group uniform in terms of body composition and the level of physical activity. Finally, we did not explore the mechanisms underlying the observed effects of cryostimulation and HIIT on the metabolic homeostasis.
Still, to the best of our knowledge, this study is the first to assess long-term effects of cold exposure applied in conjunction with physical training on adipo-myokine profile, and metabolic status of overweight to obese individuals. The findings presented herein indicate that the observed decrease in glucose levels induced by HIIT–WBC was reversed 1 month after the treatment, as a return to daily habits eroded the beneficial effects of the intervention.
To summarize, the HIIT protocol, both alone and in combination with WBC, affected the metabolic indicators and myokines’ concentrations. These impacts manifested differently, likely due to the different underlying mechanisms. Training alone caused significant changes in FGF21 concentration, whereas in combination with WBC, it abolished this effect. Similarly, different responses in adiponectin were observed; it increased in response to the HIIT alone but it decreased in response to the combination of HIIT and WBC. Moreover, the combined approach of training and WBC induced beneficial, yet temporary, effects on glucose concentration and glucose homeostasis among obese participants (Fig. 6). In practice, although short-term, the presented effects support the use of pro-health procedures, such as physical activity and cold exposure, as preventative strategies to limit the severe effects of other incident diseases.
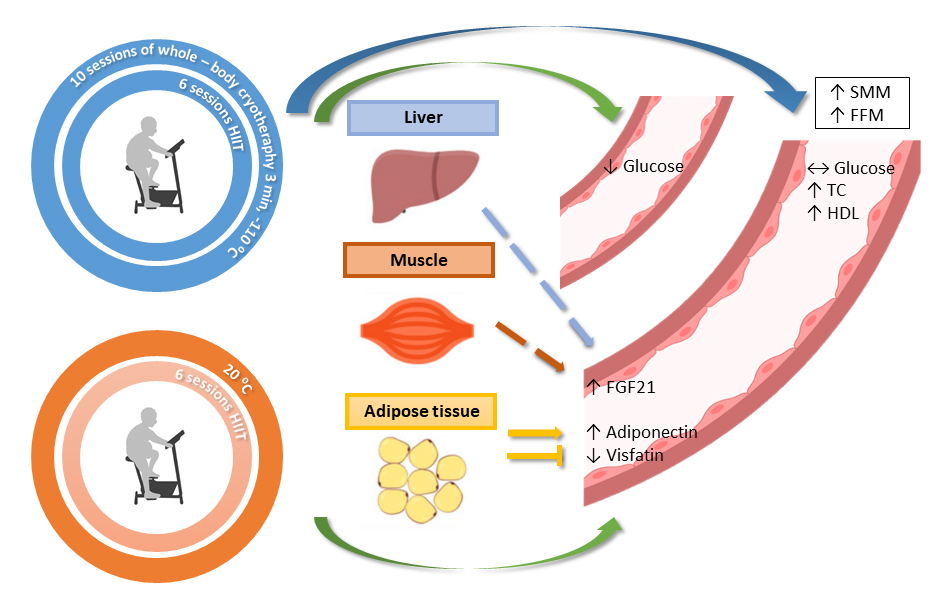 Fig. 6.
Graphical conclusion of induced changes recorded in blood and body mass composition. Green arrows indicate short-term effects, purple long-term effects observed 4 weeks after the end of the intervention. The dashed arrows indicate the likely source of FGF21 (liver or muscle as a possible) released to bloodstream. The drop-in glucose level in the training with whole-body cryotherapy group turned out to be short-term effect and did not last until 4 weeks after the end of the protocol. HIIT, high intensity interval training; FGF21, fibroblast growth factor 21; TC, total cholesterol; HDL, high-density lipoprotein cholesterol; SMM, skeletal muscle mass; FFM, free fat mass.
Conceptualization—MKF and EZ; methodology—MKF, ERF and VS; validation—MKF, KM, SP and GL; formal analysis—JK; investigation—MKF, ERF, JJ and KM; resources—JJ and AB; data curation—MKF; writing-original draft preparation—MKF, EZ; writing-review and editing—MKF, AB, SP, GL and EZ; visualization—MKF and JK; supervision—JK and VS; project administration—EZ; funding acquisition—EZ All authors have read and agreed to the published version of the manuscript and agree with the order of presentation of the authors.
The study protocol was approved by the Bioethical Committee of the Regional Medical Society in Gdansk (approval number KB-28/17) and was conducted in accordance with the Declaration of Helsinki. All subjects provided written informed consent for the publication of any associated data after being informed about the procedures.
The authors would like to express thanks to the medical staff of the hospital where the cold exposure took place, especially Aleksandra Kasińska and Iwona Piekarska, for their help in con-ducting the research, and all of the participants for their engagement in the experiment.
This work has been funded by a grant from National Science Centre OPUS 13, Project No 2017/25/B/NZ7/02309.
The authors declare no conflict of interest.
HIIT, high intensive interval training; WBC, whole-body cryotherapy; TR,
training group; TR-WBC, training supported by WBC group; FGF21, fibroblast growth
factor 21; HOMA-IR, The Homeostasis Model Assessment estimates insulin
resistance; HOMA-