


 , Bo Gao 1, Li-Jun Ma 2, Xi-bin Gao 1,*
1 Department of Neurology, The Affiliated Hospital of Yan'an University, 716000 Yan'an, Shaanxi, China
2 Department of Laboratory Medicine, The Affiliated Hospital of Yan'an University, 716000 Yan'an, Shaanxi, China
Abstract
Existing research on the link between Life's Essential 8 (LE8) and the risk of Parkinson's disease (PD) remains limited. This study aimed to elucidate how LE8 relates to PD risk among USA adults aged 40 and above.
Data were derived from the 2005–2018 National Health and Nutrition Examination Survey (NHANES). Propensity score matching (PSM) was employed to control for selection bias. Multivariable logistic regression was applied to assess the association between LE8 and PD prevalence, while restricted cubic spline (RCS) modeling was adopted to explore potential relationships. Additionally, subgroup analyses were conducted to further examine the connection between LE8 and PD.
A total of 18,270 participants were included, among whom 259 reported having PD. An inverse association was observed between LE8 and PD. Prior to matching, the odds ratio (OR) for per 1 point increase in LE8 was 0.98, and 0.97 after matching. Compared with individuals with low LE8 scores (<50), those with moderate scores (50–79) had a PD OR of 0.62 before matching and 0.52 after matching. Participants with high LE8 scores (≥80) observed a PD OR of 0.43 prior to matching and 0.32 post-matching. RCS curves suggested a non-linear inverse trend. Subgroup analyses revealed a consistent inverse association between LE8 scores and PD risk across the majority of strata.
Among adults aged 40 and older, LE8 was inversely correlated with PD prevalence. Given the cross-sectional design, causal relationships cannot be inferred; however, the findings suggest that lifestyle modifications may aid in PD prevention and warrant further investigation in prospective studies.
Keywords
- Parkinson's disease
- cardiovascular health
- health behavior
- cross-sectional studies
- propensity score
As a prevalent neurodegenerative disorder, Parkinson’s disease (PD) is a
neurodegenerative disorder marked by the selective deterioration of dopaminergic
neuronal pathways. This neuronal loss causes severe disability and poses
significant public health challenges worldwide due to its motor, non-motor, and
cognitive symptoms [1, 2, 3]. PD, as the second most prevalent neurodegenerative
disorder worldwide, is second to Alzheimer’s disease. Over the last 20 years, its
incidence and prevalence have risen rapidly, making PD the fastest-growing
neurological condition globally [4]. Research shows that the primary cause of PD
involves an intricate interplay of genetic and environmental factors [5, 6].
Unlike genetic factors, which remain stable, environmental factors are subject to
change over time. For example, lifestyle changes in recent decades have
contributed to a rise in obesity, metabolic syndrome, insulin resistance, and
chronic inflammation, all of which are closely linked to the development and
progression of PD [7]. Moreover, Western dietary patterns and alterations in gut
microbiota may drive PD-related neurodegeneration via the gut-brain axis,
involving the transport of
In 2010, the American Heart Association introduced a framework known as “Life’s Simple 7” (LS7), comprising seven key metrics—three behavioral factors and four physiological indicators—designed to evaluate and promote cardiovascular health (CVH) at both individual and population levels. The components of LS7 include dietary habits, tobacco use, physical activity, body mass index (BMI), arterial blood pressure, serum cholesterol, and fasting plasma glucose [9]. Over time, the AHA recognized sleep health as a crucial component, leading to the development of a novel algorithm, scoring from 0 to 100, to quantify each metric, now termed “Life’s Essential 8” (LE8). This approach comprehensively takes into account health behaviors, metabolic factors, and individual differences [10]. Evidence from previous studies indicates that maintaining optimal LS7 scores may reduce the risk of various chronic illnesses [11, 12, 13]. Emerging research suggests that LE8 can more effectively correlate with the onset and progression of numerous diseases [14, 15, 16, 17, 18].
Although LE8 has demonstrated significant associations and potential in research on heart disease, stroke, and various chronic conditions, its connection with PD remains poorly understood. Given the scarcity of systematic studies on the connection between LE8 and PD, the present work seeks to address this gap using cross-sectional data.
Conducted in the USA, National Health and Nutrition Examination Survey (NHANES) is a nationally representative, ongoing cross-sectional survey aimed at monitoring health and nutritional status. Utilizing a stratified, multistage probability design, NHANES collects nationally representative health data on a biennial basis. Initial data are collected through structured, in-person interviews at participants’ homes, followed by clinical assessments at Mobile Examination Centers, where biological specimens such as blood and urine are collected. The study protocol was reviewed and approved by the NCHS Research Ethics Review Board, and all individuals provided informed consent before participation.
For this analysis, data were obtained from seven NHANES survey cycles spanning 2005 to 2018. The initial sample comprised 26,282 individuals aged 40 years or older. Exclusion criteria included missing Life’s Essential 8 (LE8) metrics (n = 6291), absence of information regarding PD medication use (n = 14), and incomplete data on essential covariates (n = 1707). After applying these criteria, a total of 18,270 participants remained eligible for inclusion. Fig. 1 provides a detailed schematic of the participant selection process.
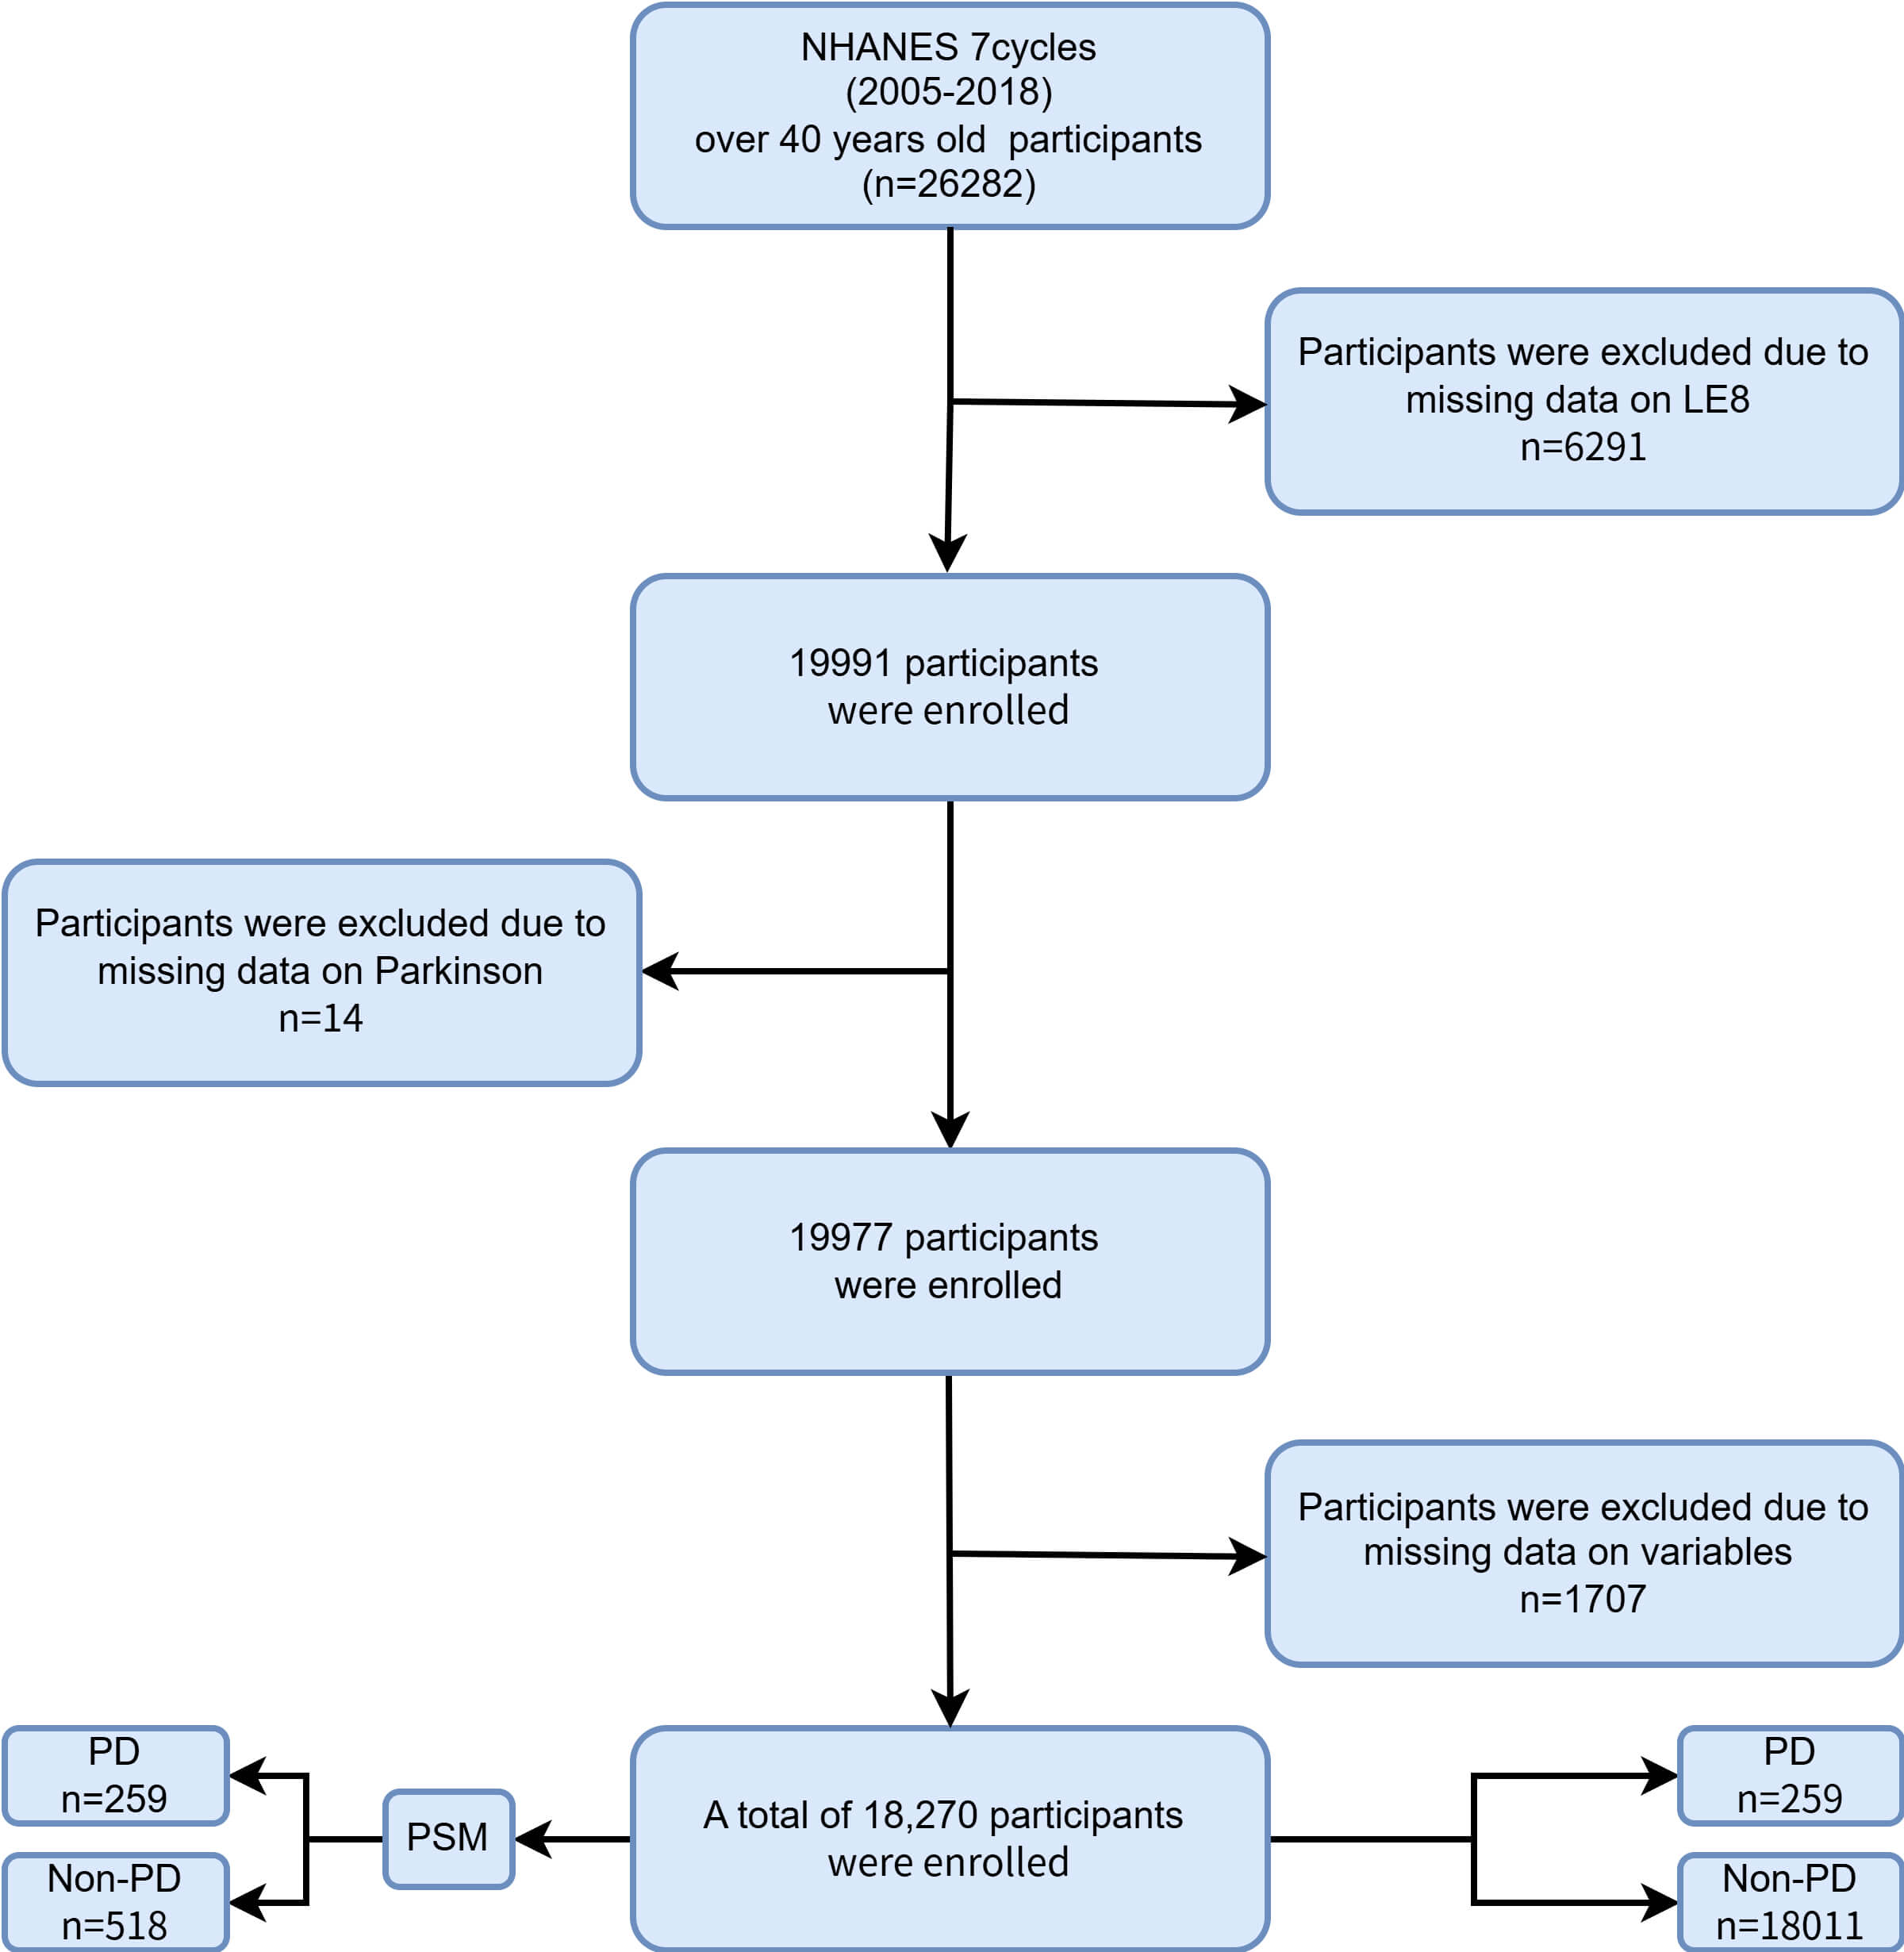 Fig. 1.
Flow chart of participant selection from NHANES 2005–2018. NHANES, National Health and Nutrition Examination Survey; LE8, Life’s Essential 8; PD, Parkinson’s disease; PSM, propensity score matching.
In the NHANES database, participants with PD were identified based on their use of “anti-Parkinson’s medications” [19, 20]. This identification method relied on responses to prescription medication questions. Participants receiving treatment for PD were identified as PD cases, whereas those not receiving such treatment were categorized as non-PD cases.
The LE8 construct comprises eight components, including four health behaviors: sleep duration, tobacco exposure, physical activity, and dietary quality as well as four biological metrics: systolic and diastolic blood pressure, fasting glucose levels, non-high-density lipoprotein (non-HDL) cholesterol, and BMI.
Participant information was primarily collected through self-report and included variables such as sleep duration, secondhand smoke exposure, active tobacco use, weekly physical activity levels, medication use, dietary habits, and diabetes status. Dietary quality was evaluated using the Healthy Eating Index–2015 (HEI–2015). In addition, anthropometric and laboratory measurements-including height, weight, blood pressure, and fasting glucose-were obtained in accordance with NHANES standardized procedures.
BMI was calculated as weight (kg) divided by the square of their height (m2). Blood pressure readings-including both systolic and diastolic values-were obtained by calculating the mean of three consecutive measurements. Levels of non-HDL cholesterol were estimated by subtracting HDL cholesterol from the total cholesterol concentration. Venous blood specimens were collected and transported to certified laboratories for biochemical analysis, including assessments of fasting plasma glucose, lipid panels, and glycated hemoglobin (HbA1c).
The scoring methodology for LE8, applied to NHANES data, is summarized in Table 1. Each of the eight components was assigned a value ranging from 0 to 100, and the overall LE8 score was computed as the arithmetic mean of these individual scores. A higher total score reflected more favorable CVH. For analytical purposes, LE8 scores were stratified into three categories: poor CVH (0–49), intermediate CVH (50–79), and ideal CVH (80–100) [21].
| Domain | CVH Metric | Measurement | Quantification and Scoring of CVH Metric | |
| Health Behaviors | Diet | Healthy Eating Index-2015 diet score percentile | Quantiles of DASH-style diet adherence | |
| Scoring (Population): | ||||
| Points | Quantile | |||
| 100 | ||||
| 80 | 75th–94th percentile | |||
| 50 | 50th–74th percentile | |||
| 25 | 25th–49th percentile | |||
| 0 | 1st–24th percentile (bottom/least ideal quartile) | |||
| Physical activity | Self-reported minutes of moderate or vigorous physical activity per week | Metric: Minutes of moderate (or greater) intensity activity per week | ||
| Scoring: | ||||
| Points | Minutes | |||
| 100 | ||||
| 90 | 120–149 | |||
| 80 | 90–119 | |||
| 60 | 60–89 | |||
| 40 | 30–59 | |||
| 20 | 1–29 | |||
| 0 | 0 | |||
| Nicotine exposure | Self-reported use of cigarettes or inhaled nicotine-delivery system | Metric: Combustible tobacco uses and/or inhaled NDS use; or secondhand smoke exposure | ||
| Scoring: | ||||
| Points | Status | |||
| 100 | Never smoker | |||
| 75 | Former smoker, quit | |||
| 50 | Former smoker, quit 1– | |||
| 25 | Former smoker, quit | |||
| 0 | Current smoker | |||
| Subtract 20 points (unless score is 0) for living with active indoor smoker in home | ||||
| Sleep health | Self-reported average hours of sleep per night | Metric: Average hours of sleep per night | ||
| Scoring: | ||||
| Points | Level | |||
| 100 | 7– | |||
| 90 | 9– | |||
| 70 | 6– | |||
| 40 | 5– | |||
| 20 | 4– | |||
| 0 | ||||
| Health Factors | Body mass index | Body weight (kg) divided by height squared (m2) | Metric: Body mass index (kg/m2) | |
| Scoring: | ||||
| Points | Level | |||
| 100 | ||||
| 70 | 25.0–29.9 | |||
| 30 | 30.0–34.9 | |||
| 15 | 35.0–39.9 | |||
| 0 | ||||
| Blood lipids | Plasma total and HDL-cholesterol with calculation of non-HDL-cholesterol | Metric: Non-HDL-cholesterol (mg/dL) | ||
| Scoring: | ||||
| Points | Level | |||
| 100 | ||||
| 60 | 130–159 | |||
| 40 | 160–189 | |||
| 20 | 190–219 | |||
| 0 | ||||
| If drug-treated level, subtract 20 points | ||||
| Blood glucose | Fasting blood glucose or casual hemoglobin A1c | Metric: Fasting blood glucose (mg/dL) or Hemoglobin A1c (%) | ||
| Scoring: | ||||
| Points | Level | |||
| 100 | No history of diabetes and FBG | |||
| 60 | No history of diabetes and FBG 100–125 (or HbA1c 5.7–6.4) | |||
| 40 | Diabetes with HbA1c | |||
| 30 | Diabetes with HbA1c 7.0–7.9 | |||
| 20 | Diabetes with HbA1c 8.0–8.9 | |||
| 10 | Diabetes with HbA1c 9.0–9.9 | |||
| 0 | Diabetes with HbA1c | |||
| Blood pressure | Appropriately measured systolic and diastolic blood pressure | Metric: Systolic and diastolic blood pressure (mm Hg) | ||
| Scoring: | ||||
| Points | Level | |||
| 100 | ||||
| 75 | 120–129/ | |||
| 50 | 130–139 or 80–89 (Stage I HTN) | |||
| 25 | 140–159 or 90–99 | |||
| 0 | ||||
| Subtract 20 points if treated level | ||||
LE8, Life’s Essential 8; CVH, cardiovascular health; HDL, high-density lipoprotein; FBG, fasting blood glucose; HbA1c, hemoglobin.
Drawing upon prior studies, a set of relevant covariates was identified for
adjustment, including demographic characteristics (age, sex, race/ethnicity,
education level, and marital status), socioeconomic status (PIR), and clinical or
behavioral factors such as BMI, tobacco use, alcohol intake, and histories of
stroke, myocardial infarction, and Cardiovascular Disease (CVD). Race and ethnicity were categorized into
five groups: non-Hispanic White, non-Hispanic Black, Mexican American, other
Hispanic individuals, and other racial or ethnic backgrounds. Educational level
was stratified as less than high school, high school graduate, or education
beyond high school. Marital status was classified as married or cohabiting, never
married, and widowed, divorced, or separated. The PIR was divided into tertiles:
Because NHANES features an elaborate design, we weighted all analyses in
accordance with its analytical procedures to make sure the sample accurately
mirrors the entire USA. population. In the baseline analysis, continuous
variables were summarized as means with standard errors, while categorical
variables were presented as proportions. Group comparisons for continuous data
were performed using the t-test, and for categorical variables using the
Three sequential logistic regression models were developed. Model 1 included no covariate adjustments. Model 2 controlled for demographic and socioeconomic factors, including age, sex, race/ethnicity, marital status, educational attainment, and income level. Model 3 extended the adjustment by additionally incorporating clinical history variables such as stroke, myocardial infarction, and CVD. To assess potential nonlinear associations between LE8 and PD, restricted cubic spline (RCS) functions were utilized for flexible curve fitting. Additionally, stratified subgroup analyses were carried out based on age, sex, race, educational background, income level, smoking and drinking behavior, and histories of stroke, heart attack, and CVD—both before and after PSM [28].
All statistical analyses were conducted in R (version 4.2.2; R Core Team, R
Foundation for Statistical Computing, Vienna, Austria). Data preparation utilized
the “nhanesR” package (https://rdrr.io/github/yikeshu0611/nhanesR), while the “survey” package was applied for weighted
logistic regression. Statistical significance was determined based on a
two-tailed p-value threshold of
Table 2 summarizes the baseline characteristics of NHANES participants from 2005 to 2018, stratified by PD status. After excluding individuals with incomplete key variables, 259 participants were identified as PD cases, accounting for 1.4% of the total sample. The average age of PD participants was 64.6 years, notably older than the non-PD group (59.6 years). A greater proportion of PD participants were female (55%) and non-Hispanic White (67%).
| Characteristic | Overall, n (%) | Non-PD, n (%) | PD, n (%) | p value | |
| N = 18,270 (100) | N = 18,011 (99) | N = 259 (1.4) | |||
| Age (years) | 59.7 (12.2) | 59.6 (12.2) | 64.6 (13.0) | ||
| Sex | 0.3 | ||||
| Female | 9441 (52) | 9299 (52) | 142 (55) | ||
| Male | 8829 (48) | 8712 (48) | 117 (45) | ||
| Race | |||||
| Non-Hispanic white | 8848 (48) | 8674 (48) | 174 (67) | ||
| Non-Hispanic black | 3844 (21) | 3810 (21) | 34 (13) | ||
| Mexican American | 2429 (13) | 2403 (13) | 26 (10) | ||
| Other Hispanic | 1610 (8.8) | 1591 (8.8) | 19 (7.3) | ||
| Other race | 1539 (8.4) | 1533 (8.5) | 6 (2.3) | ||
| Poverty Ratio | 0.003 | ||||
| 5047 (28) | 4958 (28) | 89 (34) | |||
| 1.3–3.5 | 7008 (38) | 6900 (38) | 108 (42) | ||
| 6215 (34) | 6153 (34) | 62 (24) | |||
| Education | 0.2 | ||||
| Over High School | 9546 (52) | 9414 (52) | 132 (51) | ||
| Below High School | 4452 (24) | 4378 (24) | 74 (29) | ||
| High School | 4272 (23) | 4219 (23) | 53 (20) | ||
| Marital Status | 0.2 | ||||
| Married/living with partner | 11,448 (63) | 11,296 (63) | 152 (59) | ||
| Widowed/divorced/separated | 5384 (29) | 5304 (29) | 80 (31) | ||
| Never married | 1438 (7.9) | 1411 (7.8) | 27 (10) | ||
| Smoke | 0.7 | ||||
| Never | 9321 (51) | 9190 (51) | 131 (50.6) | ||
| Former | 5698 (31.2) | 5621 (31.2) | 77 (29.7) | ||
| Now | 3251 (17.8) | 3200 (17.8) | 51 (19.7) | ||
| Alcohol | |||||
| Former | 3841 (21) | 3763 (20.9) | 78 (30.1) | ||
| Heavy | 2473 (13.5) | 2452 (13.6) | 21 (8.1) | ||
| Mild | 6869 (37.7) | 6769 (37.6) | 100 (38.6) | ||
| Moderate | 2543 (13.9) | 2521 (14) | 22 (8.5) | ||
| Never | 2544 (13.9) | 2506 (13.9) | 38 (14.7) | ||
| BMI | 0.022 | ||||
| Obese (30 or greater) | 7498 (41) | 7371 (40.9) | 127 (49) | ||
| Overweight (25 to |
6320 (34.6) | 6254 (34.7) | 6 (25.5) | ||
| Normal (18.5 to |
4237 (23.2) | 4174 (23.2) | 63 (24.3) | ||
| Underweight ( |
215 (1.2) | 212 (1.2) | 3 (1.2) | ||
| Stroke | |||||
| No | 17,194 (94.1) | 16,972 (94.2) | 222 (85.7) | ||
| Yes | 1076 (5.9) | 1039 (5.8) | 37 (14.3) | ||
| Heart Attack | |||||
| No | 17,088 (93.5) | 16,860 (93.6) | 228 (88) | ||
| Yes | 1182 (6.5) | 1151 (6.4) | 31 (12) | ||
| CVD | |||||
| No | 15,325 (83.9) | 15,153 (84.1) | 172 (66.4) | ||
| Yes | 2945 (16.1) | 2858 (15.9) | 87 (33.6) | ||
| LE8 | 63.28 (14.27) | 63.35 (14.26) | 58.43 (14.75) | ||
BMI, Body Mass Index; CVD, Cardiovascular Disease.
In the PD group, 42% had a poverty-income ratio between 1.3 and 3.5, while 51% reported education beyond high school. Marital status indicated that 59% were either married or living with a partner. Additionally, 51% of individuals with PD had never smoked, and 38% reported light alcohol intake. Nearly half (49%) were categorized as obese. The prevalence of stroke, myocardial infarction, and CVD in the PD group was 14%, 12%, and 34%, respectively. Notably, the mean LE8 score was lower in PD participants (58.43) than in non-PD participants (63.35).
After PSM matching, as shown in Table 3, a total of 777 participants were included: 259 in the PD group and 518 in the non-PD group. The PD and non-PD groups showed similarity across age, sex, race, education level, marital status, poverty level, BMI, smoking status, alcohol consumption, stroke, heart attack, and CVD. For LE8 scores, the non-PD group had a mean of 62.39, which was higher than the PD group’s mean of 58.43.
| Characteristic | Overall, n (%) | Non-PD, n (%) | PD, n (%) | p value | |
| N = 777 (100) | N = 518 (67) | N = 259 (33) | |||
| Age (years, meae (SD)) | 65.1 (12.5) | 65.4 (12.3) | 64.6 (13.0) | 0.41 | |
| Sex | 0.6 | ||||
| Female | 416 (54) | 274 (53) | 142 (55) | ||
| Male | 361 (46) | 244 (47) | 117 (45) | ||
| Race | 0.7 | ||||
| Non-Hispanic white | 532 (68) | 358 (69) | 174 (67) | ||
| Non-Hispanic black | 107 (14) | 73 (14) | 34 (13) | ||
| Mexican American | 74 (9.5) | 48 (9.3) | 26 (10) | ||
| Other Hispanic | 45 (5.8) | 26 (5.0) | 19 (7.3) | ||
| Other Race | 19 (2.4) | 13 (2.5) | 6 (2.3) | ||
| Poverty Ratio | 0.6 | ||||
| 251 (32) | 162 (31) | 89 (34) | |||
| 1.3–3.5 | 325 (42) | 217 (42) | 108 (42) | ||
| 201 (26) | 139 (27) | 62 (24) | |||
| Education | 0.9 | ||||
| Below High School | 214 (28) | 140 (27) | 74 (29) | ||
| High School | 158 (20) | 105 (20) | 53 (20) | ||
| Over High School | 405 (52) | 273 (53) | 132 (51) | ||
| Marital status | 0.3 | ||||
| Married/living with partner | 482 (62) | 330 (64) | 152 (59) | ||
| Never married | 68 (8.8) | 41 (7.9) | 27 (10) | ||
| Widowed/divorced/separated | 227 (29) | 147 (28) | 80 (31) | ||
| Smoke | 0.0046 | ||||
| Never | 392 (50) | 261 (50) | 131 (51) | ||
| Former | 239 (31) | 162 (31) | 77 (30) | ||
| Now | 146 (19) | 95 (18) | 51 (20) | ||
| Alcohol | 0.2 | ||||
| Former | 195 (25.1) | 117 (22.6) | 78 (30.1) | ||
| Heavy | 72 (9.3) | 51 (9.8) | 21 (8.1) | ||
| Mild | 304 (39) | 204 (39.4) | 100 (38.6) | ||
| Moderate | 75 (9.7) | 53 (10.2) | 22 (8.5) | ||
| Never | 131 (16.9) | 93 (18) | 38 (14.7) | ||
| BMI | 0.13 | ||||
| Obese (30 or greater) | 332 (44) | 210 (41) | 122 (49) | ||
| Overweight (25 to |
233 (31) | 169 (33) | 64 (26) | ||
| Normal (18.5 to |
187 (25) | 126 (25) | 61 (24) | ||
| Underweight ( |
8 (1.1) | 5 (1.0) | 3 (1.2) | ||
| Stroke | |||||
| No | 667 (86) | 445 (86) | 222 (86) | ||
| Yes | 110 (14) | 73 (14) | 37 (14) | ||
| Heart Attack | |||||
| No | 684 (88) | 456 (88) | 228 (88) | ||
| Yes | 93 (12) | 62 (12) | 31 (12) | ||
| CVD | 0.7 | ||||
| No | 508 (65) | 336 (65) | 172 (66) | ||
| Yes | 269 (35) | 182 (35) | 87 (34) | ||
| LE8 (meae (SD)) | 61.07 (14.43) | 62.39 (14.10) | 58.43 (14.75) | ||
Table 4 displays the associations between LE8 scores and PD prevalence across the three logistic regression models.
| Model | Characteristic | Unmatching | Matching | |||
| OR (95% CI) | p-value | OR (95% CI) | p-value | |||
| Model 1 | LE8 | 0.98 (0.97, 0.98) | 0.98 (0.96, 0.99) | 0.002 | ||
| LE8 Category | ||||||
| Low ( |
ref | ref | ref | ref | ||
| Moderate (50–79) | 0.53 (0.36, 0.78) | 0.001 | 0.54 (0.33, 0.89) | 0.02 | ||
| High ( |
0.34 (0.16, 0.69) | 0.003 | 0.34 (0.15, 0.79) | 0.01 | ||
| Model 2 | LE8 | 0.98 (0.96, 0.99) | 0.98 (0.96, 0.99) | 0.01 | ||
| LE8 Category | ||||||
| Low ( |
ref | ref | ref | ref | ||
| Moderate (50–79) | 0.58 (0.38, 0.87) | 0.01 | 0.54 (0.31, 0.94) | 0.03 | ||
| High ( |
0.39 (0.18, 0.83) | 0.01 | 0.34 (0.14, 0.86) | 0.02 | ||
| Model 3 | LE8 | 0.98 (0.97, 0.99) | 0.002 | 0.97 (0.96, 0.99) | 0.01 | |
| LE8 Category | ||||||
| Low ( |
ref | ref | ref | ref | ||
| Moderate (50–79) | 0.62 (0.40, 0.96) | 0.03 | 0.52 (0.30, 0.90) | 0.02 | ||
| High ( |
0.43 (0.20, 0.94) | 0.01 | 0.32 (0.13, 0.81) | 0.02 | ||
In Model 1, each one-point increment in LE8 was associated with a 2% decrease
in PD risk prior to matching (OR = 0.98, p
Model 2 yielded comparable findings. Each one-point rise in LE8 was linked to a
2% reduction in PD risk both before (OR = 0.98, p
Model 3, which incorporated additional adjustments for clinical variables
including stroke, myocardial infarction, and CVD, demonstrated similar trends.
Each one-point increase in LE8 was associated with a 2% reduction in PD risk
prior to matching (OR = 0.98, p = 0.002) and a 3% reduction following
matching (OR = 0.97, p = 0.01). Compared to the low LE8 group (
Additionally, domain-specific analyses were conducted to identify which
individual LE8 components were most robustly linked to PD risk. Following
adjustment for age, sex, and race, it was observed that diet quality (OR per
10-point increase: 0.91, p
| LE8 Component | OR (95% CI) | p-value |
| Diet | 0.91 (0.88–0.95) | |
| Sleep health | 0.91 (0.87–0.95) | |
| Physical activity | 0.95 (0.92–0.98) | 0.001 |
| Body-mass index (BMI) | 0.95 (0.91–0.99) | 0.015 |
| Nicotine exposure | 0.97 (0.94–1.00) | 0.050 |
| Blood glucose | 0.96 (0.92–1.00) | 0.050 |
| Blood pressure | 0.99 (0.95–1.03) | 0.620 |
| Non-HDL cholesterol | 1.03 (0.98–1.07) | 0.130 |
Adjusted for age, sex, and race/ethnicity. Odds ratios (ORs) represent the effect per 10-point increase in each LE8 component score.
Fig. 2 illustrates the non-linear association between LE8 scores and PD risk, modeled using RCS within a covariate-adjusted, weighted logistic regression framework. In Fig. 2A (before PSM), an inverse but non-linear relationship was observed: PD risk decreased with increasing LE8 scores, but this decline plateaued at approximately 61.88. In Fig. 2B (after matching), the non-linear pattern persisted. A significant reduction in PD risk was again noted with higher LE8 values, although the decreasing trend leveled off around a score of 63.75.
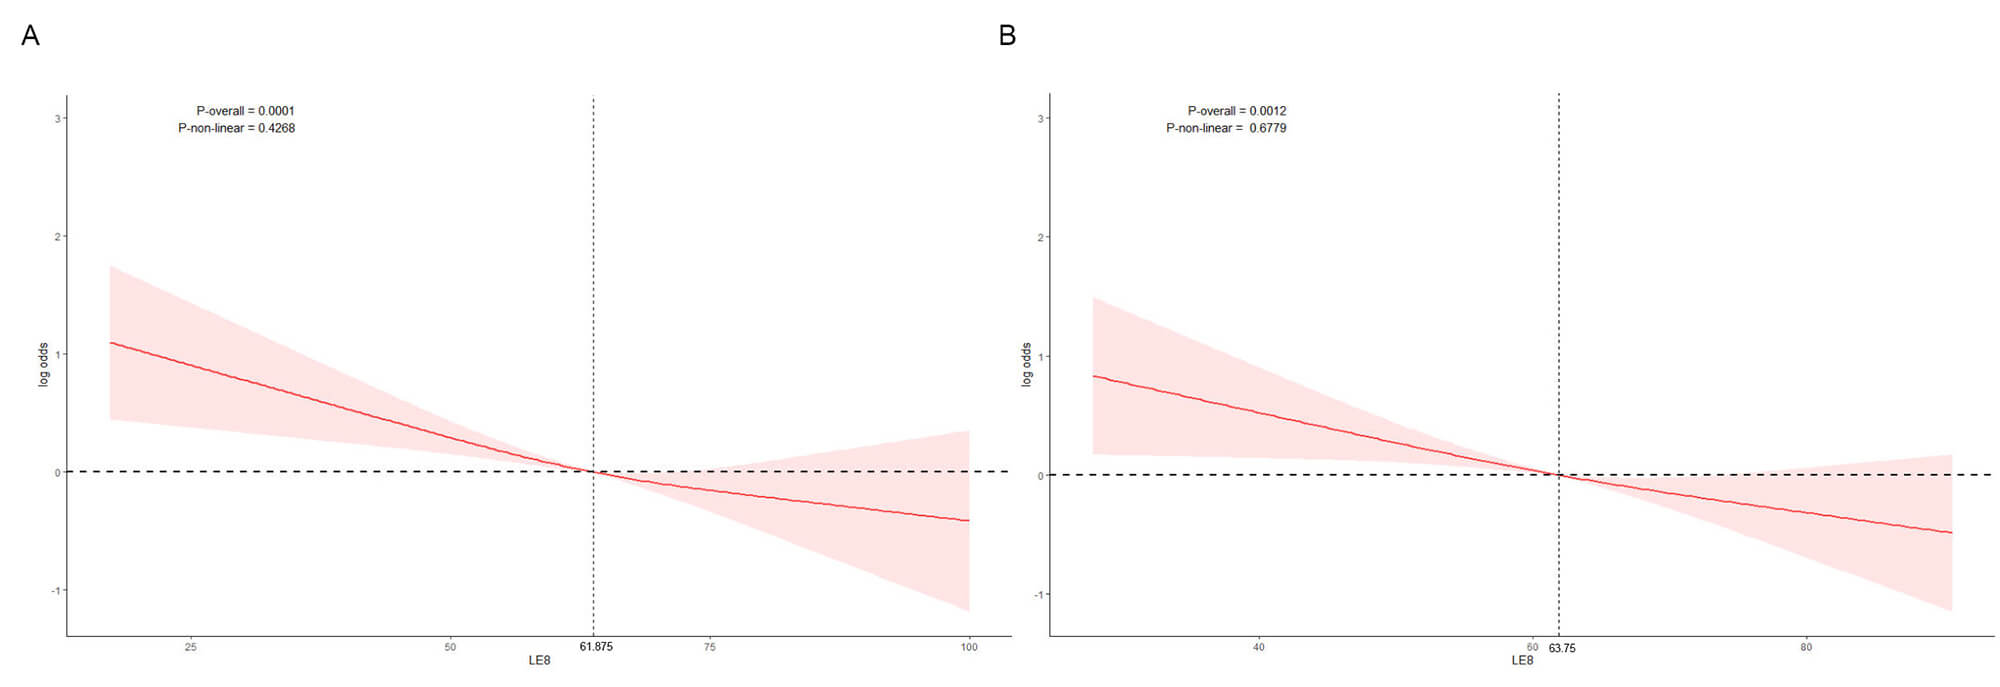 Fig. 2.
Restricted cubic spline (RCS) analysis of the association between LE8 score and Parkinson’s disease (PD) risk. (A) Before propensity score matching. (B) After propensity score matching. The red line represents the odds ratio (log-transformed) of PD associated with the LE8 score, and the shaded area indicates the 95% confidence interval.
To evaluate potential effect modification, subgroup analyses were conducted both before and after PSM (Fig. 3). Stratification was based on age, sex, race/ethnicity, educational attainment, marital status, PIR, BMI, smoking and alcohol use, as well as histories of stroke, myocardial infarction, and CVD.
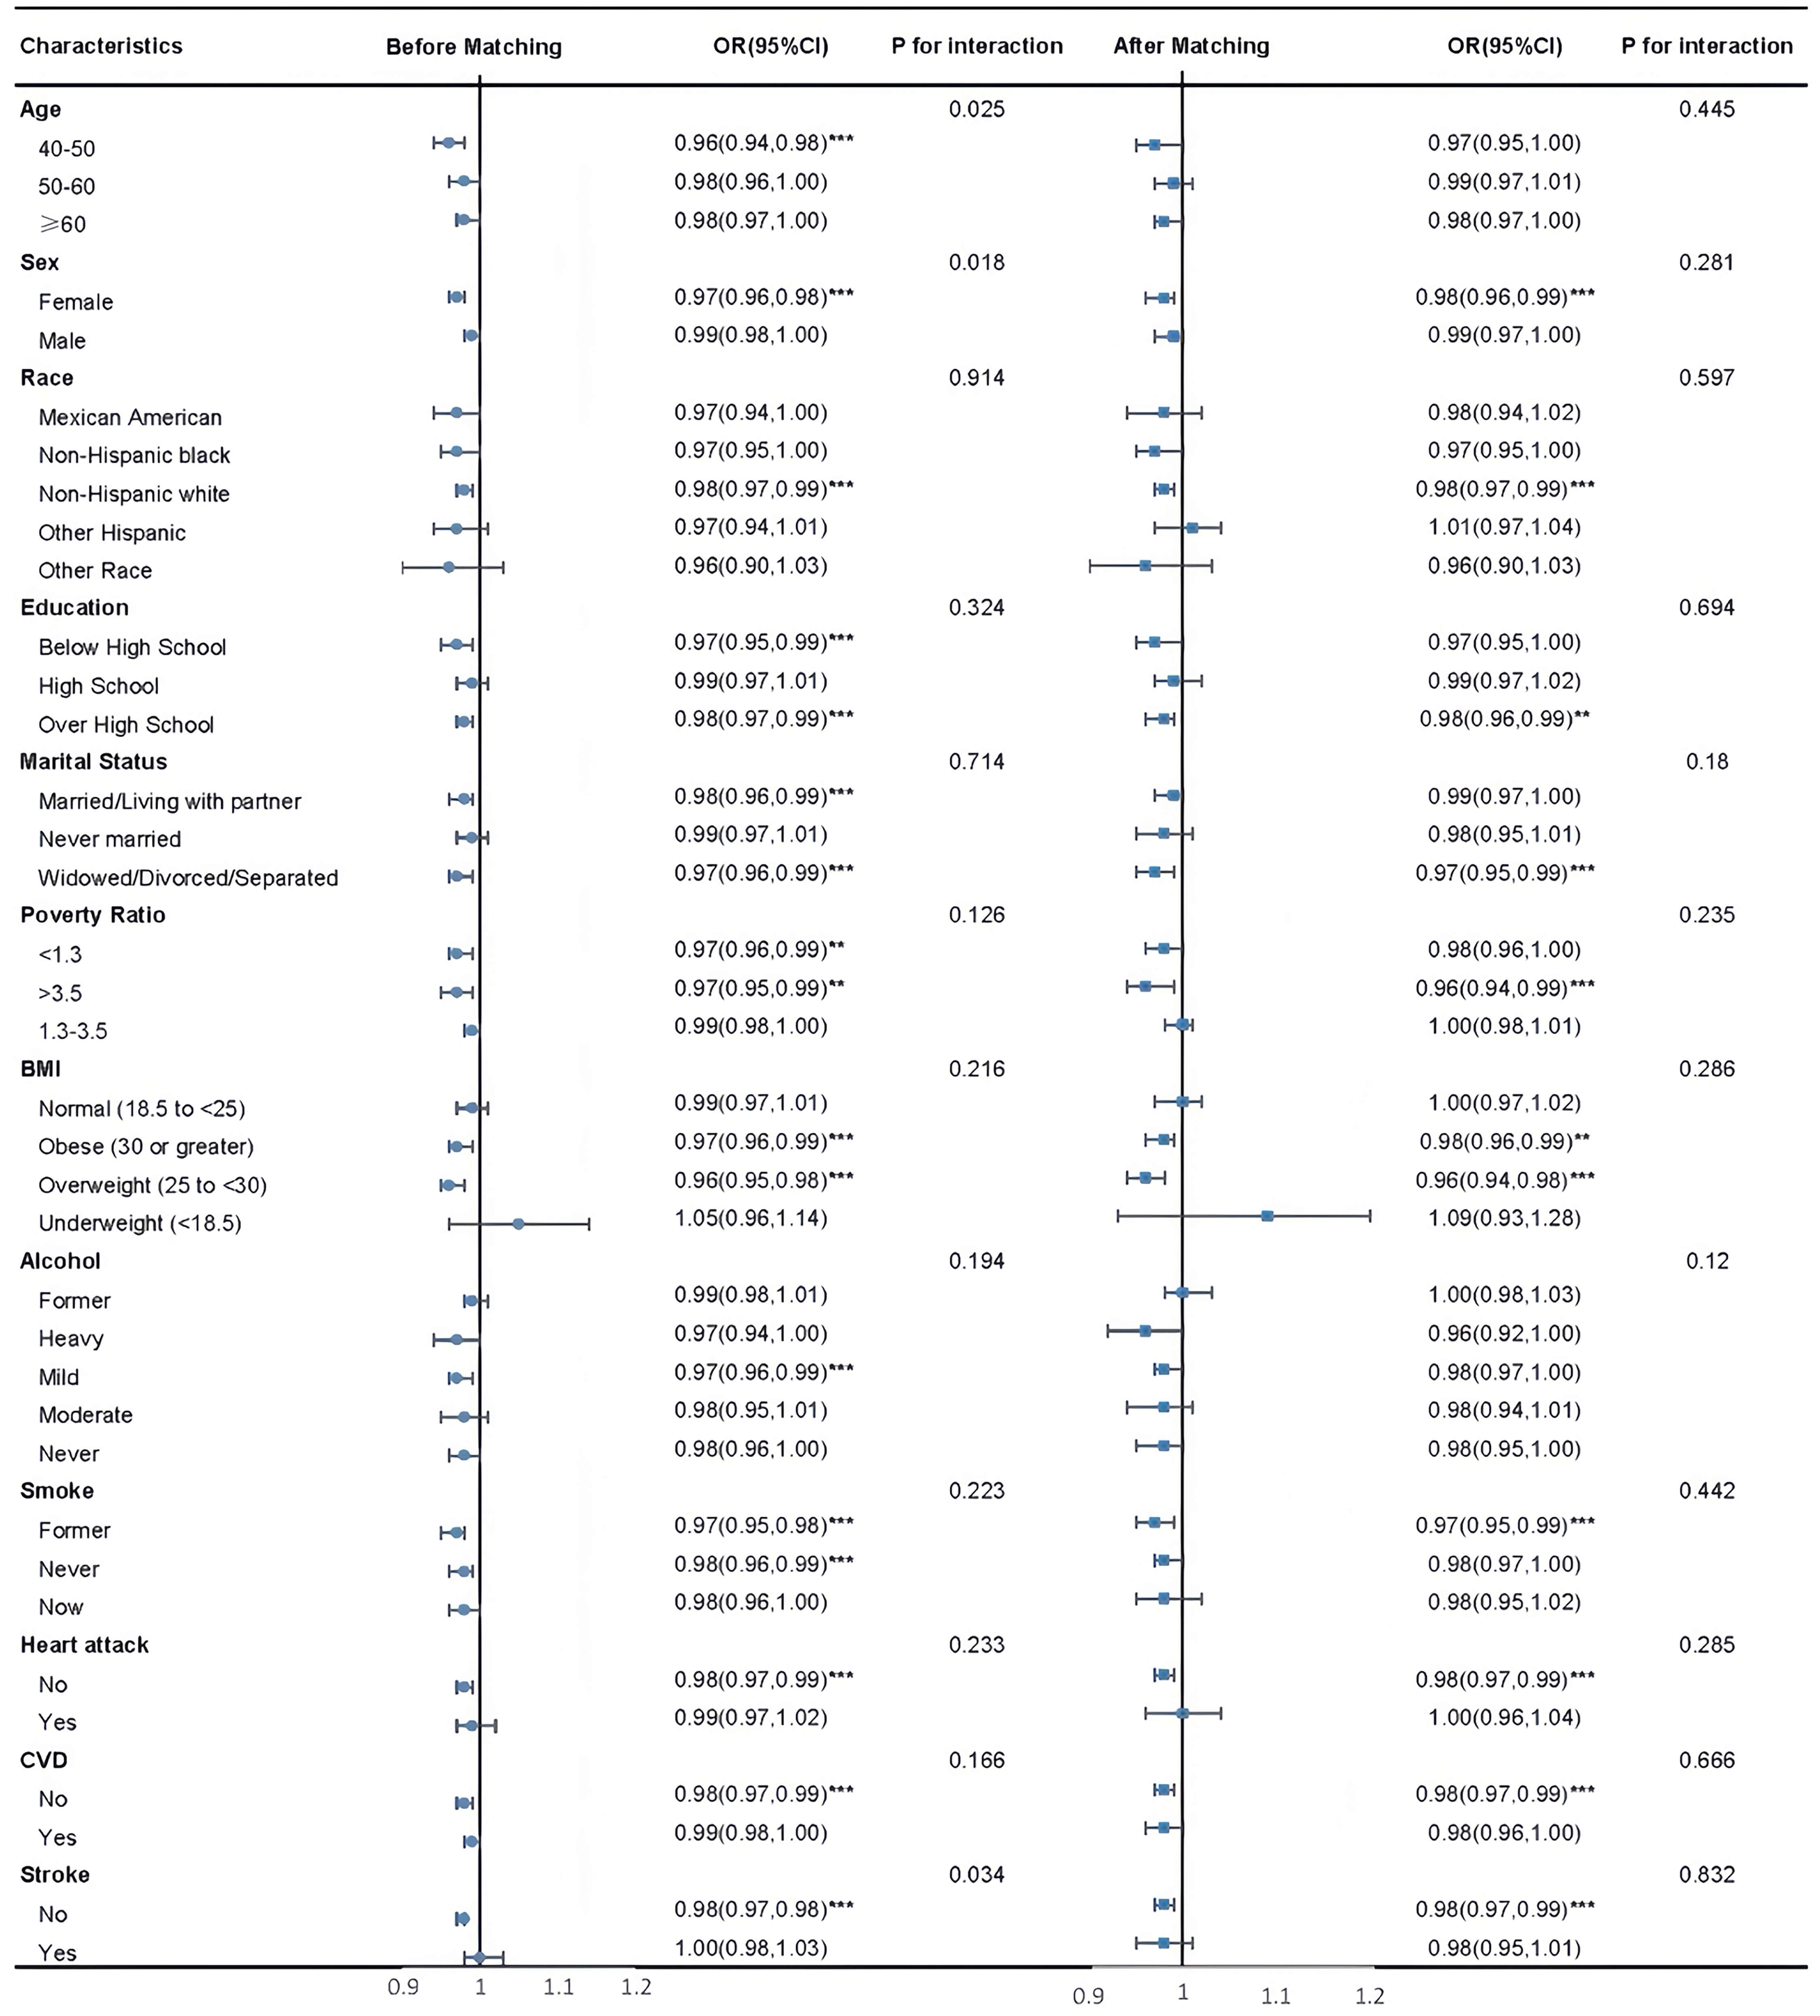 Fig. 3.
Subgroup analysis before and after matching. ***p
Prior to matching, significant inverse associations between LE8 scores and PD
risk were identified in several subgroups, including individuals aged 40–50,
females, those with either less than or more than high school education, and
participants who were married/cohabiting or widowed/divorced/separated.
Protective associations were also evident among those with PIR
After matching, these associations generally weakened, with odds ratios trending
toward null (OR
This nationally representative analysis revealed a significant inverse
relationship between LE8 scores and PD risk. Individuals with higher LE8 scores
exhibited a consistently lower likelihood of PD, even after controlling for
confounding factors through PSM. In particular, the tertile-based comparison
demonstrated that participants in the highest CVH category (scores 80–100) had a
markedly reduced risk relative to those in the lowest category (scores
The overall association between LE8 and PD risk exhibited a nonlinear pattern: as LE8 scores increased, PD risk decreased, with this downward trend leveling off when LE8 scores reached 61.88 (pre-matching) and 63.75 (post-matching).
Within subgroup analyses, despite some attenuation in significance, an inverse correlation between LE8 and PD prevalence persisted.
Among all PD cases, a small proportion of familial PD is associated with
monogenic mutations [29, 30]. The majority of other PD cases are sporadic,
resulting from gene-environment interactions [31]. Among various environmental
factors, lifestyle has attracted significant scientific attention [32, 33, 34]. LE8
integrates diet, smoking, PA, BMI, blood pressure, total cholesterol, fasting
blood glucose (FBG), and sleep, comprehensively considering lifestyle factors.
Evidence exists indicating that specific dietary components can reduce PD risk
[35, 36]. Studies have shown that individuals with low to moderate beer
consumption exhibit a lower PD risk, whereas heavy drinkers show a higher risk
[37]. Research indicates that BMI is negatively correlated with disease duration
and severity [38]. Among males, a dose-dependent relationship exists between
dietary cholesterol and lower PD risk [39]. Smoking is negatively correlated with
PD [40], as are physical activity and energy intake [41]. These findings are
consistent with prior evidence from mechanistic and pathological perspectives.
The development of PD involves a multifactorial interplay of biological
disturbances, including aberrant
Regarding physical activity, the precise mechanisms by which it alters the onset
and progression of PD are not fully understood. However, exercise-induced
improvements in insulin signaling, inflammation, mitochondrial dysfunction, and
endoplasmic reticulum stress may promote the survival of dopaminergic neurons by
altering the expression of
Prior research has documented links between LE8 and stroke, mood disorders (e.g., depression), and other chronic conditions [56, 57, 58]. Additionally, some studies have reported associations between lifestyle factors and PD [59]. However, the present study represents the first to select PD patients from the nationally representative NHANES sample, comprehensively account for lifestyle factors via LE8 scores, and systematically assesses the relationship between LE8 and PD. Results from this study indicate a significant inverse correlation between LE8 and PD.
This study presents several strengths. Most notably, it leveraged data from a nationally representative U.S. sample, with NHANES providing high-quality, standardized data collection protocols that enhance the external validity of the results. The relationship between LE8 and PD was rigorously assessed using PSM, and non-linear trends were further examined through RCS modeling, allowing for a nuanced evaluation of the dose-response pattern.
Nevertheless, certain limitations warrant consideration. Due to the cross-sectional nature of the NHANES dataset, causal relationships between LE8 scores and PD risk cannot be established. Reverse causality remains a potential concern, as prodromal symptoms—such as impaired sleep, reduced physical activity, or metabolic alterations—may precede PD diagnosis and adversely influence LE8 scores. For instance, early fatigue or sleep disruption may directly reduce scores in relevant LE8 domains. Thus, it remains unclear whether suboptimal CVH contributes to PD onset or if early disease manifestations affect lifestyle-related metrics. Longitudinal studies are essential to clarify this temporal relationship. Second, the reliance on self-reported data for both PD status and several LE8 components introduces the possibility of recall bias and misclassification. Third, PD identification was based on the use of anti-Parkinsonian medications, as NHANES lacks clinical diagnoses or ICD coding. While this method is consistent with prior NHANES-based research, it may misclassify individuals receiving such medications for alternative conditions (e.g., restless legs syndrome) or those not yet undergoing pharmacologic treatment. Lastly, the relatively small number of PD cases limits statistical power, and future research with larger, clinically verified cohorts is needed to confirm these findings.
Findings from this cross-sectional analysis suggest that LE8, a composite measure of lifestyle-related factors, is inversely associated with the prevalence of PD. Individuals with higher LE8 scores were less likely to report PD. However, due to the observational and cross-sectional nature of the data, these results reflect correlation rather than causation, and no definitive conclusions regarding temporal or causal relationships can be drawn.
Data is provided within the manuscript. The database used for this study can be found in online repositories (https://www.cdc.gov/nchs/nhanes/index.htm).
JL: Writing—original draft, Conceptualization, Methodology, Formal analysis. BG and LJM: Methodology, Formal analysis. XBG: Writing—review & editing, Conceptualization, Methodology, Project administration, Funding acquisition. All authors contributed to editorial changes in the manuscript. All authors read and approved the final manuscript. All authors have participated sufficiently in the work and agreed to be accountable for all aspects of the work.
Not applicable.
Our sincere appreciation is directed towards the participants of the NHANES database; their role was indispensable to the study’s progress.
This study received no external funding.
The authors declare no conflict of interest.
References
Publisher’s Note: IMR Press stays neutral with regard to jurisdictional claims in published maps and institutional affiliations.