


 , Shuangxiang Lin 2, Linlin Sun 3, Yanli Yu 3, Haipeng Liu 4,*
 , Zhen Wang 3,*
1 The Fourth School of Clinical Medicine, Zhejiang Chinese Medical University, Hangzhou First People's Hospital, 310000 Hangzhou, Zhejiang, China
2 Department of Radiology, The Second Affiliated Hospital, Zhejiang University School of Medicine, Zhejiang Chinese Medical University, 310000 Hangzhou, Zhejiang, China
3 Department of Radiology, Affiliated Hangzhou First People's Hospital, Westlake University School of Medicine, 310000 Hangzhou, Zhejiang, China
4 Centre for Intelligent Healthcare, Coventry University, CV1 5RW Coventry, UK
Abstract
Functional assessment of myocardial ischemia is essential and can be evaluated noninvasively using coronary computed tomography angiography (CCTA) and magnetocardiography (MCG). However, the diagnostic value of integrating CCTA and MCG has not been investigated.
This retrospective, single-center cohort study included 275 patients with suspected coronary artery disease (CAD) who underwent both CCTA and MCG examinations from December 2023 to June 2025. Functionally significant ischemia was defined by invasive fractional flow reserve (FFR) or CT-derived FFR (CT-FFR). Quantitative features from both modalities were extracted and normalized. Machine learning (ML) models based on MCG alone, CCTA alone, and combined MCG–CCTA were constructed and evaluated using five-fold cross-validation. Model performance was assessed using the area under the receiver operating characteristic curve (AUC), accuracy, sensitivity, and specificity; model interpretability was examined using Shapley additive explanations (SHAP).
Of the 275 patients, 98 (35.6%) were classified as being ischemic. The MCG model achieved an AUC of 0.769 (95% confidence interval (CI): 0.708–0.829), and the CCTA model yielded an AUC of 0.755 (95% CI: 0.692–0.818). In contrast, the combined MCG–CCTA model developed using ML demonstrated superior performance, with an AUC of 0.829 (95% CI: 0.773–0.885), an accuracy of 0.800, a sensitivity of 0.704, and a specificity of 0.853.
A combined MCG–CCTA model developed with ML outperforms models based on either modality alone for detecting functionally significant myocardial ischemia. In clinical practice, this integrated approach may enhance ischemia assessment and inform downstream testing decisions.
Graphical Abstract

Keywords
- coronary artery disease
- myocardial ischemia
- magnetocardiography
- computed tomography angiography
- machine learning
Coronary artery disease (CAD) stands as a major global health challenge and the foremost cause of mortality worldwide [1]. Myocardial ischemia, which induces regional wall motion abnormalities and diminishes cardiac function, significantly worsens the prognosis for CAD [2]. Therefore, precise ischemia assessment is vital for diagnosing stable CAD and determining suitable revascularization strategies [3].
Invasive coronary angiography (ICA) combined with fractional flow reserve (FFR) is the gold standard for evaluating hemodynamically significant stenosis [4]. Nevertheless, its invasive nature and high cost restrict its widespread application. Noninvasive FFR derived from coronary CT angiography (CT-FFR), utilizing computational fluid dynamics (CFD) or machine learning (ML) algorithms, offers a comprehensive, noninvasive evaluation of coronary anatomy and functional parameters. This approach has been validated against ICA with FFR for detecting lesion-specific ischemia [5, 6, 7, 8]. However, severe coronary calcification can introduce blooming artifacts, distorting lumen stenosis assessment and CT-FFR results, thereby compromising diagnostic specificity and potentially leading to unnecessary ICA referrals, which increase both medical risks and healthcare resource burdens [9]. Magnetocardiography (MCG), a noninvasive technique for detecting the exceedingly weak magnetic fields generated by cardiac electrical activity [10], is free from electrode-skin artifacts that plague electrocardiography (ECG). MCG can sensitively capture current changes induced by ischemic myocardium, offering superior sensitivity and specificity [11, 12]. Early studies utilizing superconducting quantum interference devices (SQUID) highlighted MCG’s potential ischemia detection [13], but its clinical adoption has been hampered by the scarcity of liquid helium and high operational costs. Recent advancements in spin-exchange relaxation-free (SERF) atomic magnetometers enable non-contact MCG measurements with enhanced sensitivity without cryogenic cooling, paving the way for large-scale clinical studies and suggesting MCG’s potential as a valuable noninvasive ischemia detection tool [14, 15, 16].
Both coronary computed tomography angiography (CCTA) and MCG provide valuable noninvasive information for detecting myocardial ischemia. However, MCG lacks standardized diagnostic criteria, limiting its broader clinical use. Recent studies have shown that applying ML to MCG can enhance ischemia detection and localization, as well as characterize disease severity and lesion distribution [17, 18]. Yet, the performance of a combined CCTA-MCG model using ML in CAD patients has not been systematically explored.
This study aims to assess whether integrating MCG and CCTA through ML improves noninvasive ischemia diagnosis in patients suspected of having CAD.
This single-center, retrospective cohort study included adult patients suspected of having coronary artery disease (CAD) who underwent both CCTA and MCG examinations within a two-week interval from December 2023 to June 2025. CT-FFR data were available for all patients, and a subset underwent
invasive FFR. Functionally significant ischemia was defined as CT-FFR
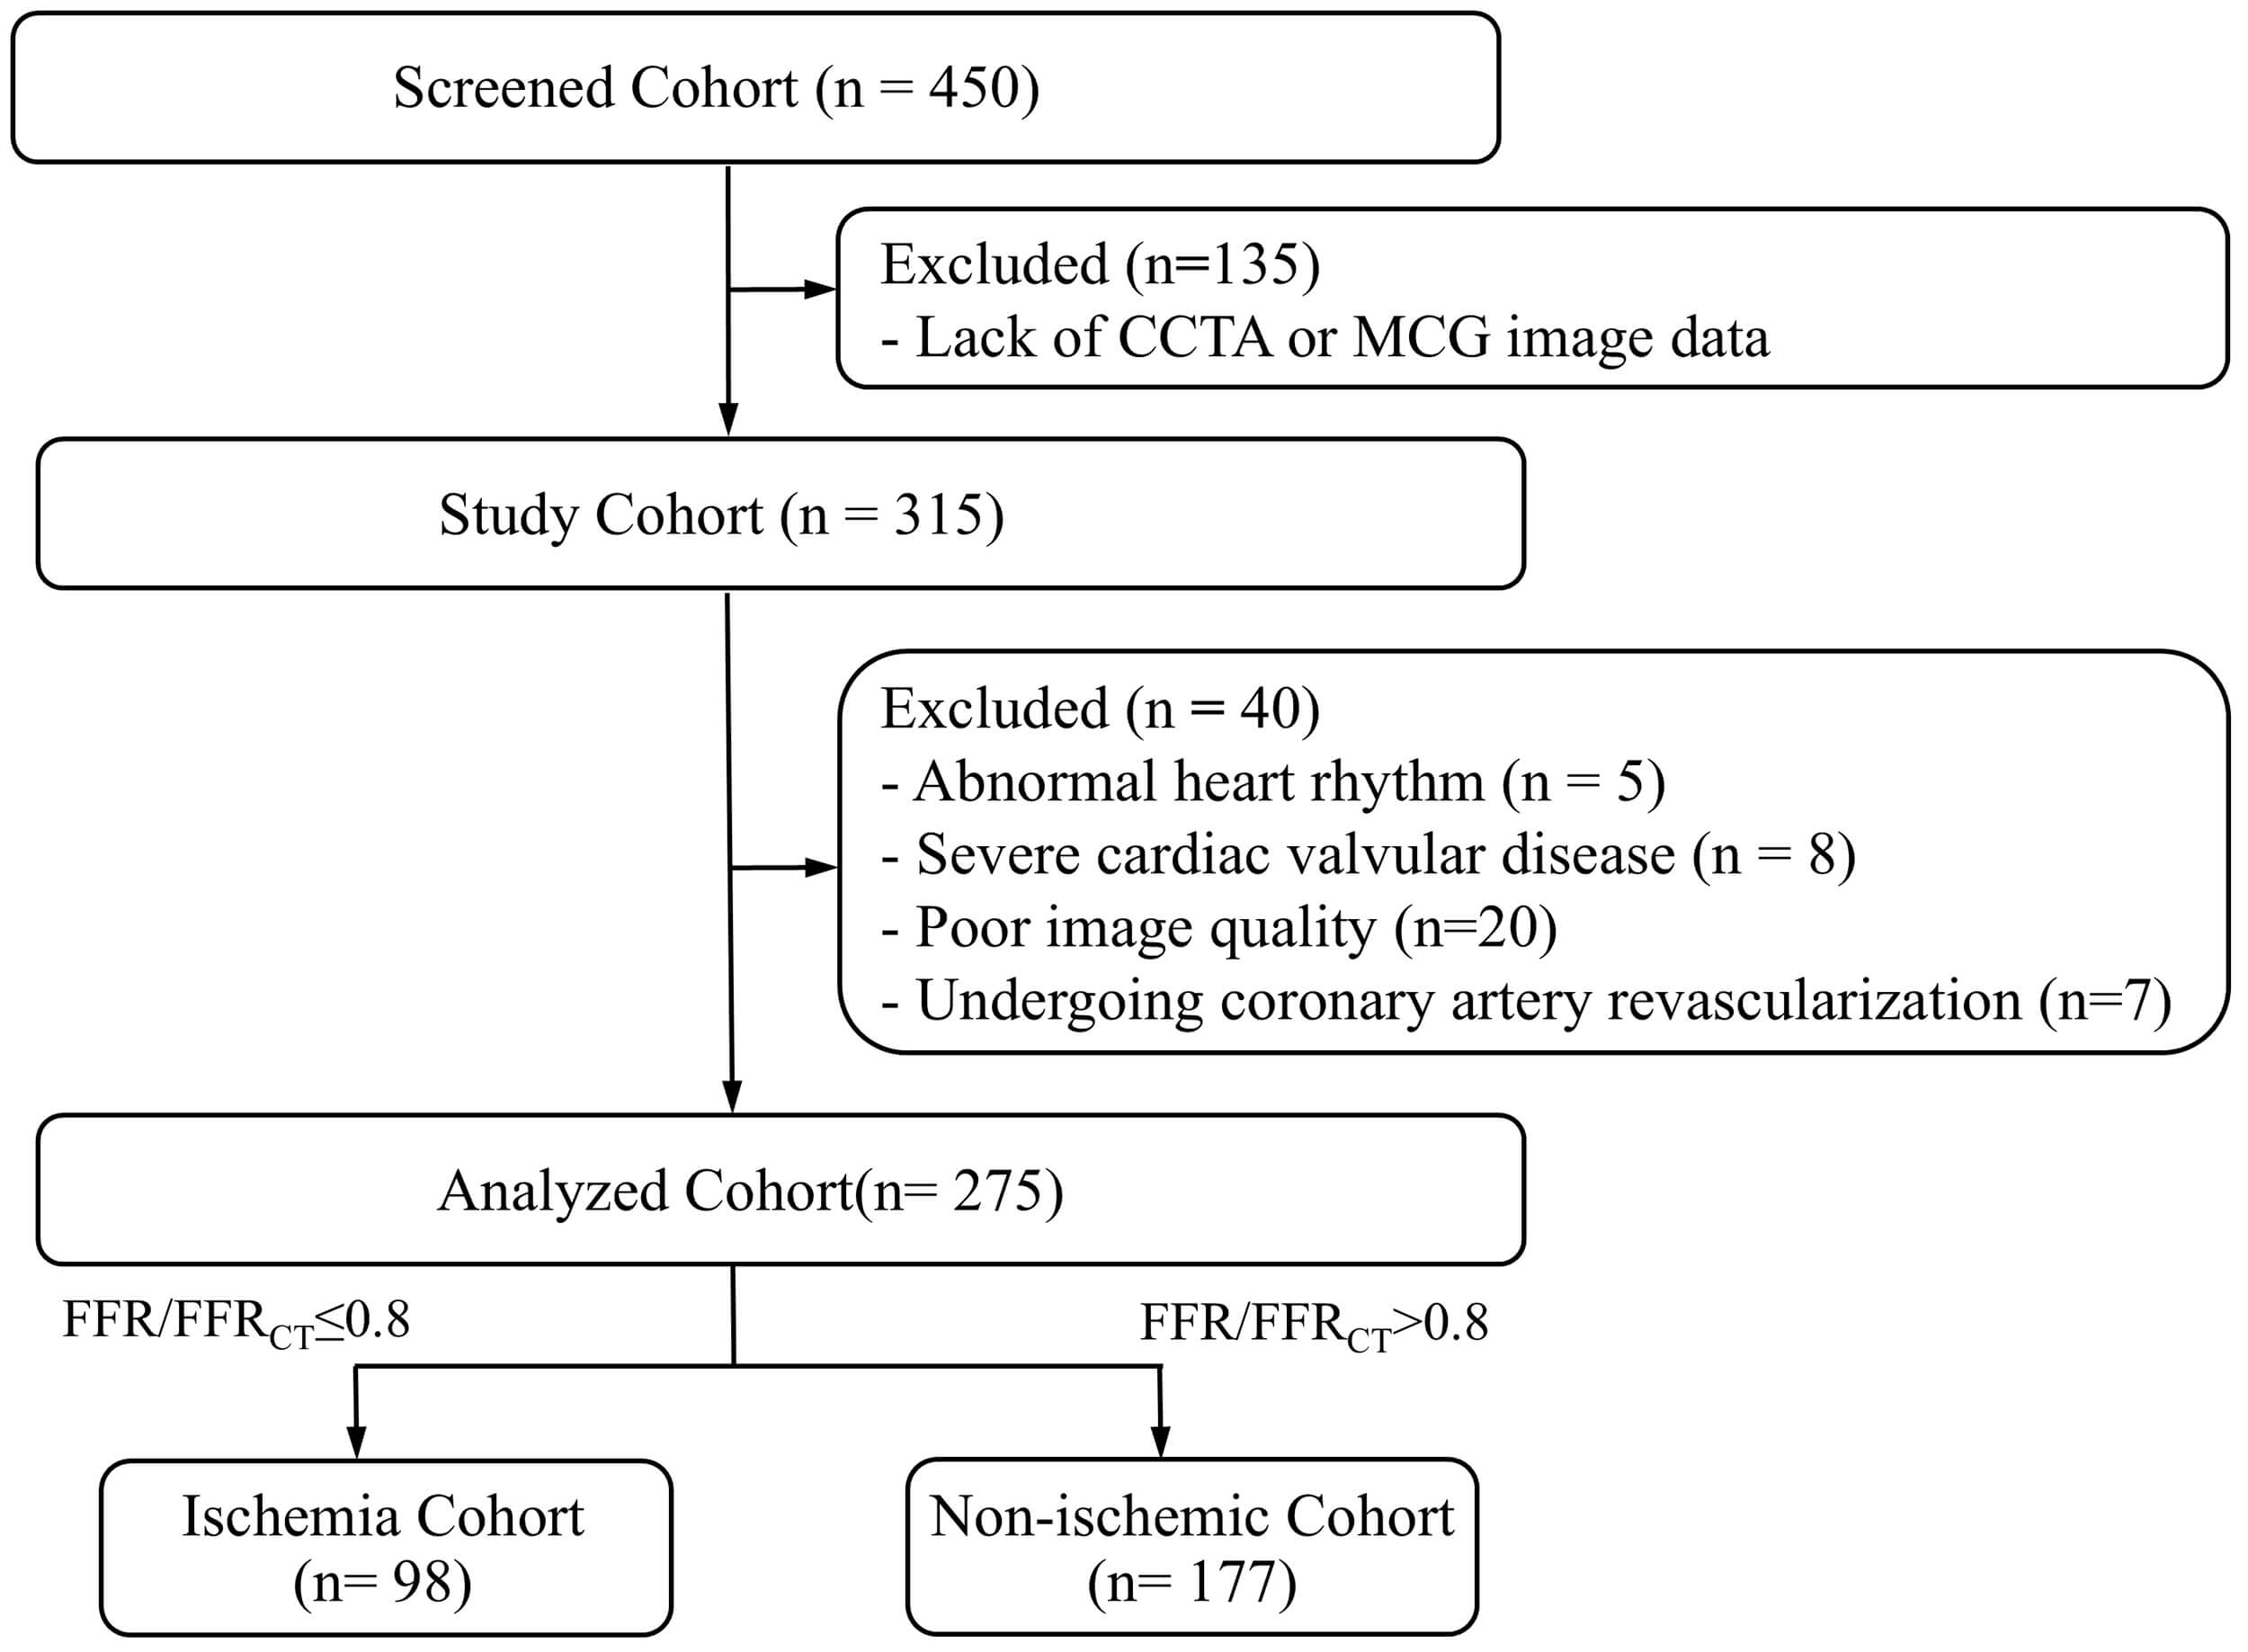
Initially, a total of 450 consecutive patients were screened. The inclusion
criteria were as follows: (1) aged over 18 years; (2) presence of angina or
angina-like symptoms, such as chest pain or dyspnea, suspected of CAD; (3)
completion of both CCTA and MCG within a two-week interval; (4) availability of
FFR or CT-FFR measurements. Exclusion criteria included: (1) severe cardiac
valvular disease; (2) abnormal heart rhythm; (3) prior coronary artery
revascularization; (4) poor image quality; (5) inability to complete MCG
acquisition due to intolerance of the magnetic shielding chamber or interference
from metallic implants/devices; (6) severe renal dysfunction (estimated
glomerular filtration rate (eGFR)
 Fig. 1.
Flowchart of study population. CCTA, coronary computed tomography angiography; MCG, magnetocardiography; FFR, fractional flow reserve.
This study utilized an ultra-high-sensitivity MCG system based on the SERF
principle, comprising a 64-channel atomic magnetometer array, a high-performance
magnetic shielding chamber, and a multifunctional non-magnetic examination bed.
This system can detect cardiac magnetic fields as weak as 10-7 times the
strength of the Earth’s magnetic field. Data acquisition followed a standardized
protocol: subjects were positioned in a supine position on the examination bed,
with the sensor array center placed 2 cm below the xiphoid process. Resting MCG
signals were continuously recorded for 3 minutes. ECG signals were simultaneously
acquired within 5 minutes before and after the MCG scan for heartbeat
segmentation and signal comparison. Patients with metallic implants or other
strong magnetic interference sources were excluded prior to scanning. During data
acquisition, real-time monitoring identified potential issues like body motion,
respiratory drift, channel instability, or transient environmental magnetic
fluctuations, ensuring only high-quality signal segments were recorded. The
system’s performance was regularly validated to ensure stable signal acquisition,
with no significant variance observed during repeated scans in the same setting.
Additionally, a Signal Quality Score was calculated for all MCG scans, with all
patients achieving a score
Coronary CT angiography was performed using a second-generation dual-source CT
scanner (SOMATOM Definition Flash, Siemens Healthineers, Forchheim, Germany).
Five minutes before scanning, patients received sublingual nitroglycerin (0.5 mg)
to dilate the coronary arteries. A non-ionic contrast agent (Iodomane 370 mg/mL,
Bayer, Germany, 60 mL) was injected intravenously at 4.5–5.0 mL/s, followed by a
30 mL saline flush at the same rate using a dual-head power injector. Scanning
was initiated by automated bolus tracking with a 7-second delay after the
attenuation in the ascending aorta reached 100 Hounsfield units. CT scanning was
performed during 30%–80% of the R-R interval with prospective ECG gating, and
the scanner’s automatic phase selection feature was used to obtain the optimal
systolic (33%–46% of the R-R interval) and diastolic (66%–75% of the R-R
interval) images. Reconstructions were generated with a slice thickness of 0.75
mm and a field of view of 200–250 mm. Additional acquisition parameters included
a tube voltage of 120 kV, a reference tube current of 320 mAs with CARE Dose 4D
modulation, a gantry rotation time of 0.28 s per rotation, and a collimation of
64
The multichannel cardiac magnetic signals collected by the MCG system were
automatically processed to extract 23 quantitative parameters, including temporal
intervals, magnetic field strength indices, as well as angular and spatial dipole
metrics (Supplementary Table 1). CCTA images were analyzed using an
AI-assisted platform (CoronaryDoc, Shukun Technology, Beijing, China), which
generated 21 anatomical and functional parameters (Supplementary Table
2). For coronary plaque assessment, vessel-level plaque composition was recorded
for the left anterior descending artery (LAD), left circumflex artery (LCX), right coronary
artery (RCA), and as no plaque, non-calcified, calcified, or mixed plaque. CT-FFR
was used solely to define the reference-standard outcome and was not used as an
input feature for model development. Parameters with more than 30% missing data
were excluded. Missing values, which occurred only in a few continuous variables,
were imputed using median substitution. For feature screening, univariate
analyses were performed to identify variables potentially related to functionally
significant ischemia. Variables demonstrating at least borderline association
(p
All 275 patients were included in model development, with five-fold stratified cross-validation used to generate training and validation folds. This framework was consistently applied across three model variants: MCG-only, CCTA-only, and combined MCG-CCTA models. For each model variant, five ML algorithms were implemented: logistic regression (LR), support vector machine (SVM), random forest (RF), naive bayes (NB), and extreme gradient boosting (XGBoost). Model performance was evaluated using the area under the receiver operating characteristic curve (AUC), accuracy, sensitivity, specificity, positive predictive value (PPV), negative predictive value (NPV), and F1 score. Comparative analyses across the three model variants and five algorithms were performed to identify the best-performing configuration for diagnosing functional myocardial ischemia. To enhance interpretability, Shapley additive explanations (SHAP) was conducted to quantify the contribution of individual features to model predictions.
Statistical analyses were performed using SPSS software version 25.0 (SPSS Inc,
Chicago, IL, USA) and R software version 4.5.1 (R Foundation for Statistical
Computing, Vienna, Austria). The normality of continuous variables was assessed
using standard tests for Gaussian distribution. As none of the continuous
variables followed a normal distribution, continuous variables are presented as
median (interquartile range, IQR), and group comparisons for continuous variables
were performed using the Mann–Whitney U test. Categorical variables were
compared utilizing the
A total of 275 eligible patients were included in this study, comprising 98
(35.6%) patients in the ischemia group and 177 (64.4%) patients in the
non-ischemia group. Baseline characteristics are presented in Table 1. The
ischemia group had a notably higher proportion of males (78.6% vs. 47.5%,
p
| Characteristics | Total cohort (n = 275) | Non-ischemia cohort (n = 177) | Ischemia cohort (n = 98) | p-value | |
| Age, years | 67.00 (58.00–74.00) | 66.00 (56.00–73.50) | 68.00 (59.75–75.25) | 0.07 | |
| Male | 161 (58.5%) | 84 (47.5%) | 77 (78.6%) | ||
| BMI, kg/m2 | 23.44 (20.76–25.54) | 23.31 (20.76–25.55) | 23.44 (20.76–25.50) | 0.65 | |
| History of smoking | 47 (17.1%) | 21 (11.9%) | 26 (26.5%) | ||
| Hypertension | 175 (63.6%) | 105 (59.3%) | 70 (71.4%) | 0.046 | |
| Diabetes mellitus | 68 (24.7%) | 33 (18.6%) | 35 (35.7%) | ||
| Dyslipidemia | 25 (9.1%) | 15 (8.5%) | 10 (10.2%) | 0.63 | |
| TC, mmol/L | 4.26 (3.47–5.02) | 4.41 (3.65–5.03) | 4.04 (3.15–4.83) | 0.012 | |
| TG, mmol/L | 1.22 (0.90–1.77) | 1.18 (0.90–1.70) | 1.33 (0.90–1.87) | 0.44 | |
| HDL-C, mmol/L | 1.10 (0.97–1.32) | 1.14 (0.99–1.37) | 1.04 (0.94–1.23) | ||
| LDL-C, mmol/L | 2.27 (1.58–2.29) | 2.35 (1.73–3.01) | 2.17 (1.45–2.73) | 0.08 | |
| PIV, 109/L2 | 467.50 (328.00–669.79) | 456.21 (327.20–659.28) | 492.75 (332.39–689.54) | 0.60 | |
| Echocardiography | |||||
| LVIDd, cm | 4.73 (4.46–5.00) | 4.73 (4.50–5.00) | 4.73 (4.44–5.07) | 0.90 | |
| LVIDs, cm | 2.97 (2.79–3.26) | 2.95 (2.79–3.25) | 2.98 (2.79–3.27) | 0.59 | |
| FS, % | 35.70 (33.30–39.40) | 35.70 (33.30–39.35) | 35.00 (33.18–39.40) | 0.68 | |
| LVEF, % | 65.10 (60.20–69.90) | 64.60 (60.35–69.85) | 64.65 (59.33–70.15) | 0.73 | |
Data are presented as the median (25–75% interquartile range), and n (%). BMI, body mass index; TC, total cholesterol; TG, triglyceride; HDL-C, high-density lipoprotein cholesterol; LDL-C, low-density lipoprotein cholesterol; PIV, pan-immune-inflammation value; LVIDd, left ventricular internal dimension in diastole; LVIDs, left ventricular internal dimension in systole; FS, fractional shortening; LVEF, left ventricular ejection fraction.
Univariate analysis revealed that several variables had at least a borderline
association (p
Among the five ML methods tested (LR, RF, NB, SVM, and XGBoost), XGBoost
consistently outperformed the others across all modeling strategies (MCG-only,
CCTA-only, and combined MCG-CCTA). Overall diagnostic metrics for all algorithms
and model types are summarized in Supplementary Table 3, and the
relative performance profiles are illustrated by radar plots in Fig. 2. For
XGBoost models, the MCG-only and CCTA-only configurations achieved AUC values of
0.769 (95% CI: 0.708–0.829) and 0.755 (95% CI: 0.692–0.818), respectively,
offering a favorable balance between sensitivity and specificity compared with
the other classifiers. Integrating MCG and CCTA further enhanced diagnostic
accuracy. The combined XGBoost model delivered the best overall results, with an
AUC of 0.829 (95% CI: 0.773–0.885), accuracy of 0.800, sensitivity of 0.704,
and specificity of 0.853. This represented relative AUC increases of 7.9% over
the MCG model and 9.8% over the CCTA model (DeLong test, all p
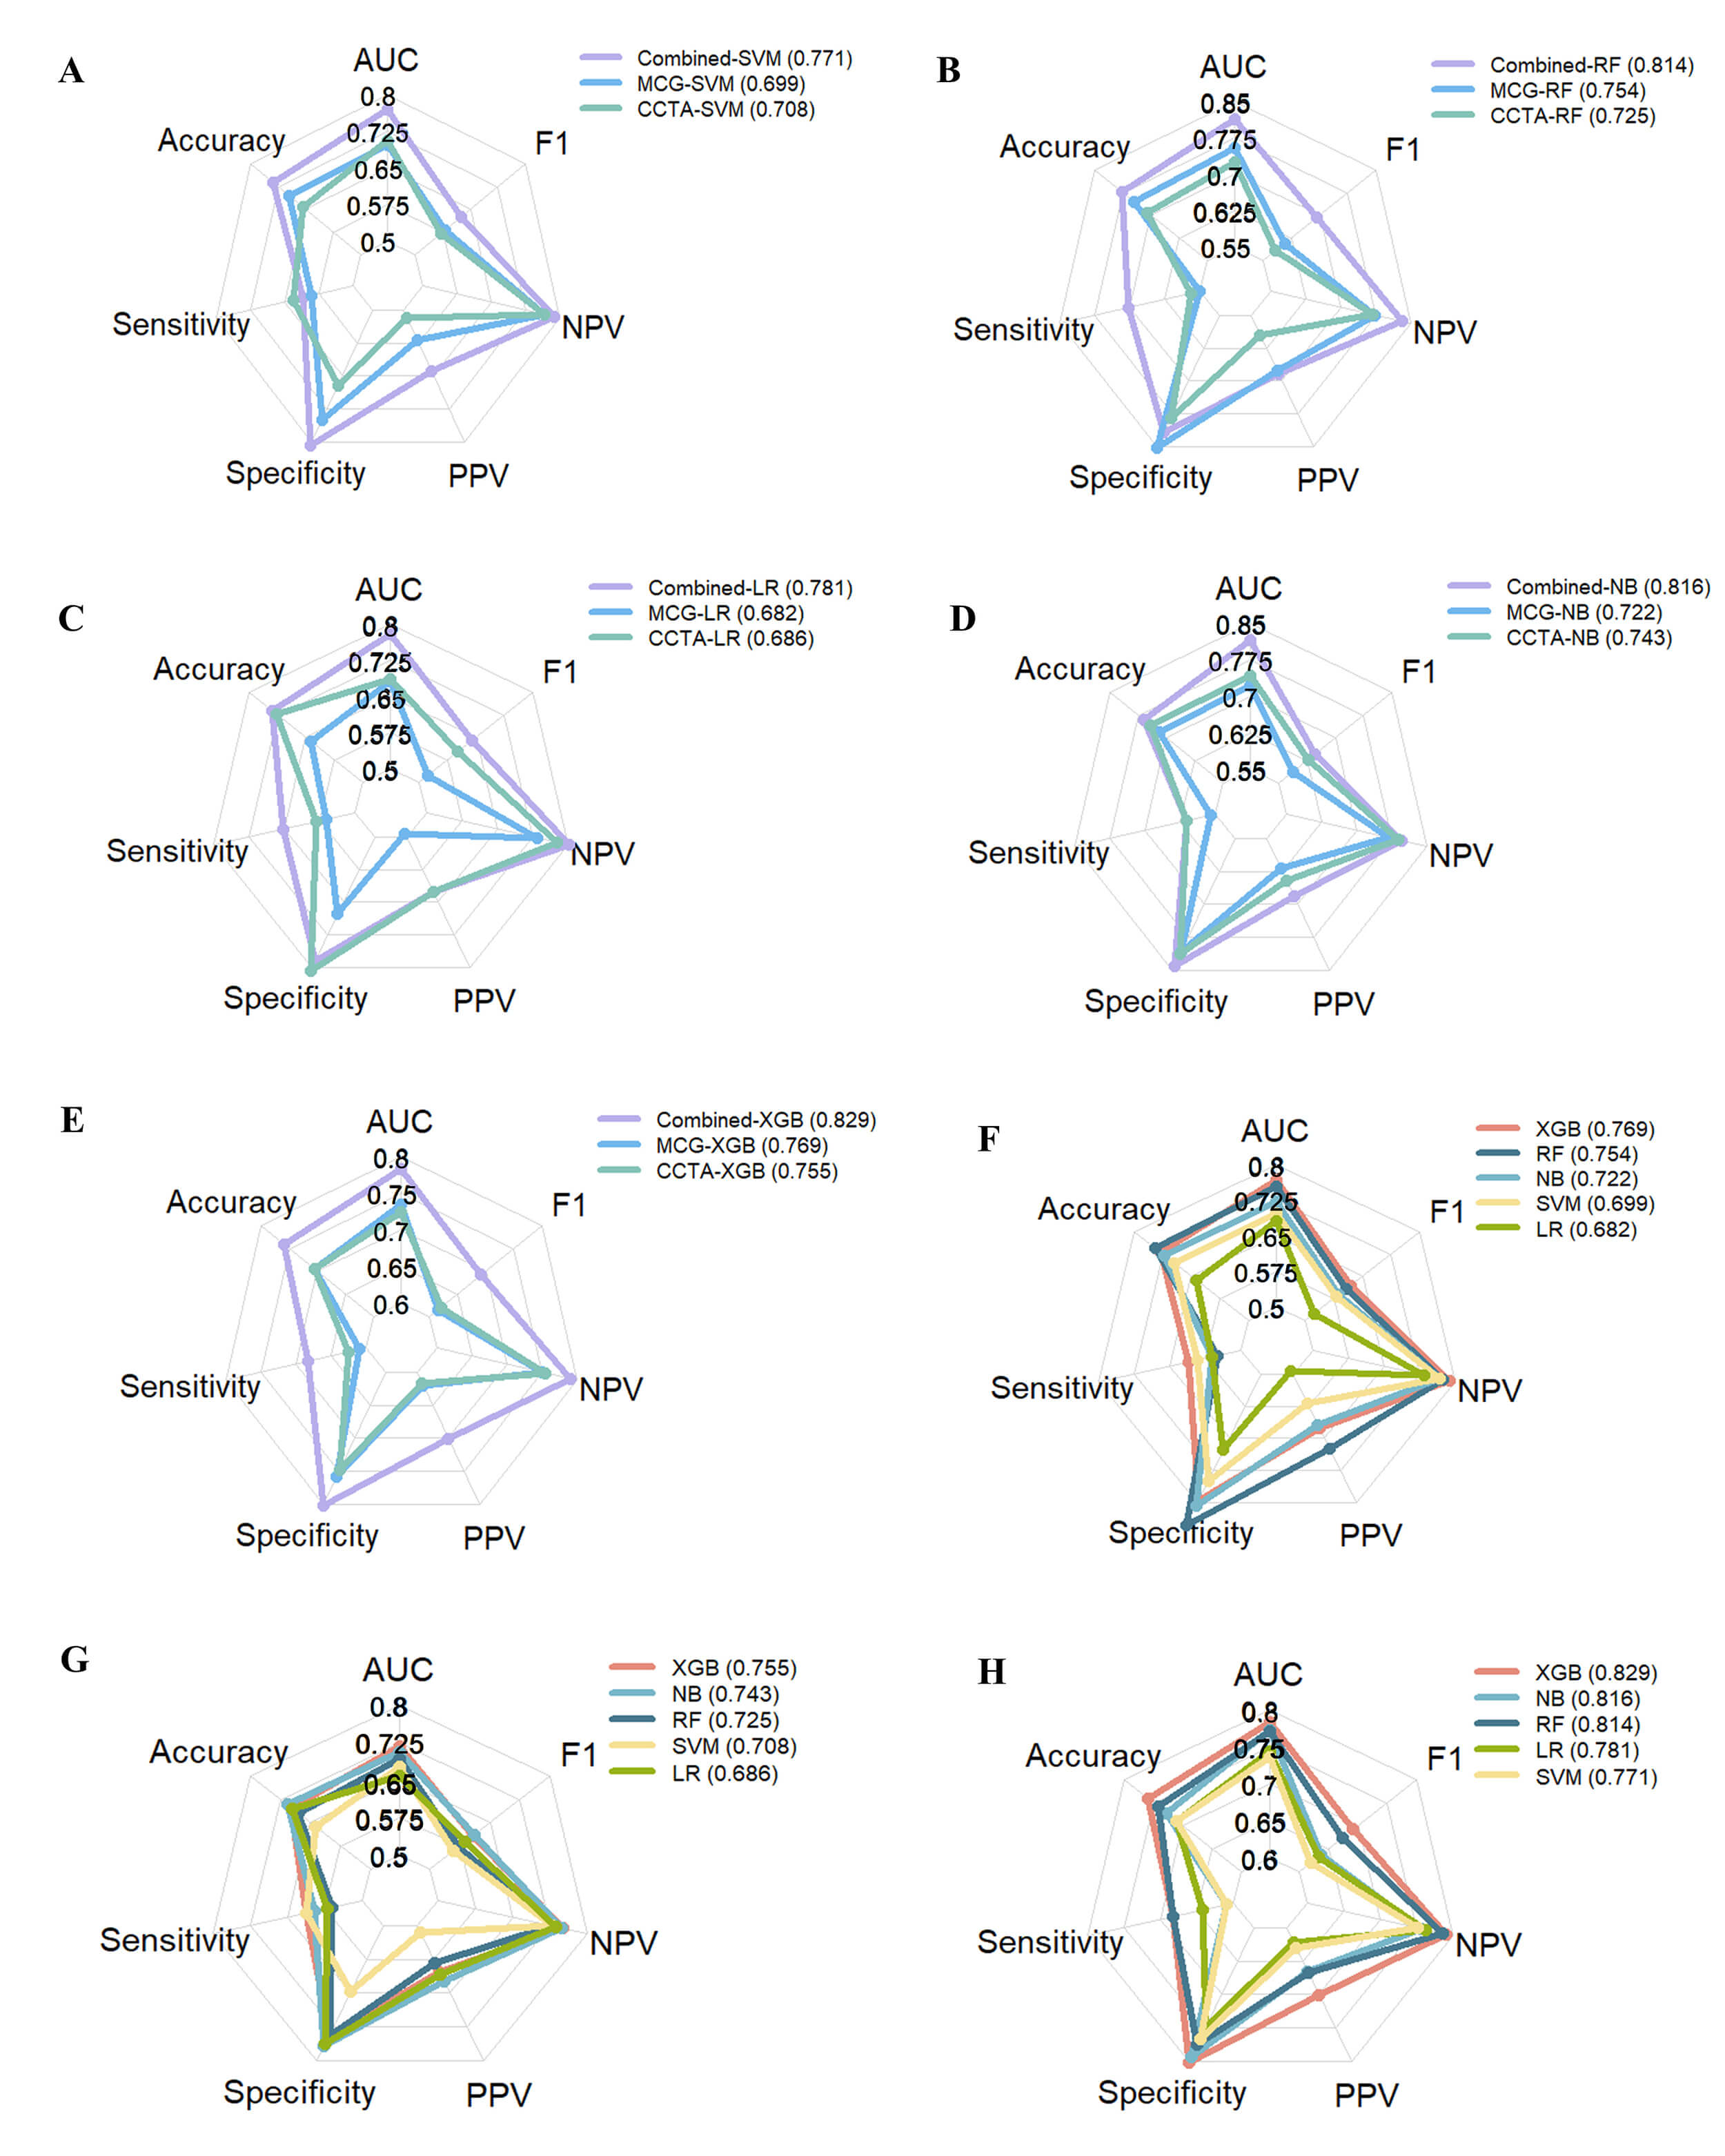 Fig. 2.
Radar plots illustrating the diagnostic performance of three models based on five machine learning (ML) methods. (A) SVM model. (B) RF model. (C) LR model. (D) NB model. (E) XGBoost model. (F) MCG models. (G) CCTA models. (H) Combined models. AUC, area under the receiver operating characteristic curve; F1, F1-score; NPV, negative predictive value; PPV, positive predictive value; SVM, support vector machine; RF, random forest; LR, logistic regression; NB, naive bayes; XGBoost, extreme gradient boosting.
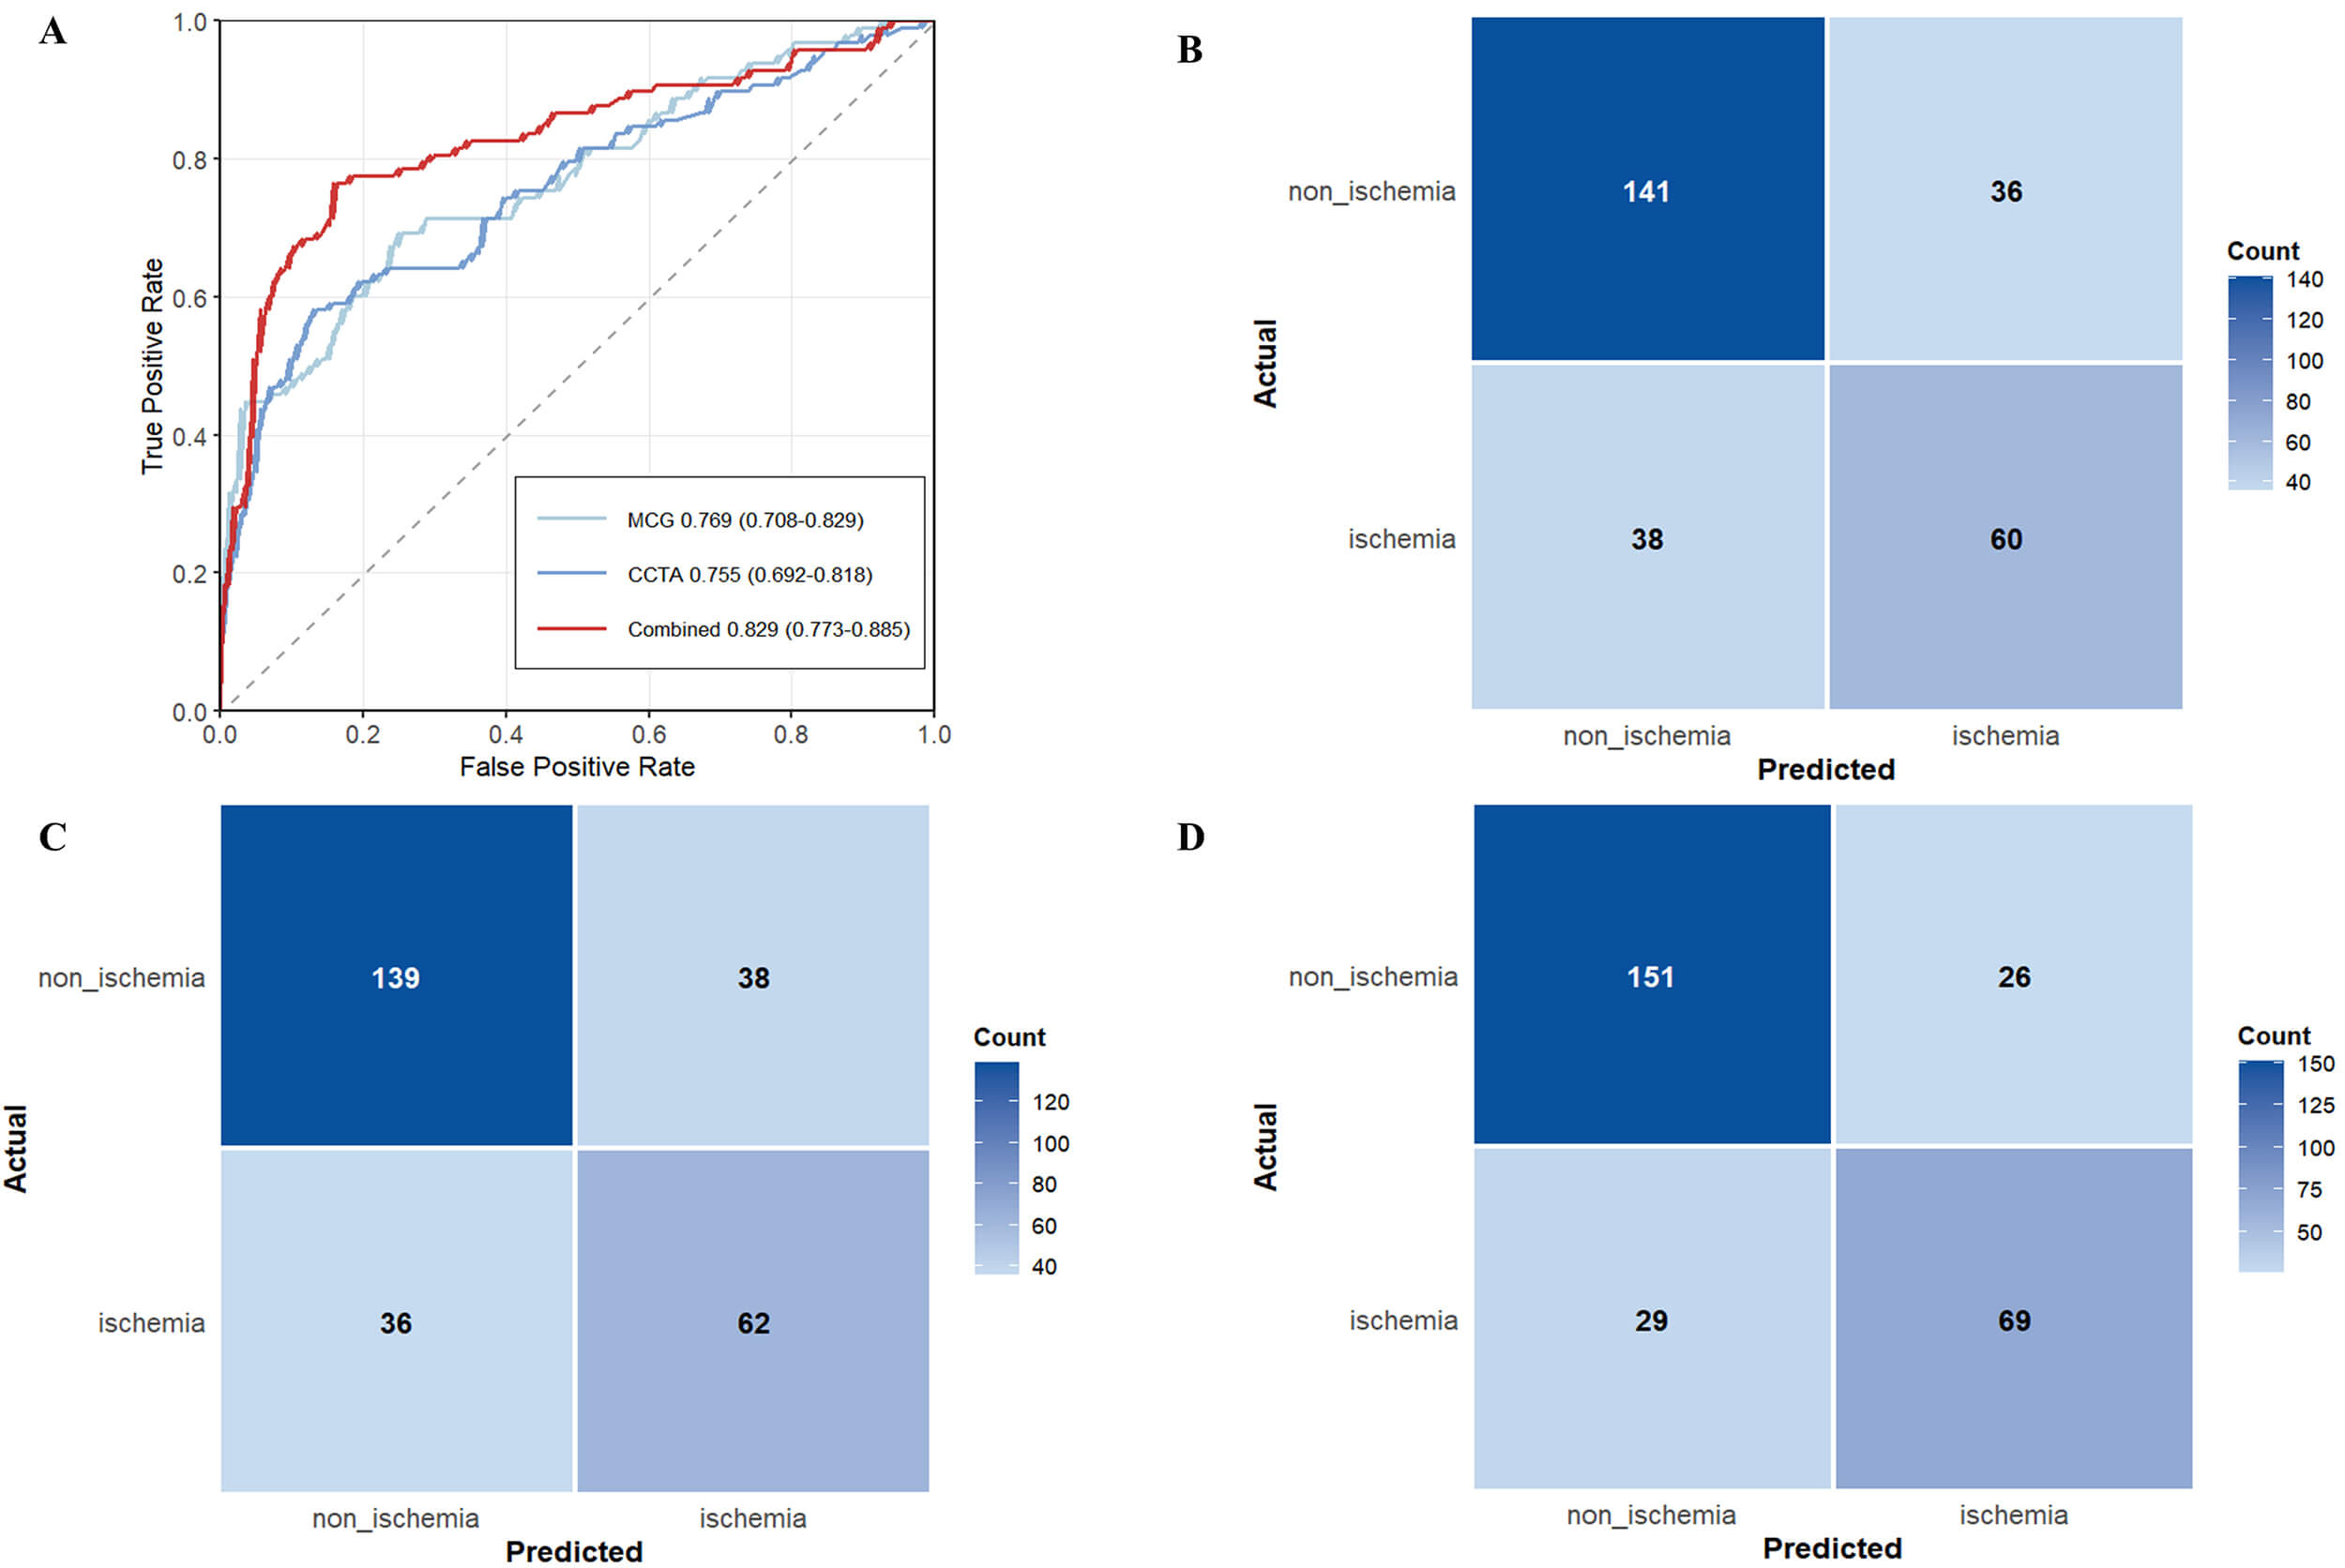 Fig. 3.
ROC curves and confusion matrices for MCG, CCTA, and MCG-CCTA models constructed by XGBoost. (A) ROC curve of the individual MCG model, the individual CCTA model, and the MCG-CCTA fusion model. (B) Confusion matrix analysis for the individual MCG model. (C) Confusion matrix analysis for the individual CCTA model. (D) Confusion matrix analysis for the MCG-CCTA fusion model.
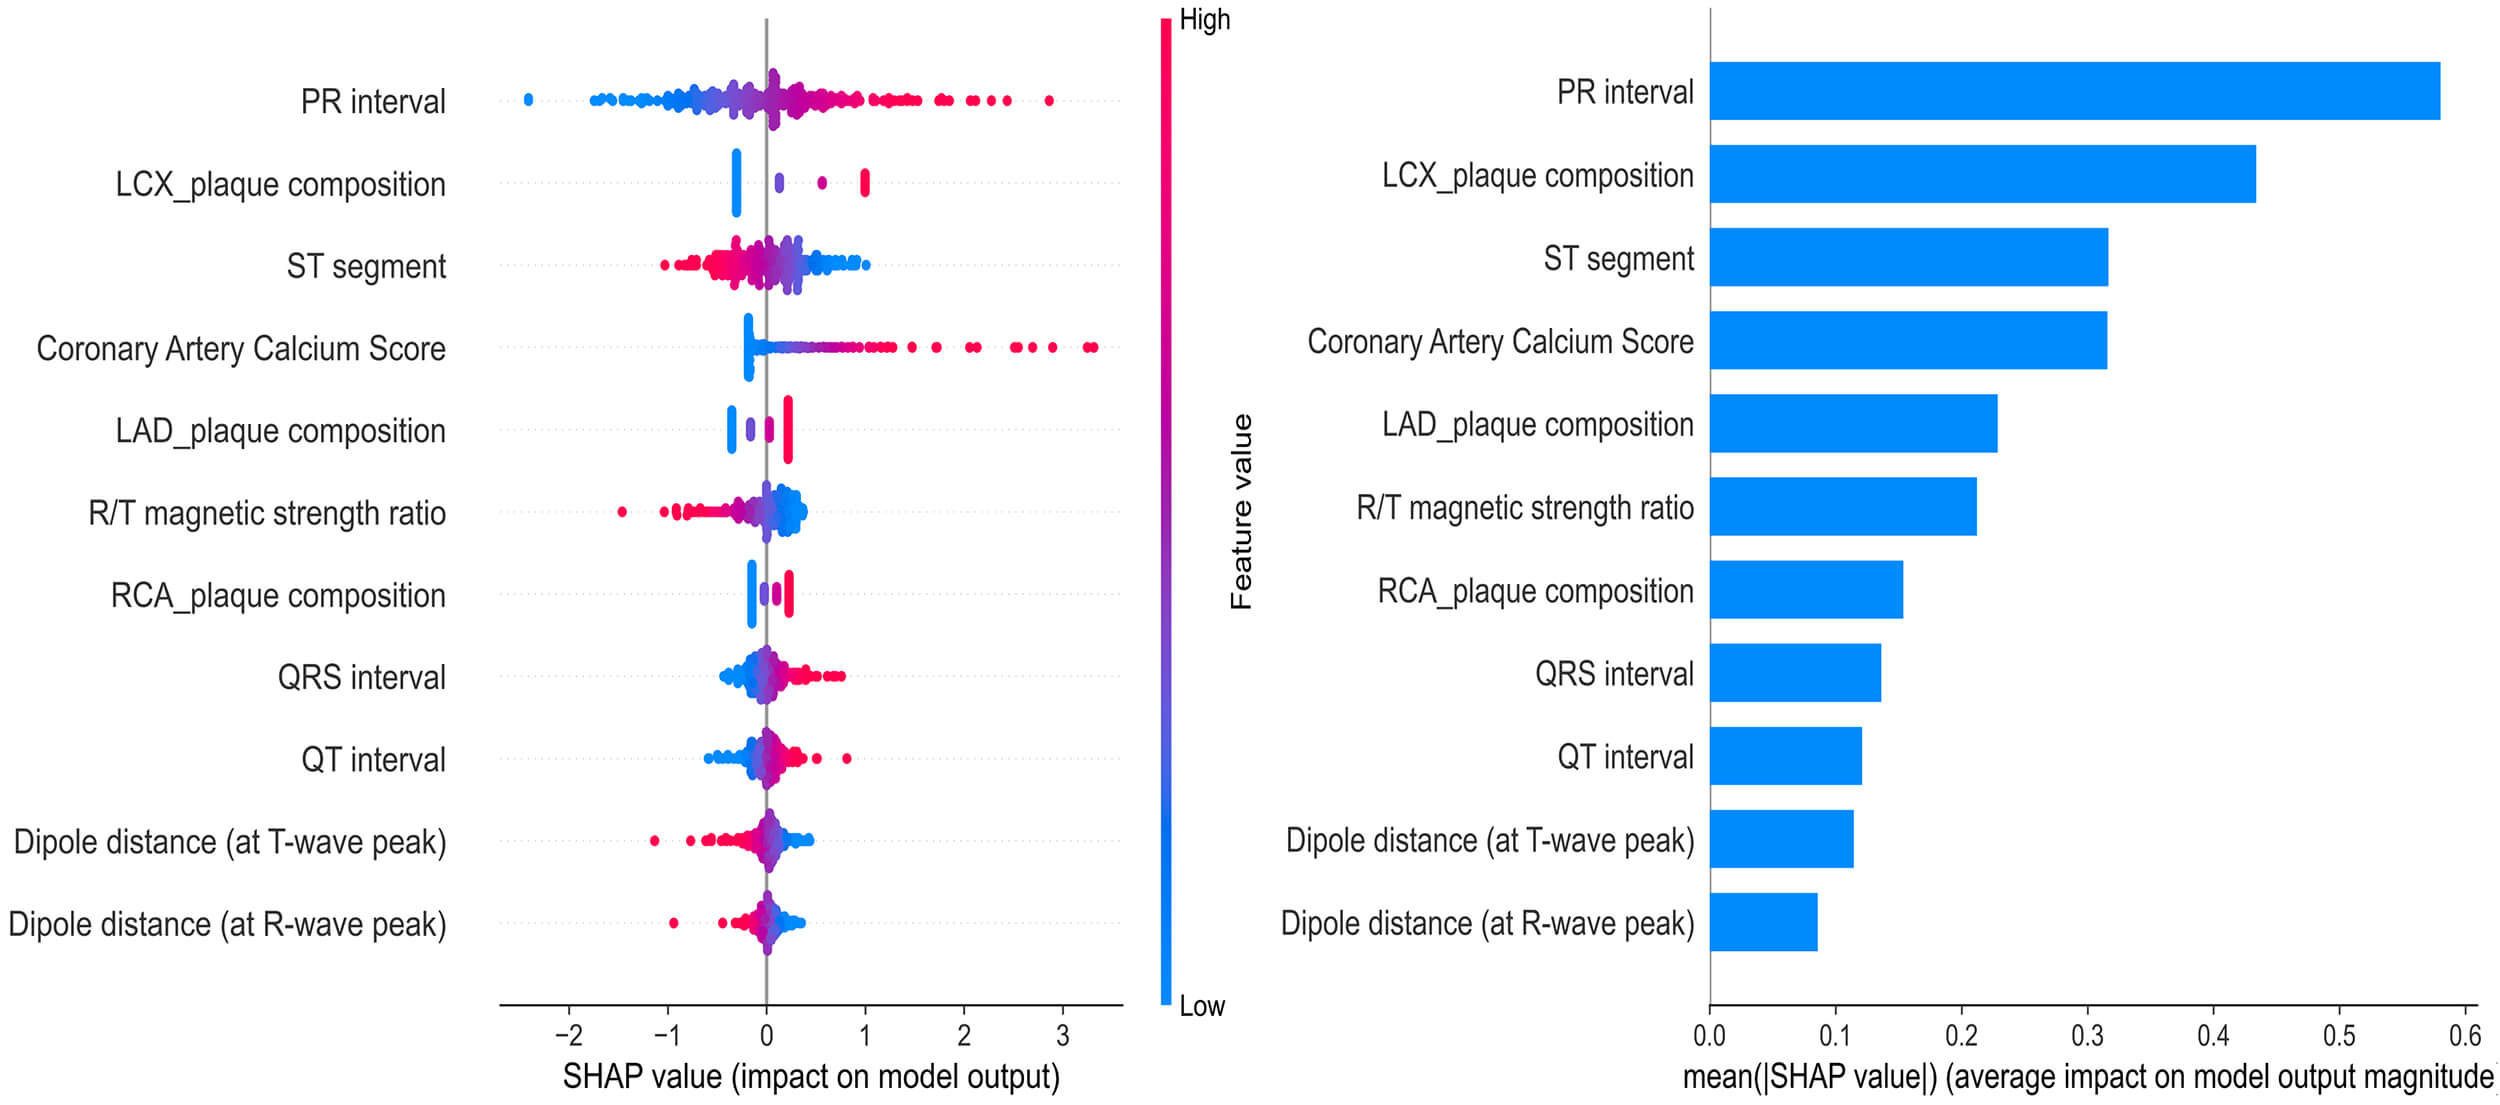
SHAP analysis based on the XGBoost combined model (MCG-CCTA fusion) revealed that both MCG and CCTA features significantly contributed to model predictions, confirming their complementary value (Fig. 4). Based on the mean absolute SHAP values, the most influential features were PR interval, LCX plaque composition, ST segment, CACS, and LAD plaque composition, followed by R/T magnetic strength ratio, RCA plaque composition, QRS interval, QT interval, dipole distance at T-wave peak, and dipole distance at R-wave peak. The top five features accounted for approximately 70% of the total feature importance, with MCG-derived timing indices ranking prominently and CCTA-derived plaque composition and calcification measures also making substantial contributions. These findings provide an interpretable explanation for the improved discrimination of the fusion model observed in the performance comparison.
 Fig. 4.
Global interpretability of the MCG-CCTA combined model constructed by XGBoost using SHAP values.
In this study, we developed a machine-learning model that integrates MCG and CCTA to detect functionally significant myocardial ischemia in patients with suspected CAD. By comparing models based on each modality with the combined approach, we found that the XGBoost-based combined MCG-CCTA model achieved the best ischemia discrimination (AUC 0.829), outperforming the MCG model (AUC 0.769) and the CCTA model (AUC 0.755). Our findings suggest that the combined MCG-CCTA model may offer complementary value to current noninvasive ischemia evaluation methods and may help reduce unnecessary invasive testing.
Our findings indicate that MCG or CCTA alone have moderate diagnostic performance for detecting functionally significant ischemia, supporting their individual clinical utility and aligning with prior research. The PLATFORM trial showed that CCTA-based noninvasive functional assessment can streamline diagnostic pathways and reduce unnecessary invasive evaluations [19], while the MAGNETO study demonstrated that MCG can expedite the assessment of patients with suspected ischemia [20].
However, each modality has inherent limitations. Previous studies by Vavere
et al. [21] and Xu et al. [22] reported that severe coronary
calcification may lead to artifact-induced overestimation of stenosis severity on
CCTA, and He et al. [23] suggested that a potential temporal
dissociation between hemodynamic disturbances and electrophysiological
alterations may cause false-negative MCG results in some patients. In this
context, the enhanced performance of the fusion model likely reflects the
complementary strengths of the two modalities. Although only a small proportion
of patients in our cohort had substantial calcification (CACS
To further explain the fusion model’s superior discriminative performance, it is important to consider the physiological relevance of the selected features. MCG captures early electrical disturbances caused by myocardial ischemia, including conduction delays and repolarization disturbances [10]. In our feature selection, conduction and repolarization-related temporal indices (PR, QRS, QT) were significantly associated with ischemia, consistent with experimental studies showing that ischemia prolongs atrioventricular and ventricular conduction and alters action potential repolarization duration [24, 25, 26]. Classic electrophysiological ischemia markers such as ST-segment deviation and abnormal R/T magnetic amplitude ratio indicated an imbalance between depolarization and repolarization currents, in line with previous ECG and MCG studies [12]. Spatial dipole features, reflected by the distance between the peak dipoles of the R and T waves, suggested abnormal shifts in activation and recovery vector orientation. Similarly, Han et al. [27] reported that dipole displacement corresponded with coronary lesion location and severity. Anatomically, CACS and plaque composition in the LAD, LCX, and RCA formed the structural basis for ischemia, which is consistent with multicenter studies validating the value of CCTA in quantifying plaque burden and assessing calcification [28]. Integrating these electrophysiological and anatomical features provides a coherent mechanistic explanation for the fusion model’s superior diagnostic performance compared to either modality alone.
From a practical standpoint, the present findings should be considered in light of the current availability and cost of MCG. Although MCG is noninvasive, its implementation requires dedicated hardware, a magnetic shielding environment, and trained personnel, which currently may limit its use to specialized centers. The SERF-based platform used in this study eliminates the need for liquid-helium cooling required by conventional SQUID-based systems and may offer advantages in operational simplicity and long-term scalability [16], but infrastructure and workflow requirements remain significant. Therefore, our results support the diagnostic feasibility and potential incremental value of an MCG-CCTA pathway rather than an immediate cost-saving replacement for invasive FFR. Formal health-economic and multicenter validation studies are needed before routine adoption.
There are several limitations in our study. First, it was a single-center retrospective study with a limited sample size, which may restrict the generalizability of the findings. Second, all patients had CT-FFR, with invasive FFR available only in a small subset and used as the reference when present, which may introduce bias. Third, the interval between CCTA and MCG could extend to two weeks, potentially introducing temporal bias owing to changes in ischemic status. Fourth, the small cohort with severe calcification and the lack of detailed plaque features may have limited the depth of related analyses. Fifth, MCG data were obtained from a single SERF-based system at one center, and the lack of inter-scanner evaluation and standardized protocols may affect generalizability.
Future studies will expand enrollment into larger multicenter cohorts, collect more cases with severe coronary calcification or inconclusive CCTA findings for adequately powered subgroup analyses, and further develop individualized diagnostic strategies. Additional work will also evaluate the real-world impact of the fusion model on clinical decision-making, patient outcomes, and healthcare resource utilization.
In conclusion, combining MCG with CCTA through ML significantly improves the detection of functionally significant myocardial ischemia compared to either modality alone. By leveraging the complementary strengths of electrophysiological assessment and anatomical imaging, this approach enhances diagnostic accuracy and achieves a better balance between sensitivity and specificity. Clinically, it offers a promising noninvasive tool for ischemia evaluation, with the potential to refine risk stratification and reduce reliance on invasive procedures.
CCTA, coronary computed tomography angiography; MCG, magnetocardiography; CAD, coronary artery disease; FFR, fractional flow reserve; CT-FFR, CT-derived FFR; ICA, invasive coronary angiography; CFD, computational fluid dynamics; ML, machine learning; ECG, electrocardiography; SQUID, superconducting quantum interference devices; SERF, spin-exchange relaxation-free; CACS, calcium score; BMI, body mass index; TC, total cholesterol; TG, triglyceride; HDL-C, high-density lipoprotein cholesterol; LDL-C, low-density lipoprotein cholesterol; PIV, pan-immune-inflammation value; LVIDd, left ventricular internal dimension in diastole; LVIDs, left ventricular internal dimension in systole; FS, fractional shortening; LVEF, left ventricular ejection fraction; LR, logistic regression; SVM, support vector machine; RF, random forest; NB, naive bayes; XGBoost, extreme gradient boosting; PPV, positive predictive value; NPV, negative predictive value; IQR, interquartile range; ROC, receiver operating characteristic; LAD, left anterior descending artery; LCX, left circumflex artery; RCA, right coronary artery; CI, confidence interval; AUC, area under the receiver operating characteristic curve; SHAP, Shapley additive explanations.
The datasets used during the current study are available from the corresponding author on reasonable request.
XCL, ZW, and HPL conceived and designed the research study. XCL and SXL conducted the research, while ZW and HPL provided guidance and advice. XCL, SXL, LLS, and YLY performed data collection and statistical analysis. XCL drafted the manuscript. ZW and HPL provided critical revisions for important intellectual content and supervised the project. All authors contributed to the critical revision of the manuscript for important intellectual content. All authors have read and approved the final manuscript. Furthermore, all authors have contributed sufficiently to the work and have agreed to be accountable for all aspects of the research.
The study was conducted in accordance with the Declaration of Helsinki. The research protocol was approved by the Ethics Committee of the Affiliated Hangzhou First People’s Hospital, Westlake University School of Medicine (Ethic Approval Number: IIT-20231214-0298-02). Written informed consent was obtained from all enrolled patients prior to their participation in the study.
We sincerely thank all the clinical and research staff from the Departments of Radiology, Cardiology, and Emergency Medicine at Hangzhou First People’s Hospital for their valuable support and assistance in this study.
This research was funded by Zhejiang Provincial Public Welfare Research Project (LGC22H180003), Zhejiang Provincial Traditional Chinese Medicine Science and Technology Project (2023ZL563), Science and Technology Development Project of Hangzhou (2021WJCY254), and Practical Study on Curriculum Integration Reform for Cardiovascular Imaging System (230805236015215).
The authors declare no conflicts of interest.
Supplementary material associated with this article can be found, in the online version, at https://doi.org/10.31083/RCM47473.
References
Publisher’s Note: IMR Press stays neutral with regard to jurisdictional claims in published maps and institutional affiliations.