


 , Yanping Dong 1,†, Aiyun Sun 2, Hao Xu 3, Xinyang Ge 3, Ronghua Wu 1, Shanshan Ying 1, Xiu Zhang 1, Jing Yuan 3, Jiangfeng Pan 1,*
1 Department of Medical Imaging, Affiliated Jinhua Hospital, Zhejiang University School of Medicine, 321000 Jinhua, Zhejiang, China
2 CT Imaging Research Center, GE HealthCare China, 200010 Shanghai, China
3 College of Mathematical Medicine, Zhejiang Normal University, 321004 Jinhua, Zhejiang, China
†These authors contributed equally.
Abstract
The heart motion correction algorithm used in current multi-slice computed tomography (CT) is sufficient for coronary artery imaging in patients with high heart rates. However, the effect of this algorithm on the image quality in whole-cardiac-cycle reconstructions remains unclear. Therefore, this study aimed to investigate image quality, segmentation performance, and cardiac structure and function assessment using a heart motion correction algorithm for coronary CT angiography in patients with rapid heart rates.
This study retrospectively collected data from 58 consecutive patients with high heart rates (≥80 beats/min), of whom 36 also underwent cardiac magnetic resonance (CMR) imaging. CT images were reconstructed from 0% to 100% in 5% increments using the standard reconstruction (STD) and second-generation snapshot freeze (SSF2) protocols, and then processed by an automatic heart segmentation algorithm. Image quality, segmentation performance, cardiac volumes, and functional parameters were compared between protocols.
Compared with the STD protocol, the SSF2 protocol yielded a higher image quality score (3.91 ± 0.29 vs. 3.84 ± 0.37; p < 0.01), a steeper edge rise slope (41.71 ± 19.03 vs. 25.59 ± 13.16; p < 0.01), and lower entropy (4.12 ± 0.48 vs. 4.40 ± 0.28; p < 0.01). For left ventricular end-diastolic volume, the intraclass correlation coefficient (ICC) between automatic segmentation and manual contouring for the SSF2 protocol was 0.96, and the coefficient of variation was 7.84%. In contrast, the coefficients of variation for left ventricular end-systolic volume were poor (48.24% for STD and 48.18% for SSF2). Differences in global circumferential strain (–13.30 ± 3.42 vs. –15.01 ± 4.44; p < 0.01) and global longitudinal strain (–11.80 ± 4.83 vs. –13.01 ± 4.36; p < 0.01) between SSF2 and CMR were statistically significant, although correlations (ICC = 0.90 and 0.85, respectively) were good.
SSF2 significantly improves image quality, structure, and function, and enables strain assessment in whole-cardiac-cycle reconstructions in patients with high heart rates. SSF2 also demonstrates superior performance over the STD protocol for evaluating myocardial strain.
Keywords
- coronary computed tomography angiography
- motion correction
- heart segmentation
- strain
Coronary computed tomography angiography (CCTA) is widely used in the diagnosis and evaluation of cardiovascular diseases, including coronary heart disease, congenital heart disease, valvular abnormalities, and atrial fibrillation [1, 2, 3, 4, 5]. Elevated heart rate increases the incidence of motion artifacts and decreases image quality. Recent studies have revealed that the heart motion correction algorithm yields satisfactory images in patients with high heart rates [6]. The second-generation snapshot freeze (SSF2) algorithm—a novel deep learning-based heart motion correction method integrated into CCTA reconstruction—has enhanced coronary artery imaging in patients with increased heart rate [7]. Furthermore, SSF2 effectively stabilizes the left atrium, left atrial appendage, heart valve, and other structures, thereby improving diagnostic capabilities [1, 5].
Heart segmentation on CCTA is widely used to analyze cardiac structure and function [8, 9]. Manual segmentation remains feasible and strongly correlates with cardiac magnetic resonance (CMR) and echocardiography in evaluating atrial and ventricular volumes and ejection fraction in patients with moderate or low heart rate [8, 9, 10]. Achieving high-quality CCTA images in patients with high heart rates remains challenging. SSF2 has improved image quality during systole more effectively than during diastole in single-phase reconstruction of the valve and left atrium in patients with high heart rates [5]. However, its applicability to whole-cardiac-cycle reconstruction for functional analysis remains uncertain.
The whole-cardiac-cycle reconstruction of CCTA enables cardiac function and
myocardial strain evaluation in patients with conditions such as coronary heart
disease, valvular disease, hypertrophic cardiomyopathy, atrial fibrillation, and
congenital heart disease [2, 4, 11, 12, 13]. However, results from different studies
have indicated considerable variability. Recent studies revealed a strong
correlation between CCTA, echocardiography, and CMR in the analysis of cardiac
function, myocardial strain [4, 10, 14], and prognostic value [1, 15]. However, some
studies have reported discrepancies in functional and strain parameters across
modalities [10, 16, 17, 18]. There is a good reproducibility of myocardial strain
measurements at moderate or slow heart rates (69
This study aimed to investigate the application of SSF2 in enhancing CCTA image quality and heart segmentation, as well as the assessment of cardiac structure and function and myocardial strain in patients with high heart rates.
This retrospective study consecutively included 22,286 patients who underwent CCTA
examination between September 2023 and April 2025. The inclusion
criteria were a heart rate of
A 256-slice CT scanner (Revolution Apex CT, GE Healthcare, Milwaukee, WI, USA) with a retrospective electrocardiogram (ECG)-gated scanning protocol was used for CCTA. The scan parameters included a tube voltage of 100–120 kV, a tube current of 800–1000 mAs, a tube rotation time of 0.28 s, and a detector coverage of 140–160 mm. ECG gating covered the entire cardiac cycle (0%–100%). The contrast agent, ioversol (350 mg/100 mL; Hengrui Pharmaceuticals, Lian Yungang, Jiangsu, China), was administered at a dosage of 1.0–1.5 mL/kg and at a rate of 5.0 mL/s after a sequential injection of 10 mL saline, 8 mL contrast at 3.5 mL/s, and 20 mL saline at 3.5 mL/s. A bolus-tracking technique was employed for imaging, with a threshold CT attenuation of 60 HU at the descending aorta and a delay of 8 s after contrast injection.
The reconstructed slice thickness and interval were set to 0.625 mm. Images were reconstructed for the full cardiac cycle (0%–100%) at 5% intervals. Both the standard reconstruction (STD) and SSF2 protocols used deep learning-based image reconstruction. In the STD protocol, images were reconstructed automatically after acquisition. In the SSF2 protocol, STD images were post-processed using the SSF2 software, which performs fully automated reconstruction without interaction. Cardiac phases and reconstruction intervals were kept consistent across both protocols to ensure comparability. SSF2, which operates in axial scanning mode, captures data across three cardiac phases and integrates corresponding images to characterize the motion dynamics of the central phase (the target phase).
The qualitative evaluation of image quality focused on the clarity of anatomical structures, including the boundaries of the endocardium, valves, papillary muscle, chordae tendineae, and trabeculae. All images were visually assessed and scored on the following scale: 4 = excellent, no artifact; 3 = good, minimal artifact, no impact on diagnosis; 2 = some artifact in the heart, but still usable for diagnosis; 1 = poor, significant artifact, diagnosis not possible. Two radiologists, each with over 5 years of experience in cardiovascular CT post-processing and reporting, conducted the qualitative evaluation. If discrepancies arose, a senior radiologist with over 10 years of experience resolved the inconsistency.
Quantitative evaluation metrics included signal-to-noise ratio (SNR), contrast-to-noise ratio (CNR), edge rise slope (ERS), and entropy. An image with the most severe artifact in the STD protocol was manually selected, the cardiac phase and slice location were confirmed, and the image with the same cardiac phase and slice location of the SSF2 protocol was selected for analysis. A senior radiologist with over 10 years of experience in cardiovascular CT post-processing and reporting conducted the quantitative analysis.
Two regions of interest (ROIs), each measuring 8–10 mm2, were placed on the left ventricular myocardium and background, respectively, to calculate the density ratio between the two ROIs and identify SNR. The third ROI of 8–10 mm2 was placed on the left ventricle to calculate the density difference between the ventricle and myocardium. This density difference, along with the background density, was utilized to calculate the ratio and obtain CNR.
A straight line of 2–3 cm length connecting the ventricle and myocardium was drawn to generate a CT attenuation curve at the same location for images reconstructed with the STD and SSF2 protocols (Fig. 1).
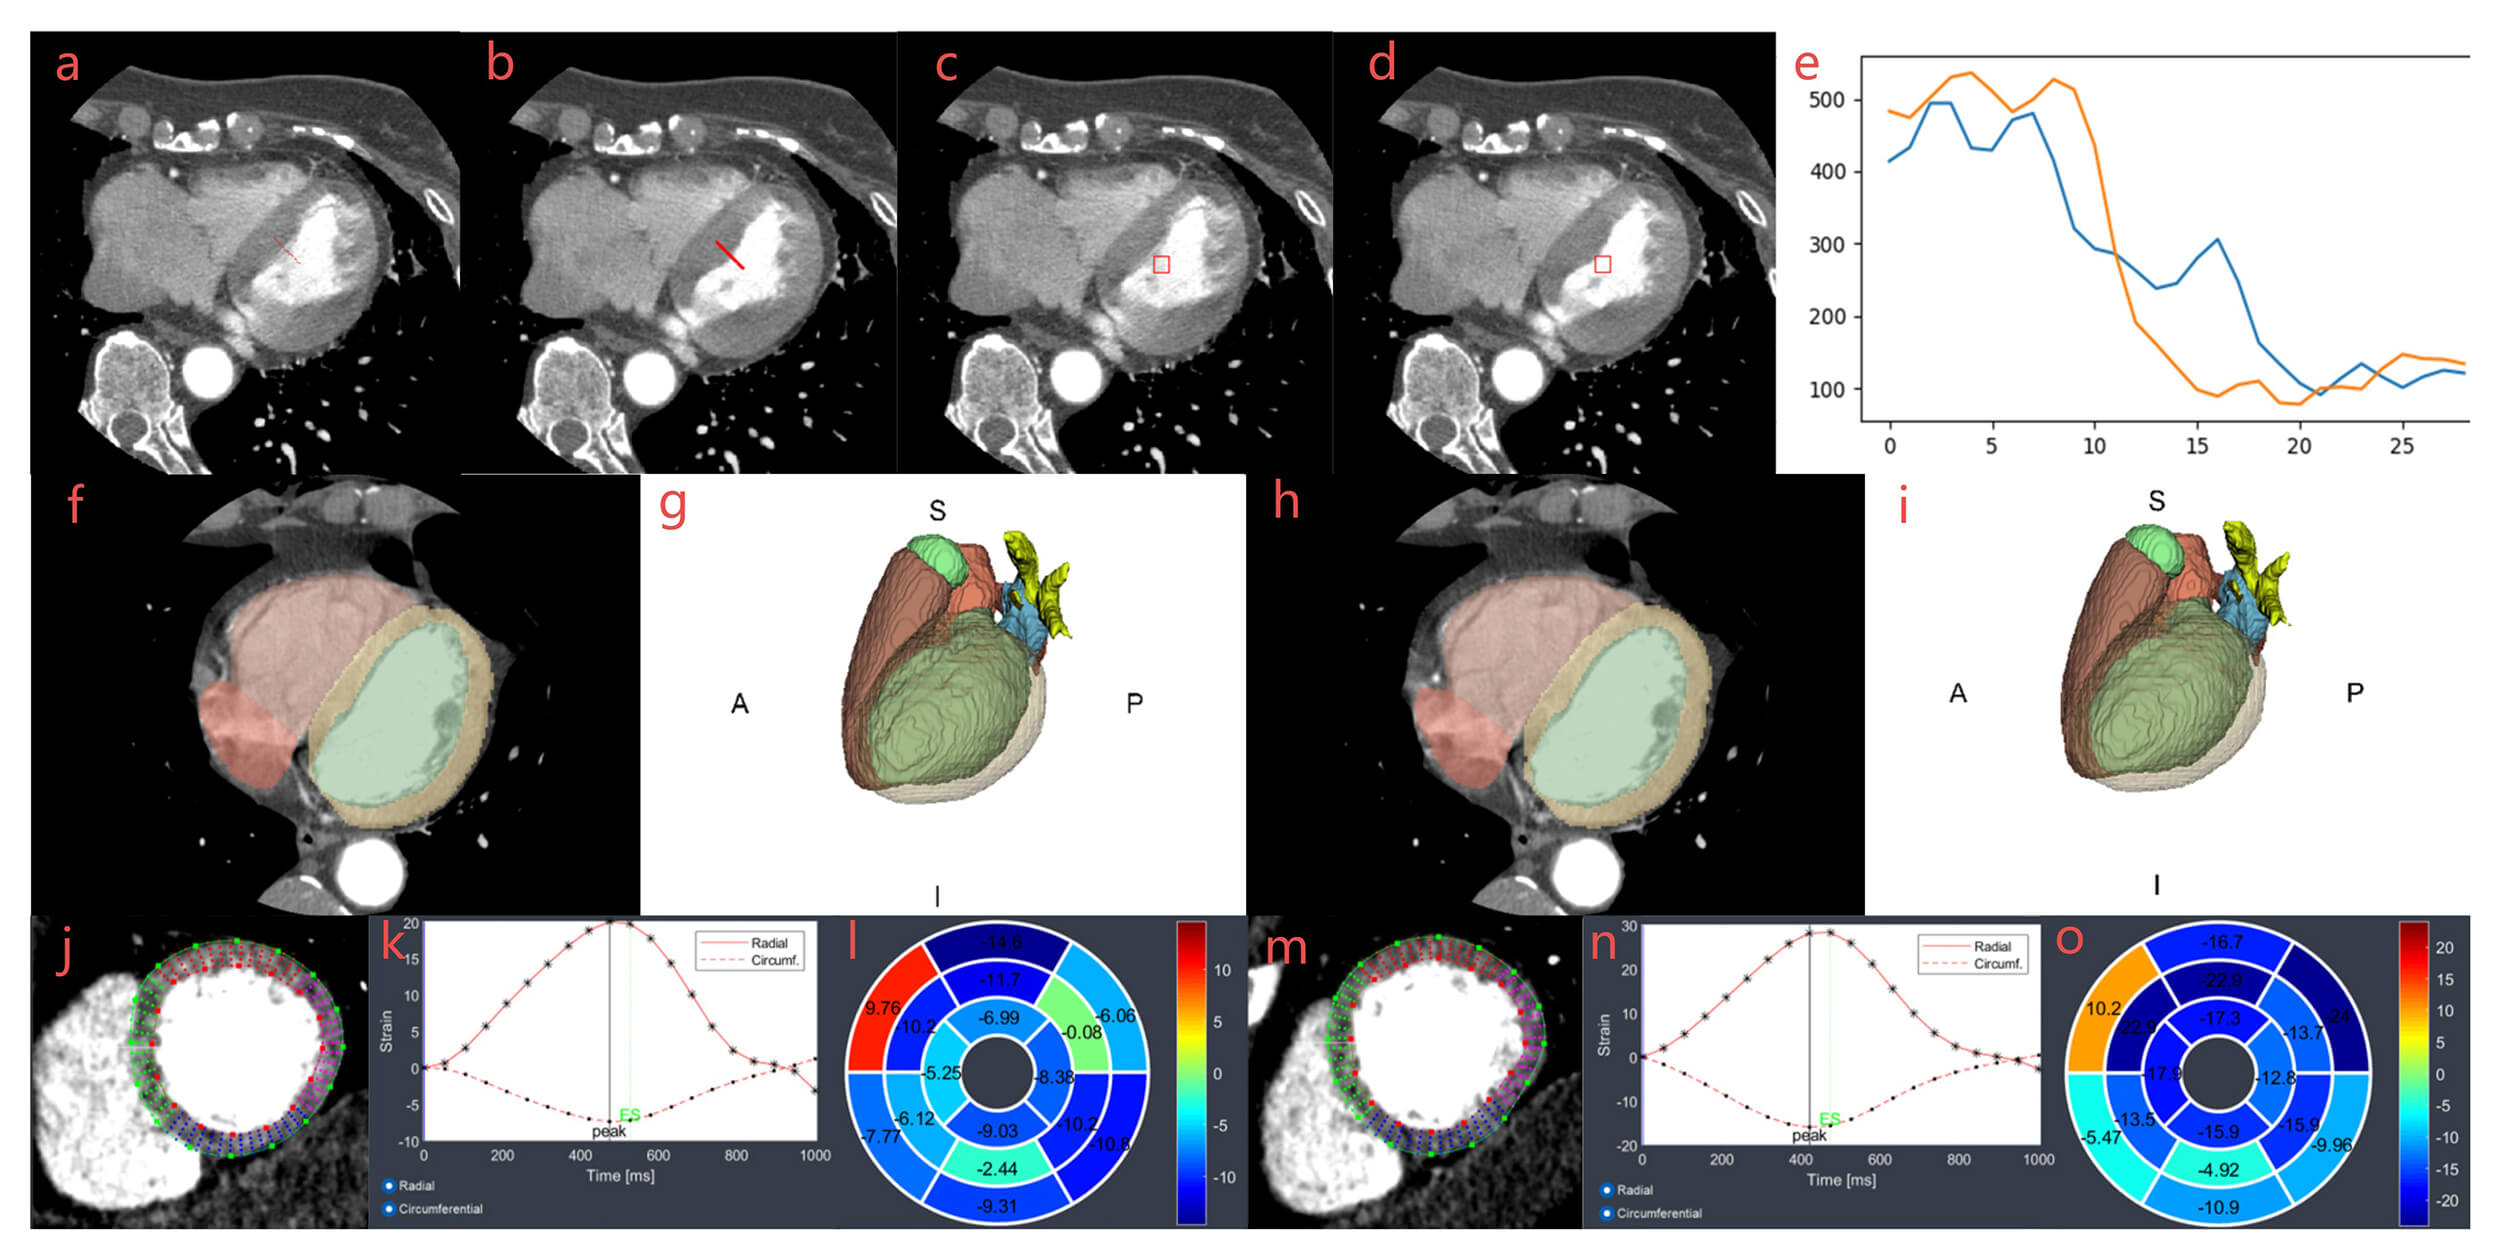 Fig. 1.
Workflow of entropy, ERS, heart segmentation, and strain analysis. Measurement and calculation of entropy (a,b) and ERS (c–e) between STD (a,c) and SSF2 (b,d) cases. ROI and line were drawn manually in (a,c). A matched ROI and line were generated automatically in images (b,d), and two curves in image (e) were used to calculate ERS. Images (f–i) were two-dimensional and three-dimensional segmentations of the heart for STD (f,g) and SSF2 (h,i) cases. Images (j–o) were strain analyses of the left ventricle for STD (j–l) and SSF2 (m–o) cases. Images (j,m) were strain images, images (k,n) were radial and circumferential strain curves, and images (l,o) were strain bullseye maps. A, anterior, S, superior, P, posterior, I, inferior; ERS, edge rise slope; STD, standard reconstruction; SSF2, second-generation snapshot freeze; ROI, region of interest.
A defined ROI of 8–10 mm2 was placed on the left ventricle near the endocardium. The entropy can be identified using the following formula:
where h is the intensity of a pixel in ROI and
where N is the number of pixels in the ROI and
In this study, the three-dimensional (3D) U-Net model was employed to automatically segment the
heart acquired from STD and SSF2 protocols. The three-dimensional (3D) U-Net architecture comprised
three max-pooling and deconvolutional stages, each with a stride of 2
Left ventricular volume and ejection fraction were analyzed using manual contouring (MC) using the commercially available Segment CT 4.0 (Medviso, Lund, Sweden) software package. Images of the whole cardiac cycle obtained via the SSF2 protocol were subjected to multiplanar reconstruction, and left ventricular short-axis CT cine images were generated with a reconstruction slice thickness and spacing of 3 mm. Endocardial and epicardial borders were manually delineated in the short-axis stack at the end-systolic and end-diastolic phases.
The commercially available Segment CT 4.0 (Medviso, Lund, Sweden) software package was used to analyze the original three-dimensional CT datasets offline. From these datasets, two-dimensional cine loops of three long-axis views (two-, three-, and four-chamber) and a short-axis stack with a 3-mm reconstruction increment were generated. Strain analysis was performed using reconstructed CCTA cine images. Global longitudinal strain (GLS) and global radial strain for the long axis (GRS-LA) were calculated as the average of peak systolic strain values extracted from three long-axis views (two-, three-, and four-chamber). Global circumferential strain (GCS) and global radial strain of short-axis (GRS-SA) were derived from three short-axis views (basal, mid, and apical; Fig. 1). CVI42 6.0.2 (Circle Cardiovascular Imaging, Calgary, Canada) was used for strain analysis on CMR. End-diastolic contours of the left ventricular endocardium and epicardium were manually delineated on two-, three-, and four-chamber views and short-axis cine images, and myocardial strain was calculated. To ensure reliability, intraobserver and interobserver variability in myocardial strain analysis were assessed before strain analysis for both CCTA and CMR datasets. Observers comprised radiologists with over 10 years of work experience in CCTA and CMR.
Quantitative data were presented as means
This study enrolled 58 patients with high heart rates, with an average heart
rate of 89.40
The image quality scores for endocardium, valves, papillary muscles, chordae
tendineae, and trabeculae were higher; the overall image quality for diagnosis score was higher in SSF2 protocol. (3.91
| STD protocol | SSF2 protocol | p value | ||
| Parameter | ||||
| CT Blood | 402.02 |
448.79 |
||
| CT Myocardium | 130.30 |
121.30 |
0.12 | |
| Background | 69.89 |
61.70 |
||
| SNR | 7.30 |
9.02 |
||
| CNR | 5.03 |
6.55 |
||
| ERS | 25.59 |
41.71 |
||
| Entropy | 4.40 |
4.12 |
||
| Visual assessment | ||||
| Artifact | 1.53 |
1.15 |
||
| Endocardium | 3.68 |
3.93 |
||
| Valves | 3.86 |
3.95 |
0.03 | |
| Papillary muscle, chordae tendineae and trabeculae | 3.86 |
3.96 |
||
| Image quality for diagnosis | 3.84 |
3.91 |
||
SNR, signal-to-noise ratio; CNR, contrast-to-noise ratio.
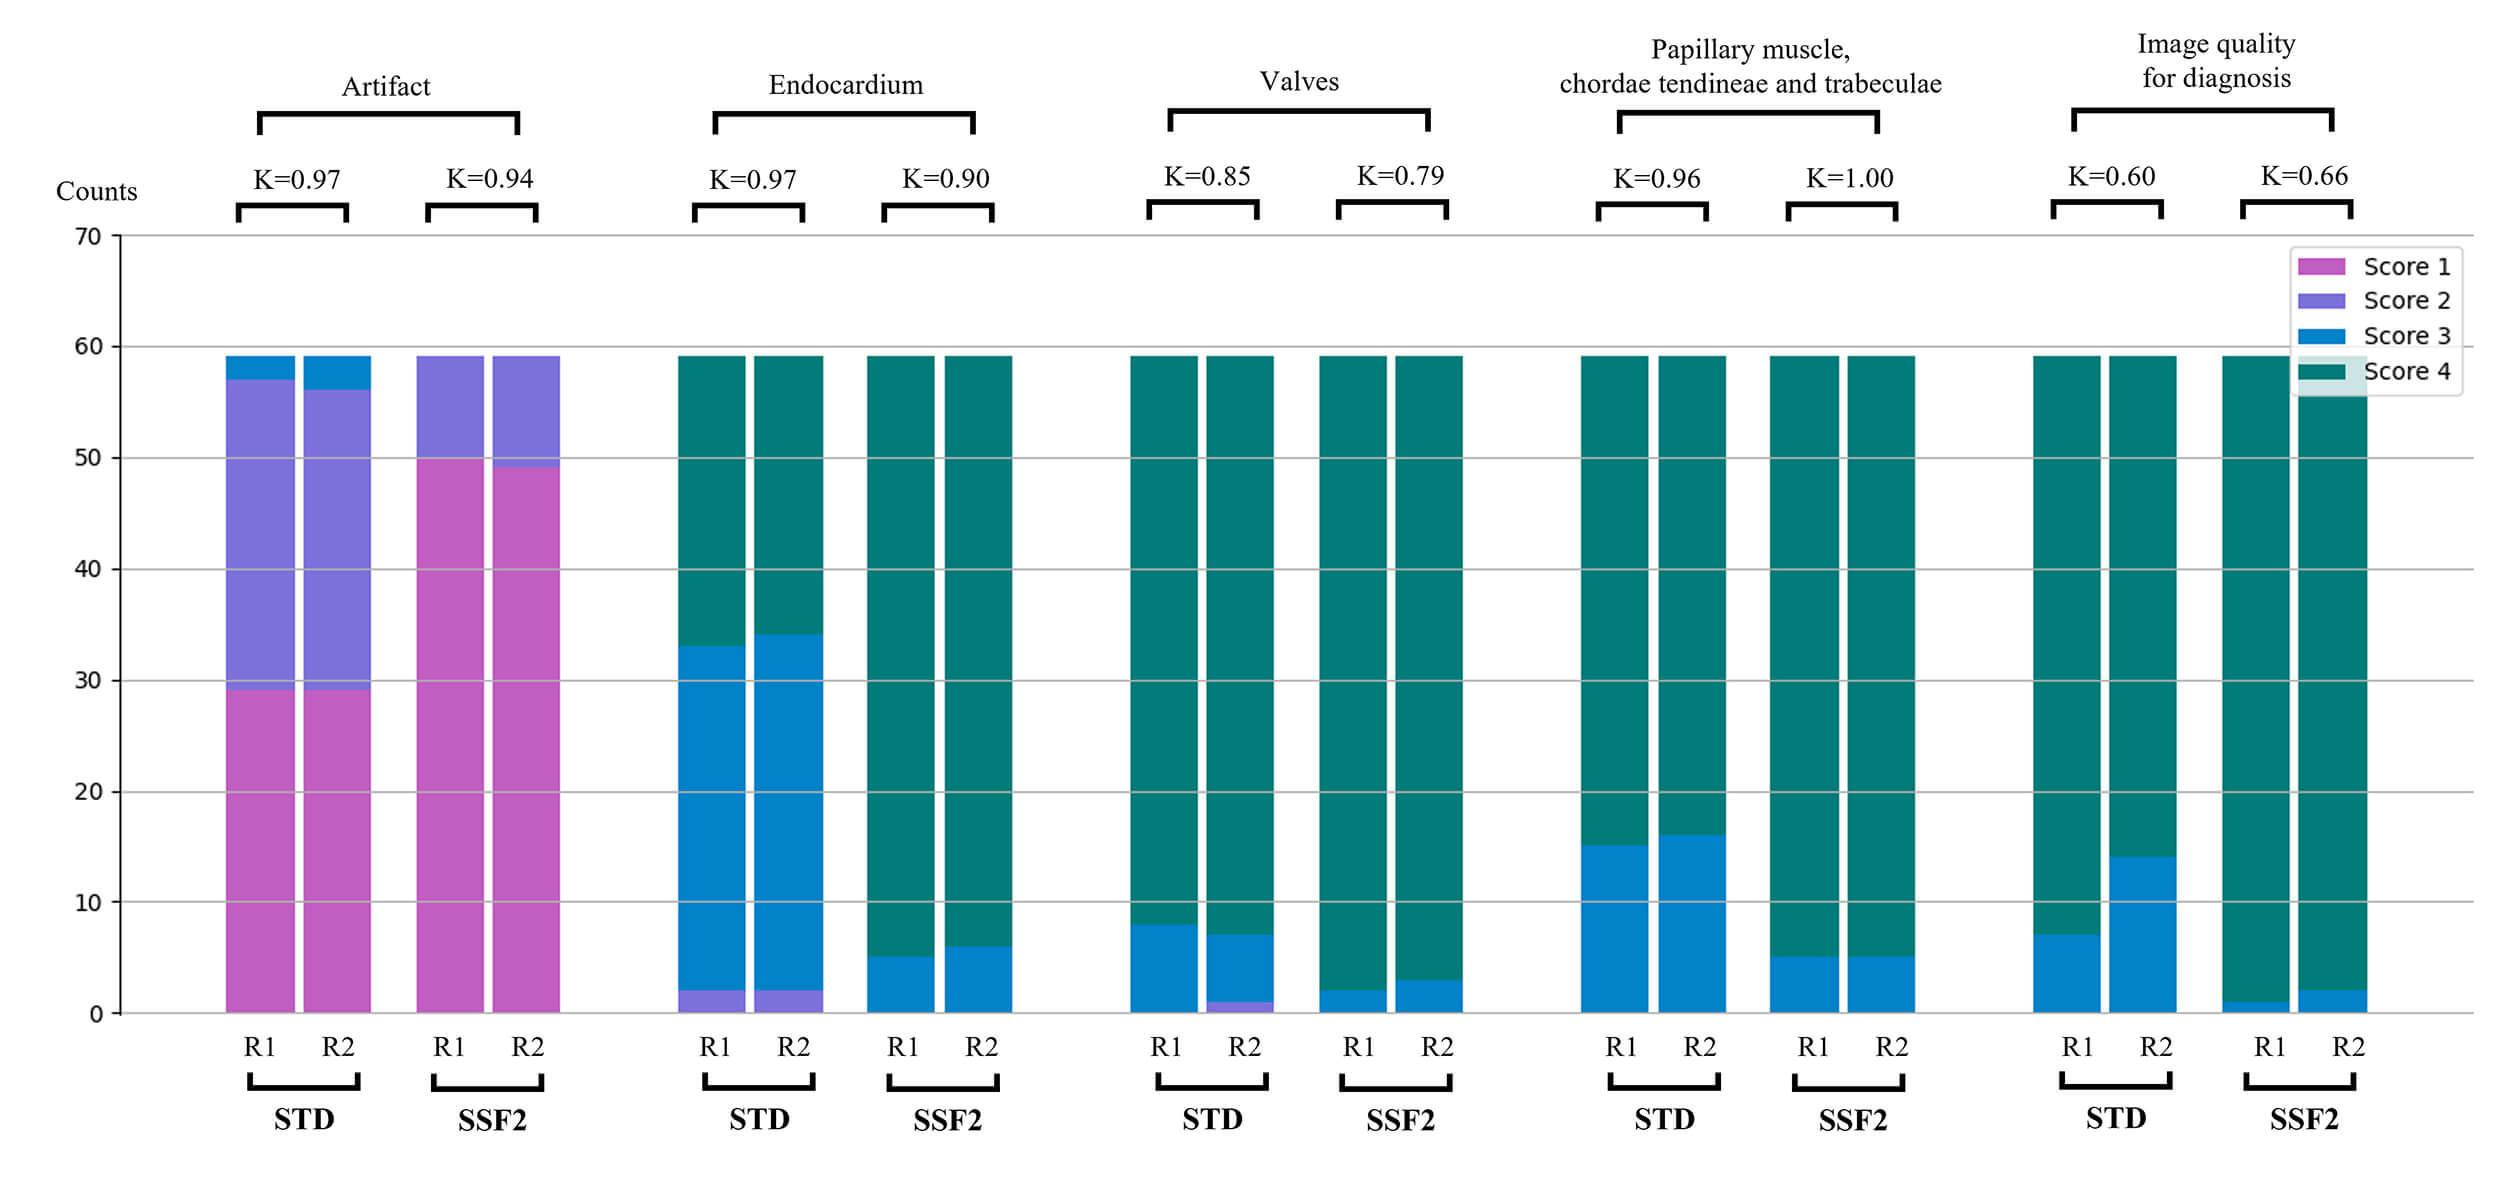 Fig. 2.
Image quality and artifact assessment between the STD and SSF2
groups by two readers. p = 0.03 for the comparison between groups, the
remaining p-values were
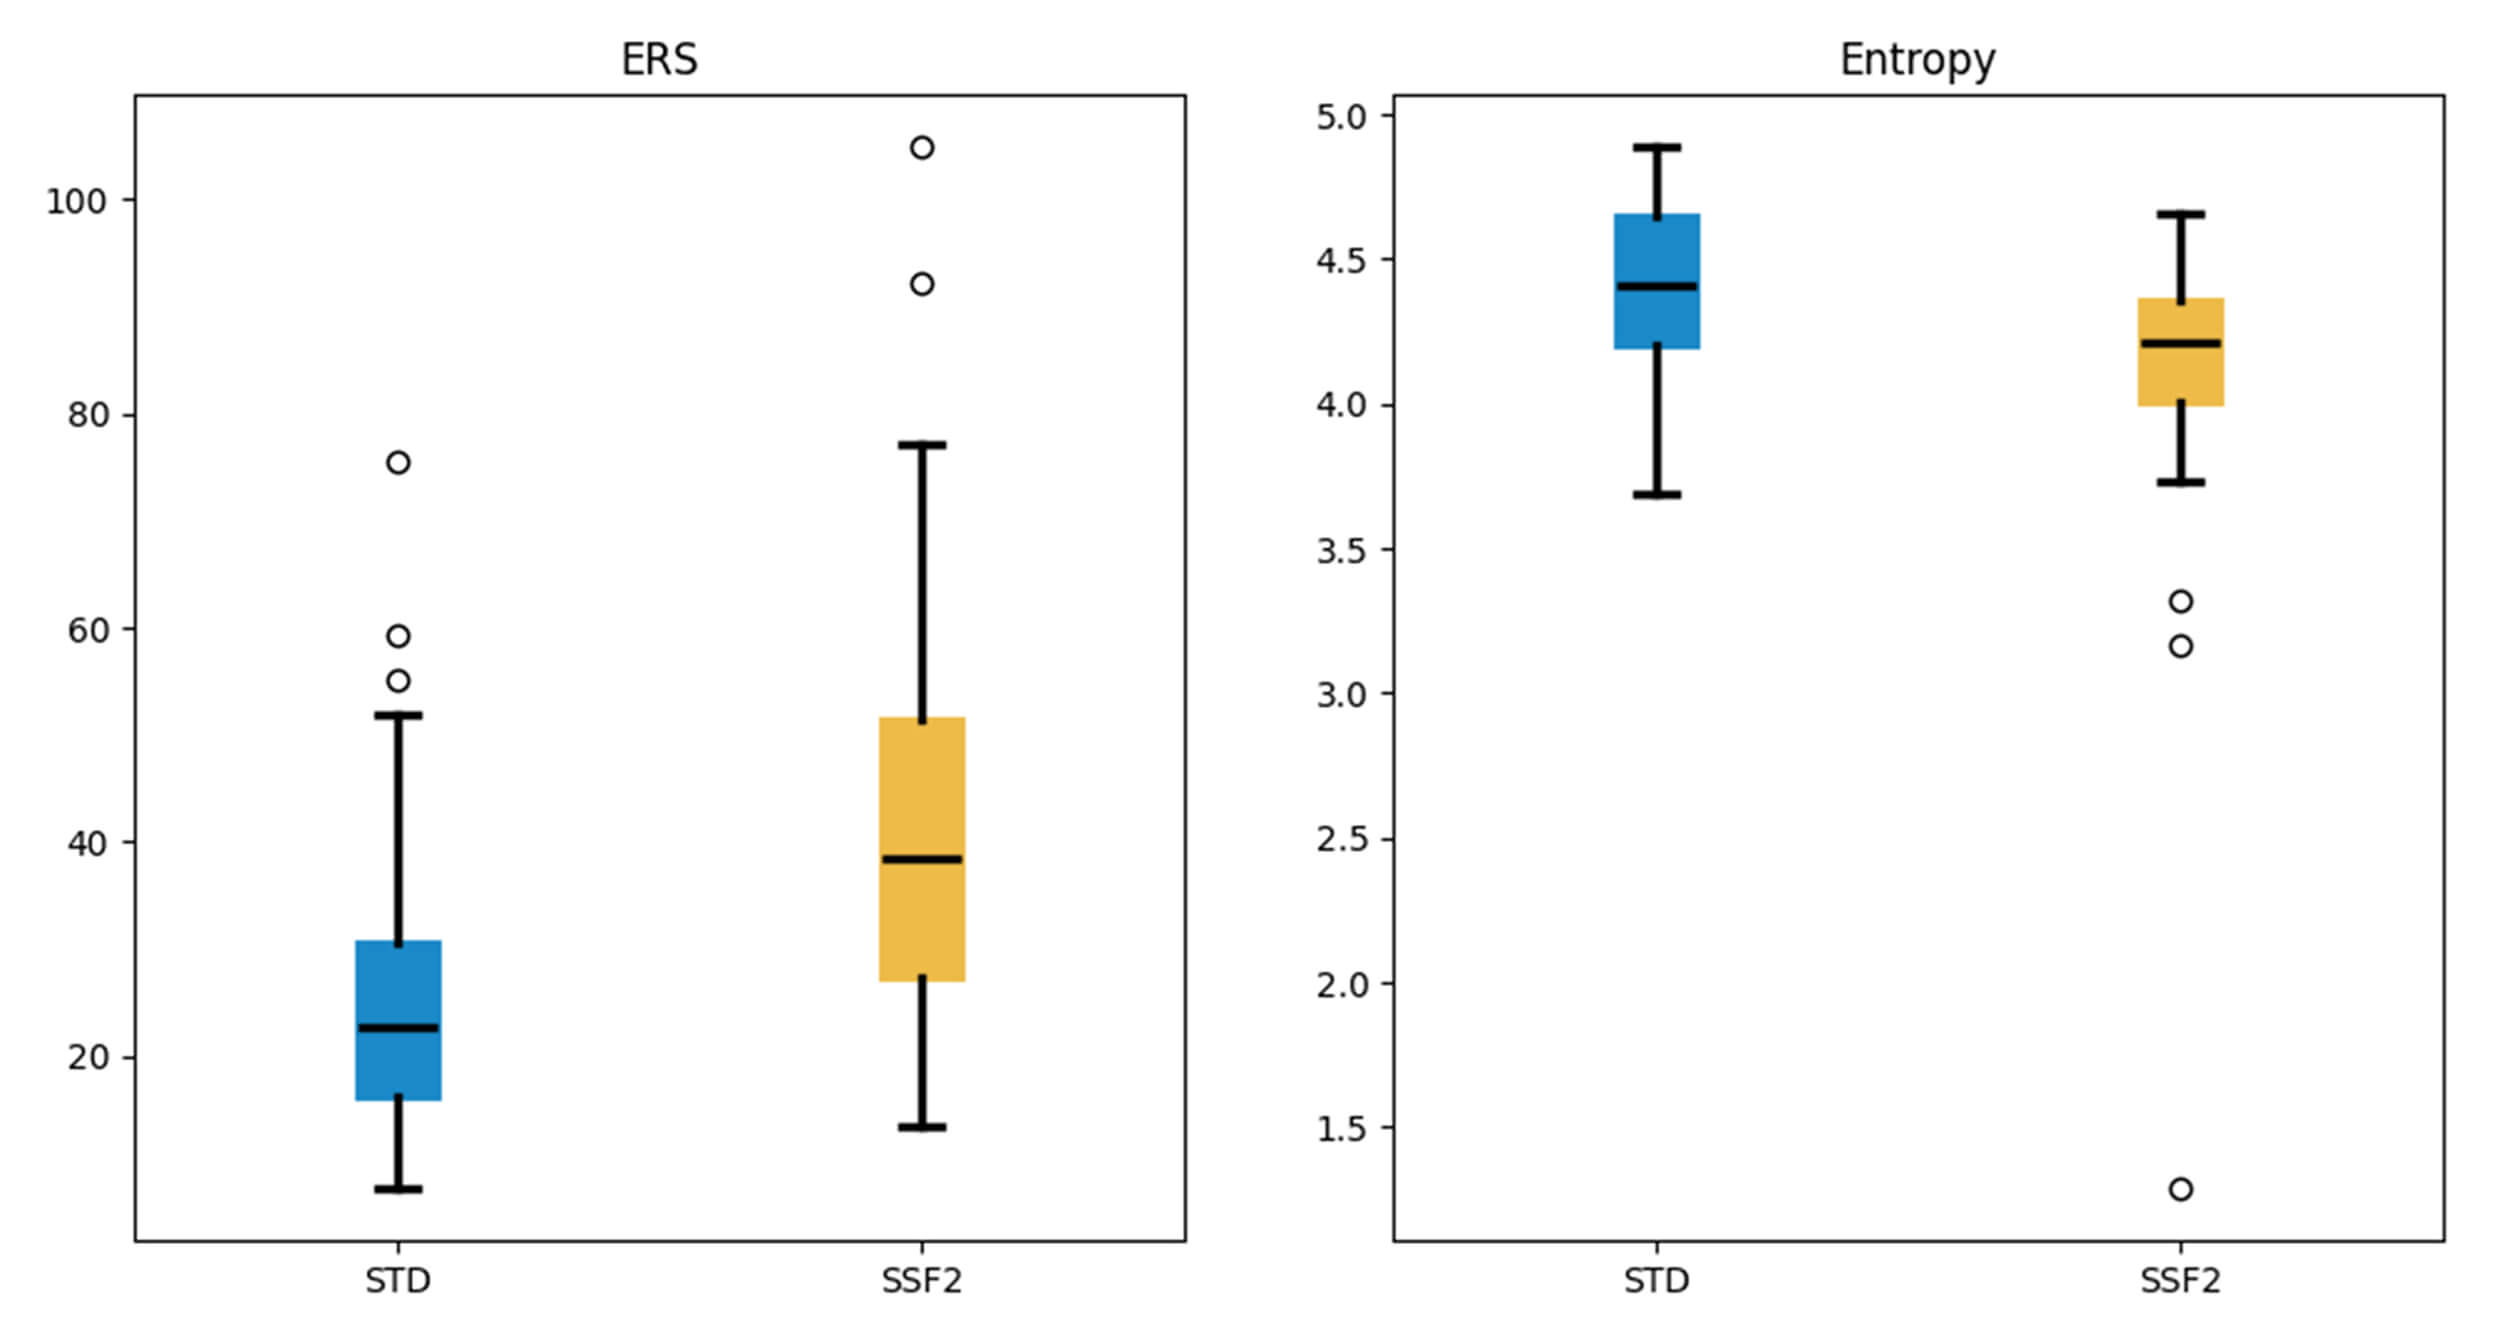 Fig. 3.
Comparisons of ERS and entropy between the STD and SSF2 groups.
All p-values were
Automatic segmentation of the left ventricle indicated that left ventricular
end-diastolic volume (LVEDV) and left ventricular end-systolic volume (LVESV)
were increased in the STD and SSF2 protocols compared with the MC protocol. The
ICCs for LVEDV and LVESV were excellent (
| Variable | STD protocol (n = 58) | SSF2 protocol (n = 58) | MC protocol (n = 58) | STD protocol versus MC protocol | SSF2 protocol versus MC protocol | ||||
| p value* | ICC* | CV* (%) | p value† | ICC† | CV† (%) | ||||
| LVEDV (mL) | 139.97 |
138.30 |
132.48 |
0.96 | 8.42 | 0.96 | 7.84 | ||
| LVESV (mL) | 70.25 |
70.20 |
50.62 |
0.95 | 48.24 | 0.95 | 48.18 | ||
| LVEF (%) | 51.28 |
48.86 |
64.61 |
0.59 | 20.14 | 0.59 | 21.09 | ||
MC, manual contouring; ICC, intraclass correlation coefficient; CV, coefficient of variance.
*, STD protocol versus MC protocol; †, SSF2 protocol versus MC protocol.
| Variable | STD (n = 58) | SSF2 (n = 58) | p value | ICC | 95% CI | CV (%) | 95% CI |
| LVEDV (mL) | 139.97 |
138.30 |
0.99 | 0.99–0.99 | 1.24 | 1.01–1.48 | |
| LVESV (mL) | 70.25 |
70.204 |
0.88 | 0.99 | 0.99–0.99 | 0.78 | 0.64–0.93 |
| LVEF (%) | 51.28 |
48.86 |
0.99 | 0.99–0.99 | 1.58 | 1.29–1.88 | |
| RVEDV (mL) | 144.75 |
145.84 |
0.99 | 0.99–0.99 | 1.79 | 1.46–2.13 | |
| RVESV (mL) | 82.75 |
83.03 |
0.99 | 0.99–0.99 | 0.64 | 0.52–0.75 | |
| RVEF (%) | 43.73 |
44.07 |
0.06 | 0.98 | 0.97–0.99 | 2.16 | 1.76–2.57 |
| LAEDV (mL) | 90.42 |
89.72 |
0.99 | 0.99–0.99 | 0.76 | 0.61–0.90 | |
| LAESV (mL) | 47.13 |
47.35 |
0.17 | 0.99 | 0.99–0.99 | 2.57 | 2.09–3.06 |
| LAEF (%) | 50.47 |
49.90 |
0.99 | 0.98–0.99 | 2.35 | 1.91–2.80 | |
| RAEDV (mL) | 91.20 |
90.58 |
0.99 | 0.99–0.99 | 1.03 | 0.84–1.22 | |
| RAESV (mL) | 50.60 |
50.63 |
0.91 | 0.99 | 0.99–0.99 | 3.54 | 2.87–4.21 |
| RAEF (%) | 45.00 |
44.77 |
0.52 | 0.93 | 0.89–0.96 | 4.63 | 3.76–5.52 |
CV, coefficient of variance; CI, confidence interval; LVEDV, left ventricular end diastolic volume; LVESV, left ventricular end systolic volume; LVEF, left ventricular ejection fraction; RVEDV, right ventricular end diastolic volume; RVESV, right ventricular end systolic volume; RVEF, right ventricular ejection fraction; LAEDV, left atrial end diastolic volume; LAESV, left atrial end systolic volume; LAEF, left atrial ejection fraction; RAEDV, right atrial end diastolic volume; RAESV, right atrial end systolic volume; RAEF, right atrial ejection fraction.
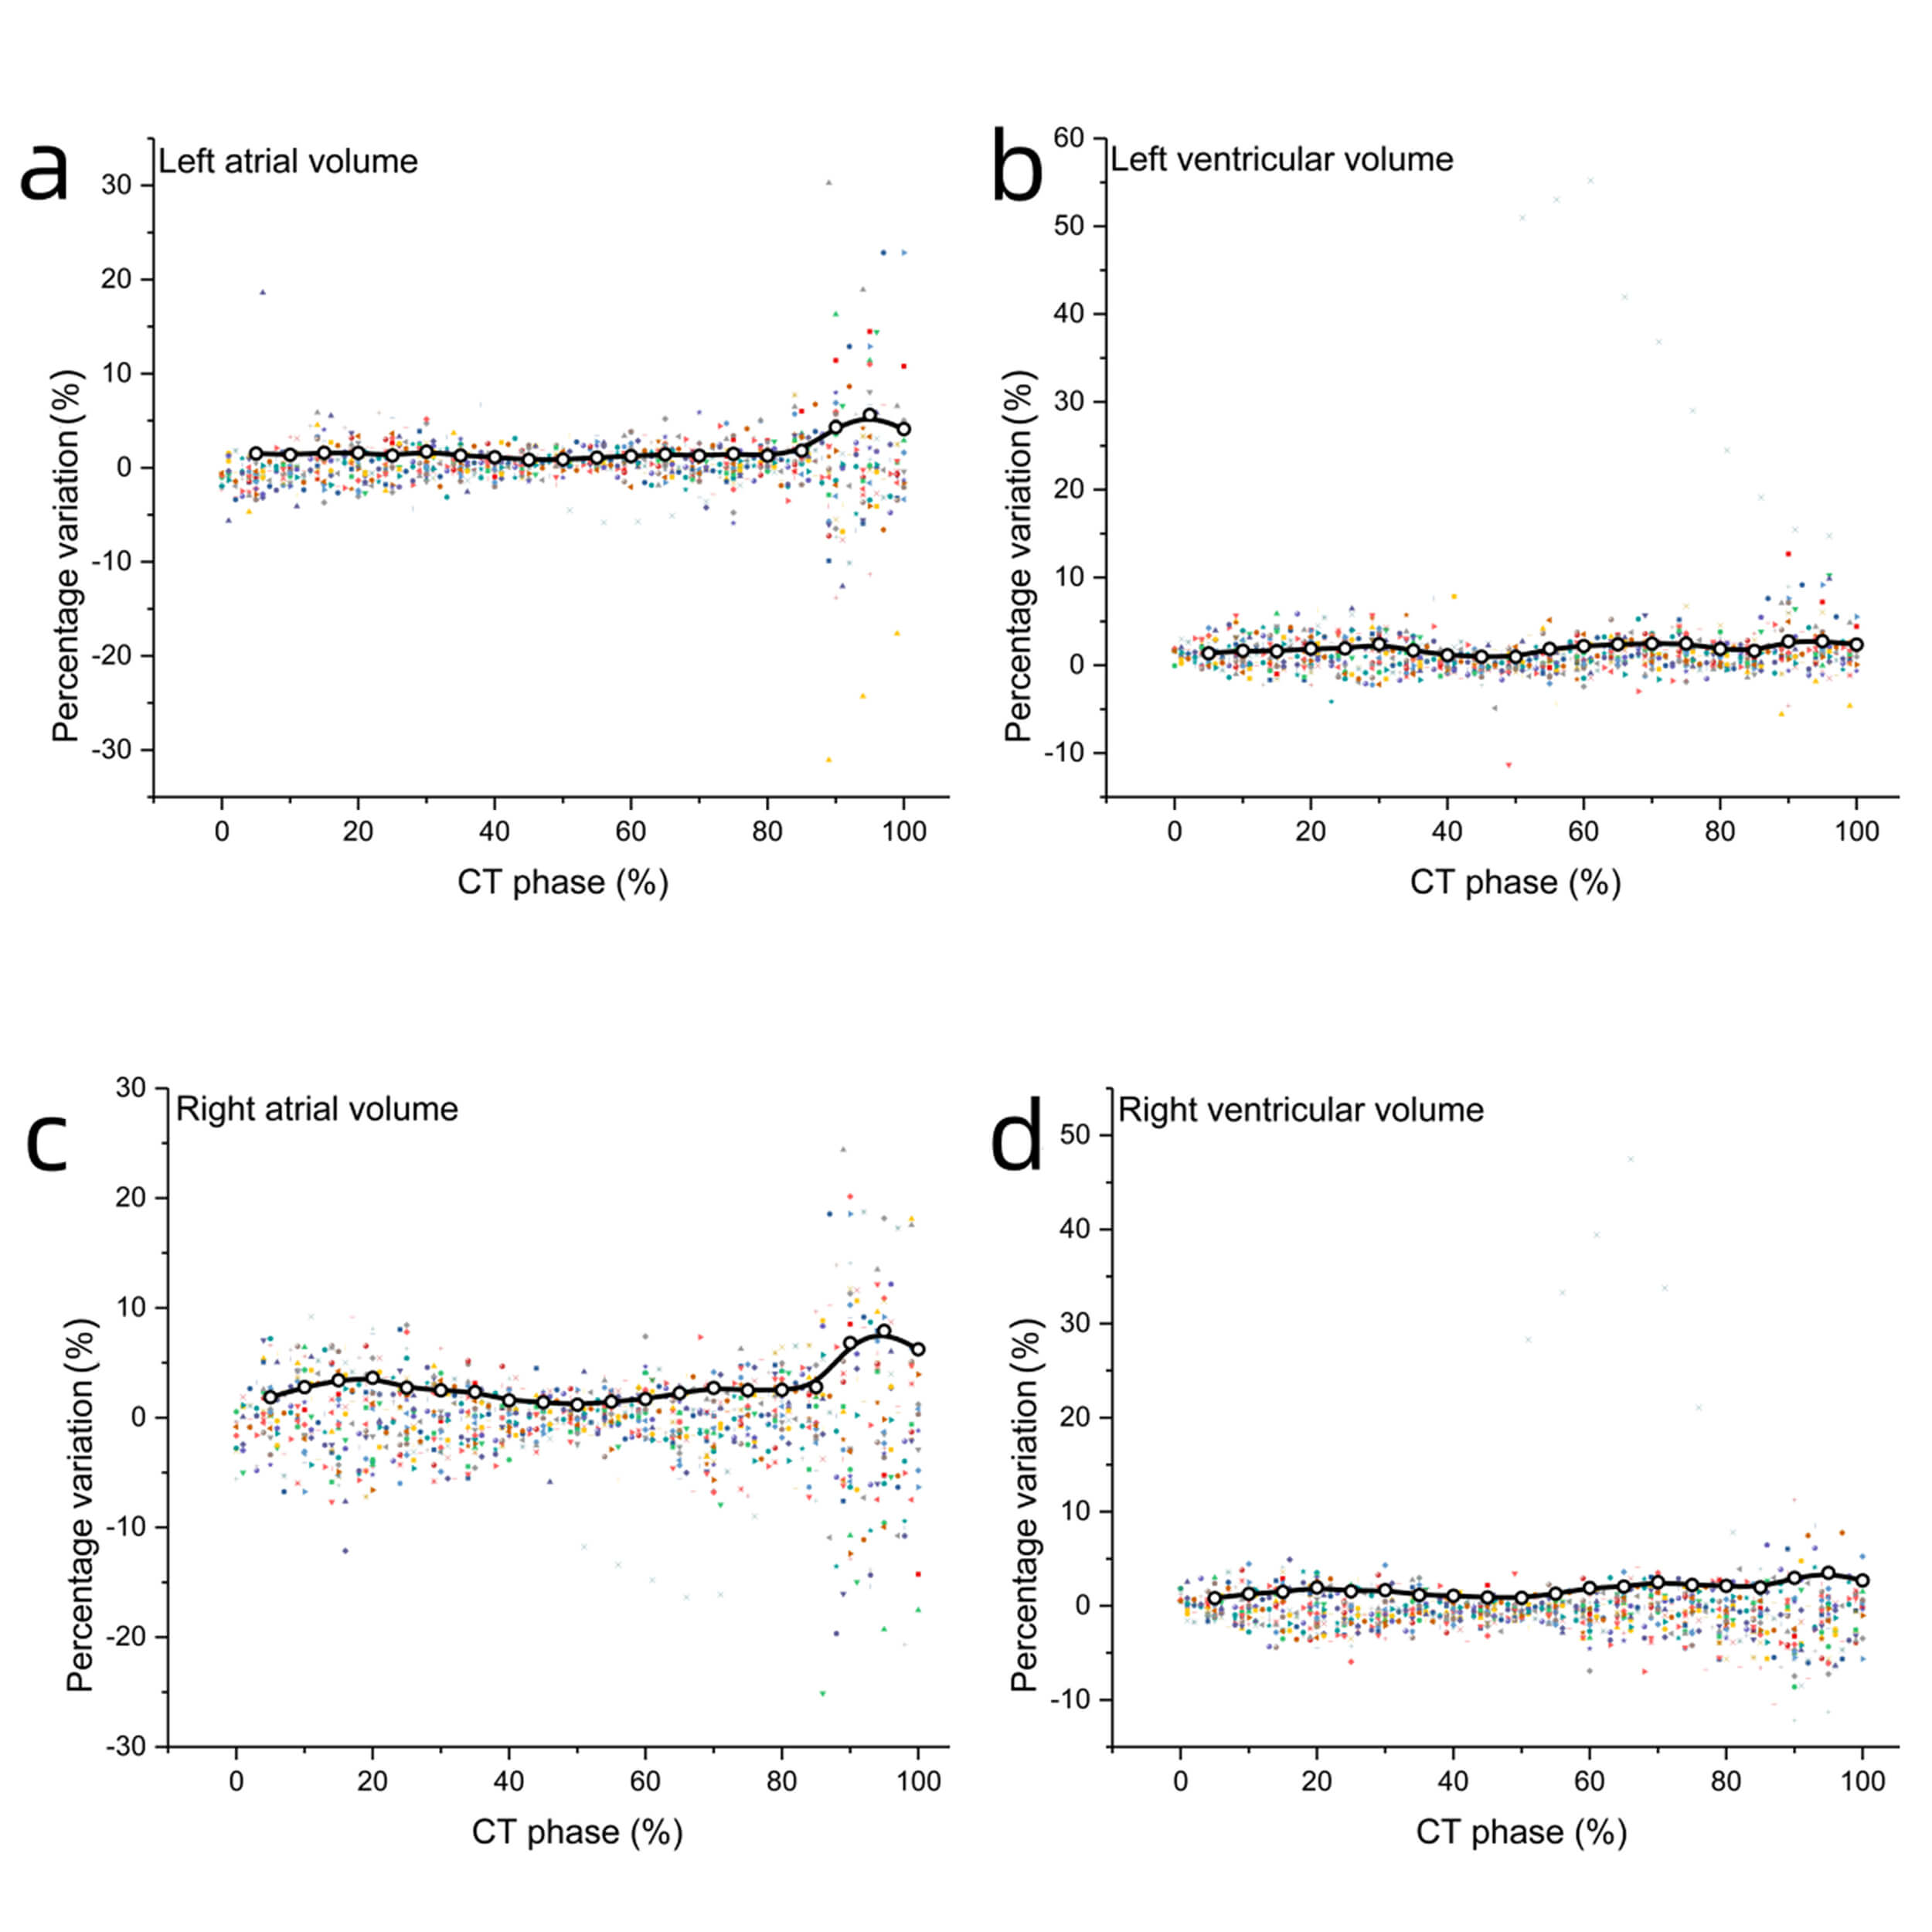 Fig. 4.
Percentage variation of left atrial, left ventricular, right atrial, and right ventricular volumes between STD and SSF2 groups. Percentage variation of chamber volume between STD and SSF2 groups for left atrial volume (a), left ventricular volume (b), right atrial volume (c), right ventricular volume (d), respectively. Percentage variation = (VolumeSSF2 – VolumeSTD) / VolumeSSF2.
The intraobserver and interobserver difference assessment revealed good
myocardial strain reproducibility of Medviso Segment CT for CCTA and Circle CVI42
for CMR, and the ICCs were
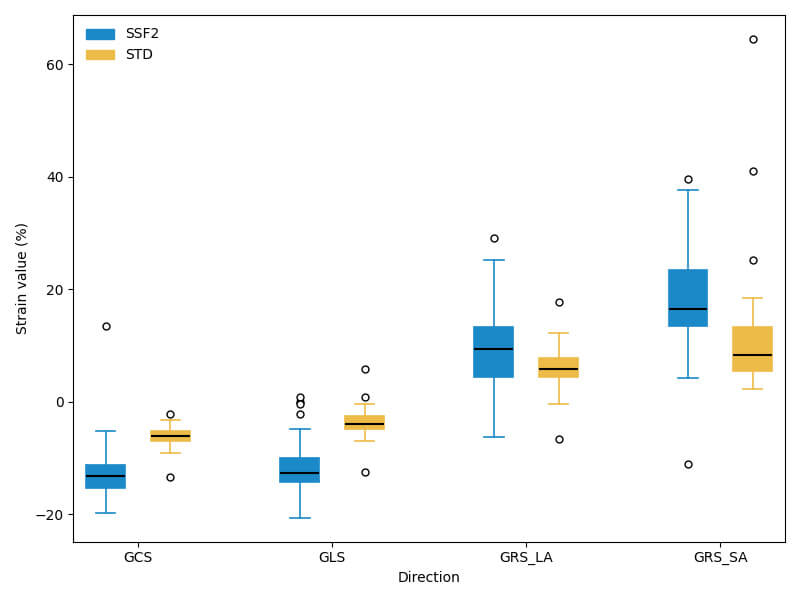 Fig. 5.
Comparisons of strains between the STD and SSF2 groups. All
p-values were
| Variable | STD protocol (n = 36) | SSF2 protocol (n = 36) | CMR protocol (n = 36) | STD protocol versus CMR protocol | SSF2 protocol versus CMR protocol | ||||
| p value* | ICC* | CV* (%) | p value † | ICC† | CV† (%) | ||||
| LVEDV (mL) | 140.26 |
138.29 |
130.21 |
0.97 | 13.04 | 0.97 | 12.30 | ||
| LVESV (mL) | 70.17 |
70.27 |
51.17 |
0.98 | 58.98 | 0.98 | 59.07 | ||
| LVEF (%) | 51.72 |
50.99 |
64.29 |
0.70 | 20.45 | 0.69 | 21.71 | ||
| GCS (%) | –5.99 |
–13.30 |
–15.01 |
0.30 | 96.48 | 0.90 | 14.76 | ||
| GRS-SA (%) | 9.33 |
17.93 |
21.49 |
0.44 | 114.97 | 0.79 | 29.03 | ||
| GLS (%) | –4.08 |
–11.80 |
–13.01 |
0.31 | 174.20 | 0.03 | 0.85 | 79.23 | |
| GRS-LA (%) | 6.37 |
10.41 |
17.01 |
0.24 | 204.27 | 0.65 | 113.85 | ||
GCS, global circumferential strain; GRS-SA, global radial strain of short-axis cine; GLS, global longitudinal strain; GRS-LA, global radial strain of long-axis cine.
*, STD protocol versus CMR protocol; †, SSF2 protocol versus CMR protocol.
Accurate cardiac function analysis depends on the reconstruction of the whole cardiac cycle. Incorporating additional reconstruction phases that cover the full cardiac cycle improves functional evaluation accuracy [22]. In addition, high-quality CCTA imaging is crucial for assessing subendocardial diseases, excessive trabeculation, mural thrombus, cardiomyopathy, cardiac tumors, and other conditions. Consensus documents also confirm that CCTA reliably evaluates the quantification of left and right ventricular volumes and ejection fraction, showing excellent agreement with the reference standard CMR [23]. The findings of this study demonstrate that the application of SSF2 significantly enhances image quality in patients with high heart rates and improves CNR between the myocardium and ventricle. This enhancement facilitates improved detection and differentiation of thrombus, as well as accurate assessment of volume and ejection fraction. Moreover, images obtained using SSF2 offer greater reliability for myocardial strain evaluation compared to STD protocol. These results underscore the clinical relevance of SSF2 in the assessment of cardiac structure and function among patients with high heart rate.
When the heart rate is
Manual CCTA segmentation has demonstrated comparable efficacy to CMR in assessing left ventricular ejection fraction [10]. In our study, the difference between automatic segmentation using the SSF2 protocol and manual segmentation is smaller than that observed with the STD protocol. However, the difference in LVESV between the SSF2 and STD protocols is not statistically significant. Notably, the difference in LVESV between automatic and manual segmentation using the SSF2 protocol is statistically significant. Several factors may be associated with this. First, CCTA images predominantly comprise diastolic frames, which are used for training using the 3D U-Net algorithm. Its performance on systolic frames likely suffers due to the unbalanced training dataset. Furthermore, at end-systole, the gap between the papillary muscles, trabeculations, and myocardium is smaller or even absent. Another contributing factor may be the overtracing of the endocardial boundary and misdefinition of the mitral valve annulus plane when using the automatic approach [8].
Compared with automatic segmentation using the STD protocol, the end-diastolic volumes of left ventricle, left atrium and right atrium are larger when using the SSF2 protocol. This difference is primarily due to a clearer and sharper boundary between the endocardium and the blood pool in the SSF2 protocol. Significant differences in automatic segmentation between the SSF2 and STD protocols are observed in the 90%, 95%, and 100% phases, corresponding to the rapid ejection phases of the cardiac cycle. During these phases, the rapid contraction of the ventricles results in more artifacts, highlighting the superior motion correction performance of the SSF2 protocol in these phases.
CT strain analysis is highly variable due to various CT techniques, protocols, and post-processing algorithms [25]. Our results indicate that the strain measurements obtained using the STD and SSF2 protocols are underestimated compared with those derived from CMR. Several factors contribute to these discrepancies. First, myocardial strain analysis depends on precise endocardial tracing, and poor-quality endocardial images and suboptimal automatic segmentation during systole significantly affect results [26]. Second, the reconstructed cardiac phases and time resolution affect strain measurements. CCTA has underestimated GLS compared with speckle-tracking echocardiography [9]. Variations in the reconstruction increments of the R-R interval (5% and 10%) are a significant source of differences in LV and LA CT-FT strain values [22]. The cardiac phases in CCTA images are 21, fewer than the 30 phases in CMR. Third, differences in myocardial strain may originate from variations in imaging modalities and real-time heart rate [22, 26]. The strain results can differ depending on the post-processing software used [16]. Compared with the STD protocol, the SSF2 protocol demonstrated improved ICCs and relatively smaller CVs in comparison with CMR for myocardial strain assessment. However, the CVs for certain strain parameters, particularly GLS and GRS, remained relatively high, indicating notable variability at the individual level. These findings suggest that SSF2-derived strain measurements show good correlation and consistent trends with CMR, rather than strict interchangeability between the two modalities.
This study has some limitations. First, the study was conducted at a single
center with a small sample size, and the time interval between CMR and CCTA
varies considerably. Second, we excluded control cases with heart rate of
The SSF2 protocol significantly improves the image quality for whole-cardiac-cycle reconstruction and cardiac structure and function evaluation in patients with high heart rates. The results of automatic segmentation indicate strong agreement with manual segmentation for LVEDV evaluation, demonstrating considerable potential for clinical evaluation, despite poor agreement for LVESV. The SSF2 protocol outperforms the STD protocol in myocardial strain evaluation, particularly for GCS and GLS, and demonstrates improved correlation with CMR measurements. However, given the relatively high variability observed for certain strain parameters, SSF2-derived strain values should be interpreted with caution and are currently more suitable for comparative or trend-based analysis rather than direct interchangeability with CMR.
The datasets used and analyzed during the current study are available from the corresponding author on reasonable request.
XC, XZ and AS designed the research study. XC and YD performed the research. JP provided administrative support and provision of study materials or patients. RW, SY and XZ collected image data and did image post processing. HX contributed to segmentation of coronary computed tomography angiography. XG and JY were responsible for statistical analysis and graphing. All authors contributed to editorial changes in the manuscript. All authors read and approved the final manuscript. All authors have participated sufficiently in the work and agreed to be accountable for all aspects of the work.
The patient informed consent was waived in this retrospective study. The study was conducted in accordance with the Declaration of Helsinki, and the protocol was approved by the Ethics Committee of Affiliated Jinhua Hospital, Zhejiang University School of Medicine (approval number: 2025-317).
We would like to express our gratitude to all those who helped us during the writing of this manuscript. Thanks to all the peer reviewers for their opinions and suggestions.
This project was supported by the Medical and Health Research Project of Zhejiang Province (Grant No.2025KY1745), the key project from Jinhua Municipal Science and Technology Bureau (Grant No. 2023-1-094), and the project grant from the Jinhua Municipal Central Hospital (Grant No. JY2024-7-10).
Aiyun Sun is an employee of GE Healthcare China. However, the company had no role in the handling or conduct of the study. The author had full access to all data in the study and take full responsibility for the integrity of the data and the accuracy of the data analysis.
Supplementary material associated with this article can be found, in the online version, at https://doi.org/10.31083/RCM48026.
References
Publisher’s Note: IMR Press stays neutral with regard to jurisdictional claims in published maps and institutional affiliations.