


 , Xiaoxu Zhang 2,†, Meng Cao 3, Junbai Ma 4, Ru Yan 5, Hao Wang 5,*
 , Shaobin Jia 6,*
1 The First Clinical College of Ningxia Medical University, General Hospital of Ningxia Medical University, 750001 Yinchuan, Ningxia, China
2 Department of Gastroenterology, General Hospital of Ningxia Medical University, 750001 Yinchuan, Ningxia, China
3 Department of Clinical Nursing, School of Nursing, Ningxia Medical University, 750001 Yinchuan, Ningxia, China
4 Department of Pathogenic Microbiology and Immunology, Institute of Basic Medical College, Ningxia Medical University, 750001 Yinchuan, Ningxia, China
5 School of Laboratory Medicine, Ningxia Medical University, 750001 Yinchuan, Ningxia, China
6 Department of Cardiovascular Medicine, General Hospital of Ningxia Medical University, 750001 Yinchuan, Ningxia, China
†These authors contributed equally.
Abstract
This study aimed to investigate the effects of γδ T cell inhibition under a high-fat diet (HFD) on metabolic function, immune inflammation, gut microbiota, and atherosclerosis (AS) progression in ApoE-/- mice.
ApoE-/- mice were assigned to three groups: a control group (normal diet), a model group (HFD), and an intervention group (HFD + γδ T cell receptor (TCR) monoclonal antibody). After 12 weeks, flow cytometry was used to assess γδ T cell levels, and cytokines (interferon-gamma (IFN-γ), IL-17A) were measured. Inflammatory markers in blood and adipose tissue were quantified, gut microbiota composition was analyzed via fecal metagenomics, and atherosclerosis was evaluated using Oil Red O, Masson's trichrome, and hematoxylin and eosin (HE) staining methods.
The HFD activated γδ T cells and increased pro-inflammatory cytokines in ApoE-/- mice. Treatment with the γδ TCR monoclonal antibody suppressed γδ T cells, reduced IFN-γ and IL-17A expression, improved lipid profiles, and decreased tumor necrosis factor-alpha (TNF-α), IL-1β, and IL-6 levels. Gut microbiota analysis showed an increase in beneficial bacteria, and histological staining (Oil Red O, HE, and Masson's trichrome) confirmed a reduction in atherosclerotic lesion burden.
The γδ T cells contribute to AS development under the HFD. Inhibition of γδ T cells reduces inflammation, improves gut microbiota composition, and attenuates atherosclerosis progression.
Keywords
- γδ T cells
- atherosclerosis
- hyperlipidemia
- inflammatory cytokines
- gut microbiota
Atherosclerosis (AS) is a critical pathological basis for ischemic heart disease and stroke. Its characteristic lesion involves the slow accumulation and complex transformation of lipids, immune cells, foam cells, smooth muscle cells, and necrotic cell debris within the intimal space beneath the monolayer of vascular endothelial cells (ECs) [1]. Atherosclerosis has become a major research focus in the field of cardiovascular diseases [2]. In recent years, extensive exploration of preclinical models and emerging evidence from human clinical studies have established the pivotal role of the immune system in driving the initiation and progression of atherosclerotic lesions. Among the immune components, the T-cell family serves as a key driver and regulator across all stages of AS development [3].
T cells are named after their development in the thymus and are characterized by numerous important membrane molecules on their surface, which play key roles in antigen recognition, activation, proliferation, differentiation, and effector functions. The T cell receptor (TCR), a specific receptor on the T cell surface that recognizes and binds to antigens, is a hallmark of all T cells [4].
The roles of different T cell subsets in AS have been extensively studied [5].
CD4+ T cell subsets can influence AS through immune activation or suppression, or
by assisting B cells in antibody production, resulting in diverse effects on the
disease. Among these, Th1 cells are the most prominent CD4+ T cell subtype in
atherosclerotic plaques, contributing to inflammation by secreting cytokines such
as interferon-gamma (IFN-
The immunoregulatory relationship between T cells and the gut microbiota has
become a major research focus. Current perspectives suggest a “mutualistic”
interaction, where the plasticity of each component modulates the other.
Symbiotic microbiota regulate the development, differentiation, and function of T
cells through various mechanisms, including metabolic products, antigen
presentation, intestinal barrier permeability, and immune tolerance. Conversely,
T cells, through the coordinated activity of different subsets, regulate the
balance and diversity of gut microbial communities [7]. Although
The pathogenesis of atherosclerosis is complex, involving interactions between
metabolic abnormalities and immune responses that result in chronic inflammation
of the arterial wall. As a subset of unconventional T cells,
This study was approved by the Animal Welfare Ethics Committee of Ningxia
Medical University (Ethics Approval No. IACUC-NYLAC-2023-164). A total of 42 male
ApoE-/- mice (6–8 weeks old) were purchased from Beijing Charles
River Laboratory Animal Technology Co., Ltd. (Beijing, China). Mice were housed
at the Experimental Animal Center of Ningxia Medical University under specific
pathogen-free (SPF) conditions at 22
Animals were monitored twice weekly for general health status (activity,
grooming, posture, food/water intake) and body weight. Humane endpoints were
predefined as persistent severe lethargy, inability to access food/water, or
For terminal procedures, anesthesia was induced with 3% isoflurane and maintained at 1.5% isoflurane (I8000, Solarbio, Beijing, China). Euthanasia by cervical dislocation was performed only after loss of righting and corneal reflexes. Death was confirmed by cessation of respiration and heartbeat. All operators were professionally trained. Isoflurane inhalation anesthesia was chosen due to rapid onset/offset and to avoid injection-related distress, consistent with animal welfare principles.
All male mice underwent a two-week acclimation period on a standard diet prior to the experiment to stabilize baseline conditions, as male mice were selected to minimize the potential confounding effects of sex hormone-related metabolic variability.
Experimental unit. The experimental unit was the individual mouse. To minimize potential cage effects, cage allocation and cage position were balanced across groups as feasible.
Study structure. The study consisted of two parts: (i) an antibody validation experiment and (ii) a modeling intervention experiment.
Sample size rationale and animal flow. The total sample size was based on feasibility and prior similar ApoE-/- high-fat diet studies; no formal a priori power calculation was performed (exploratory design). Six mice were used for antibody validation (2 groups, n = 3 per group), and the remaining 36 mice were used for the 12-week modeling intervention experiment (3 groups, n = 12 per group). The number of animals included in each downstream analysis is reported in the corresponding figure legends; any exclusions are described under the predefined criteria (Section 2.2.1) and reported in the Results. In addition, fecal samples were collected from all mice for gut microbiota assessment. However, due to cost considerations, fecal samples from 6 mice per group were randomly selected for shotgun metagenomic sequencing (n = 6 per group). The sequencing subset was selected using a random number table by an investigator not involved in downstream outcome assessment, and the corresponding sample sizes are indicated in the relevant figure legends.
Randomisation and allocation. In the antibody validation experiment, six mice were randomly selected and divided into two groups: a 0.9% NaCl control group and a UC7-13D5 injection group. In the modeling intervention experiment, the remaining 36 mice were randomly allocated to three groups using a random number table to minimize selection bias: normal chow diet group (NCD), high-fat diet group (HFD), and high-fat diet+antibody group (HFD+Antibody). Randomisation was performed by an investigator not involved in outcome assessment; group codes were retained until completion of blinded analyses. Baseline body weight was checked to ensure comparable distribution across groups.
Diets. Each modeling cycle lasted 10 days, with intraperitoneal injections administered for 3 consecutive days followed by a 7-day interval. This cycle was repeated over a total 12-week intervention period. The NCD group received a normal diet (MD17121, Jiangsu Medison Biopharmaceutical Co., Ltd., Yangzhou, Jiangsu, China), while the HFD and HFD+Antibody groups received a high-fat diet (40% fat Kcal %, 1.25% cholesterol; MD12017, Jiangsu Medison Biopharmaceutical Co., Ltd., Yangzhou, Jiangsu, China).
Handling/injection control. To control for handling and injection-related stress, mice in the NCD and HFD groups received intraperitoneal injections of 0.9% NaCl (Kelun Pharmaceutical Co., Ltd., Chengdu, Sichuan, China) on the same schedule as the antibody group.
Inclusion criteria were: healthy male ApoE-/- mice aged 6–8 weeks after acclimation with body weight within the supplier’s reference range and no overt signs of illness. Prespecified exclusion criteria included: (i) accidental death unrelated to the intervention, (ii) severe illness requiring humane euthanasia, (iii) failed intraperitoneal injection (e.g., leakage), and (iv) fecal metagenomic samples failing quality-control thresholds. Exclusions were documented prior to unblinding and are reported in the Results.
Outcome assessments for histology quantification and ImageJ measurements were performed blinded to group allocation. Investigators conducting statistical analyses were blinded to group codes until analyses were finalized. For metagenomic sequencing, fecal samples were labeled using anonymized codes prior to shipment and analysis. Personnel administering injections were not blinded due to the nature of the intervention.
Fecal samples were collected in the morning on non-injection days and immediately stored at –80 °C for subsequent gut microbiota analysis. At the end of the intervention period, mice were anesthetized with isoflurane. Blood was collected via orbital sinus into EDTA-coated tubes (367841, BD Biosciences, Franklin Lakes, NJ, USA) as a terminal procedure by trained personnel, and hemostasis was ensured. Following blood collection, 0.9% NaCl was used for cardiac perfusion, and the heart, aorta, intestine, and inguinal adipose tissues were harvested. Portions of tissues were fixed in 4% paraformaldehyde (P1110, Solarbio, Beijing, China) for histological analyses.
Intraperitoneal injections were administered in the lower right abdomen with a
total volume of 0.1 mL per injection. Mice received either 0.9% NaCl or 200
µg UC7-13D5 antibody (Ultra-LEAF™ Purified anti-mouse TCR
Antibody validation experiment. Mice received intraperitoneal injections for 3
consecutive days and were sacrificed 7 days later to assess the inhibitory effect
of UC7-13D5 on
Flow cytometry. Flow cytometry (CytoFLEX V2-B4-R2, Beckman Coulter, Brea, CA,
USA) was used to quantify
Lipid profiling. Triglycerides (TG), total cholesterol (TC), high-density lipoprotein cholesterol (HDL-C), and low-density lipoprotein cholesterol (LDL-C) were measured using an automated biochemical analyzer (Chemray 800, Rayto Life and Analytical Sciences Co., Ltd., Shenzhen, Guangdong, China).
Plasma cytokines. Plasma TNF-
qRT-PCR. Total RNA was extracted from adipose tissue using TRIzol reagent (Invitrogen, Carlsbad, CA, USA). RNA concentration and purity were assessed using a NanoDrop spectrophotometer (Thermo Fisher Scientific, Waltham, MA, USA). cDNA was synthesized from 1 µg RNA using PrimeScript RT Reagent Kit (TaKaRa Bio, Kyoto, Kansai region, Japan). qPCR was performed using SYBR Premix Ex Taq II (TaKaRa Bio, Kyoto, Kansai region, Japan). Relative expression was calculated using the 2-ΔΔCt method.
Histological analysis included Oil Red O staining, hematoxylin and eosin (HE) staining, and Masson trichrome staining, which were used to assess lipid deposition, cellular structure, and fibrosis, respectively. Oil Red O staining: Performed on the aortic surface and aortic sinus for whole-field staining, allowing visualization of lipid deposition under a microscope to quantify the lipid burden associated with atherosclerosis. HE staining: Applied to 6-µm-thick frozen sections of the aortic sinus. After fixation and staining, the sections were examined under a microscope to observe cellular structures, tissue morphology. Masson trichrome staining: Conducted on aortic sections to stain collagen fibers, enabling quantitative analysis of fibrous tissue deposition in atherosclerotic lesions. This was used to evaluate the progression of fibrosis in the diseased tissues.
Image analysis was performed using ImageJ version 1.8.0 (National Institutes of Health, Bethesda, MD, USA). The lesion area index was defined as the proportion of the aortic lumen area occupied by atherosclerotic lesions. All analysts involved in histological quantification were blinded to group allocation.
Fecal metagenomic sequencing was conducted by Shanghai Majorbio Bio-Pharm Technology Co., Ltd. (Shanghai, China). DNA was extracted from fecal samples and paired-end libraries were constructed using the NEXTFLEX™ Rapid DNA-Seq Kit (PerkinElmer, Waltham, MA, USA), followed by high-throughput sequencing using Illumina NovaSeq Reagent Kits (Illumina, San Diego, CA, USA). Bioinformatics analyses were performed on the company’s online platform, including quality control, taxonomic and functional annotation, and community profiling.
Alpha diversity was calculated from fecal metagenomic relative abundance
profiles. Overall differences among groups were tested using the Kruskal-Wallis
test, followed by Dunn’s post hoc comparisons with Benjamini-Hochberg FDR
correction. Beta diversity was assessed using Bray-Curtis dissimilarities and
visualized by principal coordinates analysis (PCoA) and non-metric
multidimensional scaling (NMDS), with between-group differences tested by
permutational multivariate analysis of variance (PERMANOVA). Differential
abundance was evaluated using the Wilcoxon rank-sum test with FDR correction, and
further characterized by LEfSe (
In evaluating the impact of
Outcome measures. The primary outcome was atherosclerotic lesion burden (lesion
area index). Secondary outcomes included circulating lipid parameters, plasma
inflammatory cytokines,
Statistical analyses were performed using GraphPad Prism 10.0 (GraphPad
Software, San Diego, CA, USA) and SPSS 28.0 (IBM Corp., Armonk, NY, USA).
Normality was assessed using the Shapiro-Wilk test and homogeneity of variance
using Levene’s test. All tests were two-sided with
For the antibody validation experiment (Fig. 1), six mice were randomly assigned to a 0.9% NaCl control group or the UC7-13D5 antibody-treated group (n = 3 per group). For the disease modeling and intervention experiments (Figs. 2,3,4,5,6,7,8,9,10), 36 mice were allocated to three groups (NCD, HFD, and HFD+Ab; n = 12 per group). For gut microbiome analyses (shotgun metagenomics), fecal samples were collected from all mice; however, due to cost considerations, a randomly selected subset of 6 mice per group was used for sequencing (n = 6 per group), as specified in the corresponding figure legends.
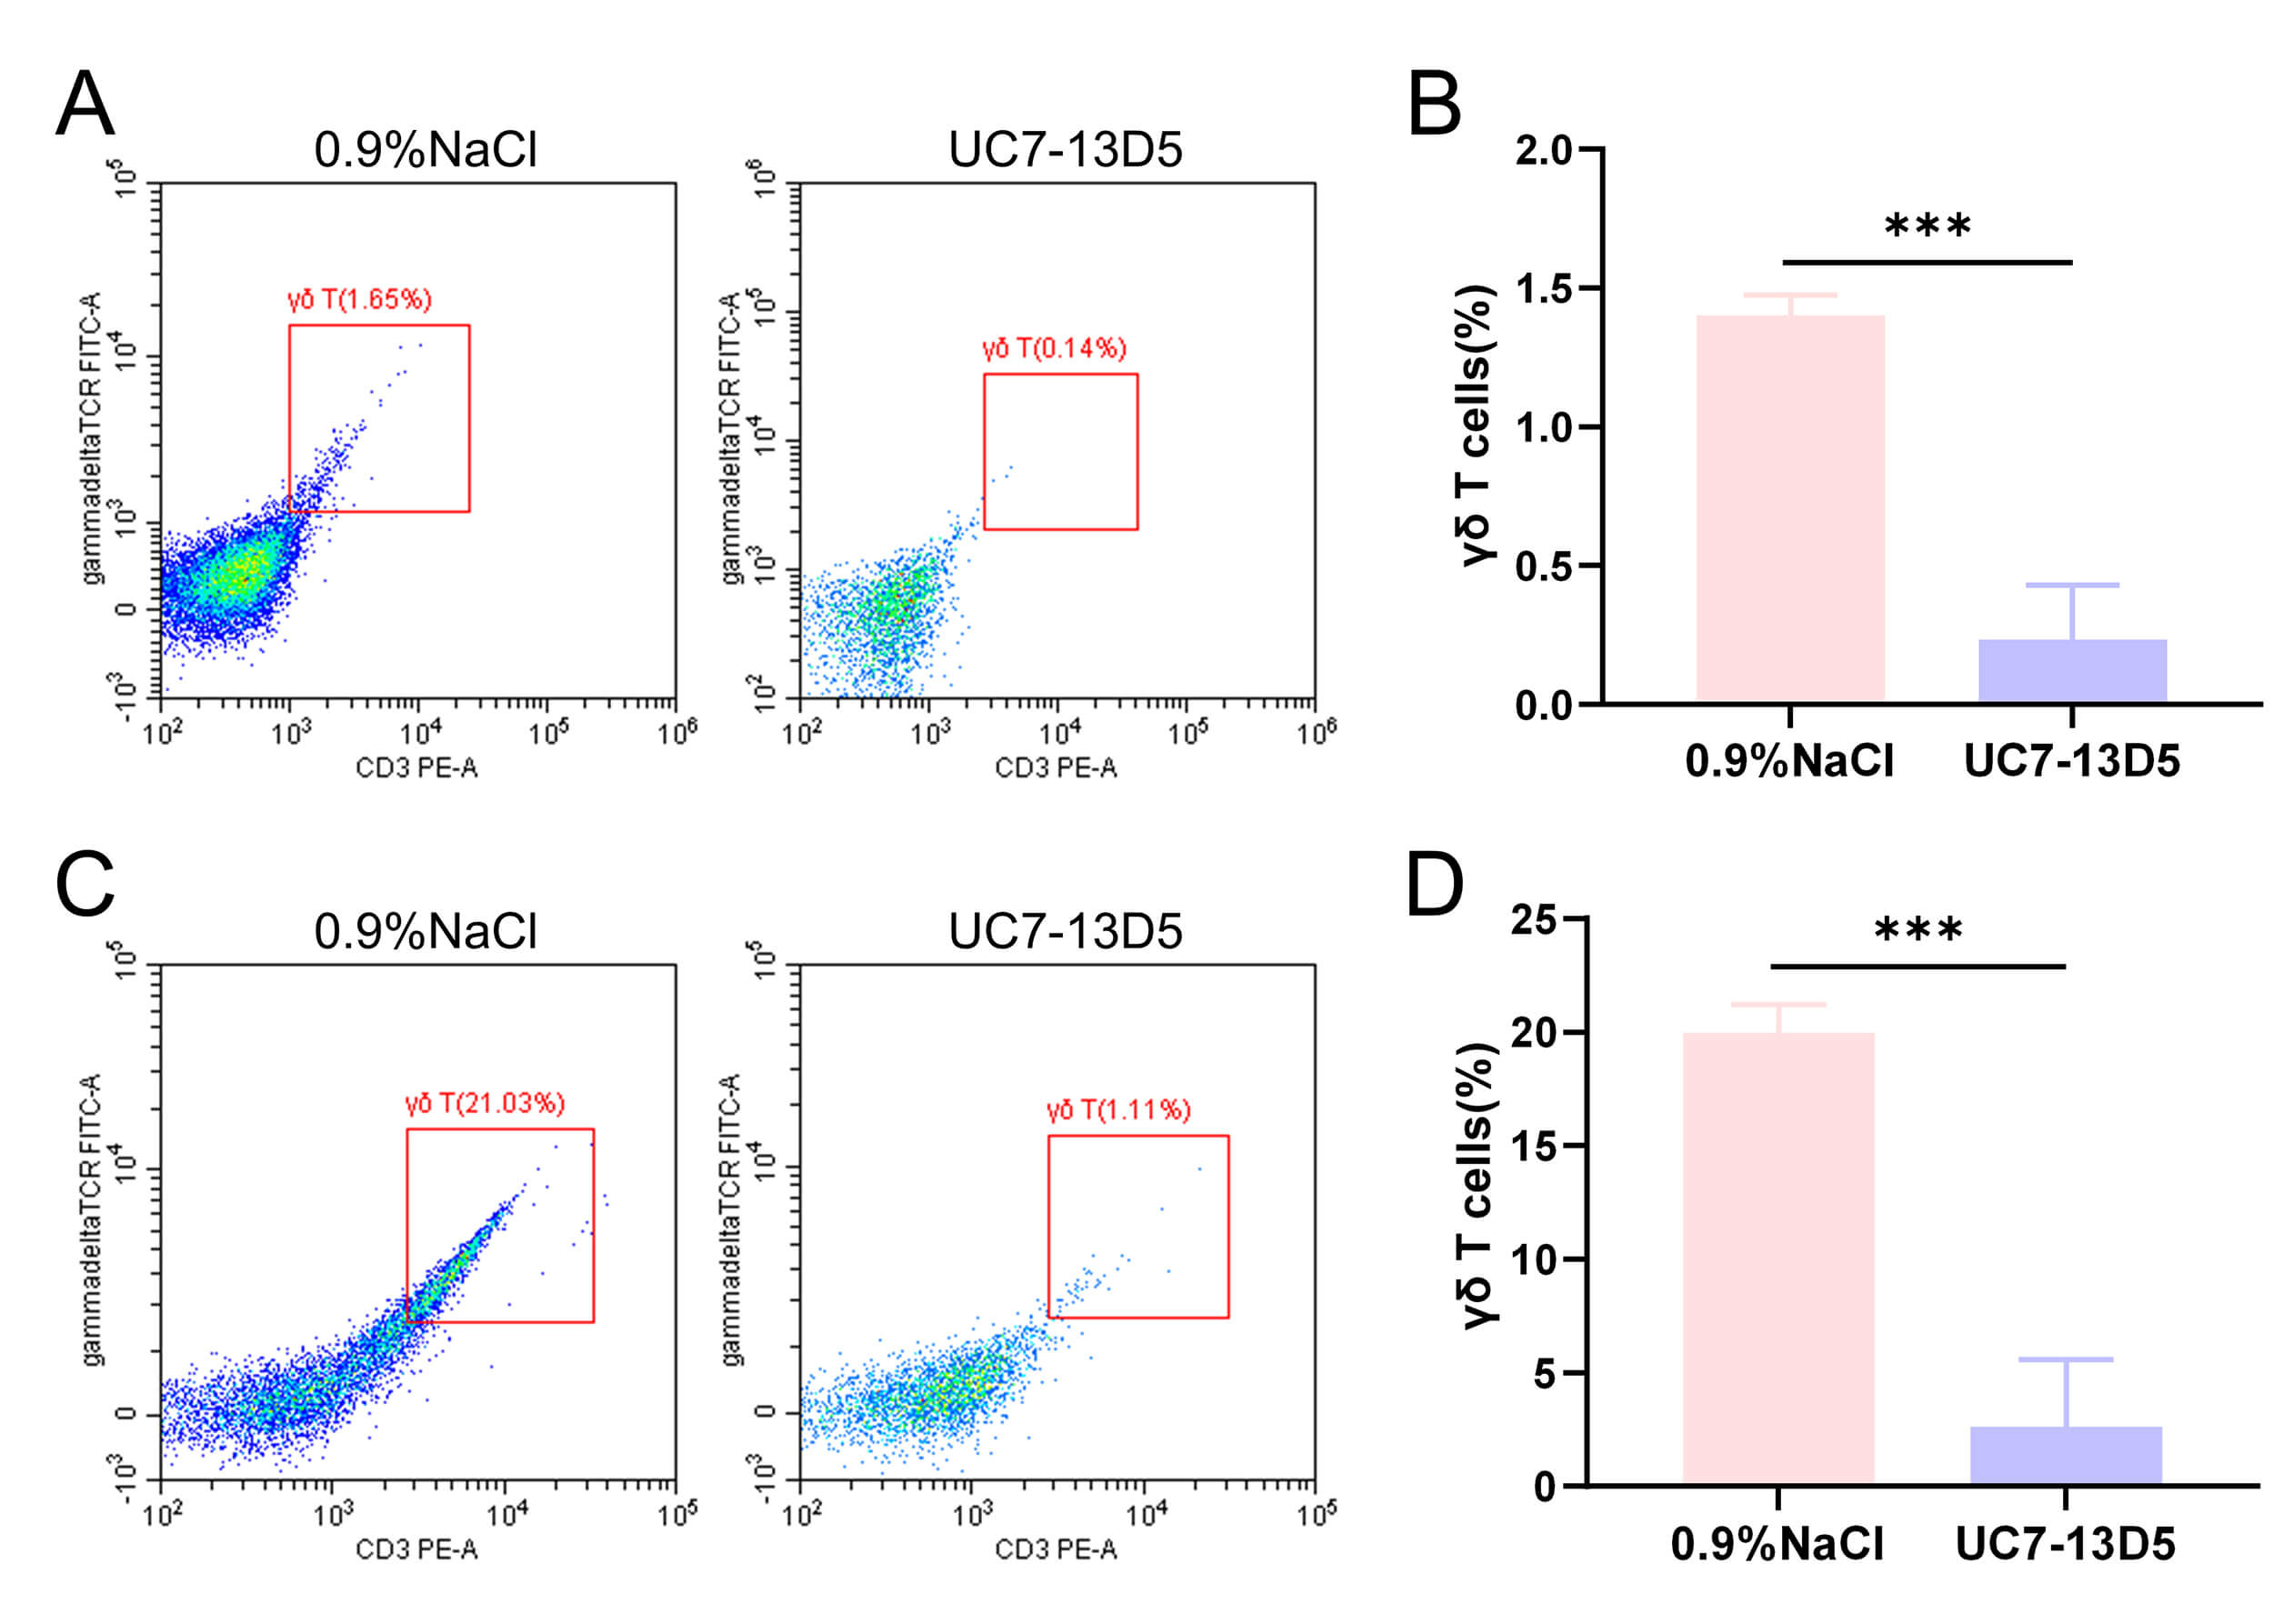 Fig. 1.
Validation results of the UC7-13D5 antibody experiment. (A,B)
Flow cytometry results and statistical analysis of PBMCs from the control and
antibody-treated groups. (C,D) Flow cytometry results and statistical analysis of
IELs from the control and antibody-treated groups. Compared with the control
group, ***p
 Fig. 2.
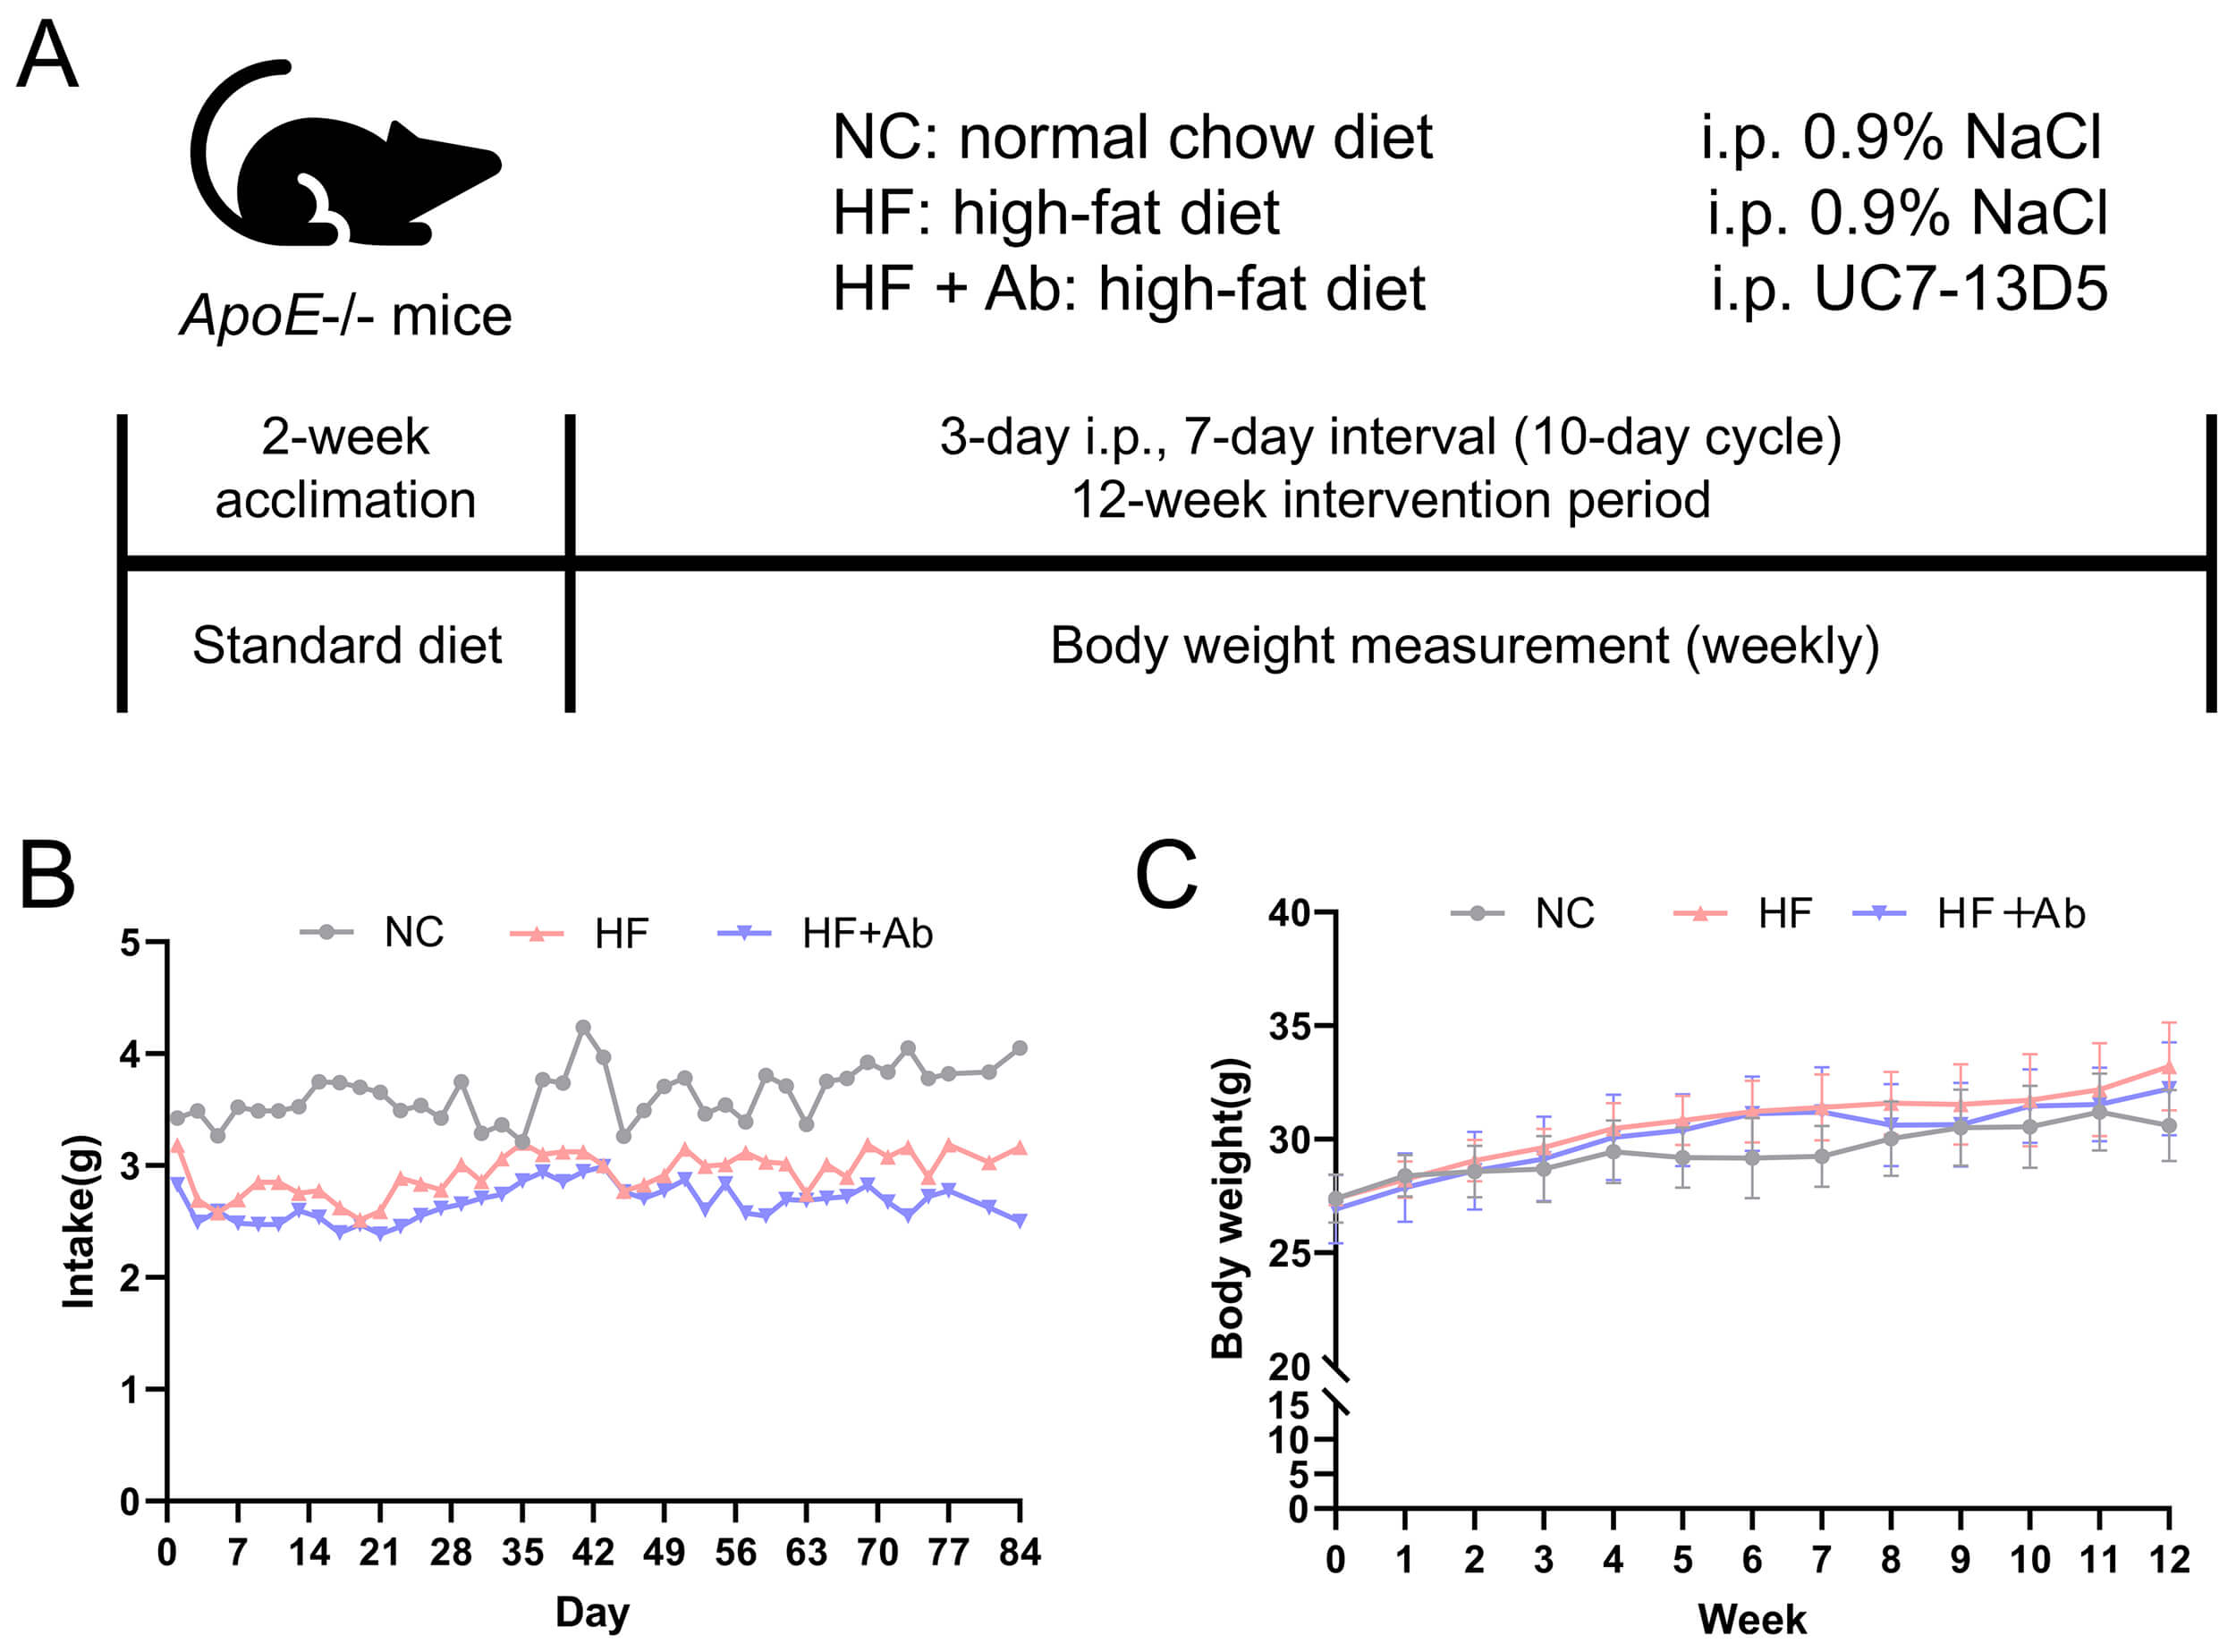
Overview of the intervention workflow and food intake/body
weight monitoring throughout the experiment. (A) Schematic timeline of the
experimental design. (B) Food intake was measured every 3 days and expressed as
g/day/mouse. (C) Body weight was measured weekly. Data are presented as mean
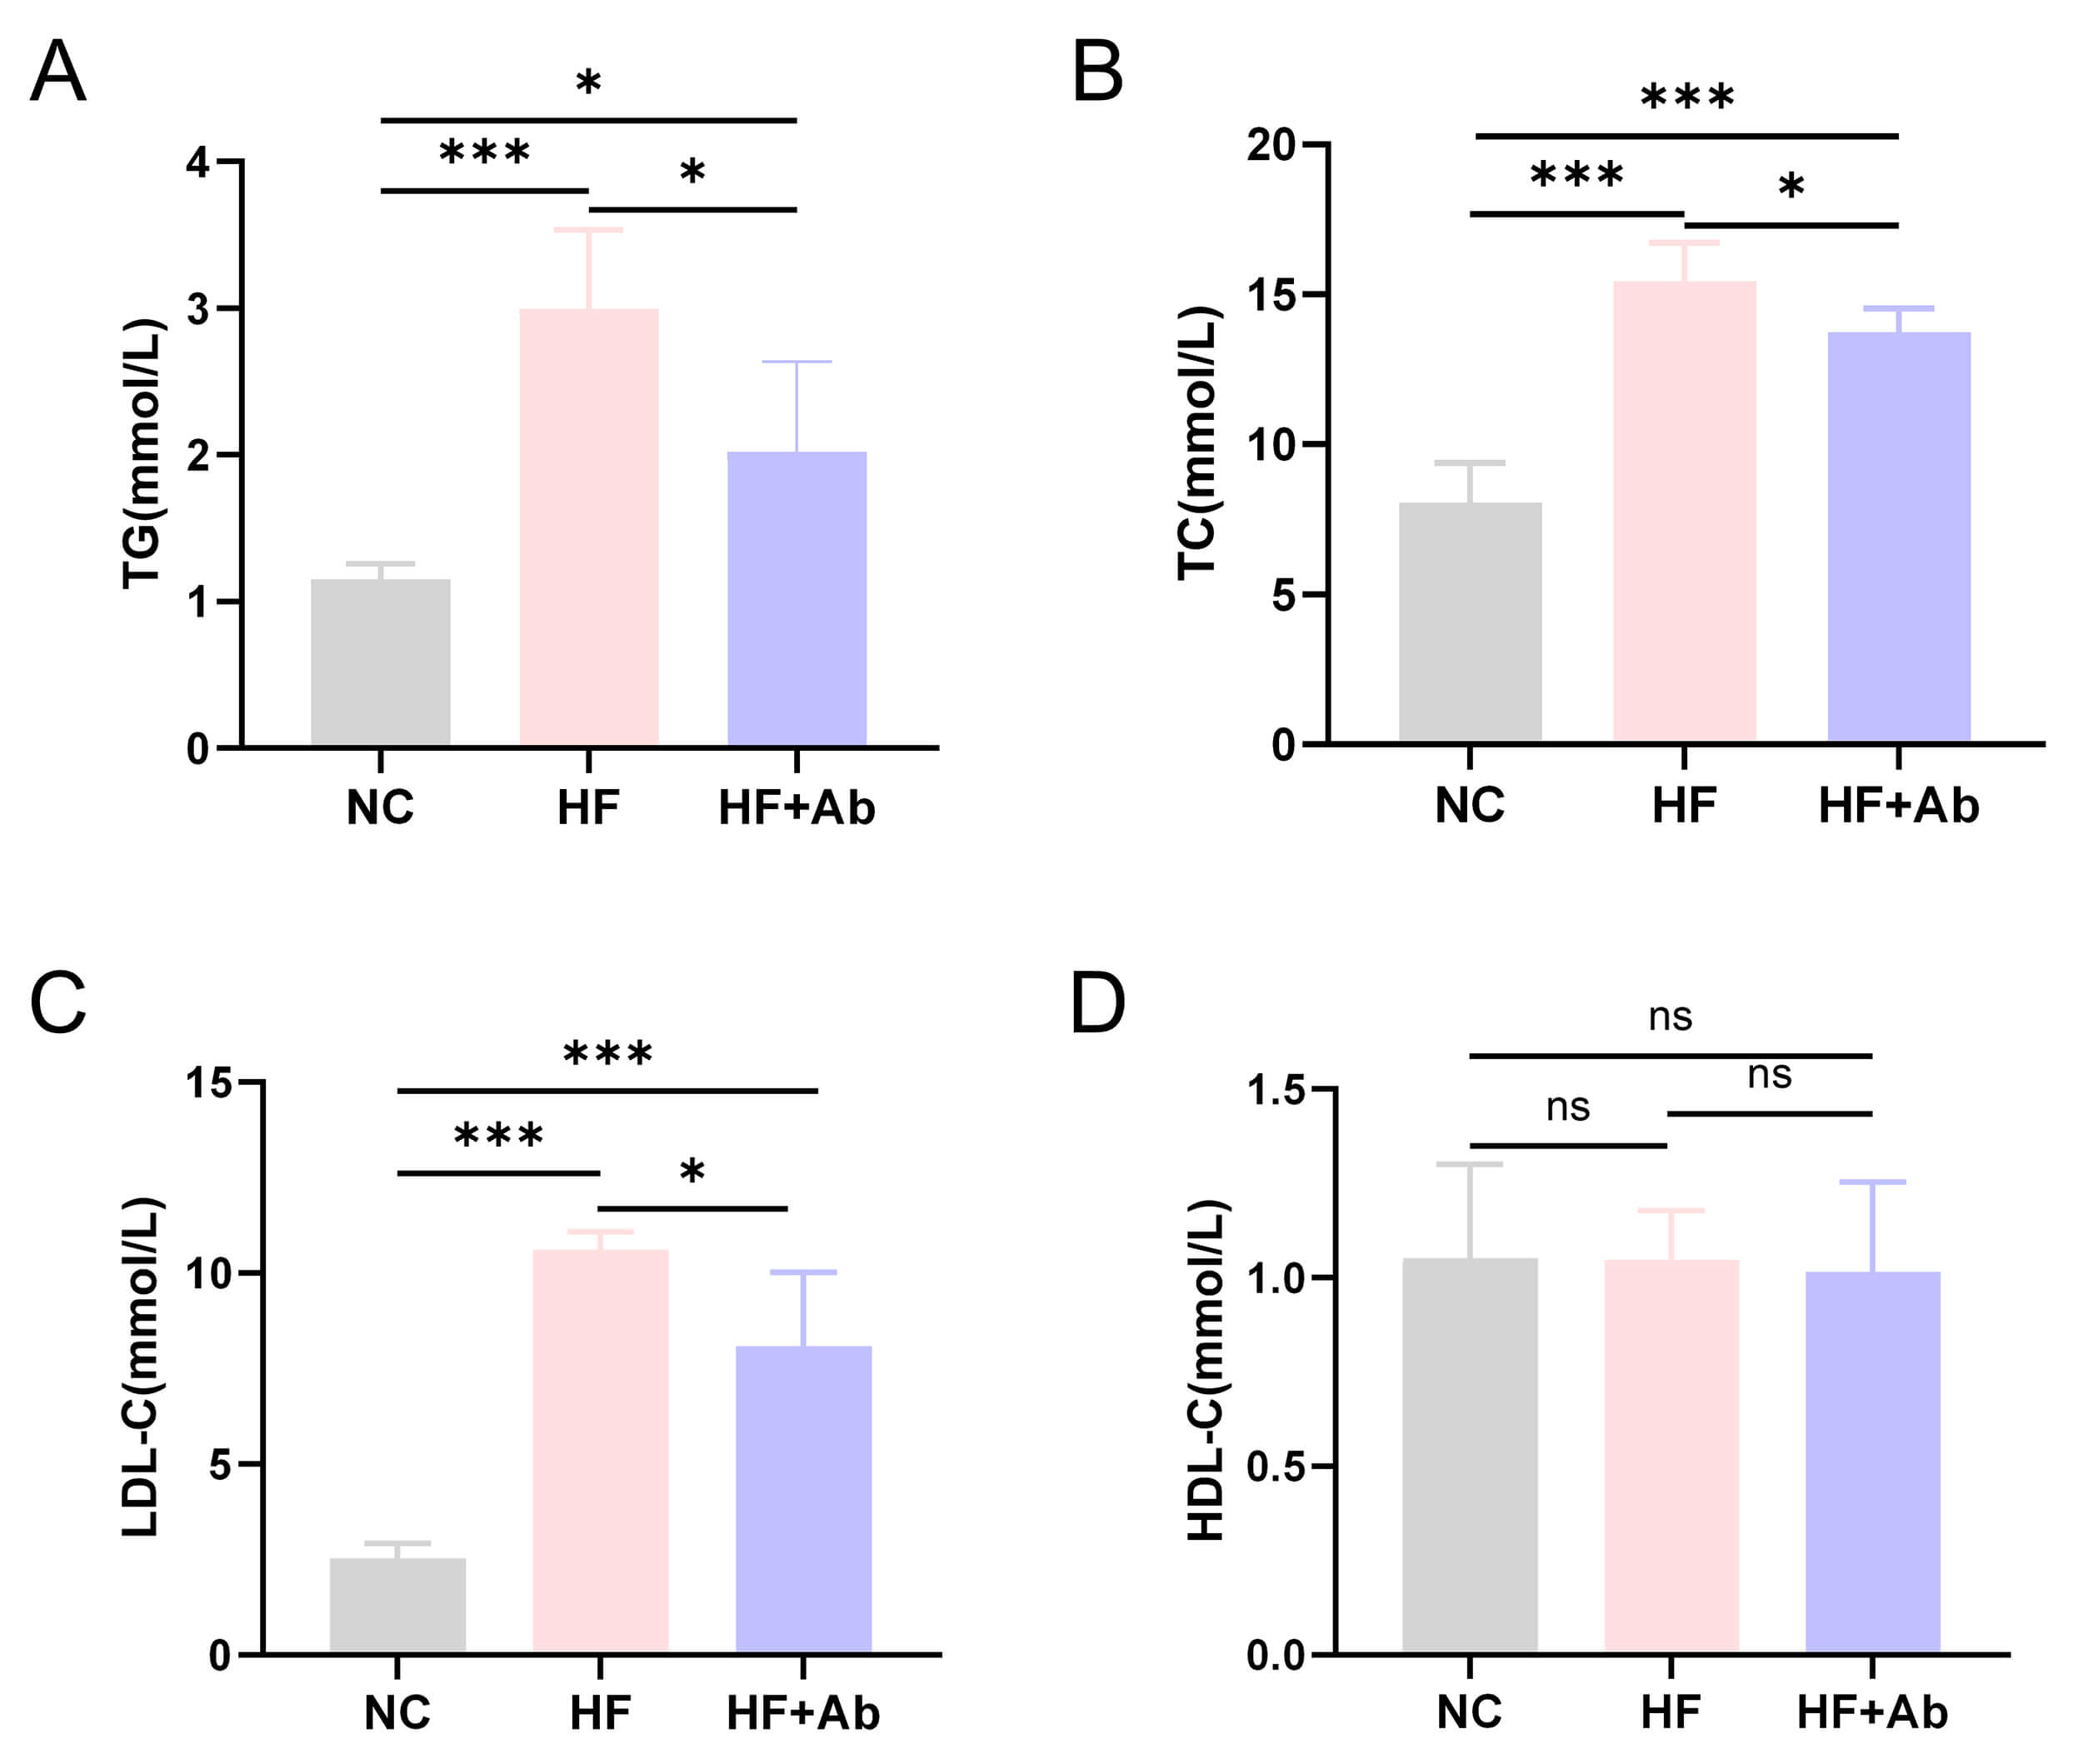 Fig. 3.
Lipid analysis results of mice in each group during the
intervention experiment. (A) Triglycerides (TG). (B) Total cholesterol (TC). (C)
Low-density lipoprotein cholesterol (LDL-C). (D) High-density lipoprotein
cholesterol (HDL-C). Comparison among groups: *p
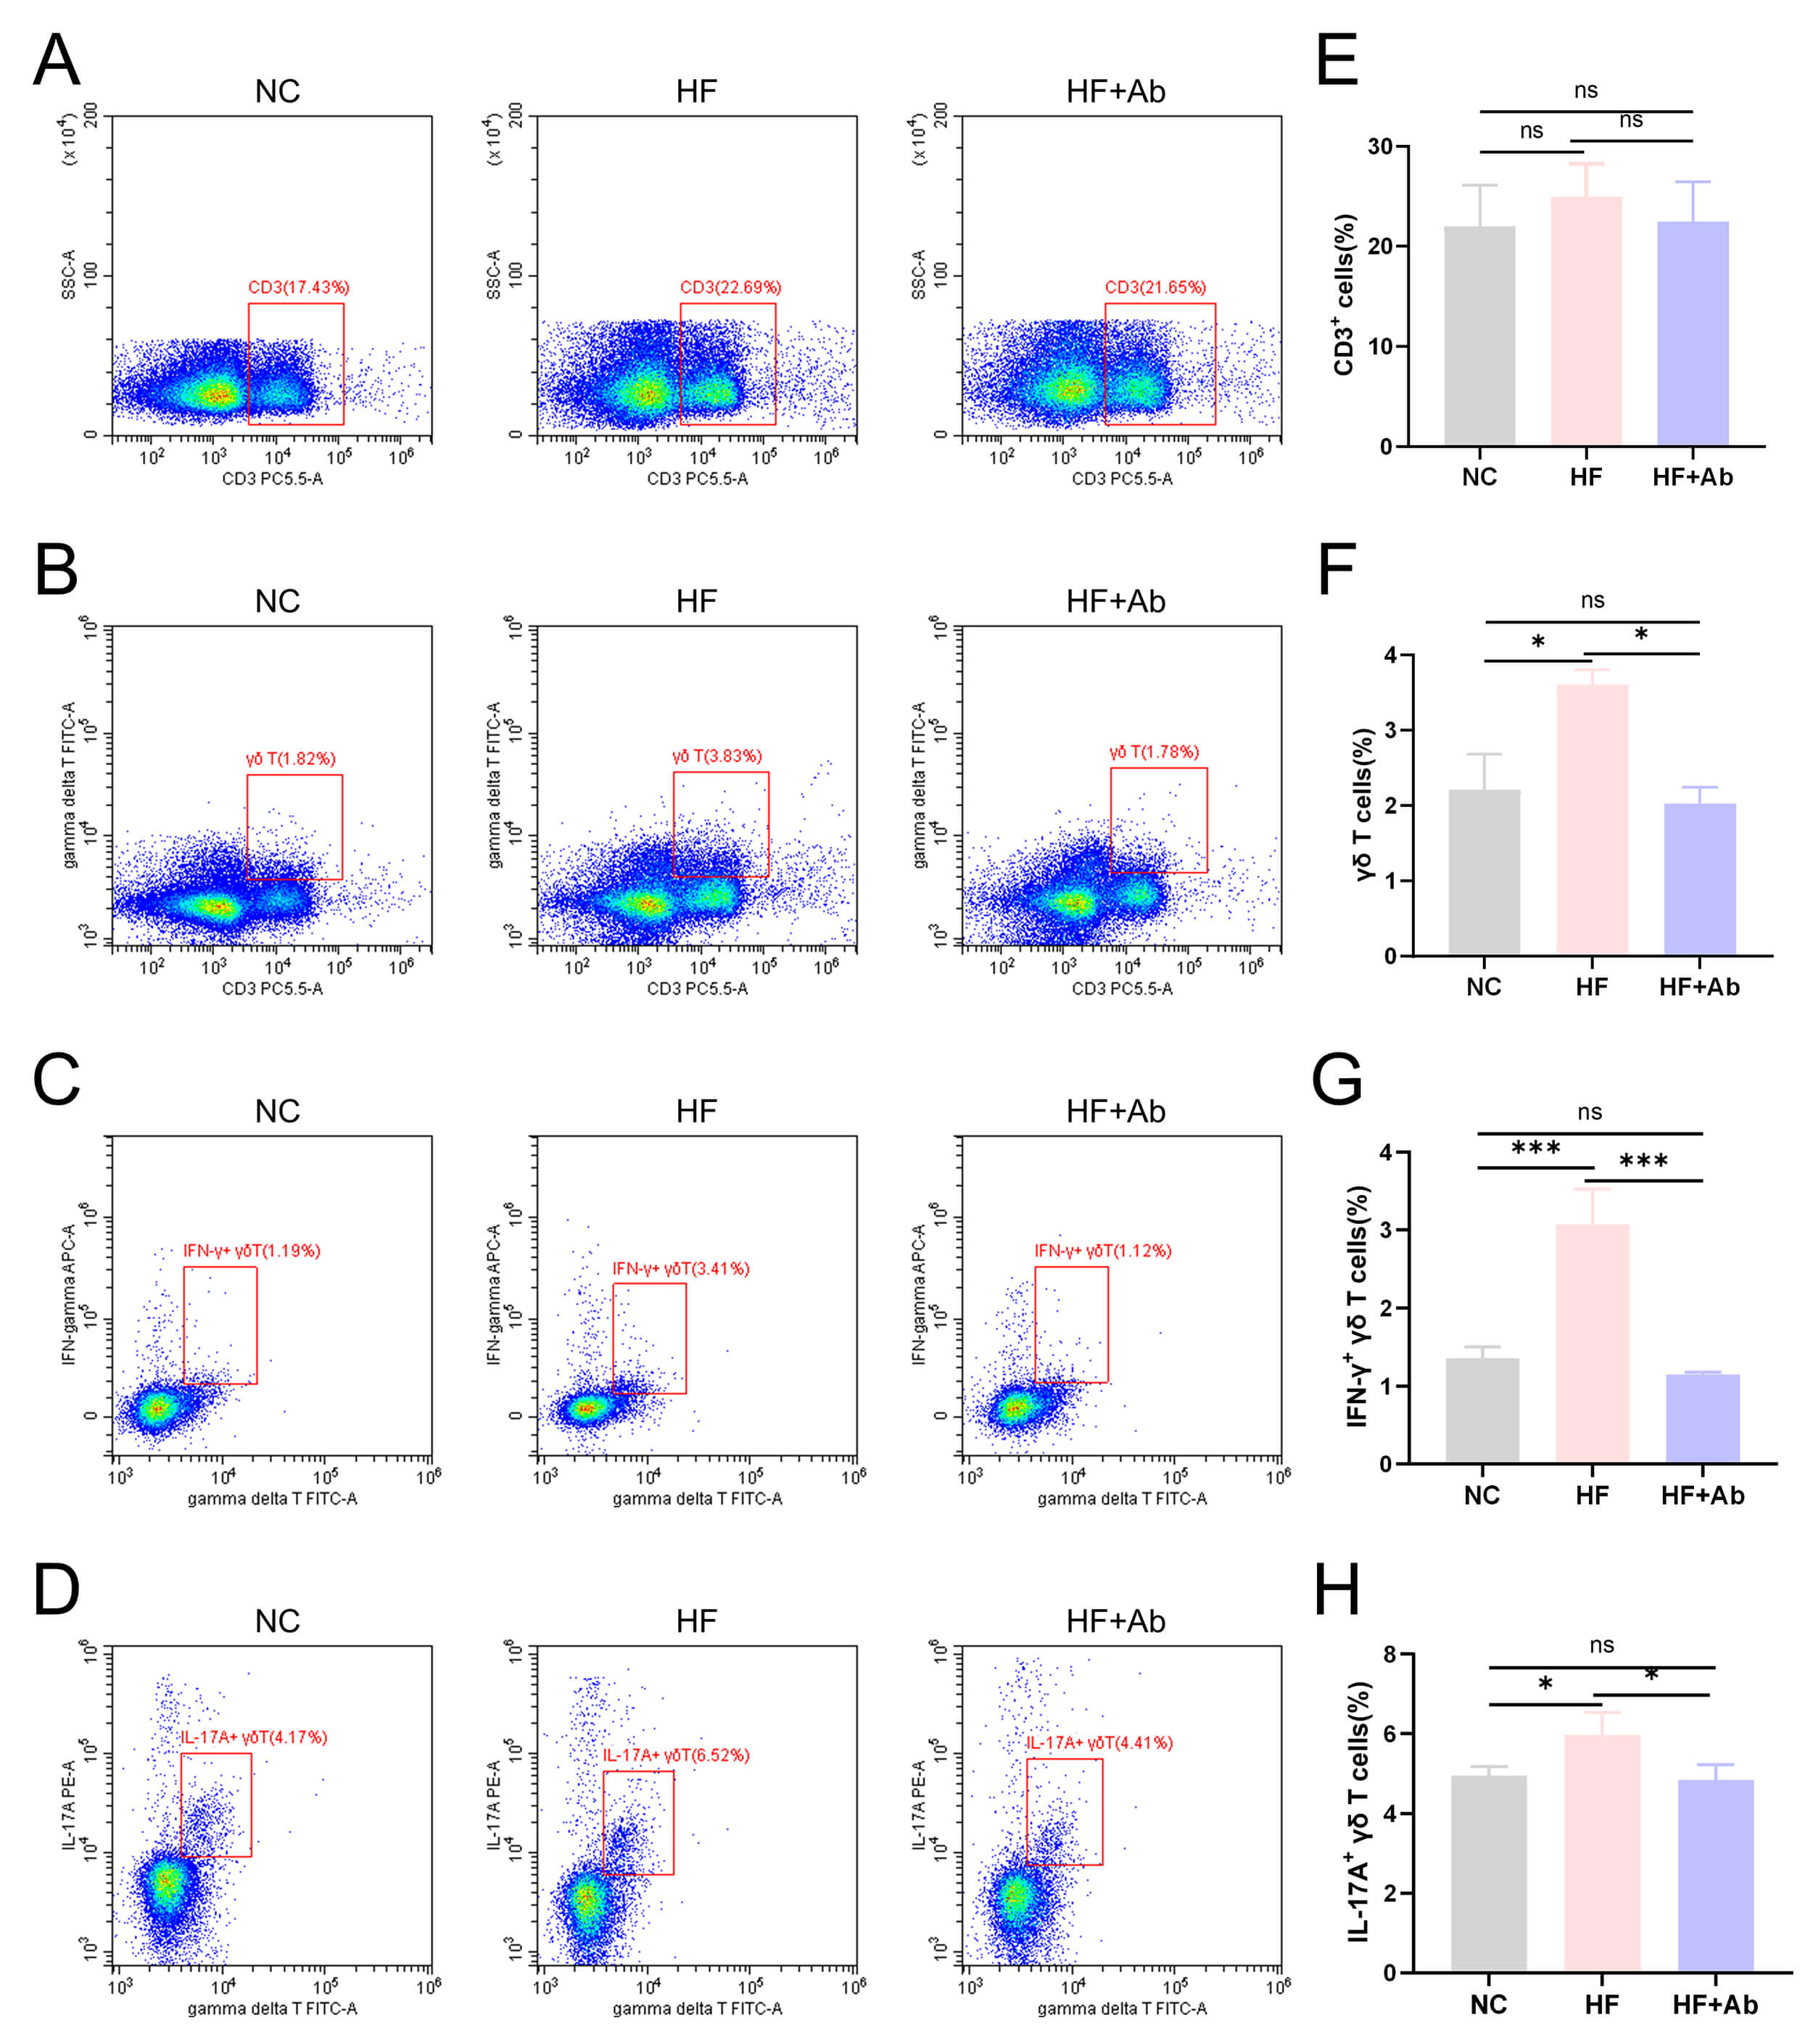 Fig. 4.
Flow cytometry results of
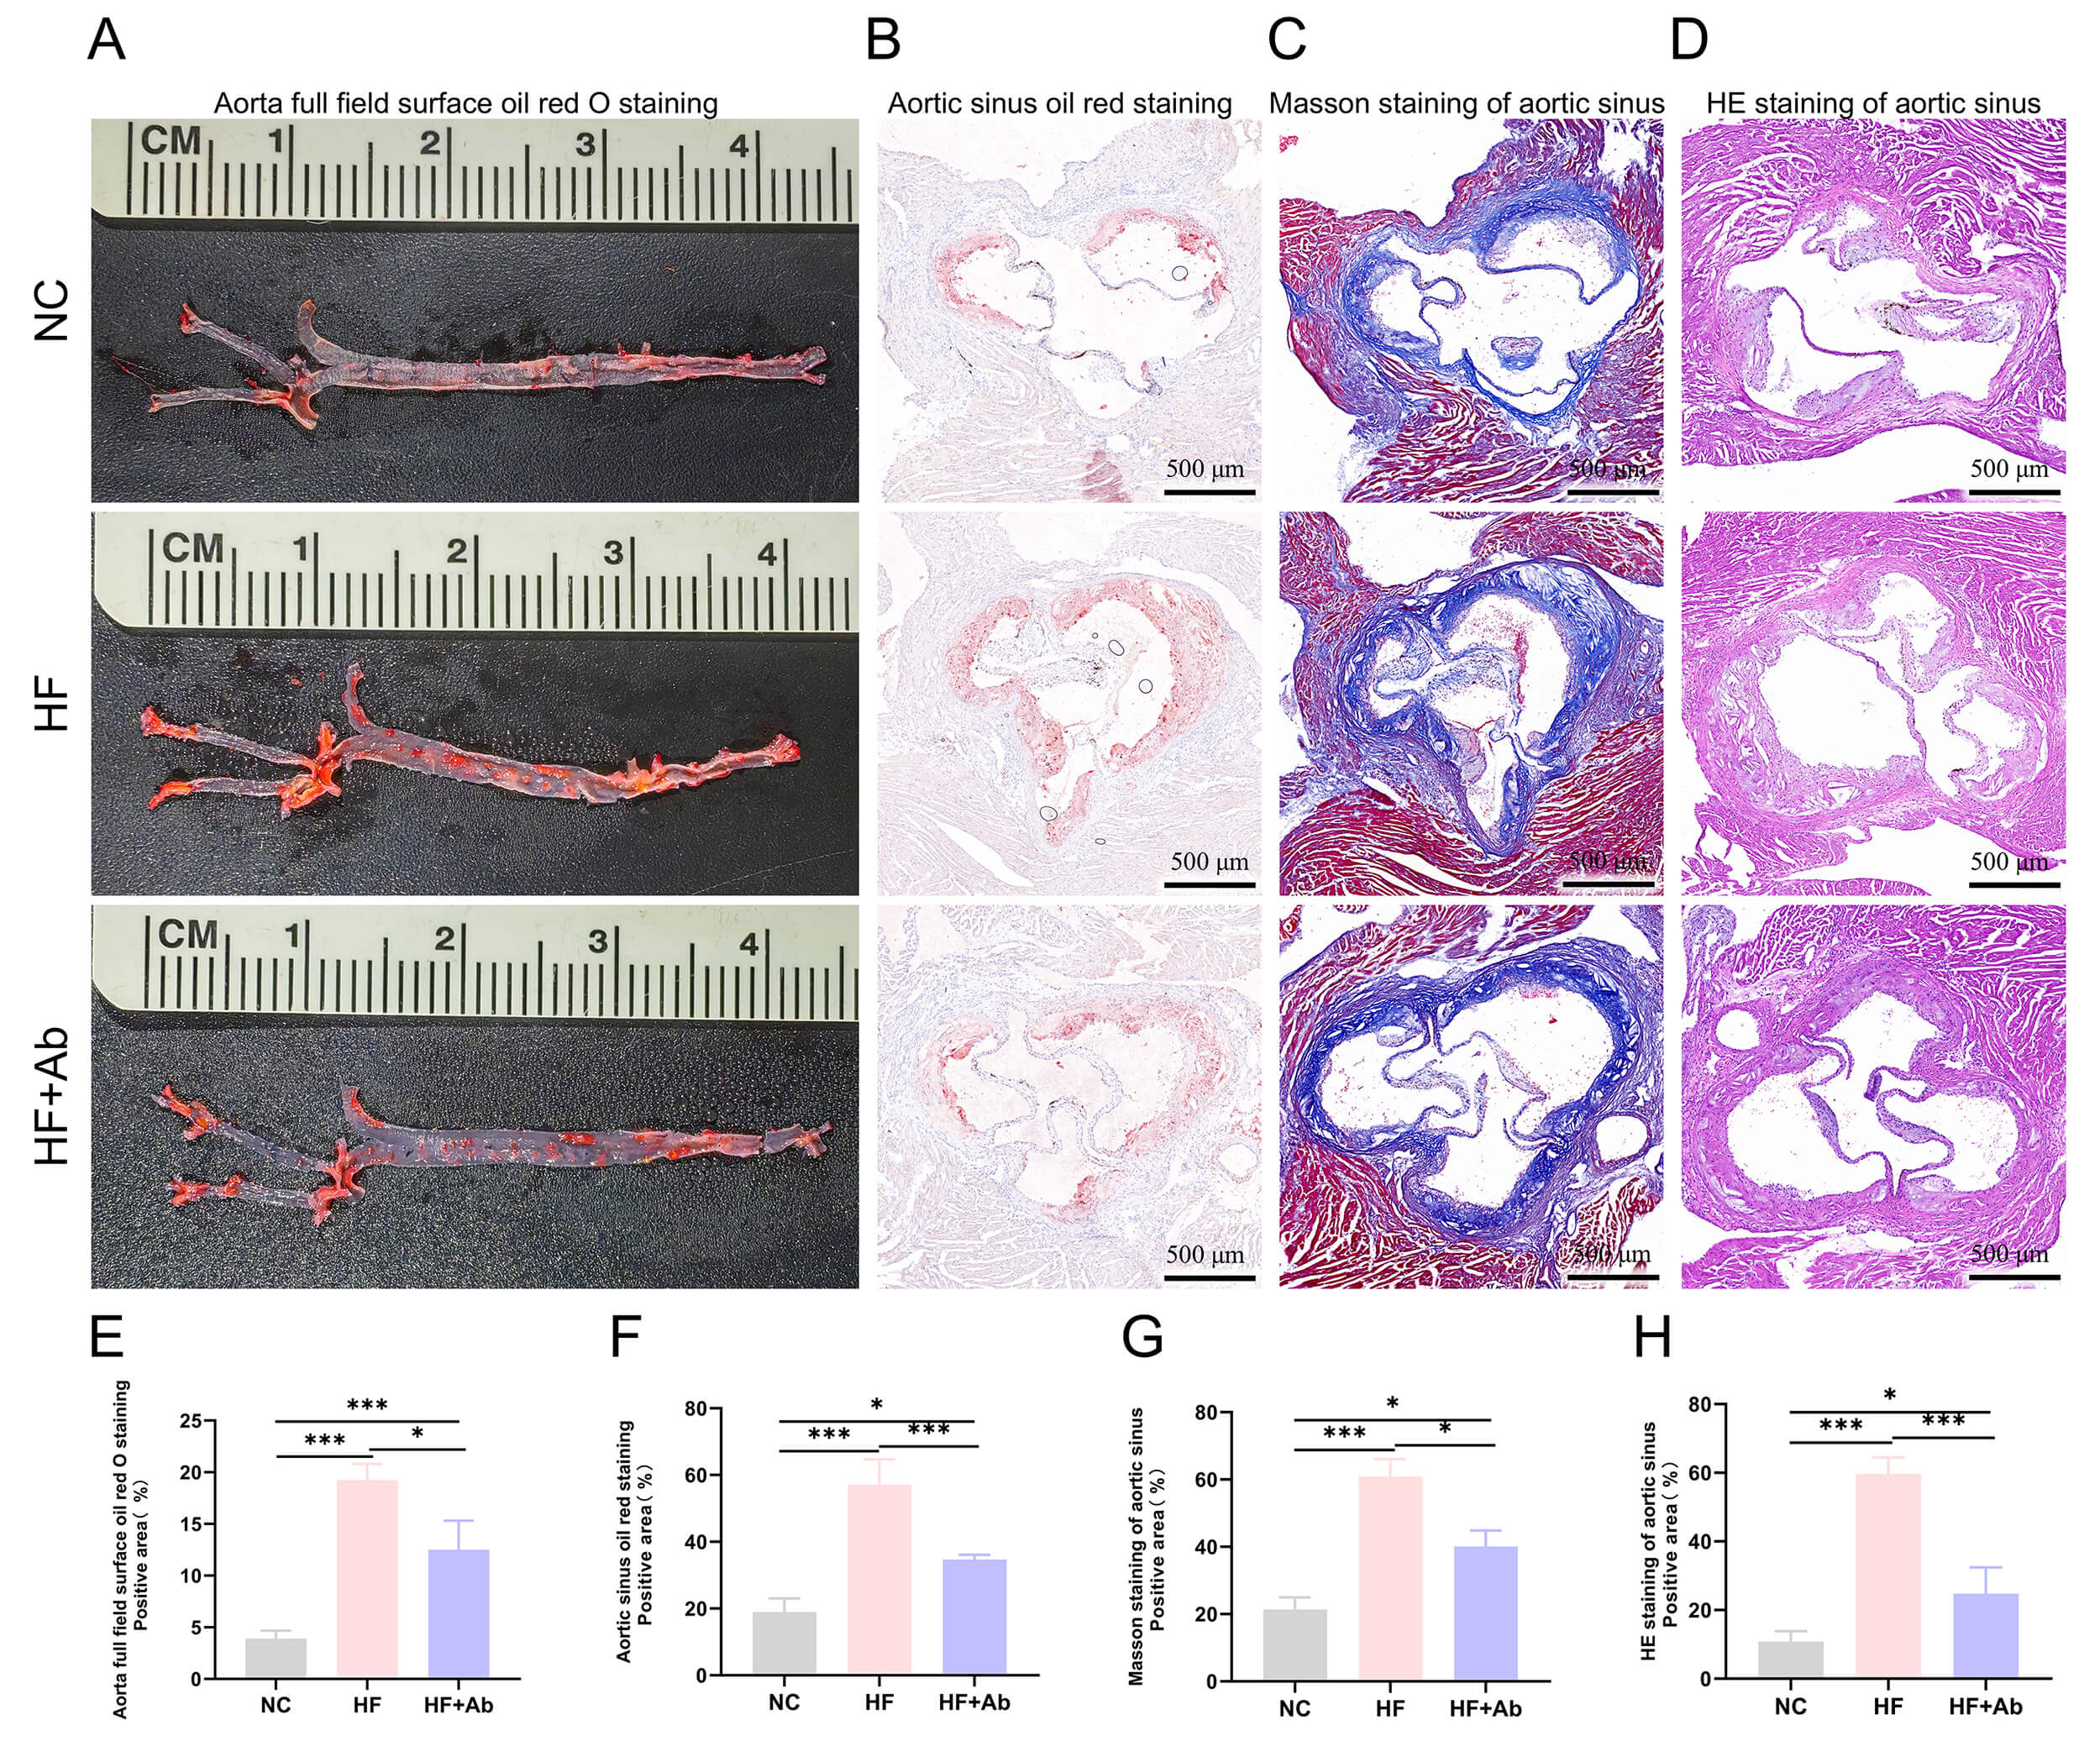 Fig. 5.
Histological staining and analysis of atherosclerosis in the
aorta of mice from each group in the intervention experiment. (A,E) Oil Red O
staining and statistical analysis of positive area on the aortic surface. (B,F)
Oil Red O staining and statistical analysis of positive area in the aortic sinus.
(C,G) Masson staining and statistical analysis of positive area in the aortic
sinus. (D,H) HE staining and statistical analysis of necrotic core area in the
aortic sinus. Group comparisons: *p
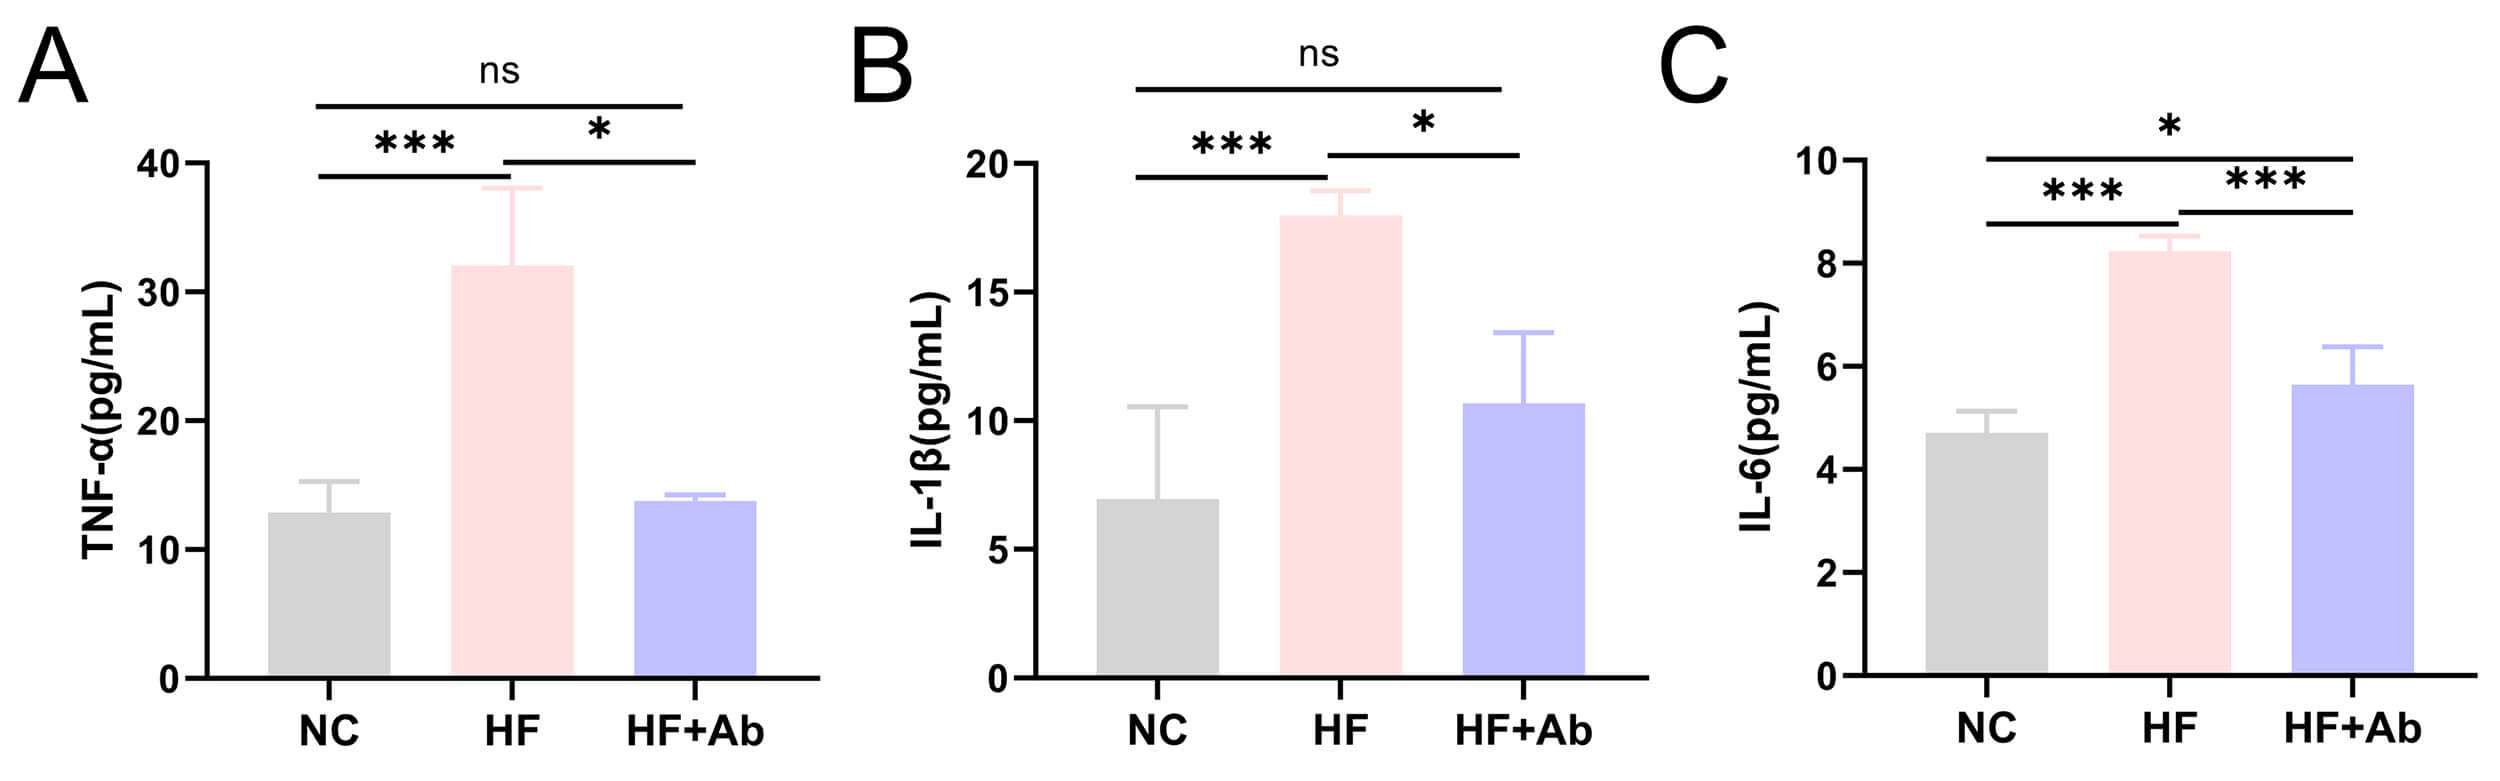 Fig. 6.
Inflammatory cytokine levels in peripheral blood of mice from
each group in the intervention experiment. (A) TNF-
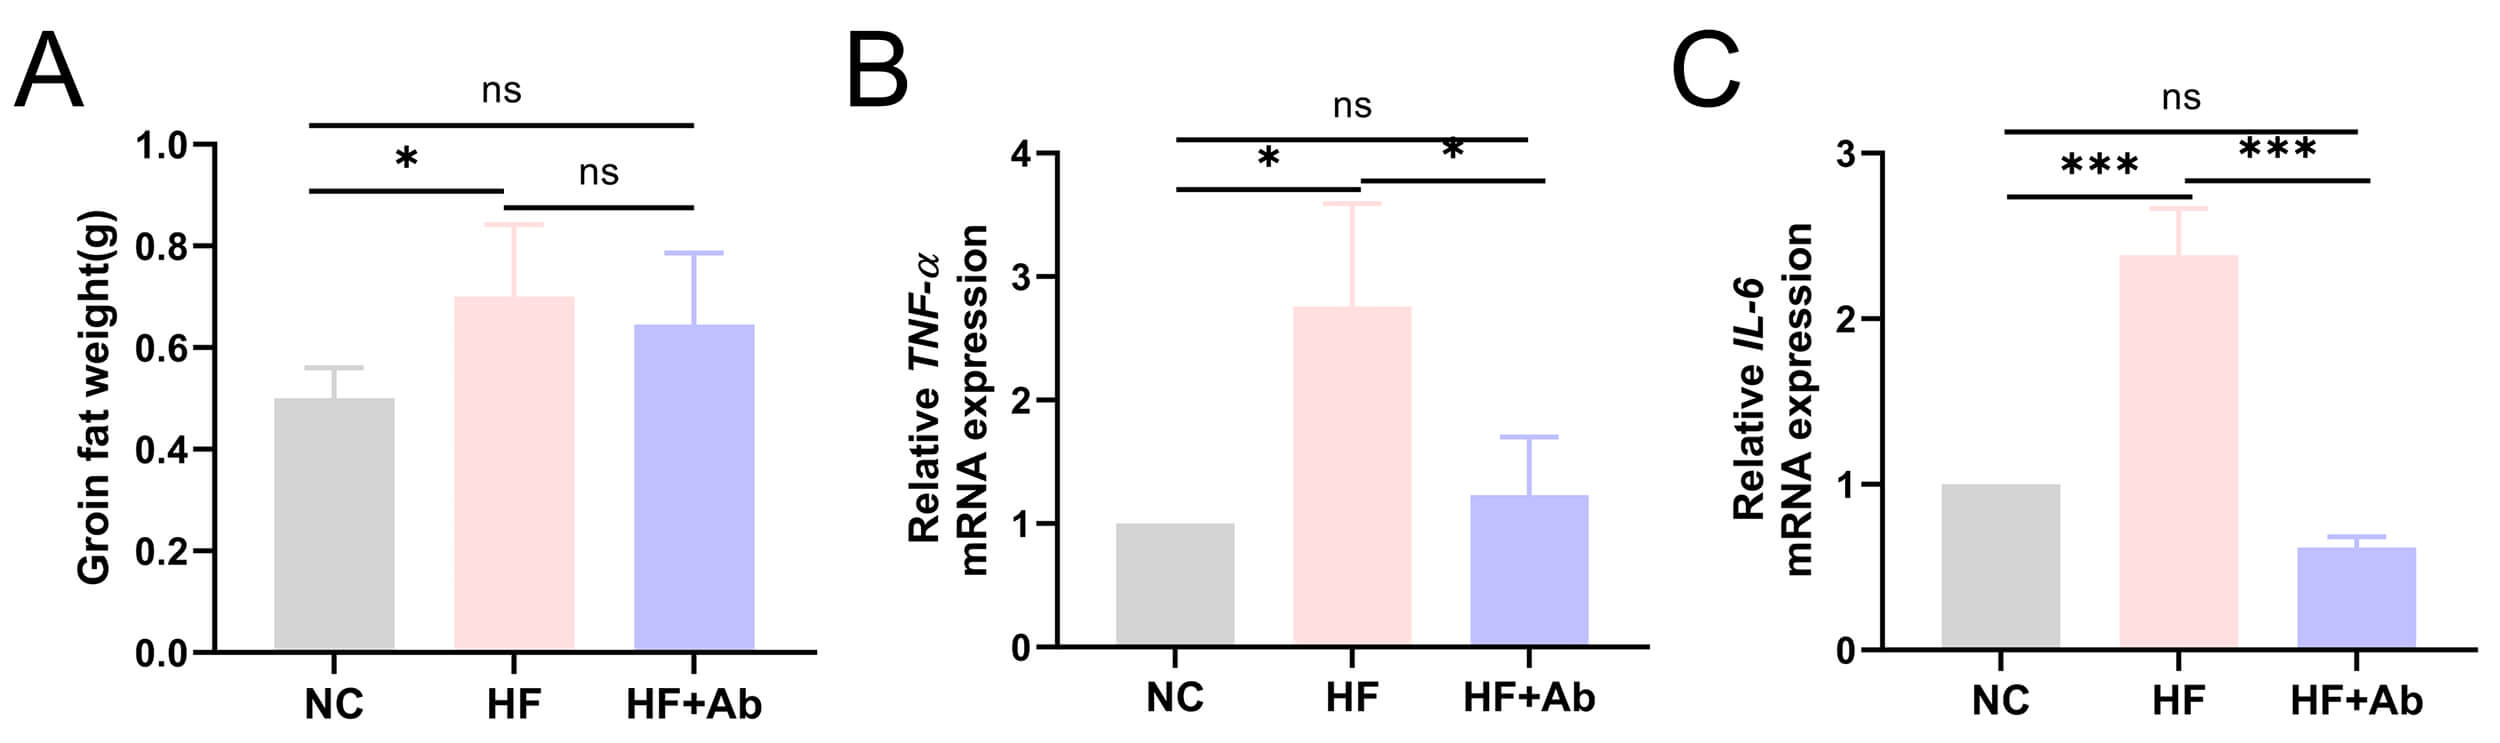 Fig. 7.
Quantitative analysis and mRNA expression of inflammatory
cytokines in inguinal adipose tissue of mice from each group in the intervention
experiment. (A) Groin fat weight. (B) TNF-
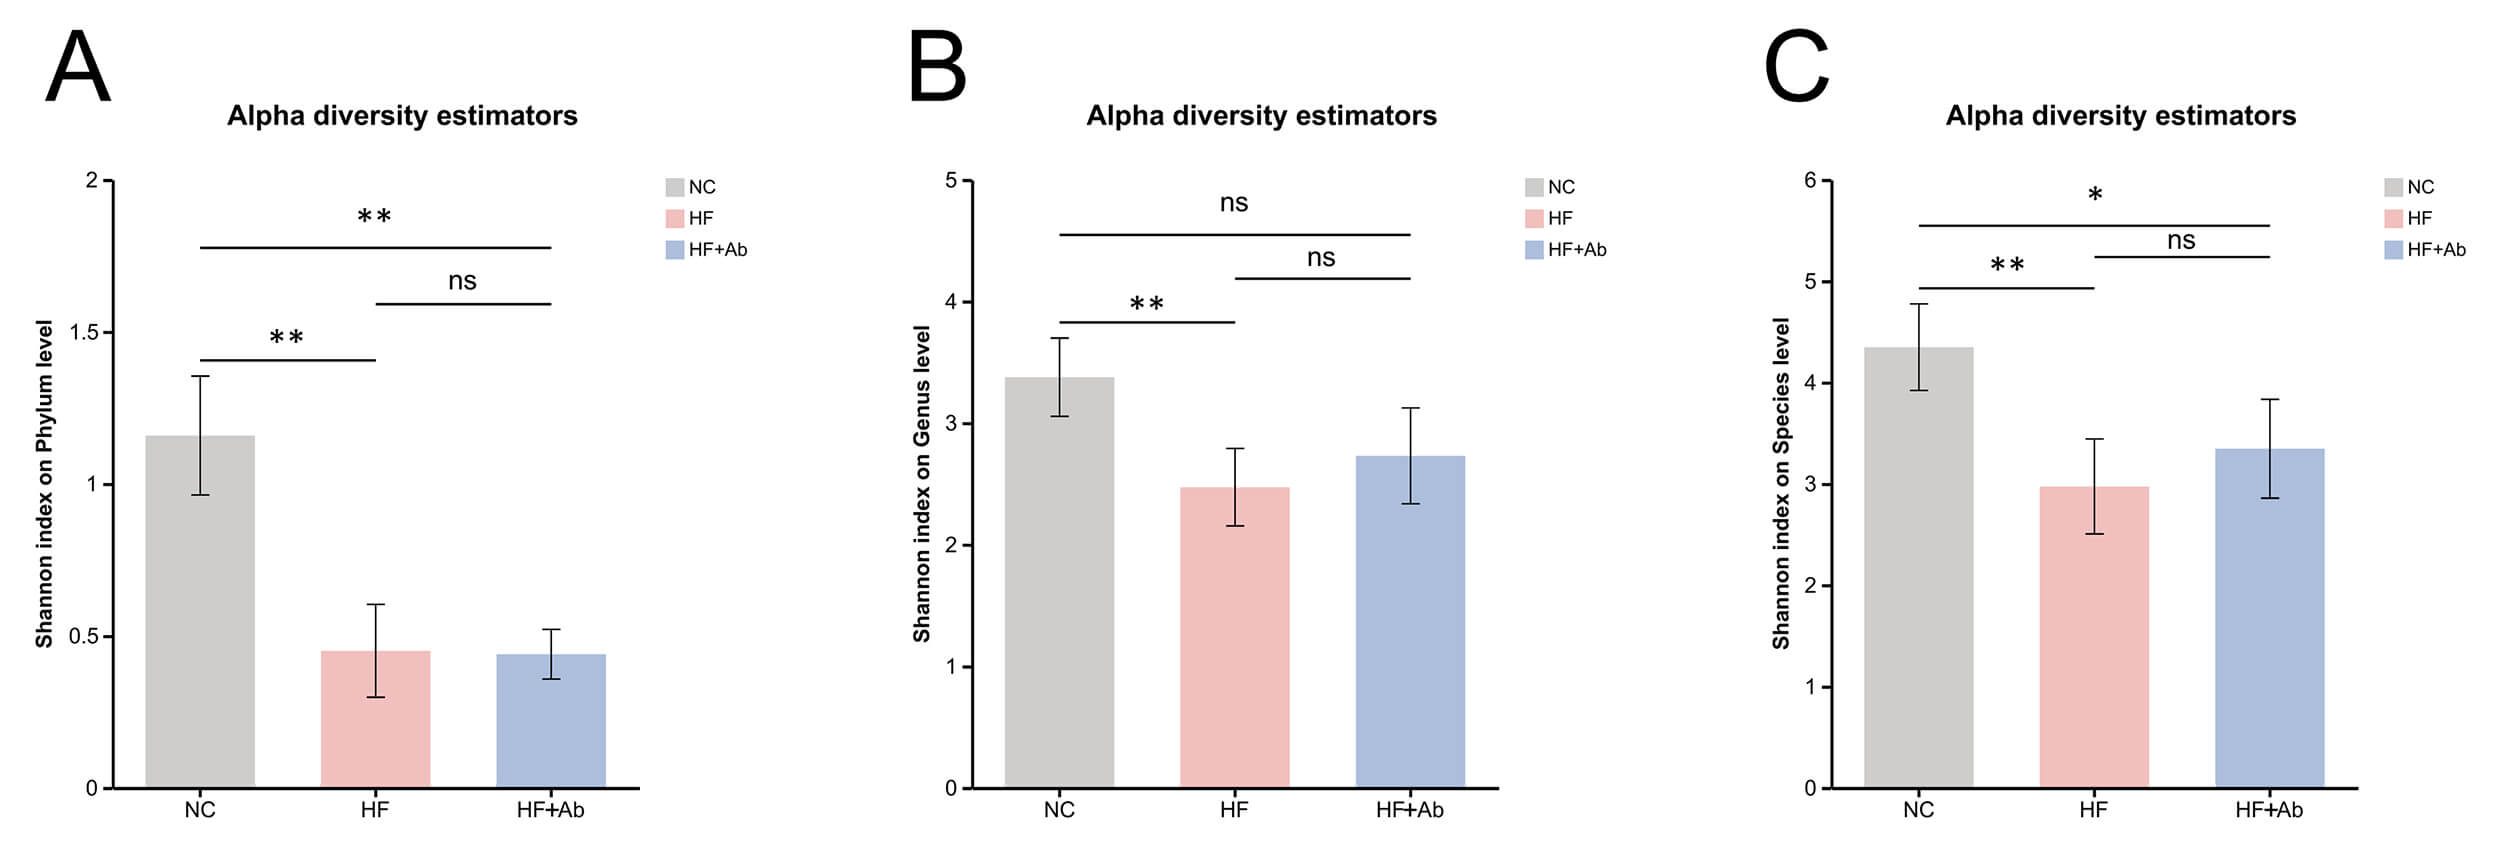 Fig. 8.
Alpha-diversity analysis of fecal metagenomic sequencing across
groups. Shannon index comparisons at the phylum (A), genus (B), and species (C)
levels. Comparison among groups: *p
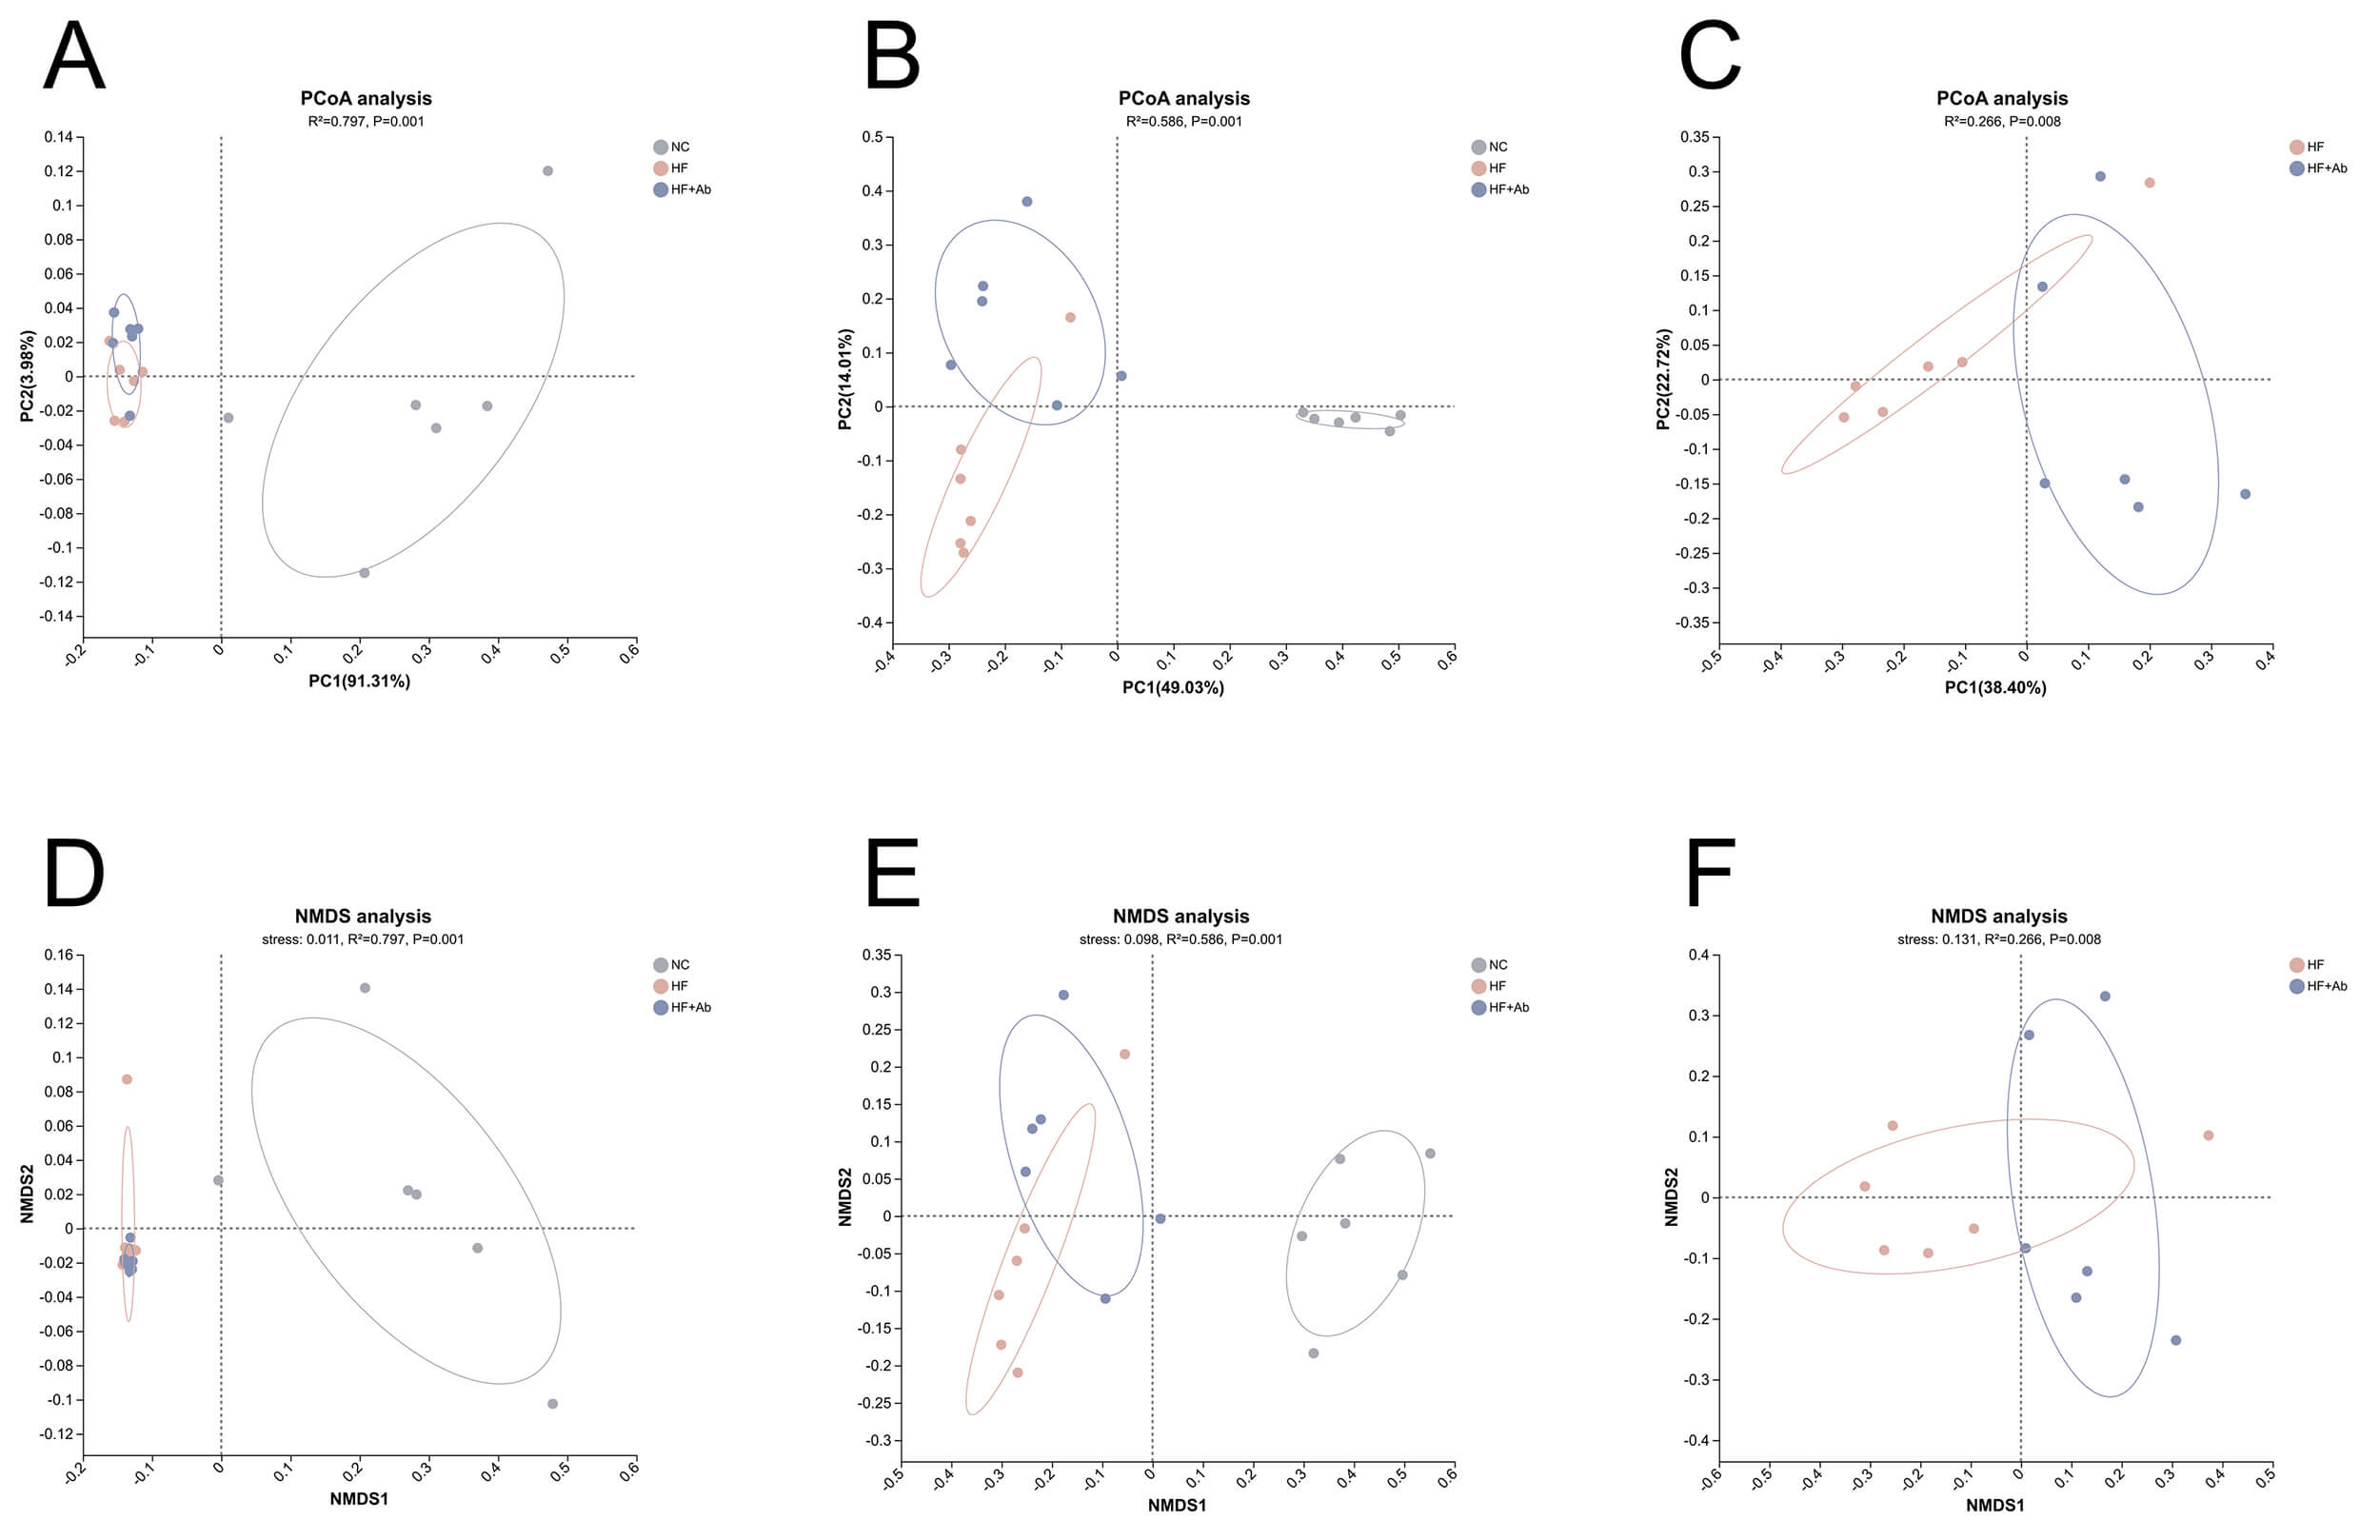 Fig. 9.
Beta-diversity analysis of fecal metagenomic sequencing across groups. PCoA is shown at the phylum level (A) and genus level (B), with an additional pairwise PCoA comparing HF vs. HF+Ab at the genus level (C). NMDS is shown at the phylum level (D) and genus level (E), with an additional pairwise NMDS comparing HF vs. HF+Ab at the genus level (F). Sample size: n = 6 per group. Statistics: Bray-Curtis dissimilarities were computed from relative abundance profiles; between-group differences were assessed by PERMANOVA. PCoA, principal coordinates analysis; NMDS, non-metric multidimensional scaling; PERMANOVA, permutational multivariate analysis of variance.
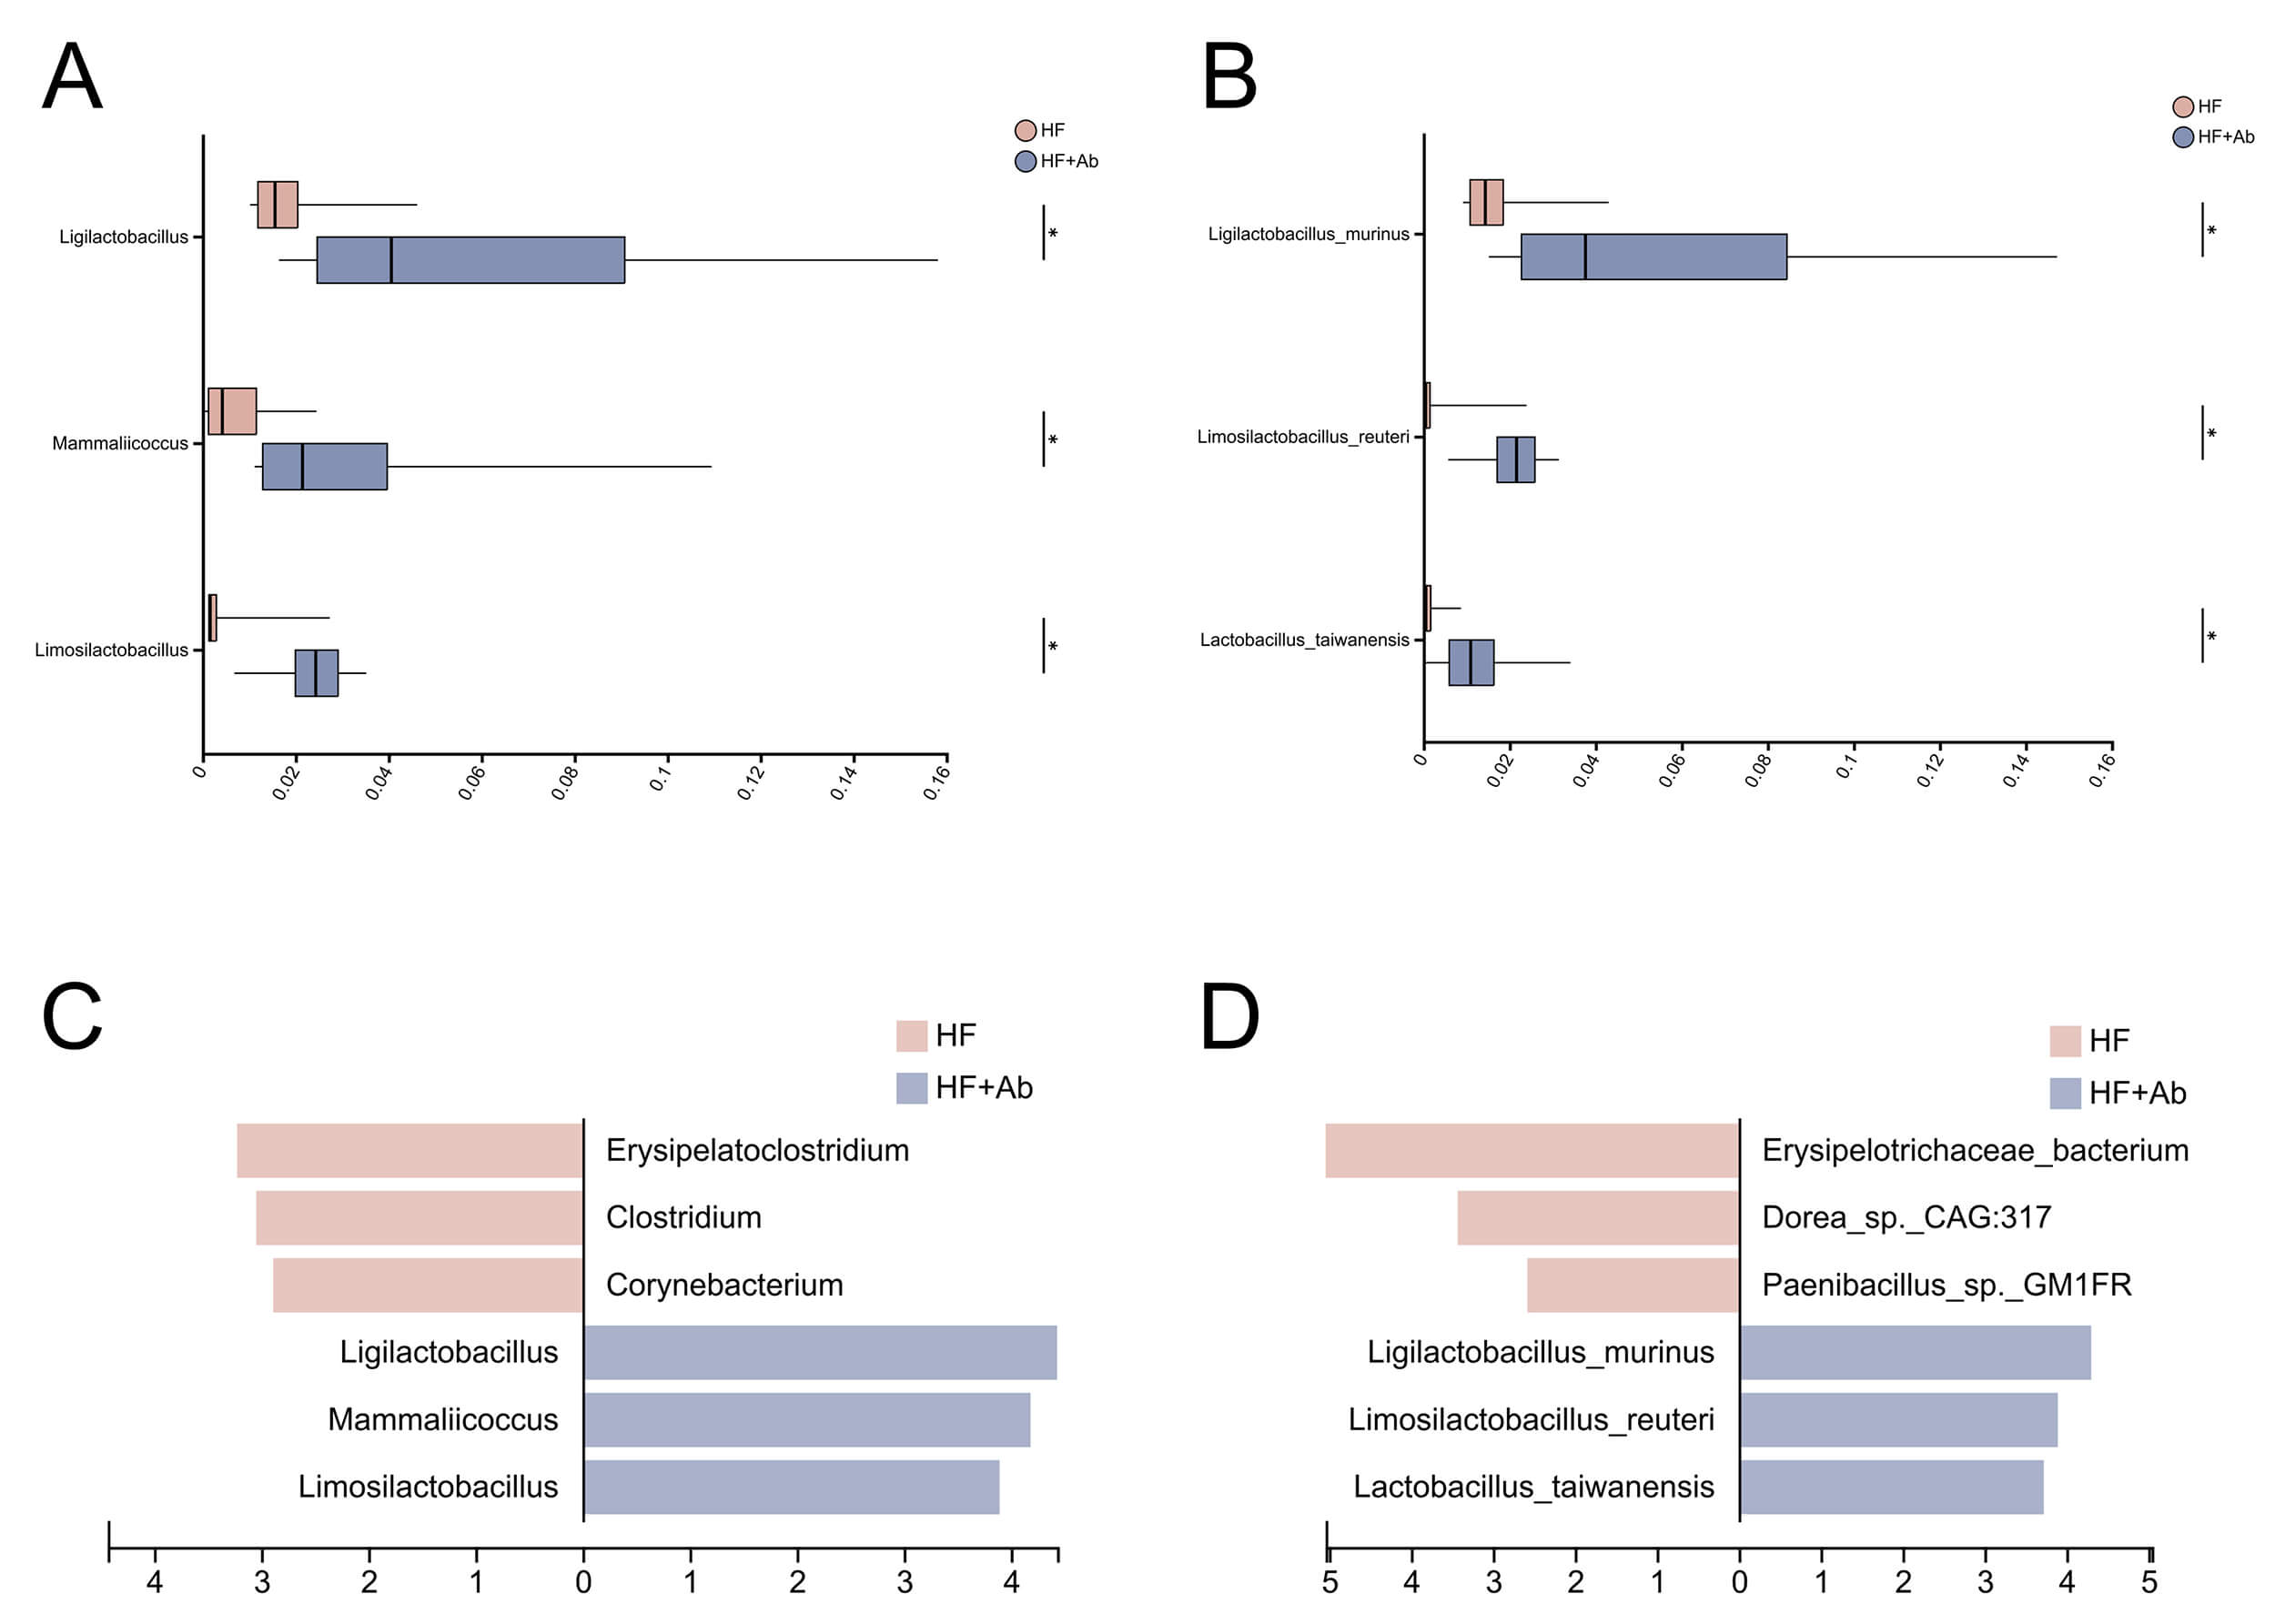 Fig. 10.
Differential abundance analysis of the gut microbiota
between the HF and HF+Ab groups. Pairwise comparisons at the genus (A) and
species (B) levels; LEfSe results (LDA scores) at the genus (C) and species (D)
levels. Comparison among groups: *p
The effect of intraperitoneal injection of the monoclonal antibody UC7-13D5 was
validated. Flow cytometry staining and statistical analysis demonstrated that the
proportion of
Food intake and body weight were monitored throughout the 12-week intervention, and longitudinal curves were plotted (Fig. 2B,C). During the intervention, the NC, HF, and HF+Ab groups showed broadly comparable overall levels of food intake as well as similar temporal trends, with no apparent group-specific intake pattern. Accordingly, the food intake curve is presented primarily to illustrate the overall trend over time. Body weight increased gradually over the intervention period in all groups. Overall, the trajectories of weight gain were similar among the three groups, and no evidence suggested a distinctly different longitudinal pattern of body weight change between groups.
Lipid analysis revealed that triglyceride levels (Fig. 3A) in the HF and HF+Ab
groups were significantly higher than those in the NC group (p
Flow cytometry analysis showed no significant differences in the proportion of
CD3+ total T cells among the control group (NC), model group (HF), and model
intervention group (HF+Ab) (Fig. 4A,E). In contrast, the proportion of
Histological evaluation of the aorta and cross-sections of the aortic sinus was
performed using Oil Red O staining, sliced Oil Red O staining, Masson staining,
and HE staining. The HF group showed a significantly higher percentage of Oil Red
O-positive staining on the aortic surface compared to the NC group (p
Analysis of inflammatory cytokines in peripheral blood revealed that
TNF-
Alpha diversity analysis of fecal metagenomic sequencing revealed differences in
microbial diversity across groups. Phylum level (Fig. 8A): The Shannon index of
the NC group was significantly higher than that of the HF group (p
Following the alpha-diversity analyses, beta diversity was evaluated using PCoA and NMDS based on Bray-Curtis dissimilarities.
In the PCoA ordinations, the NC group was clearly separated from both the HF and HF+Ab groups at the phylum level (Fig. 9A; R2 = 0.797, p = 0.001), whereas the HF and HF+Ab groups exhibited substantial overlap. At the genus level (Fig. 9B), the NC group remained distinct from the HF and HF+Ab groups, and separation between the HF and HF+Ab groups became evident (R2 = 0.586, p = 0.001). To focus on the diet-matched comparison, we performed a pairwise PCoA of the HF and HF+Ab groups at the genus level (Fig. 9C), confirming a significant difference in community structure (R2 = 0.266, p = 0.008).
To assess the robustness of the ordination patterns, NMDS was performed as a complementary approach and yielded results concordant with the PCoA. At the phylum level (Fig. 9D), the NC group separated from the HF and HF+Ab groups (stress = 0.011, R2 = 0.797, p = 0.001), while the HF and HF+Ab groups were not clearly distinguishable. At the genus level (Fig. 9E), NMDS revealed separation among all three groups (stress = 0.098, R2 = 0.586, p = 0.001). A pairwise NMDS analysis comparing HF and HF+Ab at the genus level (Fig. 9F) further supported a significant compositional difference between these two groups (stress = 0.131, R2 = 0.266, p = 0.008).
Following beta-diversity analyses of the fecal metagenomes, we observed significant differences in microbial community composition between the HF and HF+Ab groups at the genus level; therefore, differential taxonomic analyses were conducted at both the genus and species levels, including pairwise comparisons and LEfSe, to identify discriminative taxa.
At the genus level, pairwise differential abundance analysis (Fig. 10A)
comparing the HF and HF+Ab groups identified Ligilactobacillus,
Mammaliicoccus, and Limosilactobacillus as significantly
enriched genera in the HF+Ab group (p
At the species level, pairwise differential abundance analysis (Fig. 10B)
comparing the HF and HF+Ab groups showed that Ligilactobacillus murinus,
Limosilactobacillus reuteri, and Lactobacillus taiwanensis were
significantly enriched in the HF+Ab group and were among the top three differentially enriched species (p
Overall, genus- and species-level analyses consistently indicated that the HF+Ab group was characterized by a concordant set of enriched taxa, and the taxa identified by pairwise comparisons were corroborated by LEfSe-based LDA ranking.
Flow cytometry analysis confirmed that the monoclonal antibody UC7-13D5
effectively inhibited
In the present study, food intake and body weight were monitored longitudinally
during the 12-week intervention. Food intake showed broadly comparable trends
across groups, and body weight increased over time in all groups, with no
evidence of distinctly different longitudinal trajectories between groups. These
observations suggest that the group differences observed in downstream outcomes
between the HF and HF+Ab groups are unlikely to be explained by systematic
differences in caloric intake or divergent body-weight trajectories during the
intervention. Notably, while
Lipid profiling showed that the high-fat diet markedly increased circulating TG,
TC, and LDL-C. In the UC7-13D5-treated group, these lipid parameters exhibited a
downward trend, suggesting that interference with
Our flow cytometry data showed reduced intestinal
Oil Red O staining revealed a significant increase in aortic lipid deposition in
the HF group, while lipid deposition was reduced in the HF+Ab group after
UC7-13D5 intervention. This indicates that
Mechanistically, the reduction in lesion burden observed with UC7-13D5 is
consistent with the broader concept that inflammation is a key driver of
atherosclerotic plaque progression and vulnerability [23]. In particular,
inflammasome signaling and the IL-1 pathway have been repeatedly implicated in
atherogenesis: cholesterol crystals can activate the NLR family pyrin domain
containing 3 (NLRP3) inflammasome, promoting IL-1
The gut microbiota findings in our study are particularly relevant in light of accumulating evidence that intestinal microbes can modulate atherosclerosis and cardiometabolic risk through defined host–microbe metabolic pathways. A seminal study demonstrated that gut microbiota–dependent metabolism of dietary phosphatidylcholine generates trimethylamine (TMA), which is subsequently converted by host hepatic enzymes into trimethylamine N-oxide (TMAO), a metabolite that promotes macrophage foam cell formation and accelerates atherosclerotic lesion development, suppression of intestinal microbiota attenuated choline-driven atherosclerosis in susceptible mouse models [27]. Subsequent work has further synthesized mechanistic and clinical evidence supporting the contributory role of the gut microbiota–TMA/TMAO axis in cardiovascular disease and atherosclerosis risk [28].
In our study, compared to the normal diet group, a high-fat diet significantly
reduced gut microbial diversity in ApoE-/- mice. Within this
context, our observation that UC7-13D5 treatment is associated with altered gut
microbial community structure suggests a potential immunometabolic link between
intestinal
We also acknowledge several limitations in our study. First, our analyses were
conducted at specific time points and did not capture long-term dynamic changes
in the microbiota. Second, we did not establish a direct causal relationship
between UC7-13D5-mediated
UC7-13D5–mediated inhibition of
The datasets used and analysed during the current study are available from the corresponding author on reasonable request.
Conceptualization: HW, SJ, QZ; Methodology: HW, JM, RY; Formal analysis and investigation: QZ, XZ, MC; Writing—original draft preparation: QZ, XZ; Writing—review and editing: QZ, HW; Resources: SJ, MC; Supervision: HW and all authors commented on previous versions of the manuscript. All authors contributed to the conception and editorial changes in the manuscript. All authors read and approved the final manuscript. All authors have participated sufficiently in the work and agreed to be accountable for all aspects of the work.
This study has successfully passed the experimental animal welfare ethics review of Ningxia Medical University (No. IACUC-NYLAC-2023-164), and all animal experiments are conducted in accordance with the Guiding Principles of Experimental Animal Welfare Ethics and the Regulations on the Management of Experimental Animals. A total of 42 male ApoE-/- mice aged 6–8 weeks were selected as the study objects, all of which were purchased from Beijing Charles River Laboratory Animal Technology Co., Ltd. (Product No. SYXK2023-0009).
Not applicable.
The 2022 National Natural Science Foundation of China (82260086); The 2022 Special Fund for Central Government Guiding Local Science and Technology Development (2022FRD05046); The 2023 Ningxia Medical University “Champion Initiative” Program (XJKF230205); The 2022 Key Scientific Research Project of the Health and Family Planning Commission of the Autonomous Region (2022-NWKY-055).
The authors declare no conflict of interest.
References
Publisher’s Note: IMR Press stays neutral with regard to jurisdictional claims in published maps and institutional affiliations.