


 , Kairui Bo 1, Zhen Zhou 1, Yifeng Gao 1, Sha Li 1, Yue Ren 1, Hui Wang 1,*
 , Lei Xu 1,*
1 Department of Radiology, Beijing Anzhen Hospital, Capital Medical University, 100029 Beijing, China
Abstract
Left-ventricular filling pressure estimated using cardiovascular magnetic resonance (LVFPcmr) provides a noninvasive measure of diastolic function and has demonstrated prognostic value comparable to invasive assessment in heart failure populations. However, data on LVFPcmr in patients following acute ST-segment elevation myocardial infarction (ASTEMI) are limited. Thus, this study aimed to evaluate the diagnostic and prognostic implications of LVFPcmr in a cohort of patients with ASTEMI.
This study included 296 patients with ASTEMI who underwent cardiovascular magnetic resonance (CMR) after percutaneous coronary intervention (PCI). The primary clinical endpoint was major adverse cardiac events (MACEs), defined as a composite of death, reinfarction, and heart failure. Univariable and multivariable Cox regression analyses were used to determine the association between LVFPcmr and MACEs. Receiver operating characteristic curve and Kaplan-Meier analyses were performed to evaluate the prognostic value of LVFPcmr in patients with ASTEMI.
During a median follow-up of 1563 days (interquartile range: 1442–1714 days), 38 patients (12.84%) experienced MACEs. These patients exhibited significantly higher CMR-derived LVFPcmr values than those without MACEs (14.57 [13.17–15.99] vs. 13.30 [12.05–14.51] mmHg; p < 0.001). Moreover, the Youden index identified an optimal LVFPcmr cutoff of 14.30 mmHg for high-risk classification (p < 0.001). In univariable Cox regression analysis, each 1 mmHg increase in LVFPcmr was associated with a significantly higher risk of MACEs (hazard ratio [HR]: 1.31; 95% confidence interval [CI]: 1.14–1.51; p < 0.001). This association remained robust in multivariable models after adjustment for baseline covariates, left-ventricular ejection fraction, and infarct size (% of LV mass) (HR: 1.25 per 1 mmHg increase; 95% CI, 1.07–1.46; p < 0.01). The multivariable regression model yielded a Harrell C-index of 0.77, indicating strong discriminative ability for predicting MACEs.
LVFPcmr independently predicts long-term MACEs after ASTEMI, supporting the use of this approach in post-PCI risk stratification.
Keywords
- left-ventricular filling pressure
- cardiovascular magnetic resonance
- ST-segment elevation myocardial infarction
- risk stratification
Acute myocardial infarction (AMI) remains one of the leading causes of morbidity and mortality worldwide [1, 2, 3]. Following AMI, necrosis and inflammation trigger adverse ventricular remodeling, which is characterized by myocardial fibrosis, increased ventricular stiffness, and impaired diastolic relaxation [4, 5, 6]. This remodeling increases left-ventricular filling pressure (LVFP), a key marker of diastolic dysfunction, which can cause pulmonary congestion and adverse outcomes even in patients with preserved ejection fraction [7]. Elevated LVFP has also been shown to independently predict rehospitalization and major adverse cardiovascular events (MACE) in heart failure cohorts [8].
Historically, the measurement of LVFP has relied on invasive catheterization methods such as right heart catheterization (RHC), which is regarded as the gold standard for detailed hemodynamic assessment [9]. However, the invasive nature of these procedures limits their routine application in patients with AMI [10]. Therefore, noninvasive techniques, particularly transthoracic echocardiography (TTE), have become widely used for initial LVFP assessment. Nonetheless, it cannot assess myocardial tissue characteristics, which are essential for comprehending the underlying pathology in AMI [11].
Cardiovascular magnetic resonance (CMR) not only offers superior tissue characterization and functional imaging but also captures dynamic changes in myocardial structure and function, providing a more comprehensive assessment of cardiac pathology [12, 13]. CMR can quantify multiple parameters of left ventricle (LV) diastolic function, similar to echocardiography. These include strain-based myocardial deformation analysis and phase-contrast evaluation of transmitral or pulmonary venous flow. Such measurements usually require advanced image postprocessing and often involve specific pulse sequences [14]. Recently, a CMR-based estimate of LVFP (LVFPcmr) has been introduced, derived exclusively from routine cine images and not requiring additional sequences or scan time. This method has demonstrated considerable prognostic value in patients with heart failure, potentially offering an accurate and noninvasive alternative for LVFP assessment [15]. Given its accessibility from standard cine CMR sequences, LVFPcmr may be feasibly incorporated into routine post–percutaneous coronary intervention (PCI) imaging protocols to facilitate early identification of high-risk patients, optimize follow-up frequency, and guide adjunctive therapeutic decisions. Nevertheless, the clinical utility and prognostic significance of LVFPcmr in acute ST-segment elevation myocardial infarction (ASTEMI) are yet to be elucidated. Considering its potential advantages, this study aimed to assess the prognostic value of LVFPcmr in patients with ASTEMI who had undergone PCI.
Consecutive patients admitted to the coronary care unit of Anzhen Hospital with an initial diagnosis of ASTEMI were screened for inclusion. The study was conducted in accordance with the Declaration of Helsinki and approved by the Ethics Committee of Beijing Anzhen Hospital. Written informed consent was obtained from all participants. Between June 2016 and December 2022, a total of 296 patients who underwent gadolinium-enhanced CMR following primary PCI were evaluated. Inclusion criteria: (1) diagnosis of ASTEMI according to the Fourth Universal Definition of Myocardial Infarction [16] and (2) completion of CMR within 3–7 days of hospital admission. Exclusion criteria: (1) known cardiomyopathy, congenital or valvular heart disease, pericardial disease, or severe arrhythmia; (2) incomplete or missing essential laboratory data including brain natriuretic peptide (BNP) and creatine kinase-myocardial band (CK-MB); (3) insufficient follow-up information; and (4) poor image quality.
All examinations were performed on 3.0 T cardiovascular MR systems, including
the Achieva (Philips Healthcare, Best, Netherlands) and the Discovery MR750w (GE
Healthcare, Milwaukee, WI, USA), both equipped with a 32-channel phased-array
cardiac coil, electrocardiographic (ECG) gating, and respiratory navigation. The
standard imaging protocol featured steady-state free-precession (SSFP) cine
sequences during breath-holding, T2-weighted short-axis imaging, and late
gadolinium enhancement (LGE). A cine CMR study was conducted using an SSFP
sequence, which captured contiguous short-axis images from the mitral annulus to
the apex, covering both ventricles. Long-axis views in two-, three-, and
four-chamber planes were also acquired, with 25–30 reconstructed cardiac phases
per cycle. T2-weighted short-axis imaging used a short tau inversion recovery
technique. Myocardial perfusion data were collected during the intravenous
administration of 0.1 mmol/kg gadolinium-based contrast at a rate of 4 mL/s. For
LGE, prospectively ECG-gated gradient-echo images in short- and long-axis planes
were obtained 10–15 min after injecting 0.2 mmol/kg of contrast (TR/TE = 4.1/1.6
ms; flip angle = 20°; matrix size = 256
All CMR datasets were transferred to a dedicated workstation and analyzed using
commercial software CVI42 (version 5.2.0, Circle Cardiovascular Imaging Inc.,
Calgary, Canada). Ventricular function was evaluated using the Short 3D module,
which semiautomatically traced endocardial and epicardial borders at
end-diastolic and end-systolic frames on cine short-axis stacks, including
papillary muscles. Contours were visually inspected and manually adjusted by two
experienced cardiovascular radiologists (
LGE was identified as regions with signal intensity of
A CMR-based model estimating LVFP from LAV and LVM has been recently proposed. The equation was developed using data from a cohort of 835 individuals evaluated for suspected heart failure who underwent CMR, echocardiography, and invasive hemodynamic assessment [15]. In this study, the formula was applied to calculate LVFP values using measured LAV and LVM:
LVFPcmr = 6.1352
Composite endpoint events were identified by reviewing Anzhen Hospital’s electronic medical records, with additional follow-up via telephone for events that occurred after discharge. MACE was defined as a composite endpoint including all-cause death, recurrent myocardial infarction, or heart failure requiring rehospitalization following AMI. If a patient experienced multiple events, only the most severe one was recorded, based on the following hierarchy: death, reinfarction, then heart failure. Each patient was counted once for a MACE event in the analysis.
Continuous data were expressed as the mean
A sex-specific CMR-derived PCWP (sex-specific LVFPcmr) was additionally
computed from LAV and LVM, with sex coded as female = 0 and male = 1, as proposed
by Garg et al. [17]: Sex-specific LVFPcmr = 5.7591 + 0.07505
In summary, this single-center retrospective study included 296 patients with ASTEMI who underwent CMR after primary PCI. Quantitative CMR parameters such as LAV, LVM, and derived LVFPcmr were examined in relation to future MACE. The prognostic value of LVFPcmr was evaluated using Kaplan-Meier survival curves and Cox regression, adjusting for key clinical and imaging factors. These analyses aimed to determine if LVFPcmr provides independent prognostic insights beyond conventional measures, such as LVEF and infarct size.
A total of 309 patients initially met the inclusion criteria (Fig. 1). Of these, 7 lacked 6-month follow-up data, and 6 had poor CMR image quality. The final cohort comprised 296 patients, with a median age of 58 years (IQR, 49–66); 248 (83.78%) were male, and 48 (16.22%) were female. The last follow-up was in December 2024, with a median duration of 1563 days (IQR, 1442–1714). Of these, 38 patients (12.84%) experienced MACE, including 8 deaths from all causes, 12 reinfarctions, and 18 hospitalizations for heart failure. The primary baseline clinical and CMR characteristics are summarized in Tables 1,2.
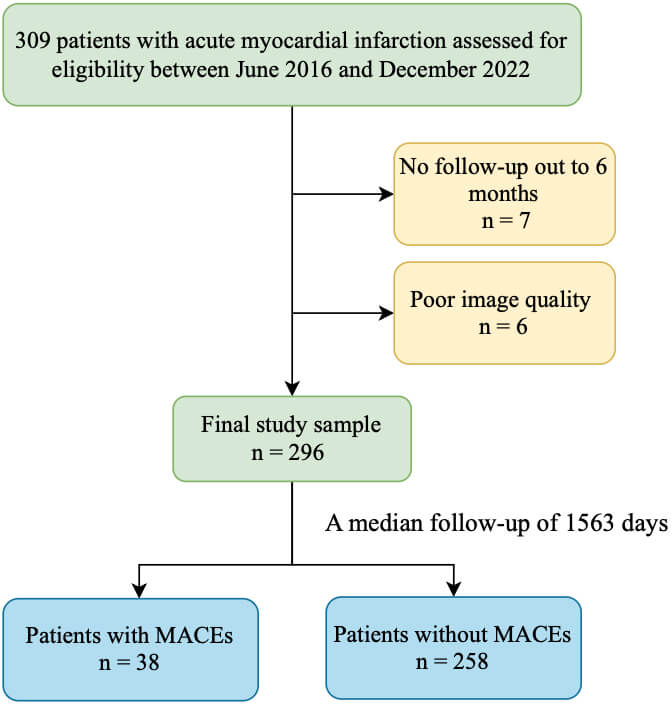 Fig. 1.
Flowchart of patient inclusion. MACE, major adverse cardiovascular events.
| Parameter | All participants (n = 296) | No MACE (n = 258) | MACE (n = 38) | p value | ||
| Baseline characteristics | ||||||
| Age (y) | 58.00 (49.00, 66.00) | 57.00 (48.00, 65.00) | 62.50 (51.00, 66.00) | 0.398 | ||
| Men | 248 (83.78) | 213 (82.56) | 35 (92.11) | 0.136 | ||
| Body mass index (kg/m2) | 25.66 (23.55, 27.68) | 25.71 (23.53, 27.68) | 25.25 (23.67, 28.58) | 0.494 | ||
| Heart rate (beats/min) | 78.00 (70.00, 88.00) | 78.00 (70.00, 87.00) | 80.00 (72.00, 90.00) | 0.098 | ||
| Systolic blood pressure (mmHg) | 122.27 |
122.88 |
118.13 |
0.172 | ||
| Diastolic blood pressure (mmHg) | 77.00 (70.00, 84.00) | 77.50 (70.00, 84.00) | 77.00 (68.00, 84.00) | 0.536 | ||
| Cardiovascular risk factors | ||||||
| Previous/current smoker (%) | 188 (63.51) | 158 (61.24) | 30 (78.95) | 0.034 | ||
| Hypertension (%) | 184 (62.16) | 156 (60.47) | 28 (73.68) | 0.117 | ||
| Diabetes (%) | 106 (35.81) | 90 (34.88) | 16 (42.11) | 0.386 | ||
| Dyslipidemia (%) | 193 (65.20) | 168 (65.12) | 25 (65.79) | 0.935 | ||
| Prior myocardial infarction (%) | 11 (3.72) | 10 (3.88) | 1 (2.63) | |||
| Previous PCI (%) | 16 (5.41) | 13 (5.04) | 3 (7.89) | 0.442 | ||
| Killip class | 0.013 | |||||
| I | 214 (72.30) | 194 (75.19) | 20 (52.63) | |||
| II | 73 (24.66) | 58 (22.48) | 15 (39.47) | |||
| III | 3 (1.01) | 2 (0.78) | 1 (2.63) | |||
| IV | 6 (2.03) | 4 (1.55) | 2 (5.26) | |||
| TIMI flow before PCI | 0.203 | |||||
| 0 | 209 (70.61) | 181 (70.16) | 28 (73.68) | |||
| 1 | 19 (6.42) | 19 (7.36) | 0 (0) | |||
| 2 | 25 (8.45) | 23 (8.91) | 2 (5.26) | |||
| 3 | 43 (14.53) | 35 (13.57) | 8 (21.05) | |||
| TIMI flow grade after PCI | 0.657 | |||||
| 2 | 12 (4.05) | 10 (3.88) | 2 (5.26) | |||
| 3 | 284 (95.95) | 248 (96.12) | 36 (94.74) | |||
| Location anterior (%) | 138 (46.62) | 114 (44.19) | 24 (63.16) | 0.029 | ||
| Blood results | ||||||
| CK-MB mass (ng/mL) | 218.85 (106.85, 303.00) | 212.15 (105.90, 303.00) | 286.60 (186.50, 303.00) | 0.077 | ||
| Myoglobin (ug/L) | 273.50 (76.00, 513.40) | 277.50 (80.00, 503.00) | 257.50 (56.10, 642.68) | 0.978 | ||
| BNP (pg/mL) | 177.50 (82.00, 319.50) | 166.50 (81.00, 294.00) | 283.00 (117.00, 486.00) | 0.004 | ||
| Creatinine (µmol/L) | 71.70 (64.00, 82.00) | 71.45 (62.90, 82.00) | 72.95 (64.90, 82.90) | 0.678 | ||
| eGFR (mL/min/1.73 m2) | 98.11 (88.75, 108.04) | 98.77 (88.78, 108.14) | 96.16 (87.66, 105.37) | 0.511 | ||
| Triglycerides (mmol/L) | 1.46 (1.08, 1.97) | 1.48 (1.09, 2.00) | 1.32 (0.85, 1.90) | 0.315 | ||
| Total cholesterol (mmol/L) | 4.65 (4.03, 5.47) | 4.68 (4.07, 5.54) | 4.31 (3.63, 5.22) | 0.062 | ||
| HDL cholesterol (mmol/L) | 1.04 (0.89, 1.21) | 1.04 (0.89, 1.20) | 1.00 (0.80, 1.26) | 0.266 | ||
| LDL cholesterol (mmol/L) | 3.09 (2.40, 3.67) | 3.09 (2.41, 3.72) | 3.09 (2.37, 3.62) | 0.789 | ||
| High-sensitivity CRP (mg/L) | 5.13 (2.26, 10.92) | 4.58 (2.11, 10.28) | 7.31 (3.45, 20.00) | 0.010 | ||
| Blood glucose on admission (mmol/L) | 8.69 (7.17, 11.90) | 8.71 (7.17, 12.04) | 8.66 (7.21, 10.13) | 0.830 | ||
| Fasting blood glucose (mmol/L) | 6.57 (5.63, 8.88) | 6.48 (5.57, 8.86) | 6.68 (5.89, 9.03) | 0.385 | ||
| HbA1c (%) | 6.00 (5.60, 7.20) | 6.00 (5.60, 7.10) | 6.10 (5.70, 7.30) | 0.449 | ||
| GRACE score | 119.00 (101.00, 131.00) | 116.50 (99.00, 131.00) | 129.50 (114.00, 148.00) | 0.002 | ||
| GRACE risk category | 0.002 | |||||
| Low | 103 (34.80) | 96 (37.21) | 7 (18.42) | |||
| Intermediate | 145 (48.99) | 127 (49.22) | 18 (47.37) | |||
| High | 48 (16.22) | 35 (13.57) | 13 (34.21) | |||
| Door-to-wire time (min) | 100.00 (88.00, 130.00) | 100.00 (87.00, 132.00) | 100.00 (91.00, 123.00) | 0.583 | ||
| Procedures | ||||||
| Number of diseased arteries (%) | 0.155 | |||||
| 1 | 120 (40.54) | 106 (41.09) | 14 (36.84) | |||
| 2 | 87 (29.39) | 71 (27.52) | 16 (42.11) | |||
| 3 | 89 (30.07) | 81 (31.39) | 8 (21.05) | |||
| Location of culprit lesion (%) | 0.003 | |||||
| LAD | 167 (56.42) | 141 (54.65) | 26 (68.42) | |||
| LCX | 28 (9.46) | 21 (8.14) | 7 (18.42) | |||
| RCA | 101 (34.12) | 96 (37.21) | 5 (13.16) | |||
| Medication | ||||||
| Aspirin | 284 (95.95) | 250 (96.90) | 34 (89.47) | 0.054 | ||
| Clopidogrel/Prasugrel/Ticagrelor | 291 (98.31) | 255 (98.84) | 36 (94.74) | 0.125 | ||
| Statin | 275 (92.91) | 240 (93.02) | 35 (92.11) | 0.740 | ||
| ACE inhibitor/AT1 receptor blocker | 171 (57.77) | 144 (55.81) | 27 (71.05) | 0.076 | ||
| Beta-blocker | 210 (70.95) | 179 (69.38) | 31 (81.58) | 0.122 | ||
| Diuretic | 52 (17.57) | 44 (17.05) | 8 (21.05) | 0.545 | ||
Continuous variables are expressed as median (interquartile range), and categorical variables as n/N (%).
Statistical significance was defined as p
Data are presented as n/N (%) or median (interquartile range).
| Parameter | All participants (n = 296) | No MACE (n = 258) | MACE (n = 38) | p value |
| LAVmin (mL) | 33.16 (26.23, 43.36) | 32.43 (24.96, 41.67) | 41.24 (32.64, 55.22) | |
| LAVmax (mL) | 60.21 (46.51, 75.30) | 58.16 (45.66, 73.35) | 71.61 (51.55, 81.65) | 0.008 |
| LAEF (%) | 50.37 (44.60, 55.30) | 50.61 (45.39, 55.97) | 46.68 (38.42, 51.75) | 0.004 |
| LVEF (%) | 48.06 |
49.47 |
38.49 |
|
| LVEDV (mL) | 126.38 (100.65, 152.09) | 123.00 (97.35, 145.64) | 148.73 (121.72, 174.10) | |
| LVESV (mL) | 64.65 (45.83, 85.77) | 62.70 (44.28, 80.77) | 97.71 (59.12, 121.94) | |
| LVFPcmr (mmHg) | 13.37 (12.16, 14.72) | 13.30 (12.05, 14.51) | 14.57 (13.17, 15.99) | |
| Sex-specific LVFPcmr (mmHg) | 15.04 (12.55, 16.99) | 14.78 (12.45, 16.75) | 16.46 (14.69, 19.45) | |
| SV (mL) | 58.00 (46.18, 70.67) | 58.30 (47.00, 71.00) | 55.05 (42.10, 68.40) | 0.107 |
| CO (L/min) | 4.16 (3.40, 5.10) | 4.18 (3.43, 5.12) | 3.87 (3.29, 5.00) | 0.337 |
| LV MASS (g) | 132.25 (108.50, 153.47) | 129.83 (105.00, 151.34) | 147.48 (123.02, 189.14) | |
| Infarct size (% LV mass) | 29.72 (19.76, 37.74) | 27.68 (18.48, 36.58) | 35.73 (27.56, 48.04) | |
| Extent of MVO (% LV mass) | 1.28 (0.00, 3.81) | 1.09 (0.00, 3.54) | 2.79 (0.50, 8.50) | 0.004 |
| IMH present (%) | 165 (55.74) | 138 (53.49) | 27 (71.05) | 0.042 |
| MVO present (%) | 191 (64.53) | 160 (62.02) | 31 (81.58) | 0.019 |
Continuous variables are expressed as median (interquartile range), and categorical variables as n/N (%).
Statistical significance was defined as p
Compared with the group that did not experience MACE, those with MACE displayed
significantly reduced LVEF (38.49%
The cross-sectional associations between LVFPcmr and chamber
structure/function were explored using Spearman’s rank correlation
(
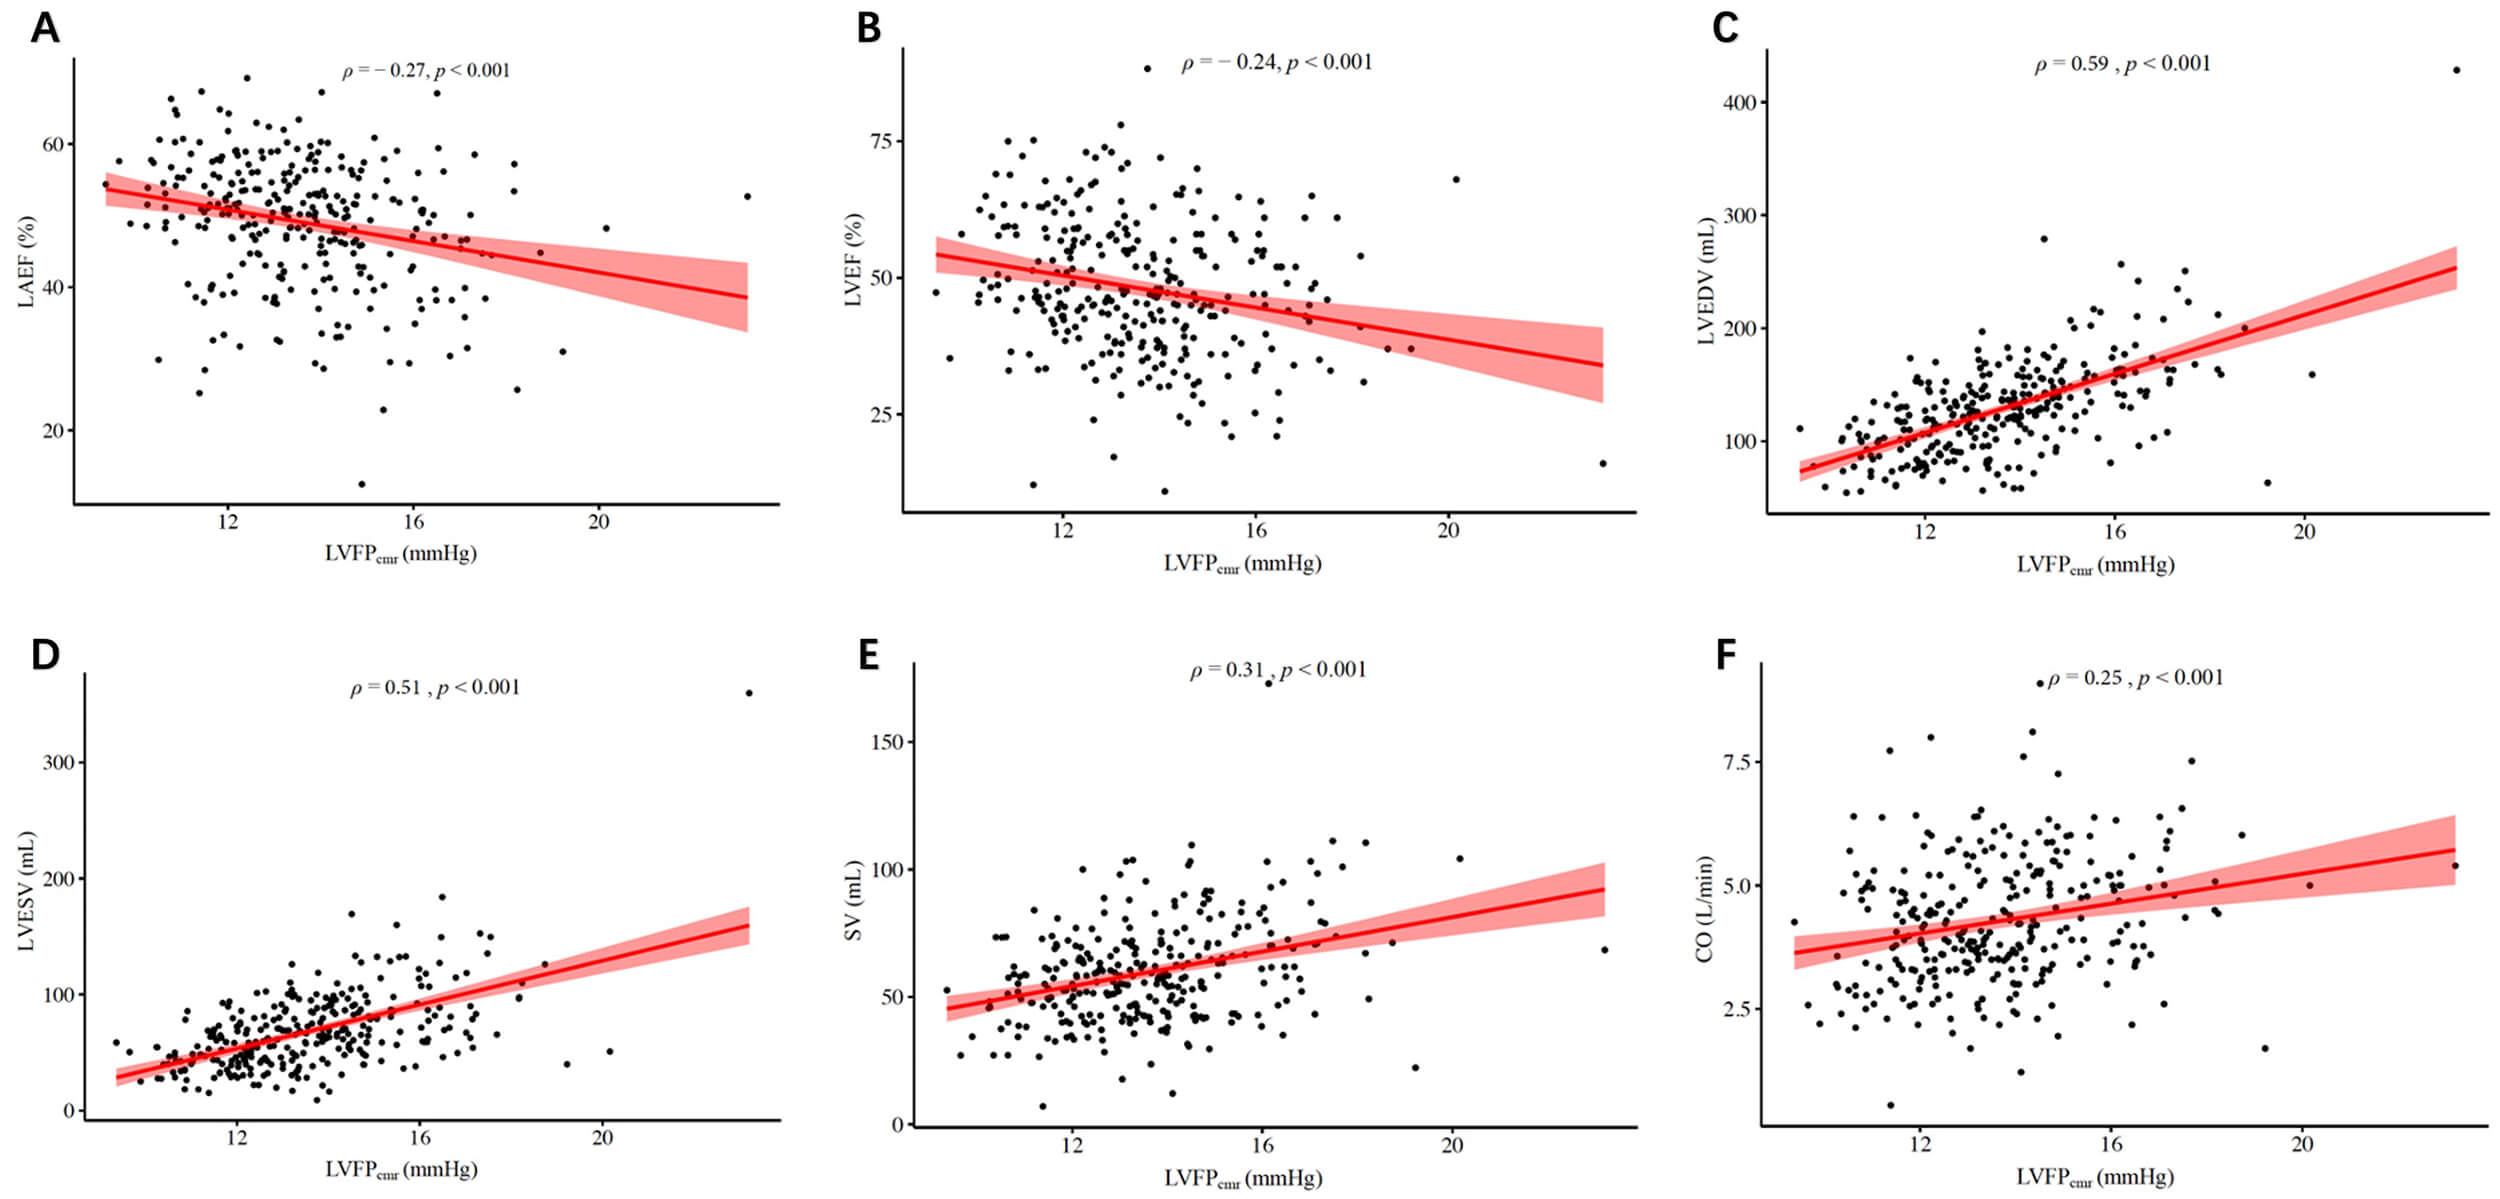 Fig. 2.
Scatter plots showing the correlations between
LVFP𝐜𝐦𝐫 and cardiac structural/functional parameters. (A) LAEF, (B) LVEF,
(C) LVEDV, (D) LVESV, (E) SV, and (F) CO. Spearman’s correlation coefficients
(
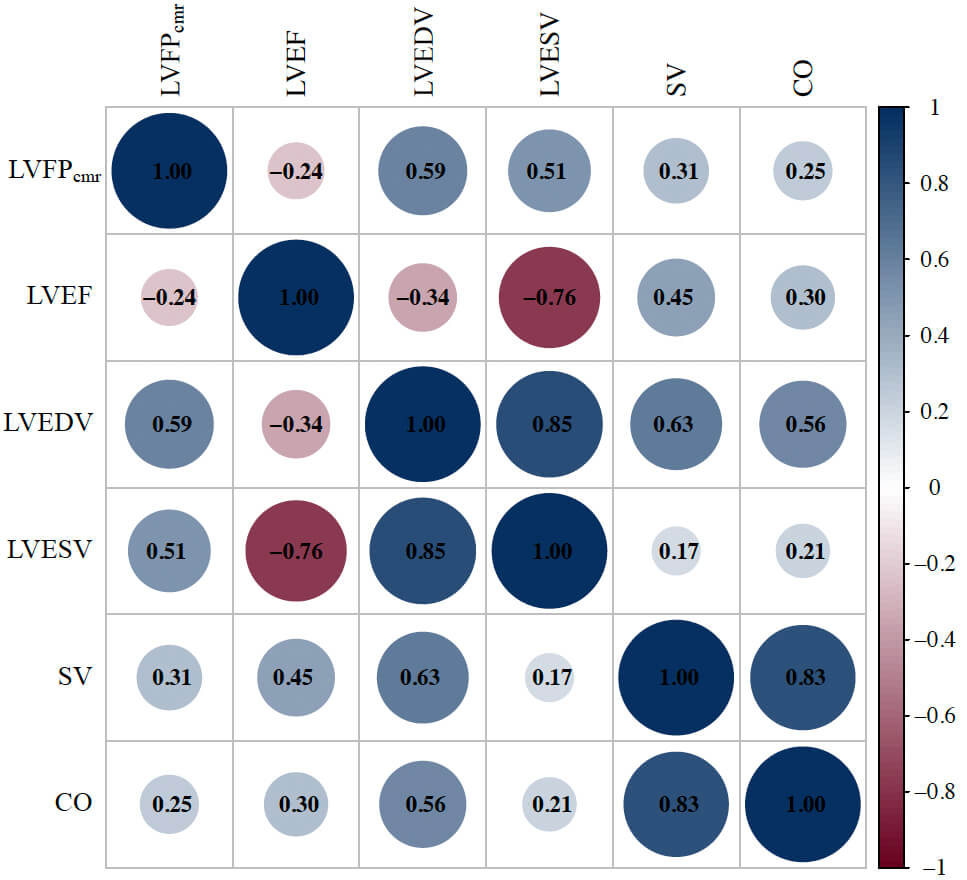 Fig. 3.
Correlation matrix plot of LVFPcmr and key CMR-derived parameters. The correlation matrix displays pairwise Spearman correlation coefficients among LVFPcmr, LVEF, LVEDV, LVESV, SV, and CO. Circle size and color intensity represent the magnitude and direction of the correlation (blue = positive; red = negative).
| Characteristics | LVFPcmr | |
| ρ | p value | |
| LAEF (%) | –0.27 | |
| LVEF (%) | –0.24 | |
| LVEDV (mL) | 0.59 | |
| LVESV (mL) | 0.51 | |
| SV (mL) | 0.31 | |
| CO (L/min) | 0.25 | |
| LV MASS (g) | 0.62 | |
| Infarct size (% LV mass) | 0.15 | 0.008 |
| Extent of MVO (% LV mass) | 0.19 | |
| IMH present (%) | 0.15 | 0.012 |
| MVO present (%) | 0.14 | 0.020 |
Statistical significance was defined as p
The LVFPcmr demonstrated considerable variability within the cohort; the
median LVFPcmr value in the overall cohort was 13.37 mmHg (IQR, 12.16–14.72
mmHg). The AUC of LVFPcmr for MACE was 0.67 (95% CI, 0.58–0.76). Based on
ROC curve analysis, an optimal cutoff of 14.30 mmHg (sensitivity 0.58,
specificity 0.71) was identified to stratify patients into a low-LVFPcmr
group (n = 198) and a high-LVFPcmr group (n = 98). The high-LVFPcmrgroup exhibited a significantly higher incidence of MACE than the
low-LVFPcmr group (22.45% vs. 8.08%, p
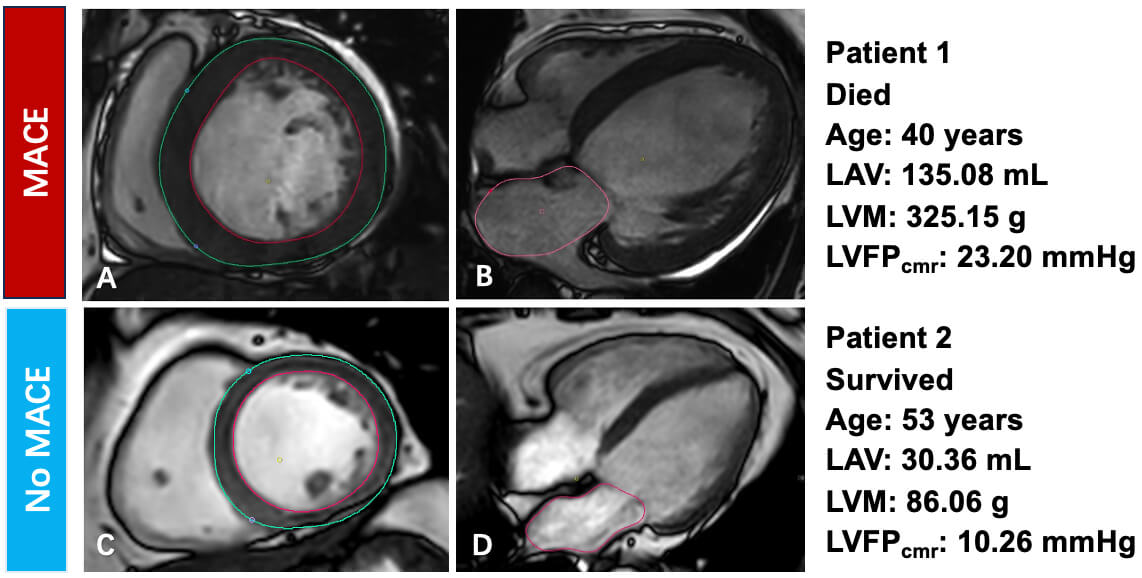 Fig. 4.
Representative CMR findings and their relationship with MACE. (A,B) Patient 1, who died during follow-up (age 40 years). (A) Short-axis end-diastolic cine image with LV endocardial (red) and epicardial (green) contours used to calculate LV mass (LVM 325.15 g). (B) Four-chamber cine image with left-atrial contour (pink) used to calculate left-atrial volume (LAV 135.08 mL). The derived LVFPcmr was 23.20 mmHg. (C,D) Patient 2, who survived (age 53 years). (C) Short-axis cine image with LV mass measurement (LVM 86.06 g). (D) Four-chamber cine image with left-atrial contour for volume assessment (LAV 30.36 mL). The derived LVFPcmr was 10.26 mmHg. LVM, left-ventricular mass.
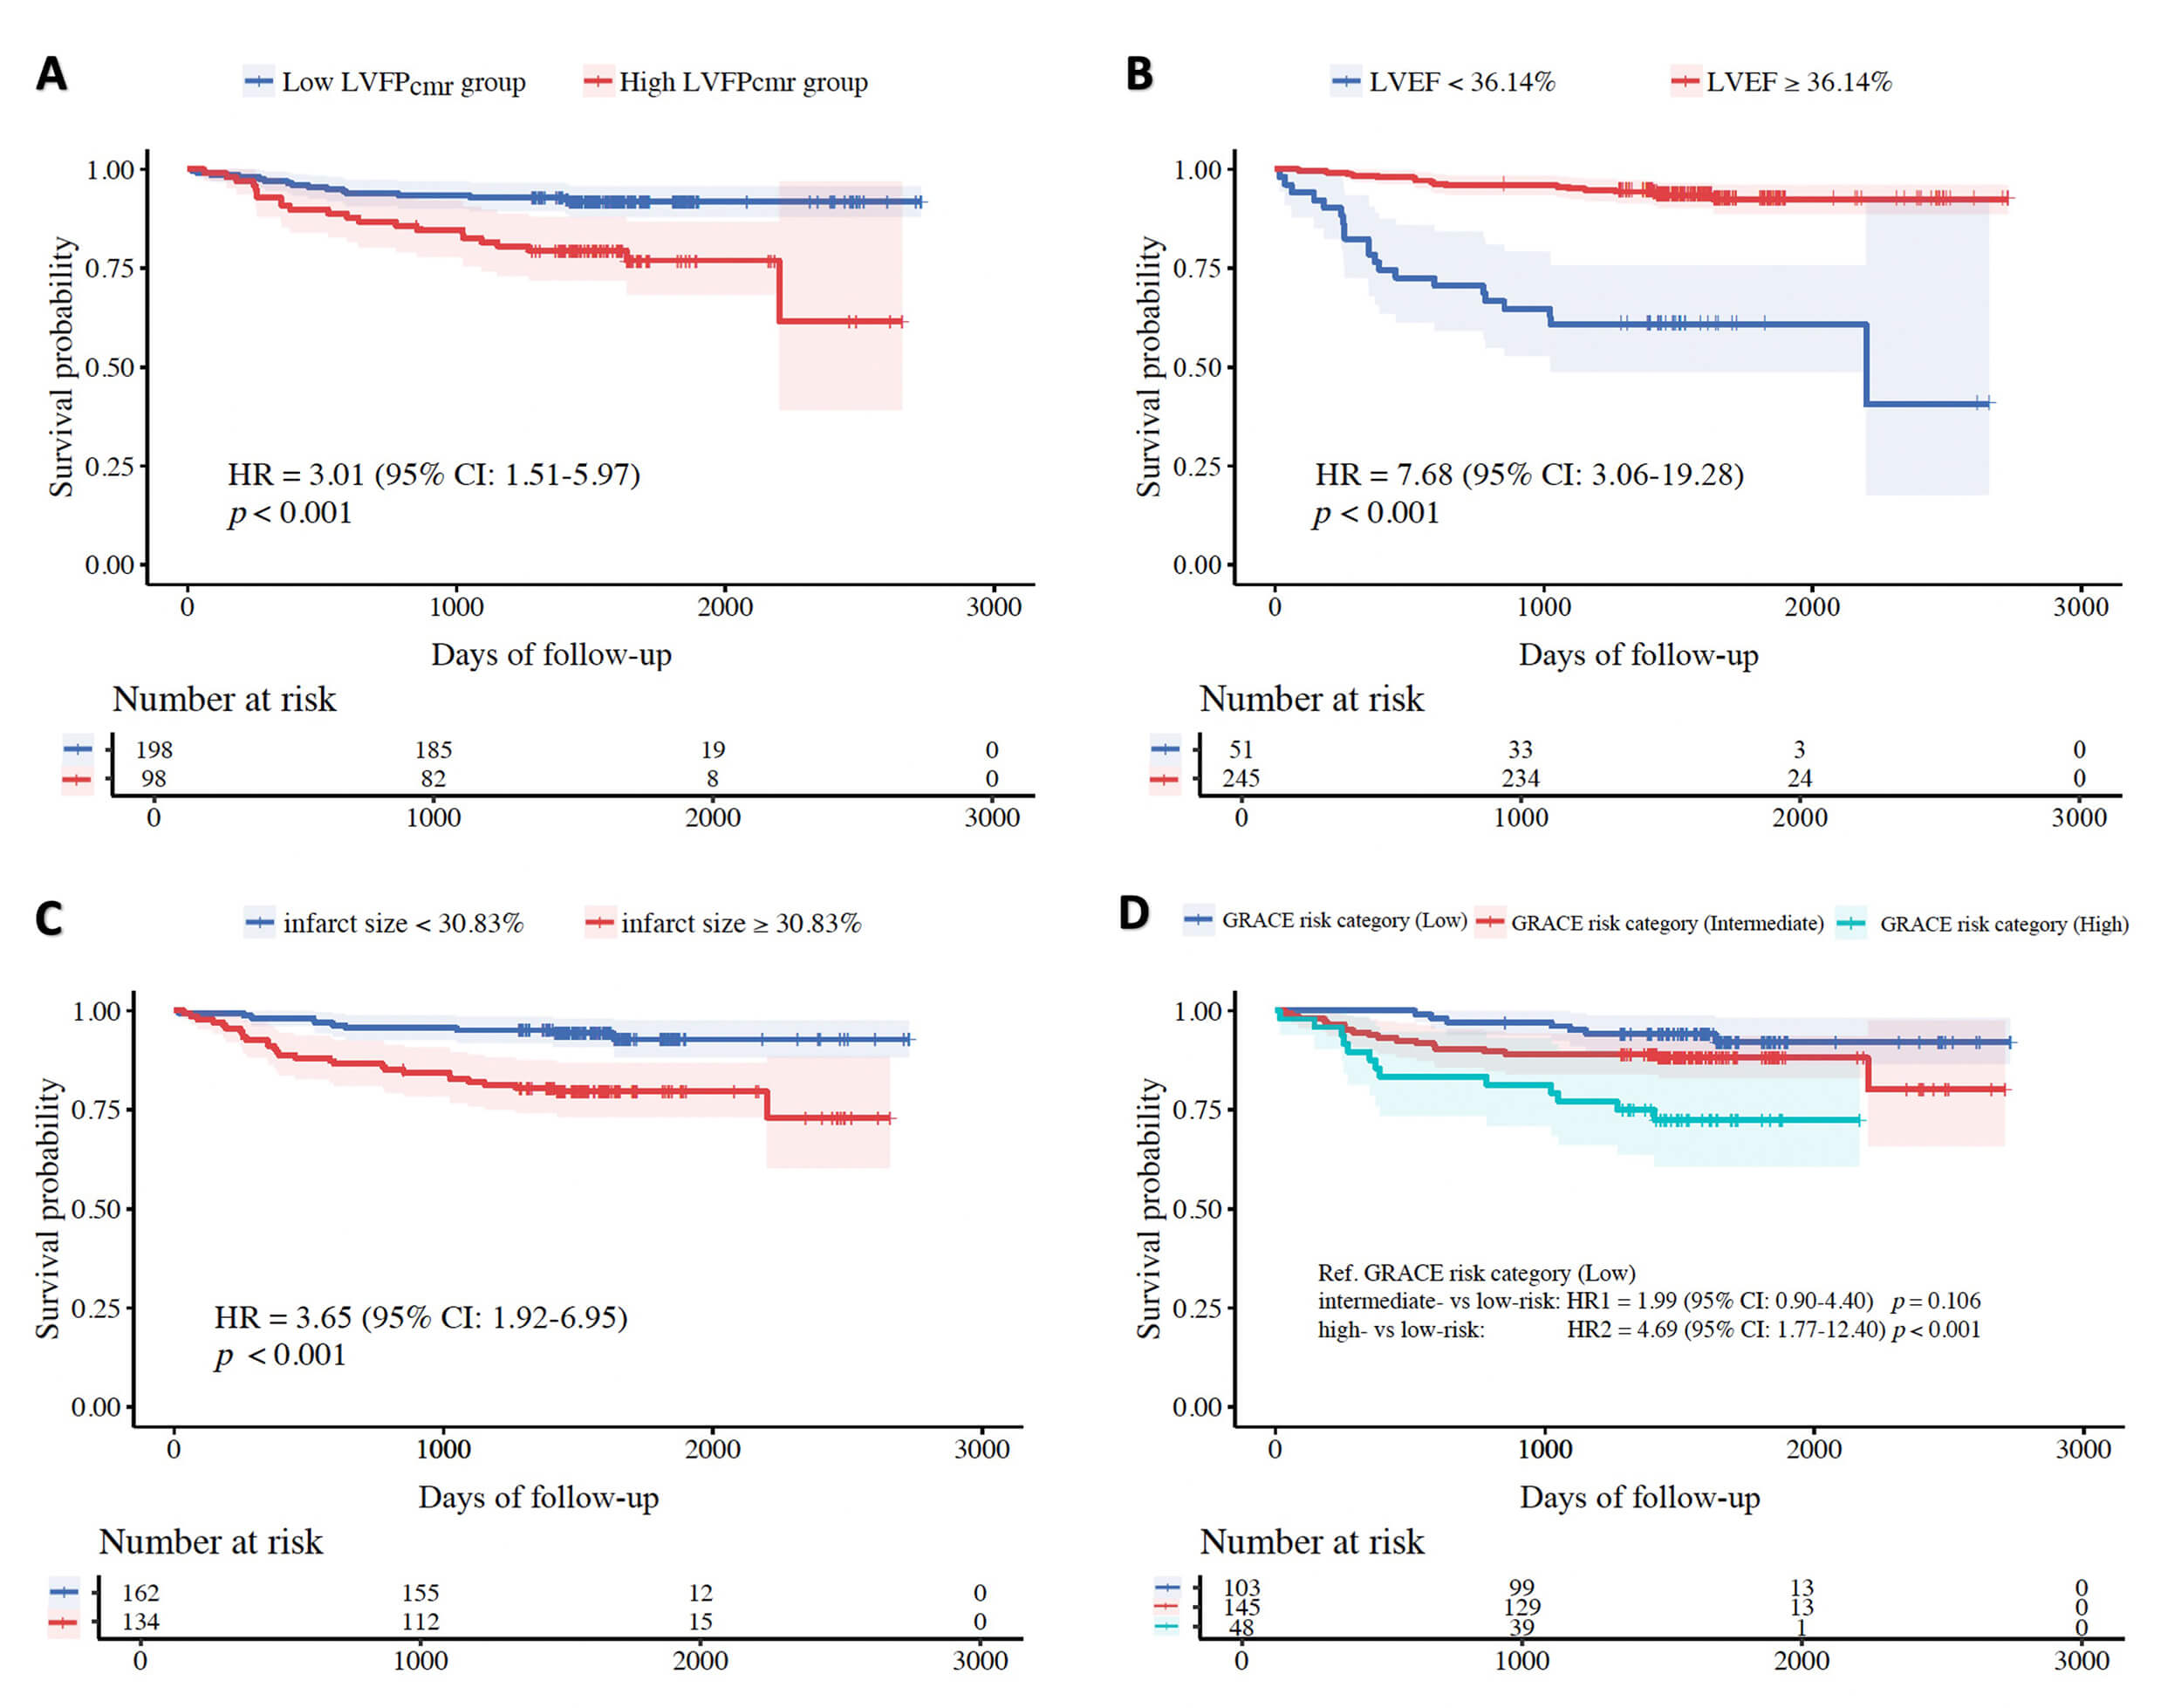 Fig. 5.
Kaplan-Meier curves of MACE-free survival. (A) Stratified
by LVFPcmr (low vs. high using the study cutoff of 14.30 mmHg). (B)
Stratified by LVEF (
In univariable Cox regression, higher LVFPcmr was significantly linked to
MACE (HR, 1.31; 95% CI, 1.14–1.51; p
| Characteristics | Univariate analysis | Multivariate analysis | |||||
| HR | 95% CI | p value | HR | 95% CI | p value | ||
| BNP (pg/mL) | 1.002 | 1.001–1.003 | |||||
| High-sensitivity CRP (mg/L) | 1.04 | 1.01–1.07 | 0.003 | ||||
| Previous/current smoker (%) | 2.23 | 1.02–4.86 | 0.044 | ||||
| GRACE risk category | |||||||
| Low | Ref | Ref | |||||
| Intermediate | 1.99 | 0.83–4.76 | 0.123 | 2.15 | 0.75–4.64 | 0.179 | |
| High | 4.86 | 1.93–12.26 | 4.72 | 1.77–12.19 | 0.001 | ||
| Killip class | |||||||
| I | Ref | ||||||
| II | 2.43 | 1.24–4.78 | 0.010 | ||||
| III | 3.77 | 0.50–28.16 | 0.196 | ||||
| IV | 4.91 | 1.14–21.11 | 0.032 | ||||
| Location of culprit lesion | |||||||
| LAD | Ref | ||||||
| LCX | 1.75 | 0.76–4.04 | 0.192 | ||||
| RCA | 0.31 | 0.12–0.81 | 0.017 | ||||
| Location anterior (%) | 1.96 | 1.01–3.82 | 0.047 | ||||
| IMH (%) | 2.06 | 1.02–4.16 | 0.043 | ||||
| Infarct size (% LV mass) | 1.05 | 1.03–1.08 | 1.03 | 1.01–1.05 | 0.017 | ||
| MVO (% LV mass) | 1.05 | 1.01–1.09 | 0.006 | ||||
| LVFPcmr (mmHg) | 1.31 | 1.14–1.51 | 1.25 | 1.07–1.46 | 0.005 | ||
| Sex-specific LVFPcmr (mmHg) | 1.18 | 1.09–1.29 | |||||
| LAEF (%) | 0.95 | 0.92–0.98 | 0.001 | ||||
| LVEF (%) | 0.93 | 0.90–0.95 | 0.96 | 0.93–0.99 | 0.017 | ||
Statistical significance was defined as p
In the hierarchical composite analysis, the high-LVFPcmr group displayed significantly worse outcomes than the low-LVFPcmr group. The WR was 0.35 (95% CI, 0.33–0.37), signifying that patients with elevated LVFPcmr experienced more severe adverse events earlier and more frequently. These results highlight the prognostic significance of LVFPcmr beyond time-to-first-event analysis.
The sex-specific LVFPcmr equation showed that higher sex-specific
LVFPcmr was associated with increased risk of MACE in univariable analysis
(HR, 1.18; 95% CI, 1.09–1.29; p
| Characteristics | Multivariate analysis | |||
| HR | 95% CI | p value | ||
| GRACE risk category | ||||
| Low | Ref | |||
| Intermediate | 2.27 | 0.92–5.58 | 0.076 | |
| High | 5.43 | 2.07–14.25 | ||
| Location of culprit lesion | ||||
| LAD | Ref | |||
| LCX | 2.84 | 1.15–7.00 | 0.024 | |
| RCA | 0.55 | 0.20–1.54 | 0.256 | |
| Infarct size (% LV mass) | 1.03 | 1.00–1.05 | 0.020 | |
| Sex-specific LVFPcmr (mmHg) | 1.17 | 1.07–1.28 | ||
| LVEF (%) | 0.96 | 0.93–0.99 | 0.005 | |
Statistical significance was defined as p
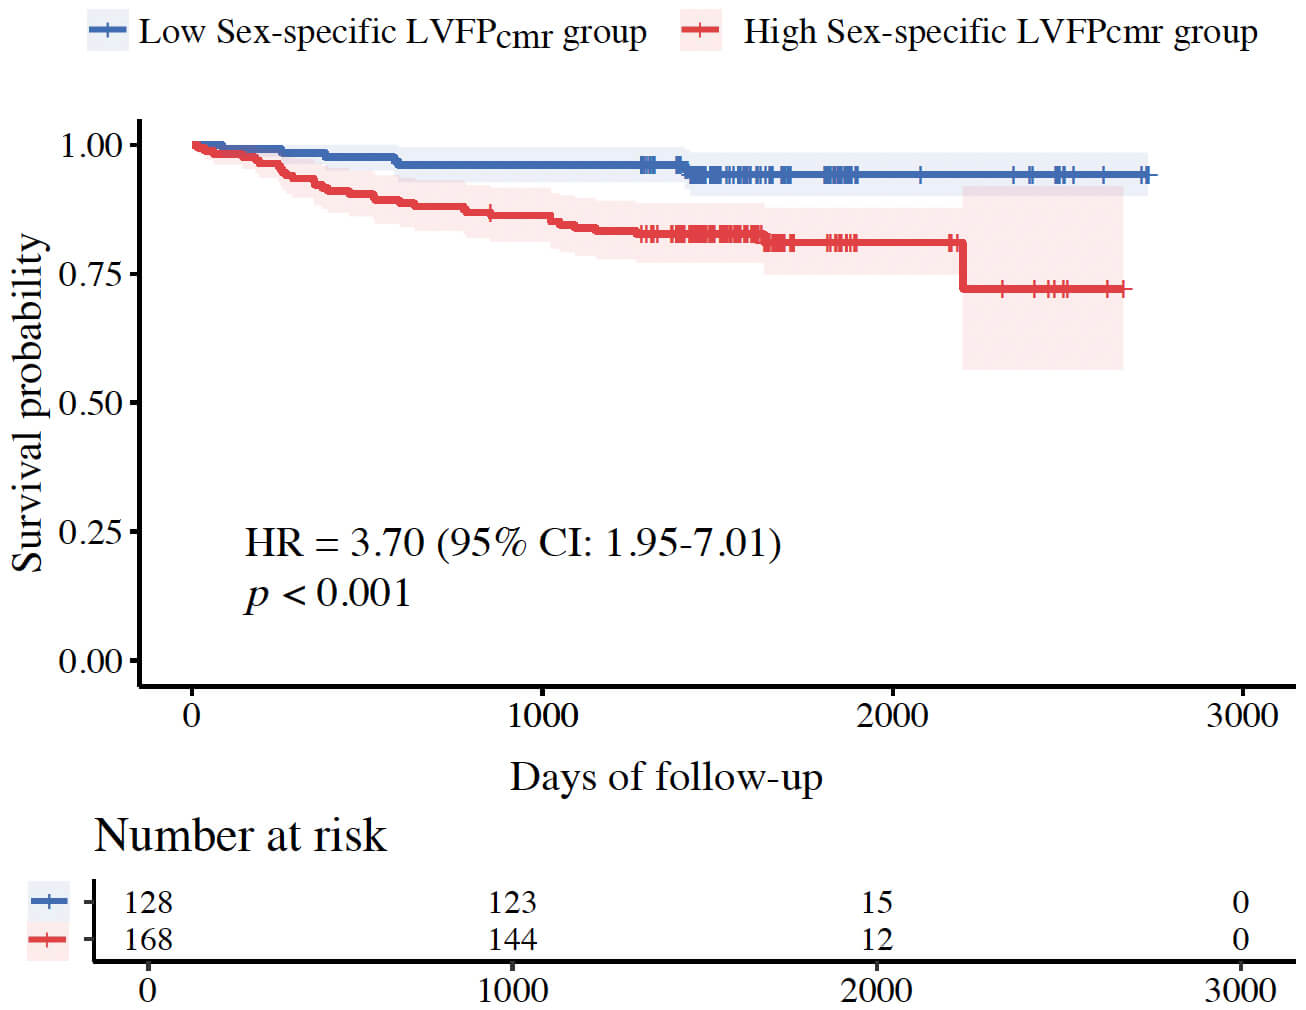 Fig. 6.
Kaplan-Meier survival curves stratified by sex-specific LVFPcmr.
This study on patients undergoing CMR after ASTEMI and PCI demonstrated that the novel CMR-derived estimation of LVFP is an independent predictor of MACE, even after adjusting for established risk factors, including LVEF and infarct size. The multivariable model incorporating LVFPcmr exhibited a strong discriminative ability (C-index = 0.767) for predicting MACE, emphasizing the potential utility of this noninvasive hemodynamic parameter in post-AMI risk stratification. Furthermore, the WR analysis revealed that elevated LVFPcmr was associated not only with a higher incidence of adverse events but also with an earlier occurrence of more clinically severe outcomes, providing a severity-weighted validation of its prognostic significance.
In an earlier study, Garg et al. [18] proposed and validated the use of CMR-derived pulmonary capillary wedge pressure in patients with AMI, establishing its hemodynamic relevance and associations with adverse remodeling phenotypes derived from routine cine imaging. However, their study focused on cross-sectional associations with ventricular remodeling or filling-pressure surrogates, rather than on long-term clinical outcomes. The present study extends this line of evidence by showing that LVFPcmr independently predicts MACE after primary PCI, even after adjusting for conventional risk factors, LVEF, and infarct size. Hence, this research bridges the gap between physiological plausibility and prognostic validation, confirming that LVFPcmr is a clinically meaningful biomarker for post-AMI risk stratification.
The pathophysiological mechanisms underlying elevated LVFP following AMI provide
a plausible explanation for its prognostic significance. Myocardial infarction
often results in left-ventricular remodeling, marked by myocardial fibrosis,
increased ventricular stiffness, and impaired relaxation, collectively
contributing to diastolic dysfunction and elevated filling pressures. As
structural correlates of cardiac remodeling, LAV and LVM are directly influenced
by hemodynamic stress and are crucial determinants of LVFP [19, 20]. In our
cohort, LVFPcmr exhibited a weak yet statistically significant correlation
with infarct size (
Echocardiography is currently the primary and most extensively utilized noninvasive modality for evaluating left-ventricular function post-AMI. Its advantages include broad availability, bedside applicability, and the capacity to simultaneously provide crucial information on LVEF, valvular disease, and other structural abnormalities [23]. The use of Doppler parameters, especially mitral inflow velocities (E and A waves), mitral annular tissue Doppler velocity (e′), left-atrial volume index (LAVi), and tricuspid regurgitation (TR) velocity, integrated within current guideline-recommended multiparameter algorithms, enables a reasonably accurate estimation of LVFP in a large proportion of patients [22, 23]. Particularly, the E/e′ ratio has been shown to be a potent predictor of all-cause mortality early after AMI, offering prognostic value independent of, and potentially superior to, LVEF and conventional clinical risk assessment [24]. In contemporary STEMI cohorts with preserved LVEF after primary PCI, a high discharge E/e′—and persistently elevated E/e′ at 1-year—also identifies patients at increased long-term risk [25]. These findings agree with additional STEMI data demonstrating that elevated E/e′ independently predicts long-term adverse outcomes after primary PCI [26]. In addition, a multicenter study by Andersen et al. [22] validated the comprehensive echocardiographic approach based on the 2016 guidelines, reporting an accuracy of up to 87% in identifying elevated LVFP compared with invasive measurements, considerably outperforming clinical assessment alone.
Nonetheless, despite significant advancements, echocardiographic estimation of LVFP in patients with AMI continues to face certain limitations. First, image quality and Doppler signal acquisition rely on patient habitus, pulmonary conditions (which may be relevant in the acute phase with pulmonary edema or mechanical ventilation), and operator expertise [23]. Second, the interpretation of specific parameters can be confounded; for instance, E/e′ may be unreliable when significant mitral annular calcification, valvular disease, left bundle branch block, or paced rhythm is present. LAVi is less informative in atrial fibrillation [23]. Third, even when adhering to guideline algorithms, LVFP status remains “indeterminate” in a nonnegligible proportion of patients, limiting its decisional value in all individuals [22, 23]. Lastly, reported accuracies can vary between studies and real-world practice, potentially influenced by population selection and operator adherence to protocol [23].
Considering the acknowledged limitations of echocardiography in assessing LVFP,
CMR presents clear advantages. It delivers highly reproducible, quantitative
assessments of cardiac volumes and mass, which are largely unaffected by acoustic
window quality and exhibit lower interoperator variability than Doppler
techniques [27]. Recent advances in CMR techniques have extended its use in
assessing AMI. Contemporary studies have shown that quantitative CMR
markers—such as myocardial strain and four-dimensional (4D) flow—provide
prognostic information that surpasses conventional measures, including LVEF and
infarct size, highlighting the need for comprehensive functional evaluation in
patients with AMI [12, 28]. Compared with these parameters, LVFPcmr provides
a uniquely accessible surrogate of diastolic loading conditions derived from
routine cine images, enabling integration into standard CMR workflows without
additional scan time. Compared with other noninvasive approaches, head-to-head
evidence indicates that LVFPcmr can outperform guideline-based TTE
algorithms in categorizing elevated filling pressures and can reclassify a
substantial proportion of indeterminate or incorrectly classified TTE cases.
Importantly, prognostic utility was also noted in follow-up [15]. In addition, in
a multimodal heart failure assessment, LVFPcmr showed better diagnostic
performance than the echocardiographic E/e′ ratio in identifying patients
with elevated NT-proBNP, thereby supporting the construct validity of
LVFPcmr against an external biochemical standard. Together, these data
establish LVFPcmr as a useful and complementary hemodynamic marker that can
improve decision-making, especially when Doppler signals are suboptimal or
echocardiographic algorithms produce indeterminate results. Head-to-head
comparisons have further established higher analyzability and substantially lower
interobserver variability for CMR-derived chamber metrics compared with 2D
echocardiography [29]. The specific noninvasive LVFPcmr estimation technique
used in this research, developed by Garg et al. [15], leverages these
strengths by utilizing LAV and LVM—parameters robustly measured using
CMR—integrated into a linear regression model (LVFPcmr = 6.1352 + (0.07204
However, despite these benefits, estimating LVFPcmr has certain inherent limitations. Although the model demonstrated a reasonable correlation (r = 0.55) with invasive PCWP and achieved good diagnostic accuracy (76%), its R2 value of 0.31 shows that LAV and LVM only partly account for the variability in PCWP. Additionally, some proportional bias was observed, which could restrict the accuracy of absolute pressure estimates across the entire range [15]. Furthermore, this specific model does not include advanced CMR metrics (such as tissue characterization or 4D flow) that could improve accuracy, nor can it detect beat-to-beat hemodynamic fluctuations measurable with Doppler. However, given its strengths in reproducibility and integration into a comprehensive assessment, LVFPcmr remains a valuable alternative or complementary method for noninvasive hemodynamic evaluation after AMI, especially when echocardiography is technically difficult or inconclusive. To further test the robustness of the results, a sex-specific sub-analysis was performed using a recently proposed sex-adjusted LVFPcmr equation. The sex-specific model exhibited prognostic behavior very similar to the generic LVFPcmr, staying independently linked to MACE and offering comparable discrimination and risk stratification in survival analysis. These findings suggest that while including sex in the equation may enhance physiological accuracy, it does not significantly alter prognostic performance. This observation confirms the reliability of LVFPcmr as a meaningful clinical marker across both sexes in the context of ASTEMI. A visual summary of the key clinical scenarios in which CMR-derived PCWP may provide added value is presented in Fig. 7.
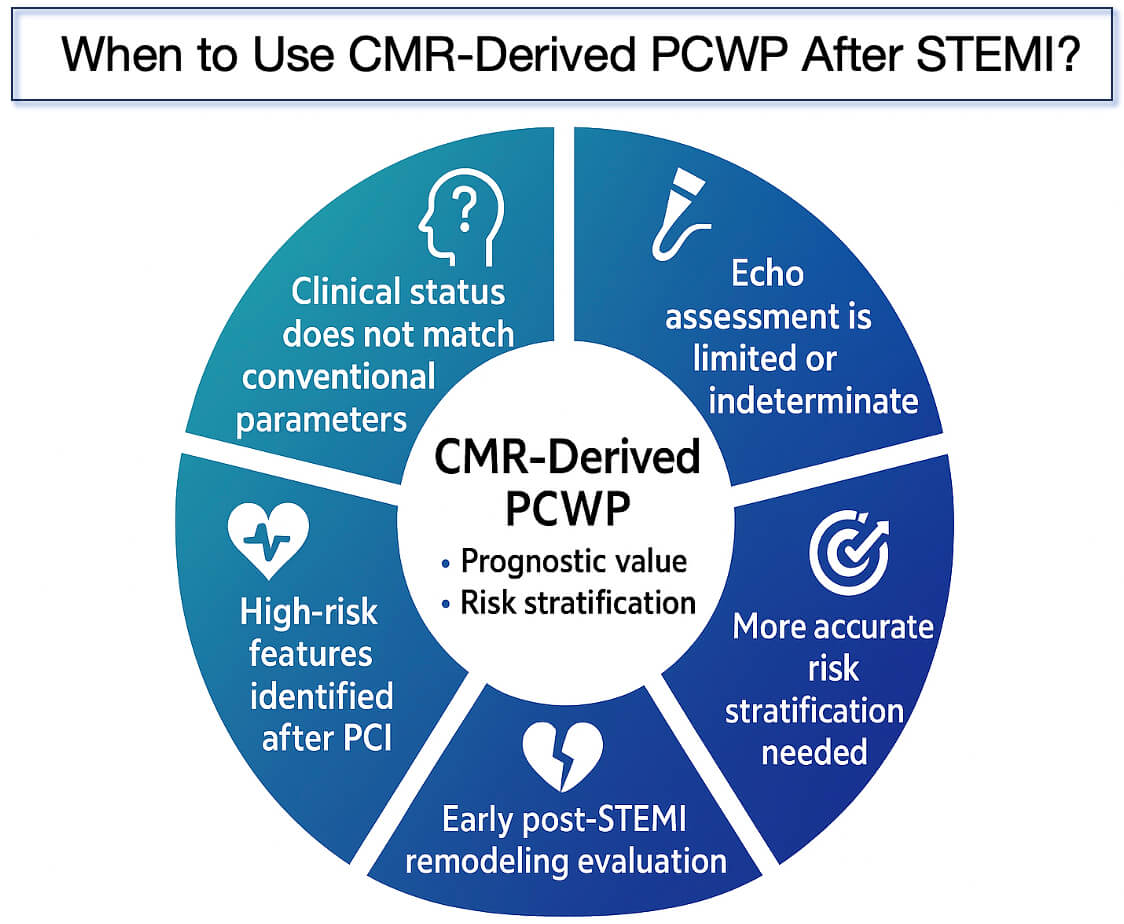 Fig. 7.
Clinical scenarios in which CMR-derived PCWP may provide added value after STEMI. This figure summarizes the major clinical situations where CMR-derived pulmonary capillary wedge pressure (PCWP) may support prognostic evaluation and risk stratification following STEMI, including discordant clinical status, limited or indeterminate echocardiographic assessment, the need for more accurate risk stratification, early post-STEMI remodeling evaluation, and identification of high-risk features after PCI. PCWP, pulmonary capillary wedge pressure; PCI, percutaneous coronary intervention; CMR, cardiovascular magnetic resonance.
However, our study has certain limitations that should be acknowledged. Our findings, from a retrospective single-center study, are subject to inherent selection and information biases. Patient inclusion was limited to those who underwent clinically indicated CMR after PCI, which might have introduced referral bias toward more stable or evaluable cases. Additionally, the small sample size and limited number of outcome events could have led to model overfitting and decreased statistical robustness. Consequently, the discriminative ability and robustness of our multivariable models should be validated in larger, multicenter prospective studies. Furthermore, this study did not incorporate emerging CMR parameters such as myocardial strain, native T1/T2 mapping, or extracellular volume. Therefore, whether these advanced tissue characterization metrics add incremental prognostic value beyond LVFPcmr could not be assessed, and their mechanistic relevance could not be explored. Future research should incorporate multicenter recruitment with standardized CMR acquisition and postprocessing protocols to minimize institutional bias and enable robust external validation of the prognostic value of LVFPcmr.
In this study, a detailed prognostic assessment of post-ASTEMI patients who underwent CMR was conducted, combining conventional clinical parameters with CMR-derived measures, including LVFPcmr. The findings established that elevated LVFPcmr was associated with unfavorable outcomes and served as an independent marker for risk stratification. The proposed LVFPcmr metric could be incorporated into post-PCI risk assessment protocols, particularly in patients undergoing early CMR. Its noninvasive estimation allows for routine integration without additional scan time, potentially guiding follow-up intensity and the selection of adjunctive therapy. In clinical practice, an elevated LVFPcmr value may help identify patients who require intensified follow-up, closer monitoring for heart failure progression, or optimization of guideline-directed medical therapy. These findings provide a preliminary framework to identify high-risk post-ASTEMI patients and may inform future studies on surveillance strategies and targeted interventions.
The findings from this study suggest that LVFPcmr, estimated using a model based on LAV and LVM, is a new and independent predictor of MACE in patients recovering from ASTEMI. While these results may aid in clinical risk assessment, they should be interpreted with caution due to the relatively small sample size and the study’s retrospective, single-center design. Larger, prospective, multicenter studies are necessary to validate these findings.
The datasets generated and analyzed during the current study are not publicly available due to patient privacy and institutional regulations but are available from the corresponding author upon reasonable request.
WBL contributed to study design, data interpretation, and drafting of the manuscript. KRB conducted data collection and statistical analysis. ZZ prepared the figures and assisted in data interpretation. YFG contributed to data collection. SL and YR performed data processing and image analysis. HW and LX conceived and designed the study, supervised the project, and critically revised the manuscript. All authors contributed to editorial changes in the manuscript. All authors read and approved the final manuscript. All authors have participated sufficiently in the work and agreed to be accountable for all aspects of the work.
This study was approved by the Ethics Committee of Beijing Anzhen Hospital, Capital Medical University (Approval No. KS2024015). Written informed consent was obtained from all participants prior to inclusion in the study, in accordance with the Declaration of Helsinki. All patient data were anonymized before analysis, and access to identifiable information was restricted to authorized investigators to ensure confidentiality and compliance with institutional data protection policies.
We sincerely thank Dr. Hongkai Zhang from the Department of Radiology, Beijing Anzhen Hospital, Capital Medical University, for his professional guidance and valuable suggestions throughout the study.
This research was funded by the National Key R&D Program of China (2022YFE0209800), the National Natural Science Foundation of China (82271986, 82471937), the Beijing Natural Science Foundation (L246062), and the Beijing Anzhen Hospital High Level Research Funding (2024AZC2002).
The authors declare no conflicts of interest.
During the preparation of this work, the authors used ChatGPT-4 to check spelling and grammar. After using this tool, the authors reviewed and edited the content as needed and take full responsibility for the publication’s content.
References
Publisher’s Note: IMR Press stays neutral with regard to jurisdictional claims in published maps and institutional affiliations.