
 , Xingrui Liu 1, Lei Yang 1, Yang Zhang 2, Yongju Yang 1, Shiying Tang 1, Xinyan Zhou 1, Xirui Duan 1, Na Tan 1, Shuaiyan Zuo 1, Fei Liu 1, Yan Xu 1, Caiyan Zhu 1, Lishi Shao 1, Guifang Sun 1,*
1 Department of Radiology, Kunming Yan’an Hospital (Yan’an Hospital Affiliated to Kunming Medical University), 650051 Kunming, Yunnan, China
2 Department of Vascular Surgery, Fuwai Yunnan Hospital Chinese Academy of Medical Sciences, 650032 Kunming, Yunnan, China
Abstract
Pericoronary adipose tissue (PCAT) is an established imaging biomarker of coronary inflammation; however, the influence of low-density lipoprotein cholesterol (LDL-C) remains unclear. This study aimed to explore the associations between PCAT and LDL-C using coronary computed tomography angiography (CCTA)-based radiomics.
This retrospective study stratified 150 patients undergoing CCTA into two groups according to serum LDL-C levels (≥3.4 mmol/L vs. <3.4 mmol/L). A total of 288 radiomic features were extracted from the PCAT surrounding the left anterior descending artery, left circumflex artery, and right coronary artery. After the initial filtering using the Wilcoxon rank-sum test, univariate logistic regression and Pearson correlation analyses were applied to identify features associated with elevated LDL-C levels. Key features were further validated using a gradient boosting machine (GBM) ensemble model combined with Shapley Additive Explanations (SHAP) analysis.
A total of 11 radiomic features were significantly associated with elevated LDL-C levels (p < 0.05), including both first-order and texture-based features. Mantel correlation analysis revealed that the gray level size zone matrix (GLSZM)-derived feature, GLSZM.LCXLargeAreaHighGrayLevelEmphasis, demonstrated the strongest association (Mantel's r ≈ 0.15; p < 0.01). The GBM model achieved the best performance, with an area under the receiver operating characteristic curve (AUROC) of 0.889 in the training set and 0.724 in an internal hold-out test set. SHAP analysis identified first-order energy and large-area high gray-level features as the most important contributors to the discrimination of high LDL-C status.
Elevated LDL-C levels are significantly associated with increased spatial heterogeneity and high gray-level clustering in PCAT, thereby providing imaging-based evidence supporting the association between LDL-C and PCAT.
Graphical Abstract
Keywords
- radiomics
- computed tomography angiography
- epicardial adipose tissue
- cholesterol
- LDL
- coronary artery disease
In the routine evaluation of atherosclerosis, patients typically undergo both lipid profiling, including measurement of low-density lipoprotein cholesterol (LDL-C), and coronary computed tomography angiography (CCTA). Clinically, elevated LDL-C is often accompanied by CCTA abnormalities such as non-calcified plaques, high-risk plaques, and changes in pericoronary adipose tissue (PCAT) attenuation [1, 2, 3]. In some patients, LDL-C elevation coincides with reduced PCAT attenuation, which may represent different stages of the same pathological process. However, the patient-level relationship between LDL-C and PCAT phenotype has not been systematically quantified, and existing evidence has rarely moved beyond qualitative observations or single-parameter imaging summaries.
Evidence-based research has established low-density lipoprotein (LDL) as a
causal factor in atherosclerotic cardiovascular disease (ASCVD) [3, 4] and has
demonstrated a dose-dependent, log-linear relationship between cumulative LDL-C
exposure and cardiovascular event risk, with longer exposure associated with
greater risk [5, 6]. Recent clinical evidence further suggests that statin
therapy is associated with a reduction in PCAT lesion attenuation, whereas no
significant changes are observed in the absence of statin treatment [7, 8].
After adjustment for cardiovascular risk factors, changes in LDL-C are
independently associated with the percentage change in PCAT lesions. In a cohort
of 180 patients with chest pain and intermediate risk of coronary artery disease
[9],
Whether LDL-C is associated with more complex PCAT microstructural signatures (e.g., spatial heterogeneity and texture patterns) on CCTA remains unclear.
Although previous studies have established PCAT as an imaging biomarker of coronary inflammation [10, 11], capable of improving coronary heart disease risk stratification and independently associated with adverse cardiovascular events [12, 13, 14], a single HU value alone cannot fully capture the complex alterations in adipose tissue microstructure and metabolic inflammation. Radiomics, through high-precision segmentation and computational algorithms [15, 16], can automatically extract multidimensional features from CCTA images, including first-order statistics, texture, and higher-order filtered features, thereby capturing tissue characteristics at multiple spatial scales [17]. Applying radiomics to PCAT enables in-depth characterization of its microstructural patterns, thereby overcoming the limitations of reliance on a single HU value [18].
Despite these observations, key gaps remain: the patient-level association between LDL-C and PCAT has rarely been quantified beyond mean attenuation, and informative PCAT radiomic signatures related to elevated LDL-C have not been systematically evaluated. To address these gaps, we (1) quantified multidimensional PCAT radiomic features on routine CCTA; (2) identified key features associated with elevated LDL-C using an internal training/hold-out evaluation strategy; and (3) applied Shapley additive explanations (SHAP)-based interpretation to improve model interpretability.
Based on these considerations, the aim of this study was to extract and select PCAT radiomic features from CCTA images of patients with varying lipid levels and to systematically assess their correlation with elevated LDL-C levels, identify key features most closely associated with LDL-C levels, and explore their potential value in elucidating the mechanisms of LDL-C–related coronary inflammation, thereby providing evidence to support the precise clinical evaluation and management of LDL-C–related cardiovascular risk.
This retrospective study included 150 adult patients (
CCTA examinations were performed using a dual-source system (SOMATOM Definition Flash; Siemens Healthineers, Forchheim, Germany). Depending on patient condition and heart rate, data were obtained using prospective electrocardiography (ECG)-triggered or retrospective ECG-gated techniques. Immediately before image acquisition, sublingual nitroglycerin (0.5 mg) was administered to all participants. Contrast enhancement was achieved using iodixanol (320 mg I/mL; No. H20113465, Beijing Beilu Pharmaceutical Co., Ltd., Beijing, China), delivered with a dual-head injector (Bayer; Stellant D-CE, REF: 84723223, Leverkusen, Germany) in three phases: 60 mL at 5 mL/s, then 30 mL of a 30% contrast/70% saline mixture, then a 30 mL saline chaser. Bolus tracking was performed in the ascending aorta, and scanning was triggered 4 s after peak enhancement. Typical parameters included a tube potential of 80–100 kVp, an effective tube current of 500 mA, a reconstructed slice thickness of 0.5 mm, and a gantry rotation time of 0.28 s. Images were reconstructed using a standard cardiac kernel and processed on a dedicated workstation (syngo.via, version 8.13; Siemens Healthineers, Forchheim, Germany) for multiplanar reformation and maximum intensity projection. All images were acquired at a single center using the same scanner and following a standardized acquisition and reconstruction protocol.
All CCTA images were independently evaluated by two radiologists with 10 years
of clinical experience, using a 4-point Likert scoring system [20]: 1 point
(poor): severe image noise with blurred vascular borders, rendering the images
unsuitable for analysis; 2 points (fair): noticeable noise but acceptable
contrast and resolution, with identifiable vascular contours; 3 points (good):
minimal noise interference, high contrast and resolution, with clear vascular
margins; 4 points (excellent): no image noise, sharply defined vessel walls, and
excellent image resolution. After independent scoring, any discrepancies were
resolved by consensus through joint review. Images rated as 1 point were excluded
because of suboptimal quality. Only CCTA images with a score of
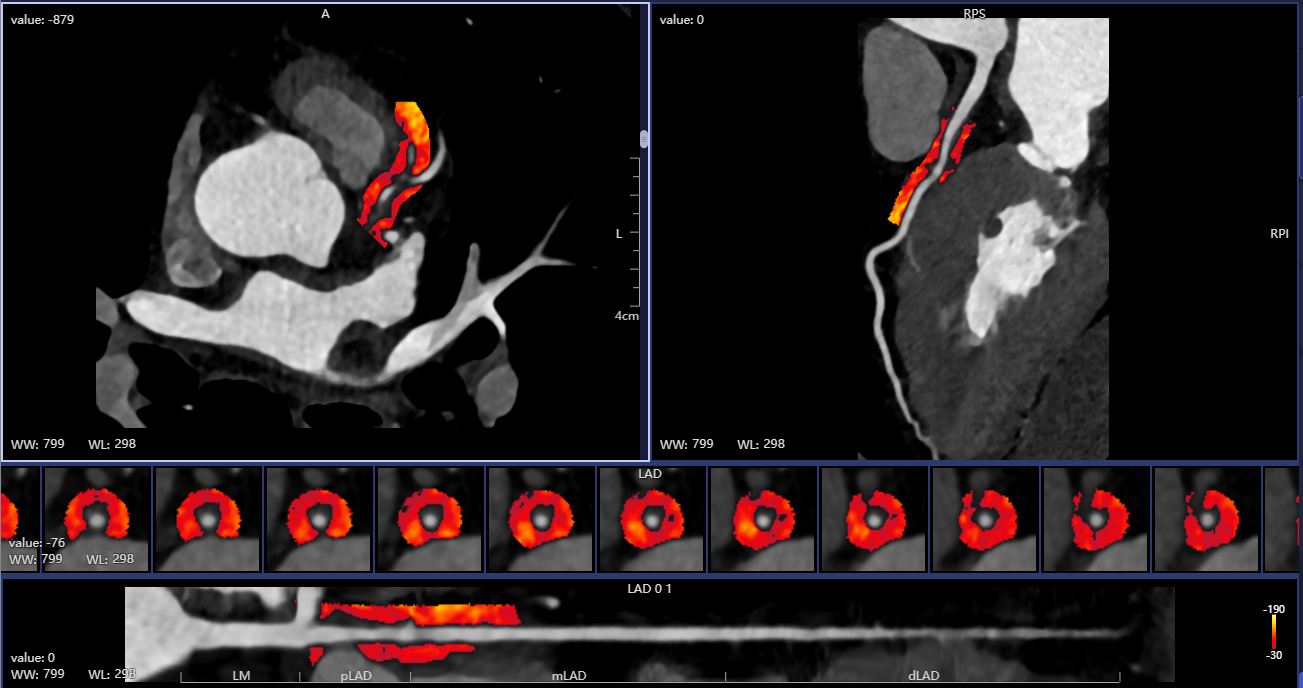
PCAT was delineated as voxels located within 3 mm of the external coronary vessel boundary and restricted to attenuation values between –190 and –30 HU [10]. The regions of interest (ROIs) were segmented along the proximal 10–50 mm of the main coronary arteries, including the LAD, LCX, and RCA [21, 22]. All PCAT segmentations and voxel extractions were automatically performed using an AI-assisted software platform (CoronaryDoc, version 1.0; Shukun Technology Co., Ltd., Beijing, China), which employed deep learning algorithms to identify perivascular fat and extract voxel data from predefined ROIs (Fig. 1).
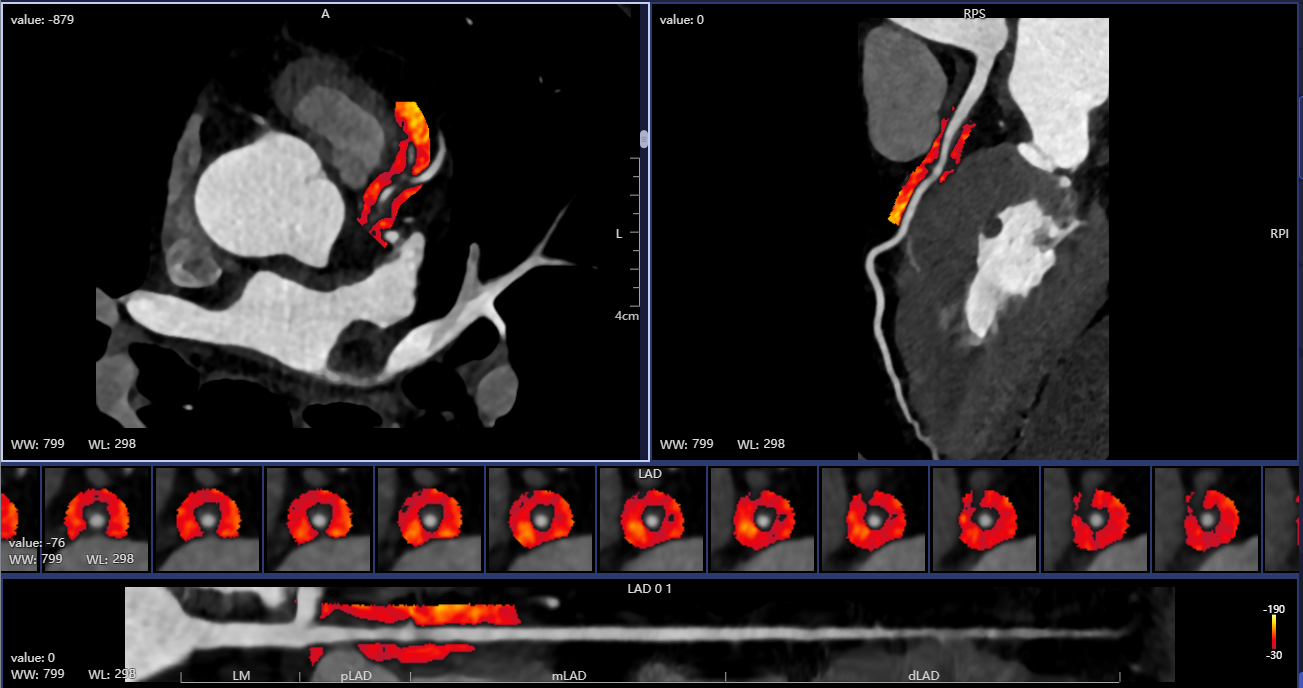 Fig. 1.
Automatic drawing of pericoronary adipose tissue (PCAT). LAD, left anterior descending artery; WW, window width; WL, window level; LM, left main; pLAD, proximal Left Anterior Descending; mLAD, mid Left Anterior Descending; dLAD, distal Left Anterior Descending.
Radiomic features were extracted from each ROI using PyRadiomics (version 3.0; open-source Python package, Boston, MA, USA) embedded within the CoronaryDoc platform. A total of 288 features were obtained, including first-order statistics, shape-based features, gray-level co-occurrence matrix (GLCM), gray-level size zone matrix (GLSZM), gray-level run-length matrix (GLRLM), neighboring gray-tone difference matrix (NGTDM), and gray-level dependence matrix features.
To identify key imaging features closely associated with elevated LDL-C levels
(
All analyses were conducted using R software (version 4.3.2; The R Foundation
for Statistical Computing, Vienna, Austria). Data completeness was assessed prior
to analysis, and no missing values were present in the final analytic dataset;
therefore, no imputation was required. Continuous variables were assessed using
independent-sample t-tests or Mann–Whitney U tests, whereas categorical
variables were evaluated using
A total of 150 patients were included and were stratified into elevated LDL-C
levels (n = 74) and lower LDL-C levels (n = 76). The sex distribution was
comparable between the two groups (male, 54% vs. 57%, p = 0.80) and
body mass index (BMI) was similar (24.01 (2.83)/23.41 (4.24) kg/m2,
p = 0.074). Regarding lipid profiles, the elevated LDL-C levels group
had higher TC (5.10
| Characteristic | LDL-C |
LDL-C |
p value |
| Age (years) | 62.3 |
57.3 |
0.018 |
| Gender | Male: 43 (57%) Female: 33 (43%) | Male: 40 (54%) Female: 34 (46%) | 0.80 |
| BMI (kg/m2) | 23.41 (4.24) | 24.01 (2.83) | 0.074 |
| HR (bpm) | 80.7 |
74.6 |
0.023 |
| DBP (mmHg) | 80.4 |
87.6 |
0.039 |
| SBP (mmHg) | 133.53 (25.46) | 141.18 (31.54) | 0.20 |
| Hypertension | 37 (49%) | 43 (58%) | 0.20 |
| Drinking | 1 (1.3%) | 2 (2.7%) | 0.60 |
| Smoking | 1 (1.3%) | 3 (4.1%) | 0.40 |
| TC (mmol/L) | 3.92 |
5.10 |
|
| TG (mmol/L) | 2.16 |
1.75 |
0.20 |
| HDL-C (mmol/L) | 1.08 |
1.18 |
0.041 |
| ALT (U/L) | 23.3 |
28.5 |
0.018 |
| TBA (µmol/L) | 5.56 |
3.40 |
0.006 |
| TP (g/L) | 66.4 |
69.7 |
0.001 |
| Alb (g/L) | 39.2 |
41.3 |
0.001 |
| Glb (g/L) | 27.3 |
28.4 |
0.024 |
| ChE (U/L) | 6543 |
7440 |
0.002 |
| hs-CRP (mg/L) | 2.1 |
2.3 |
0.50 |
Values are mean
Abbreviations: Alb, albumin; ALT, alanine aminotransferase; BMI, body mass index; ChE, cholinesterase; DBP, diastolic blood pressure; Glb, globulin; HDL-C, high-density lipoprotein cholesterol; HR, heart rate; hs-CRP, high-sensitivity C-reactive protein; IQR, interquartile range; LDL-C, low-density lipoprotein cholesterol; SBP, systolic blood pressure; TBA, total bile acid; TC, total cholesterol; TG, triglyceride; TP, total protein.
A total of 288 radiomics features were initially extracted from the PCAT ROIs
surrounding the LAD, LCX, and RCA. Preliminary screening using the Wilcoxon
rank-sum test identified 48 candidate features showing statistically significant
differences between the groups (Supplementary Table 1). These candidate
features were then individually entered into univariate logistic regression
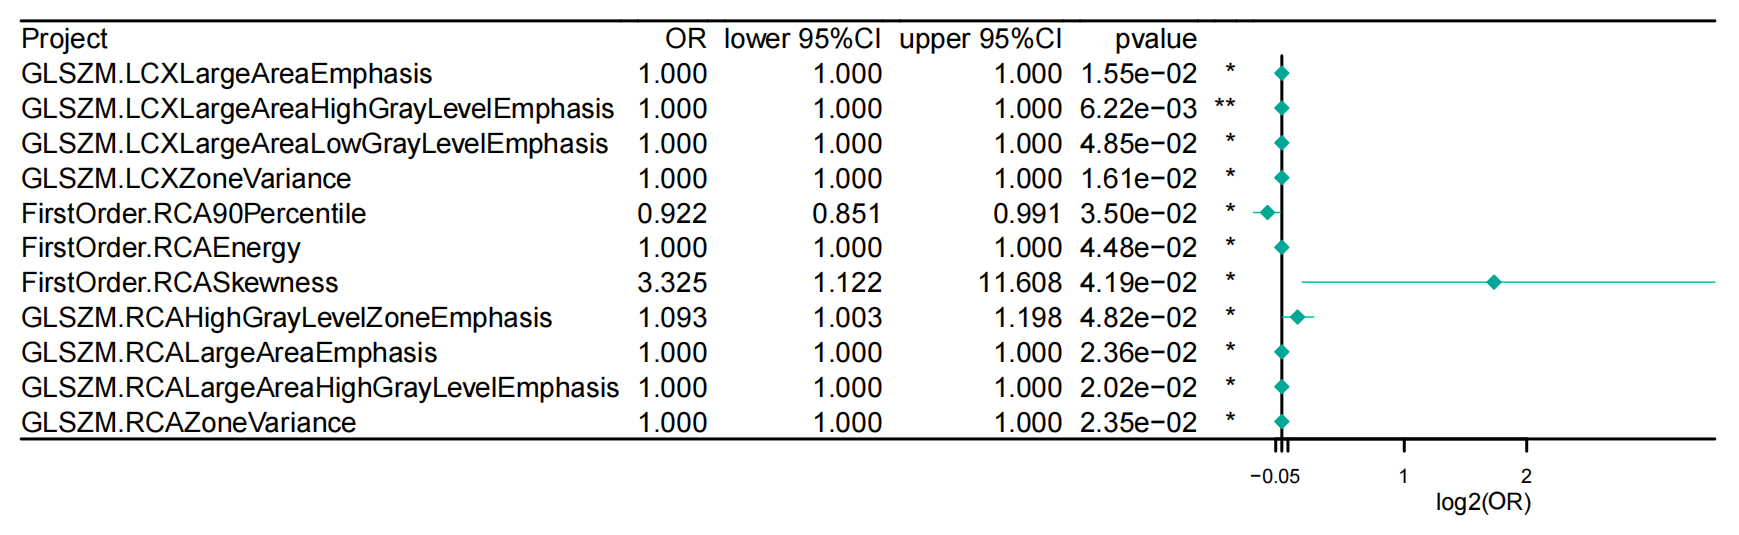
analyses to assess their associations with elevated LDL-C levels (
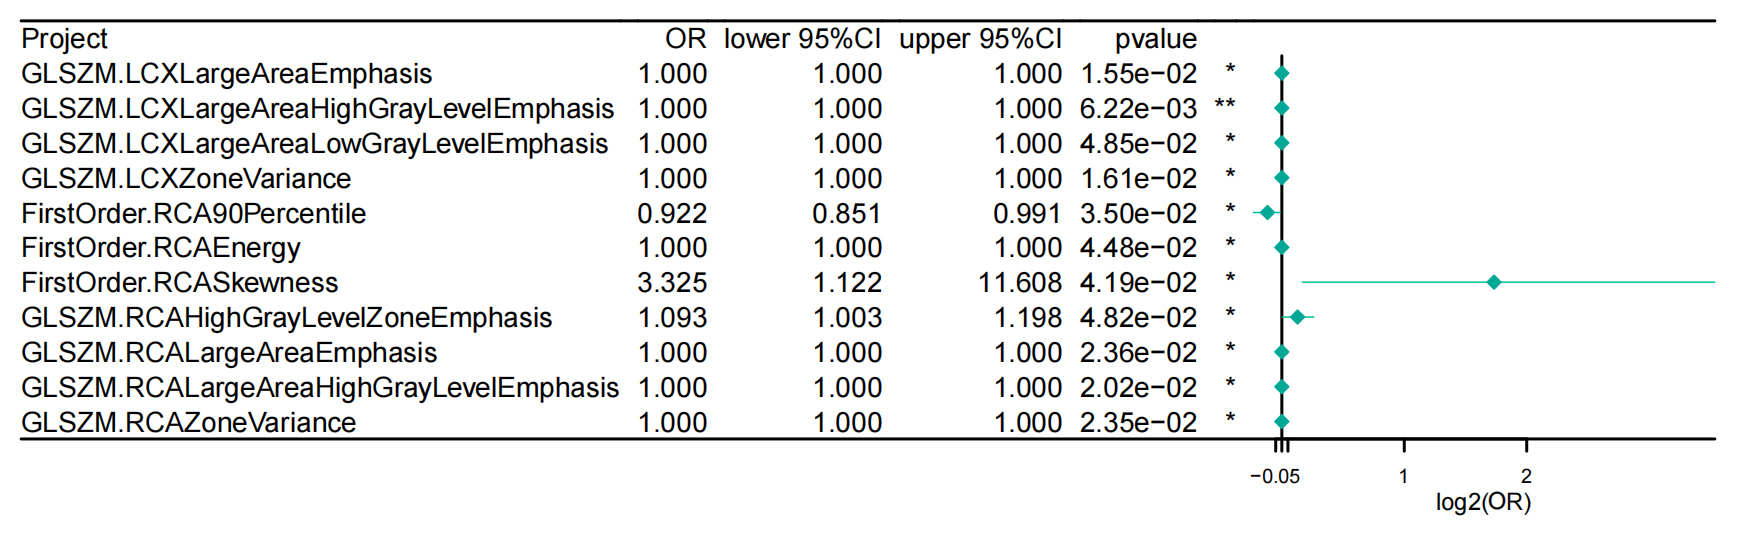 Fig. 2.
Univariate logistic regression results of 11 selected PCAT
radiomic features. Abbreviations: CI, confidence interval; FirstOrder,
first-order statistics (radiomic feature class); GLSZM, gray level size zone
matrix; LCX, left circumflex artery; OR, odds ratio; PCAT, pericoronary adipose
tissue; RCA, right coronary artery. Statistical significance: *p
Finally, all 11 features were incorporated into hybrid ensemble models with embedded feature selection capability, including random forest with LASSO regularization combined with Elastic Net, and SVM combined with GBM (Supplementary Fig. 1), and were subjected to five-fold cross-validation within the training set to assess feature stability and importance. Among all algorithmic combinations, the GBM-based model demonstrated the best performance, and no further features were eliminated. Therefore, these 11 features were identified as the final PCAT radiomics feature set and were used for subsequent correlation analyses and SHAP-based interpretability assessment.
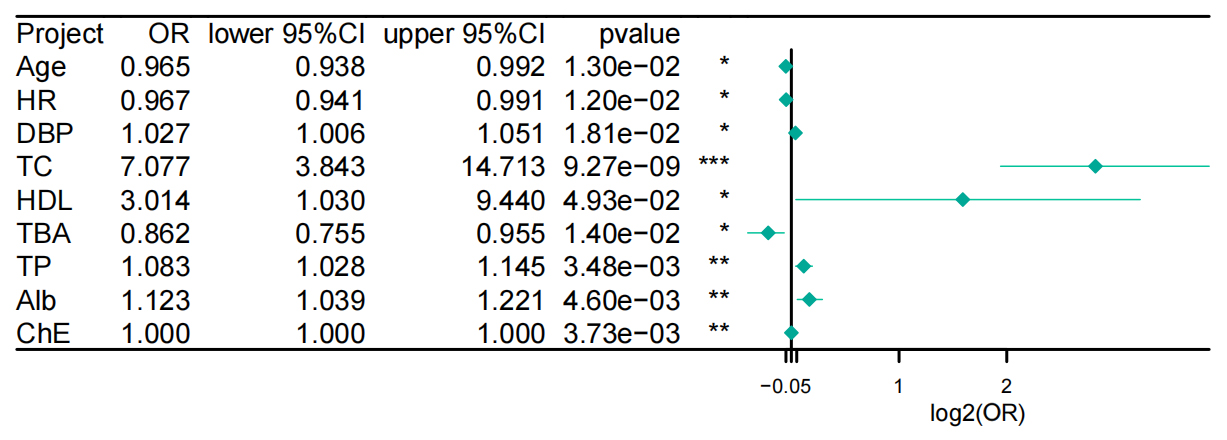
In the univariate logistic regression analysis of clinical variables, both TC
and HDL-C were significantly associated with elevated LDL-C levels (Fig. 3).
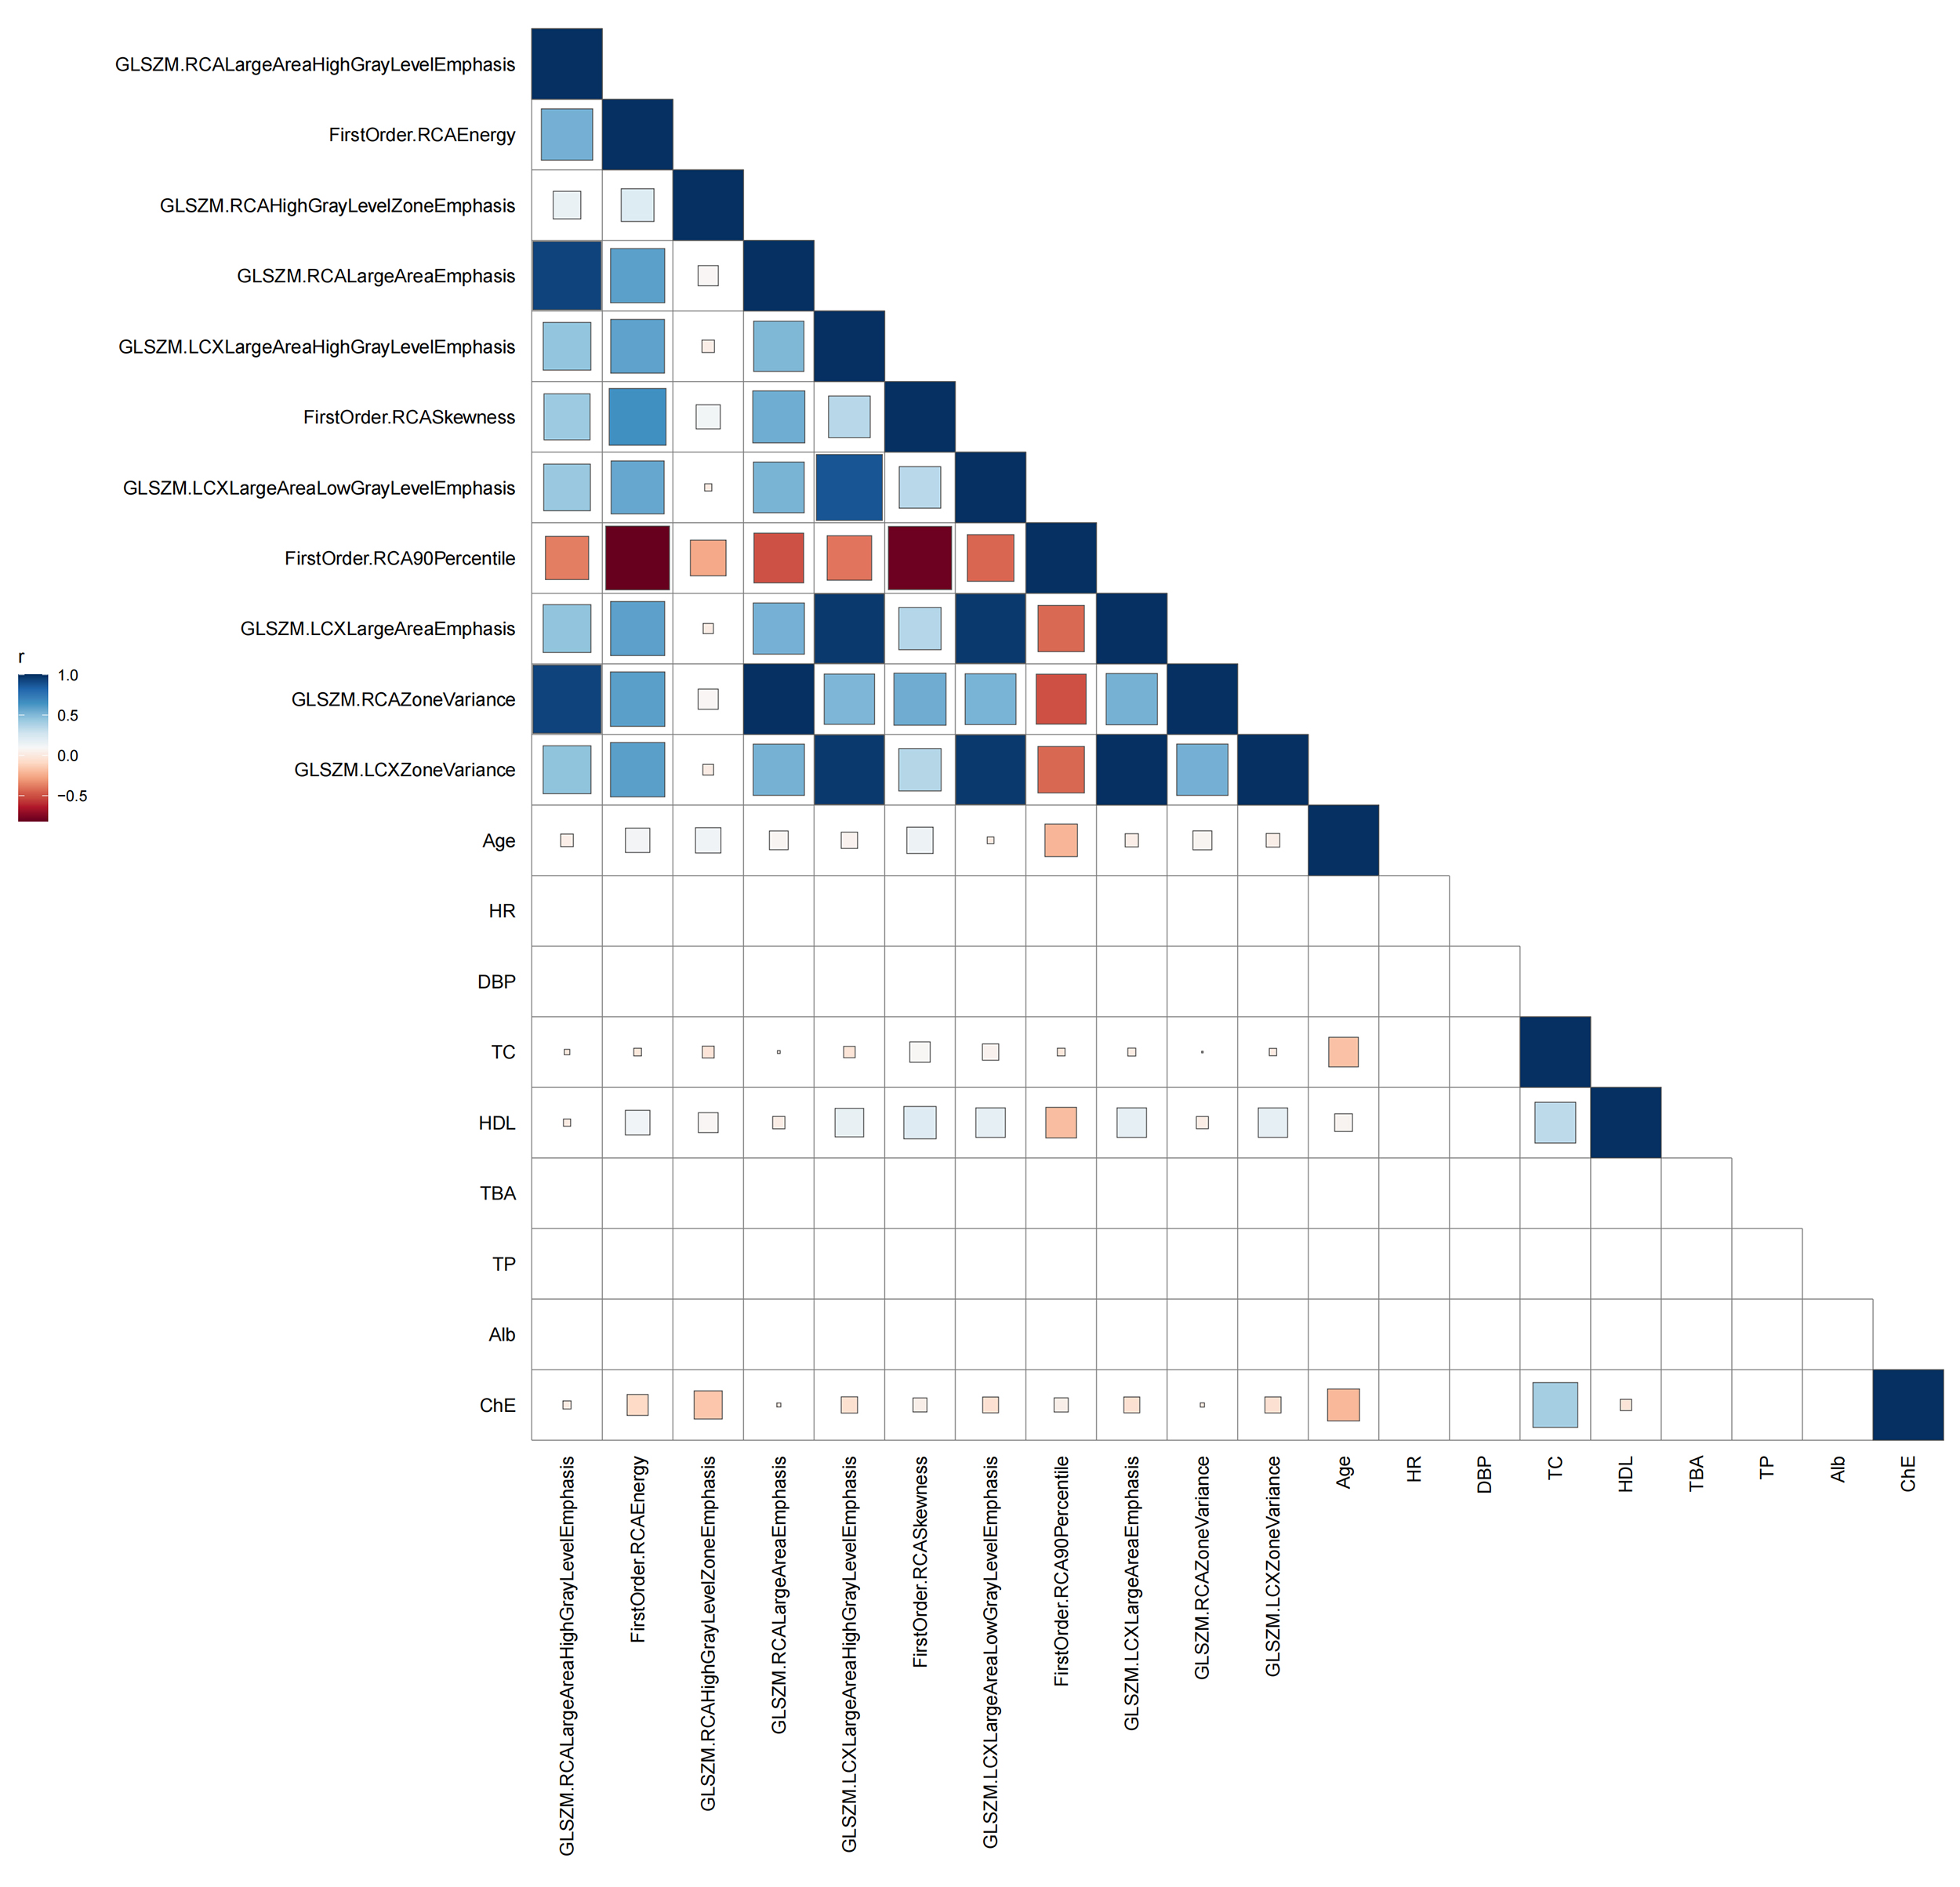
Based on the 11 PCAT radiomic features retained in Section 3.2, Pearson
correlation analysis was performed with key clinical variables, including TC,
HDL-C, and liver function parameters (Fig. 4). Overall, the correlations were
predominantly weak to moderate; among them, HDL-C demonstrated positive
correlations with several GLSZM and first-order features. Other clinical
variables exhibited generally weak correlations with most imaging features
(
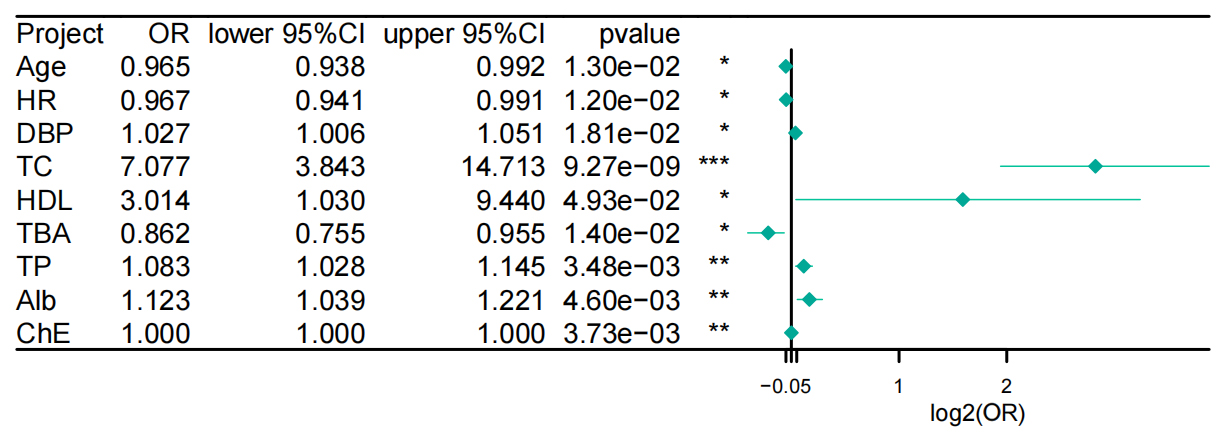 Fig. 3.
Univariate logistic regression forest plot of clinical
variables associated with elevated LDL-C levels. Abbreviations: CI, confidence
interval; HDL, high-density lipoprotein cholesterol; OR, odds ratio. Statistical significance: *p
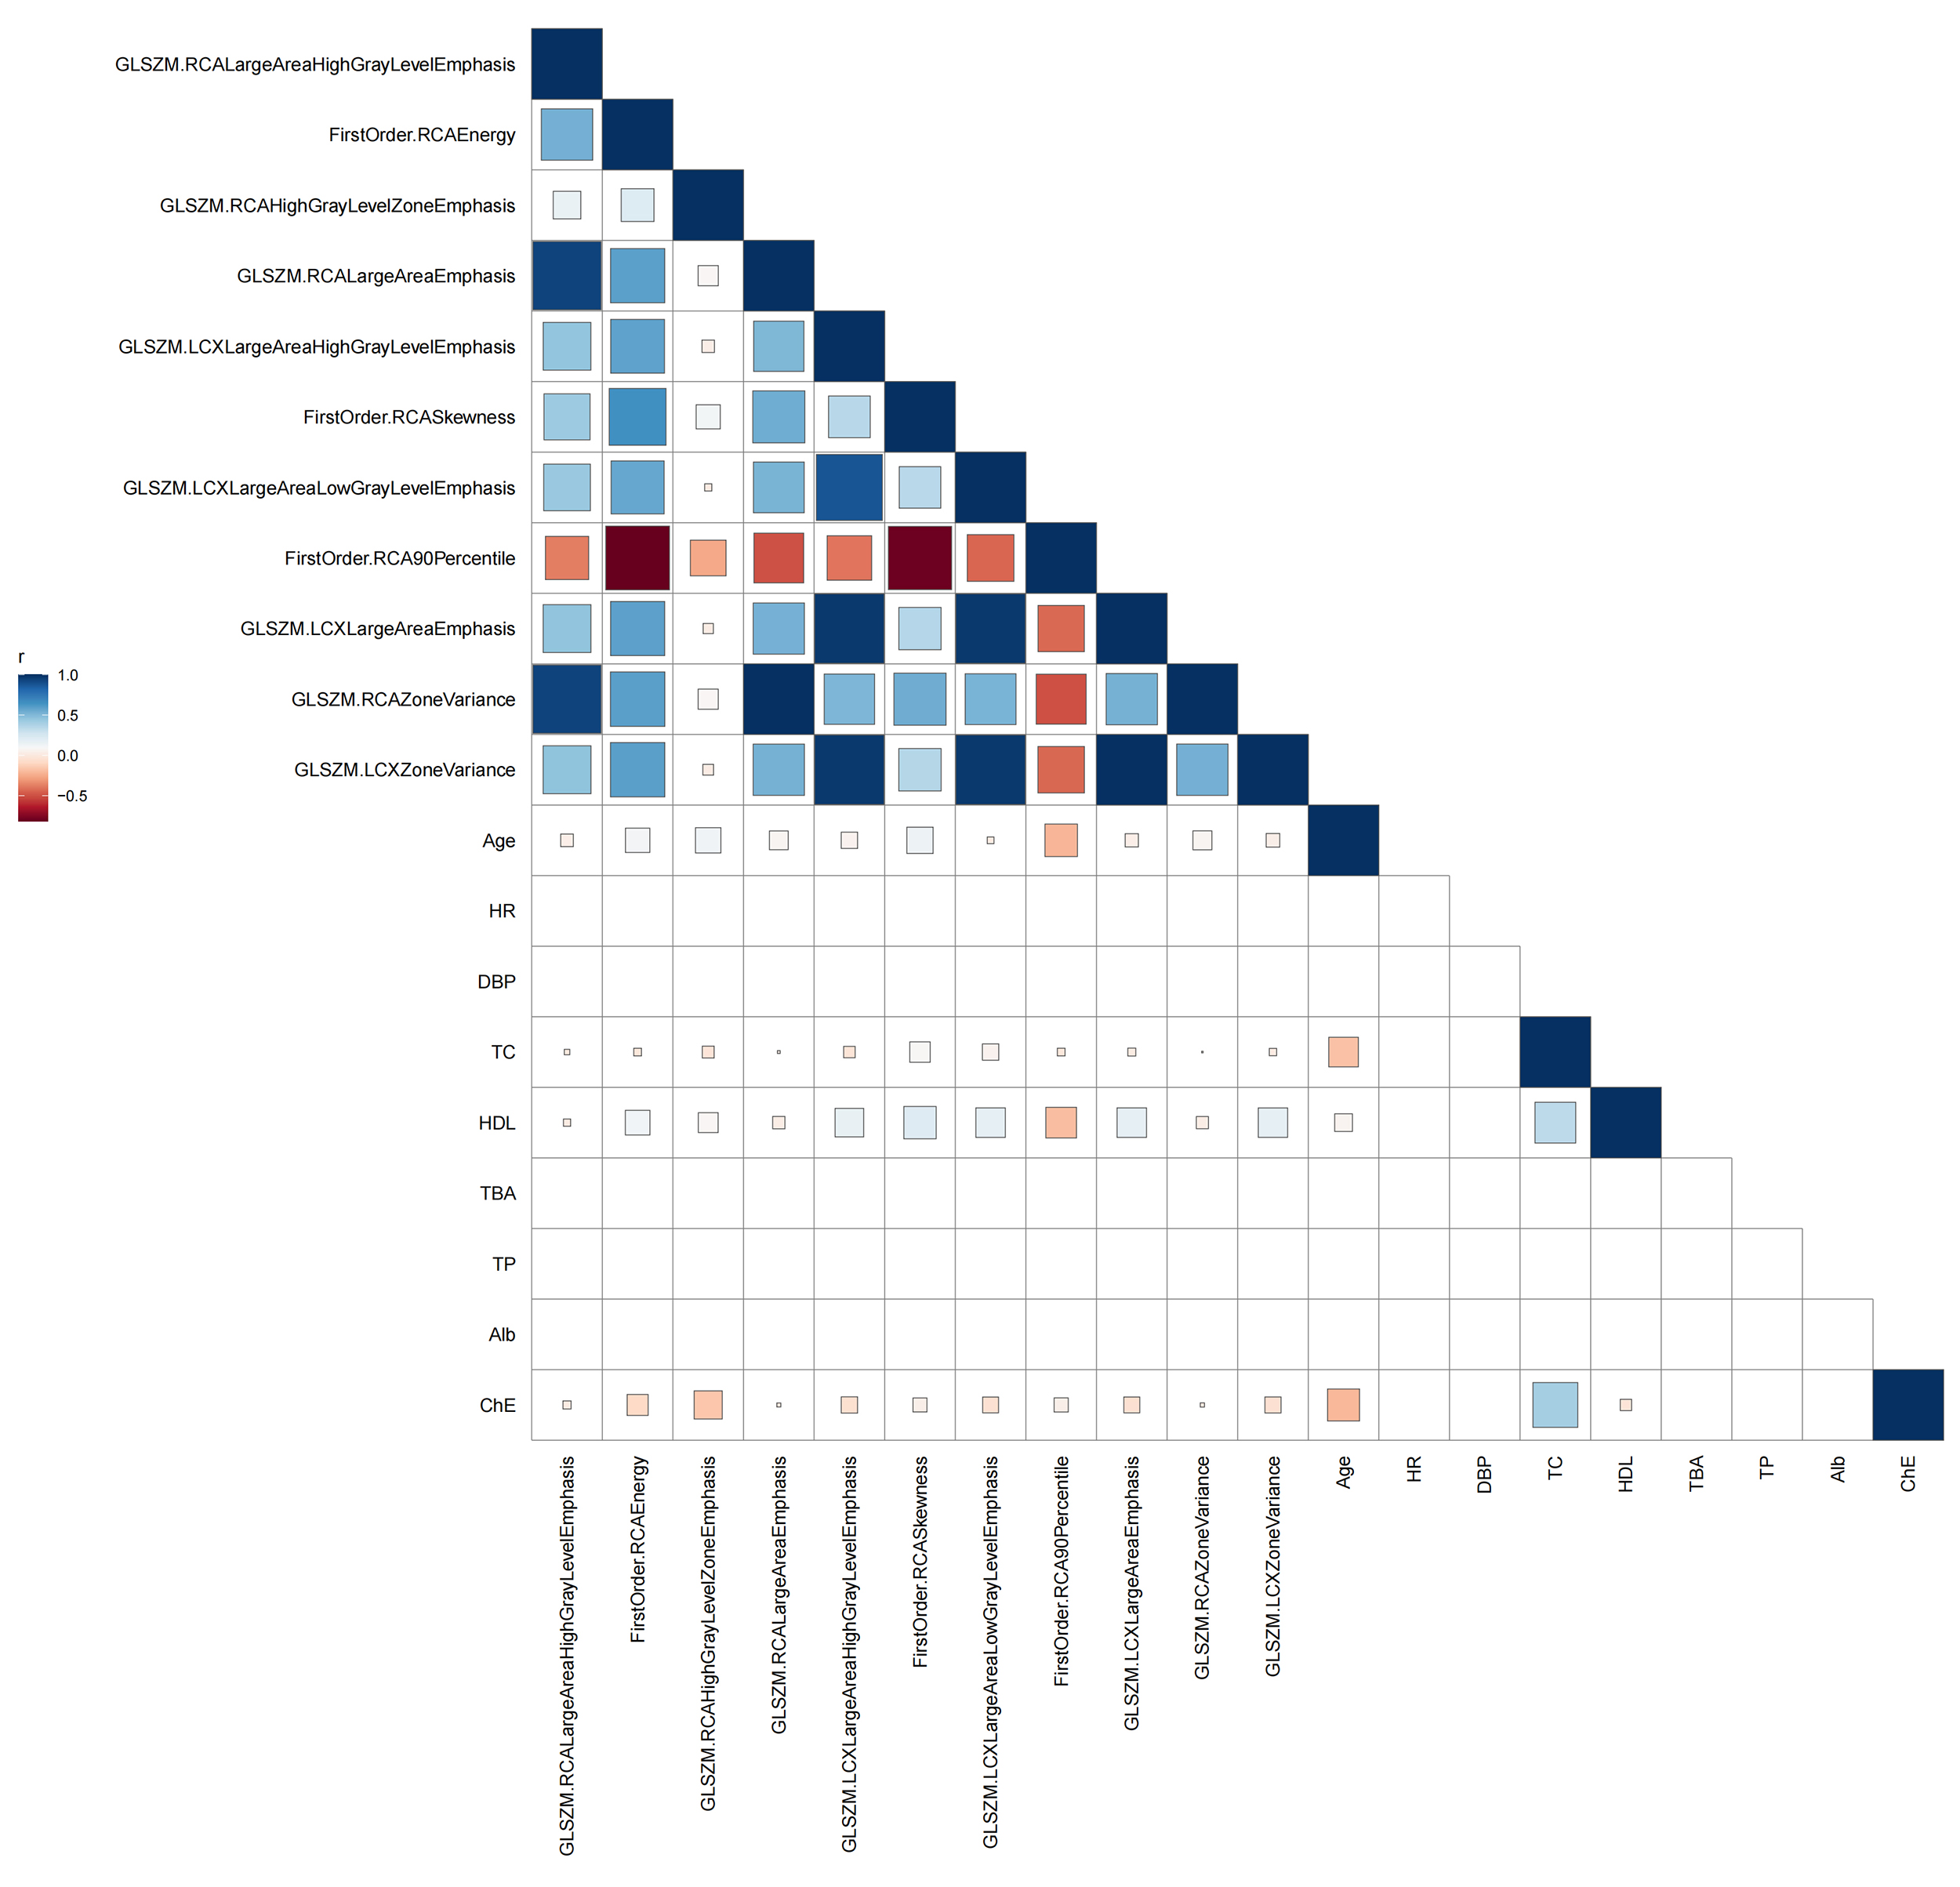 Fig. 4.
Pearson correlation heatmap between PCAT radiomic features and clinical variables. Abbreviations: HDL, high-density lipoprotein cholesterol; PCAT, pericoronary adipose tissue.
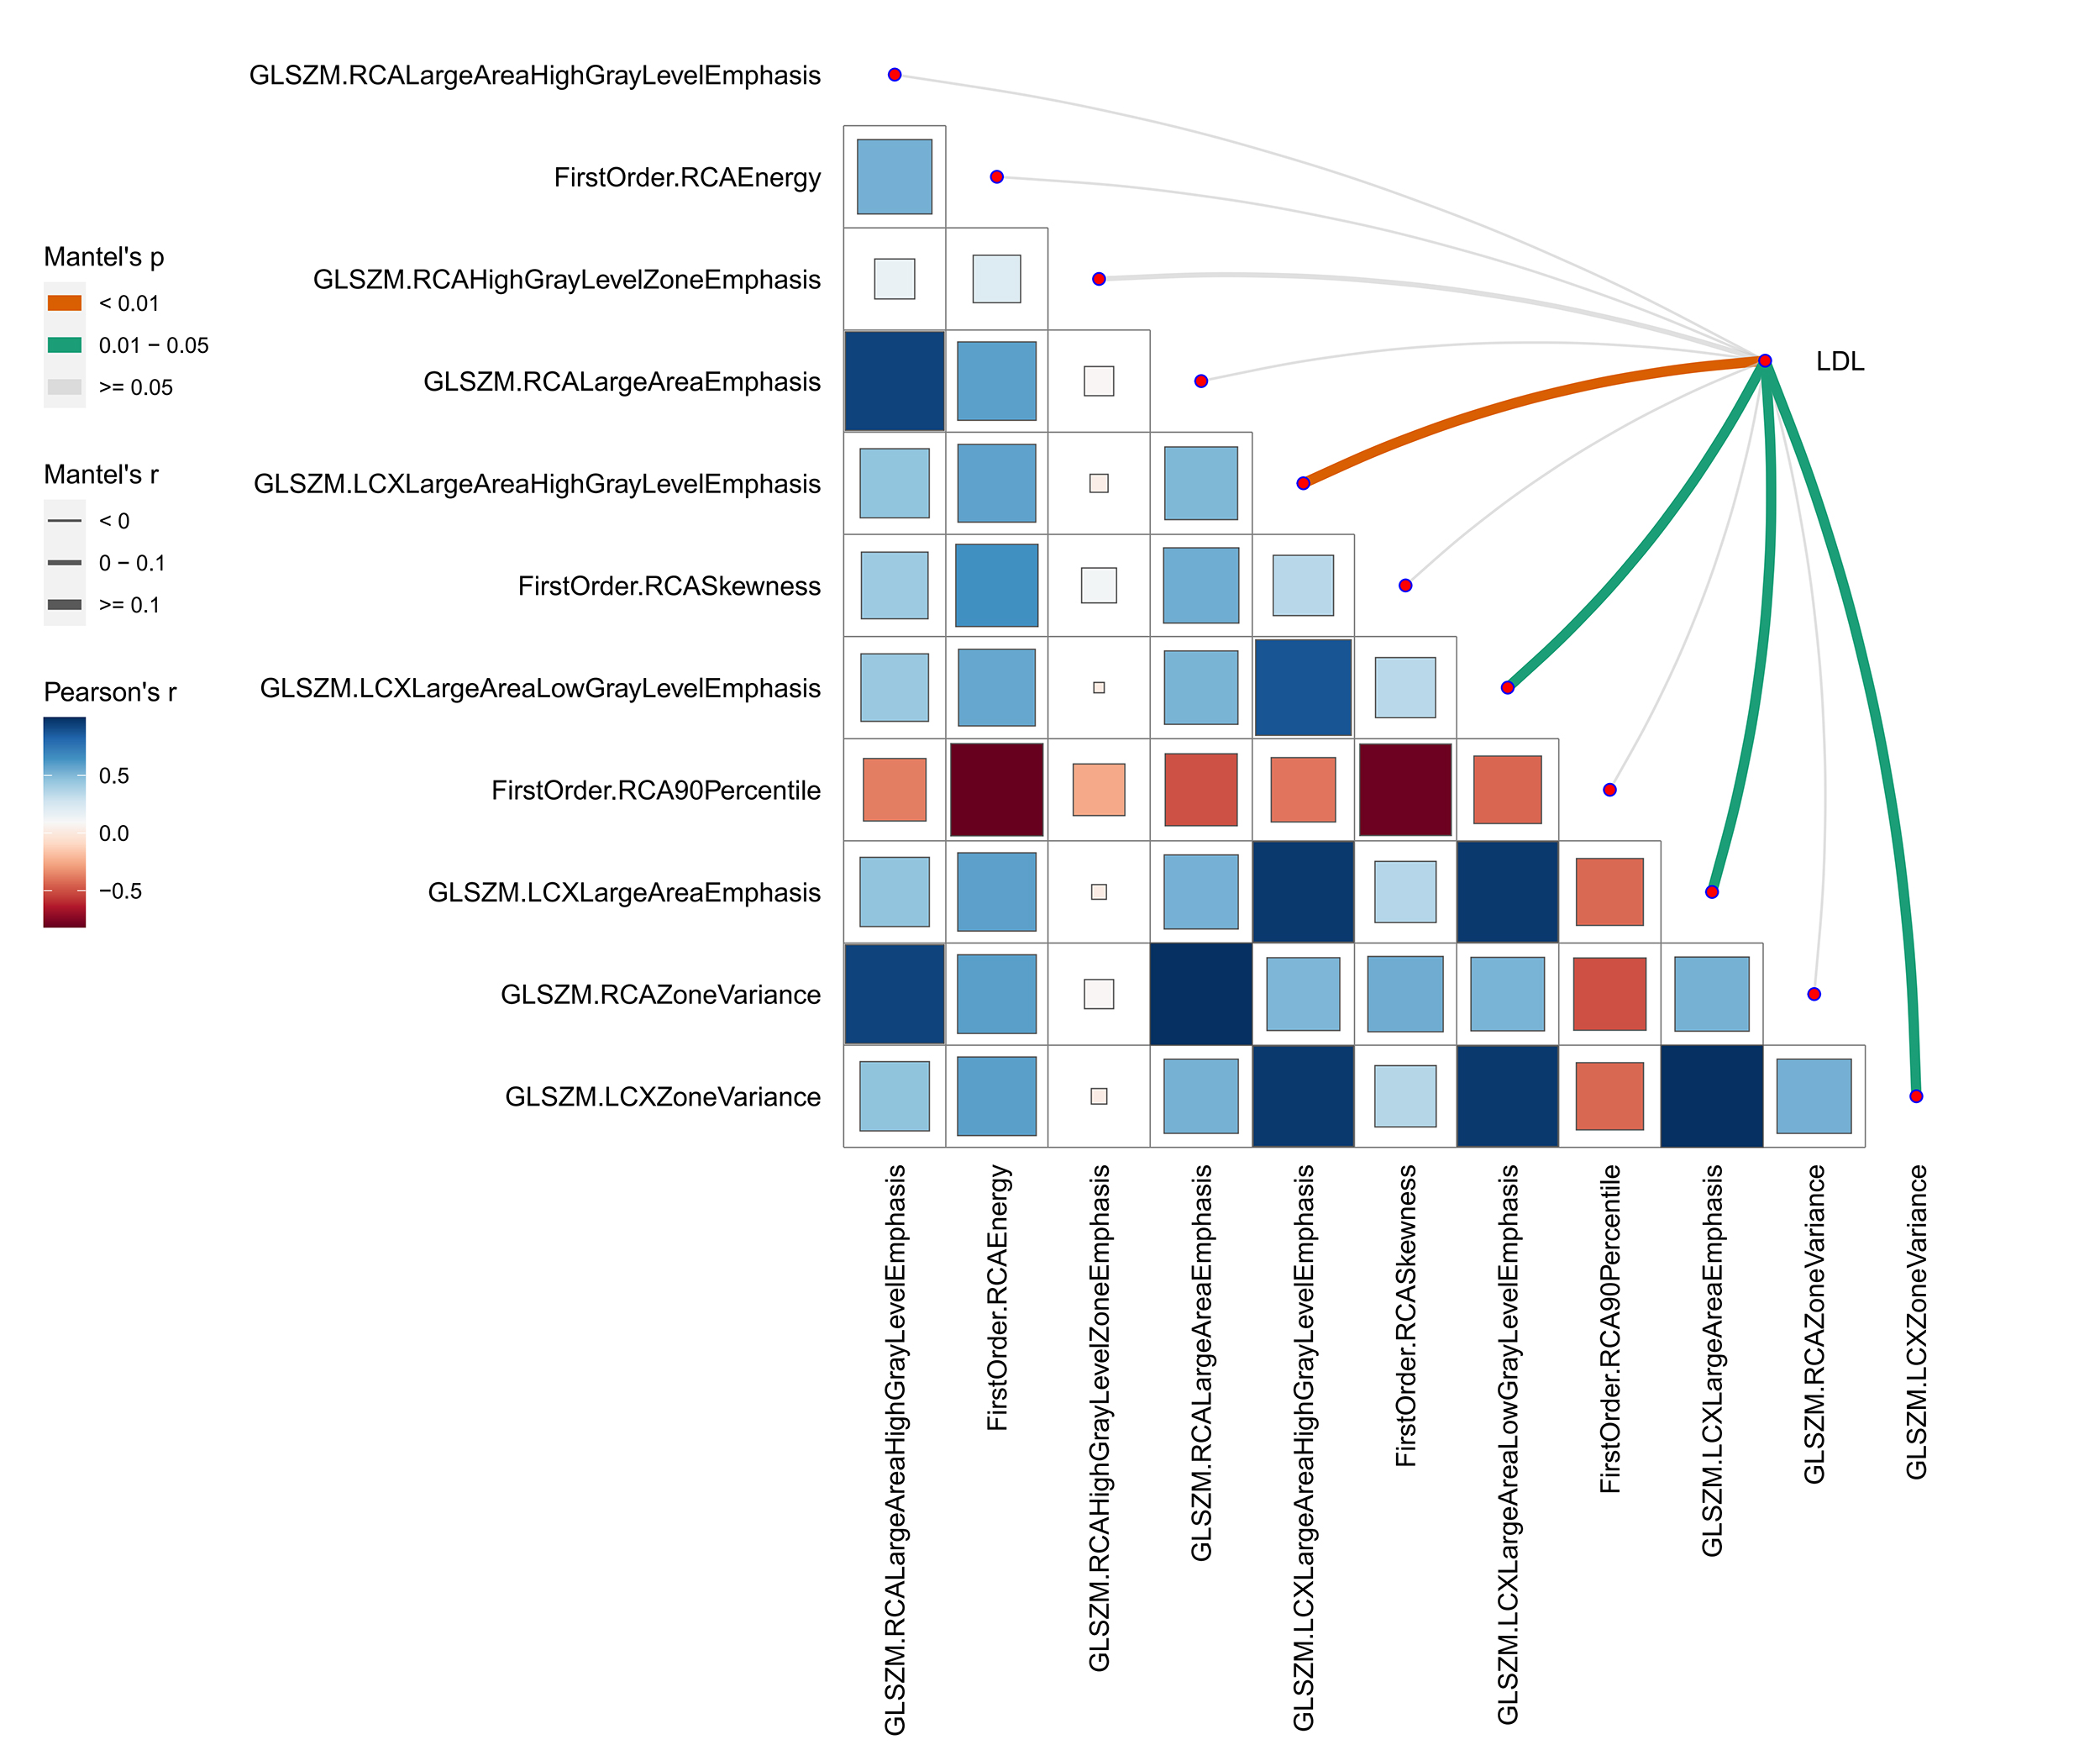
Mantel correlation analysis demonstrated a significant association between PCAT
structural features and elevated LDL-C levels. Among the 11 evaluated texture
features, four showed significant positive correlations with
GLSZM.LCXLargeAreaHighGrayLevelEmphasis demonstrates the strongest association
(Mantel’s r
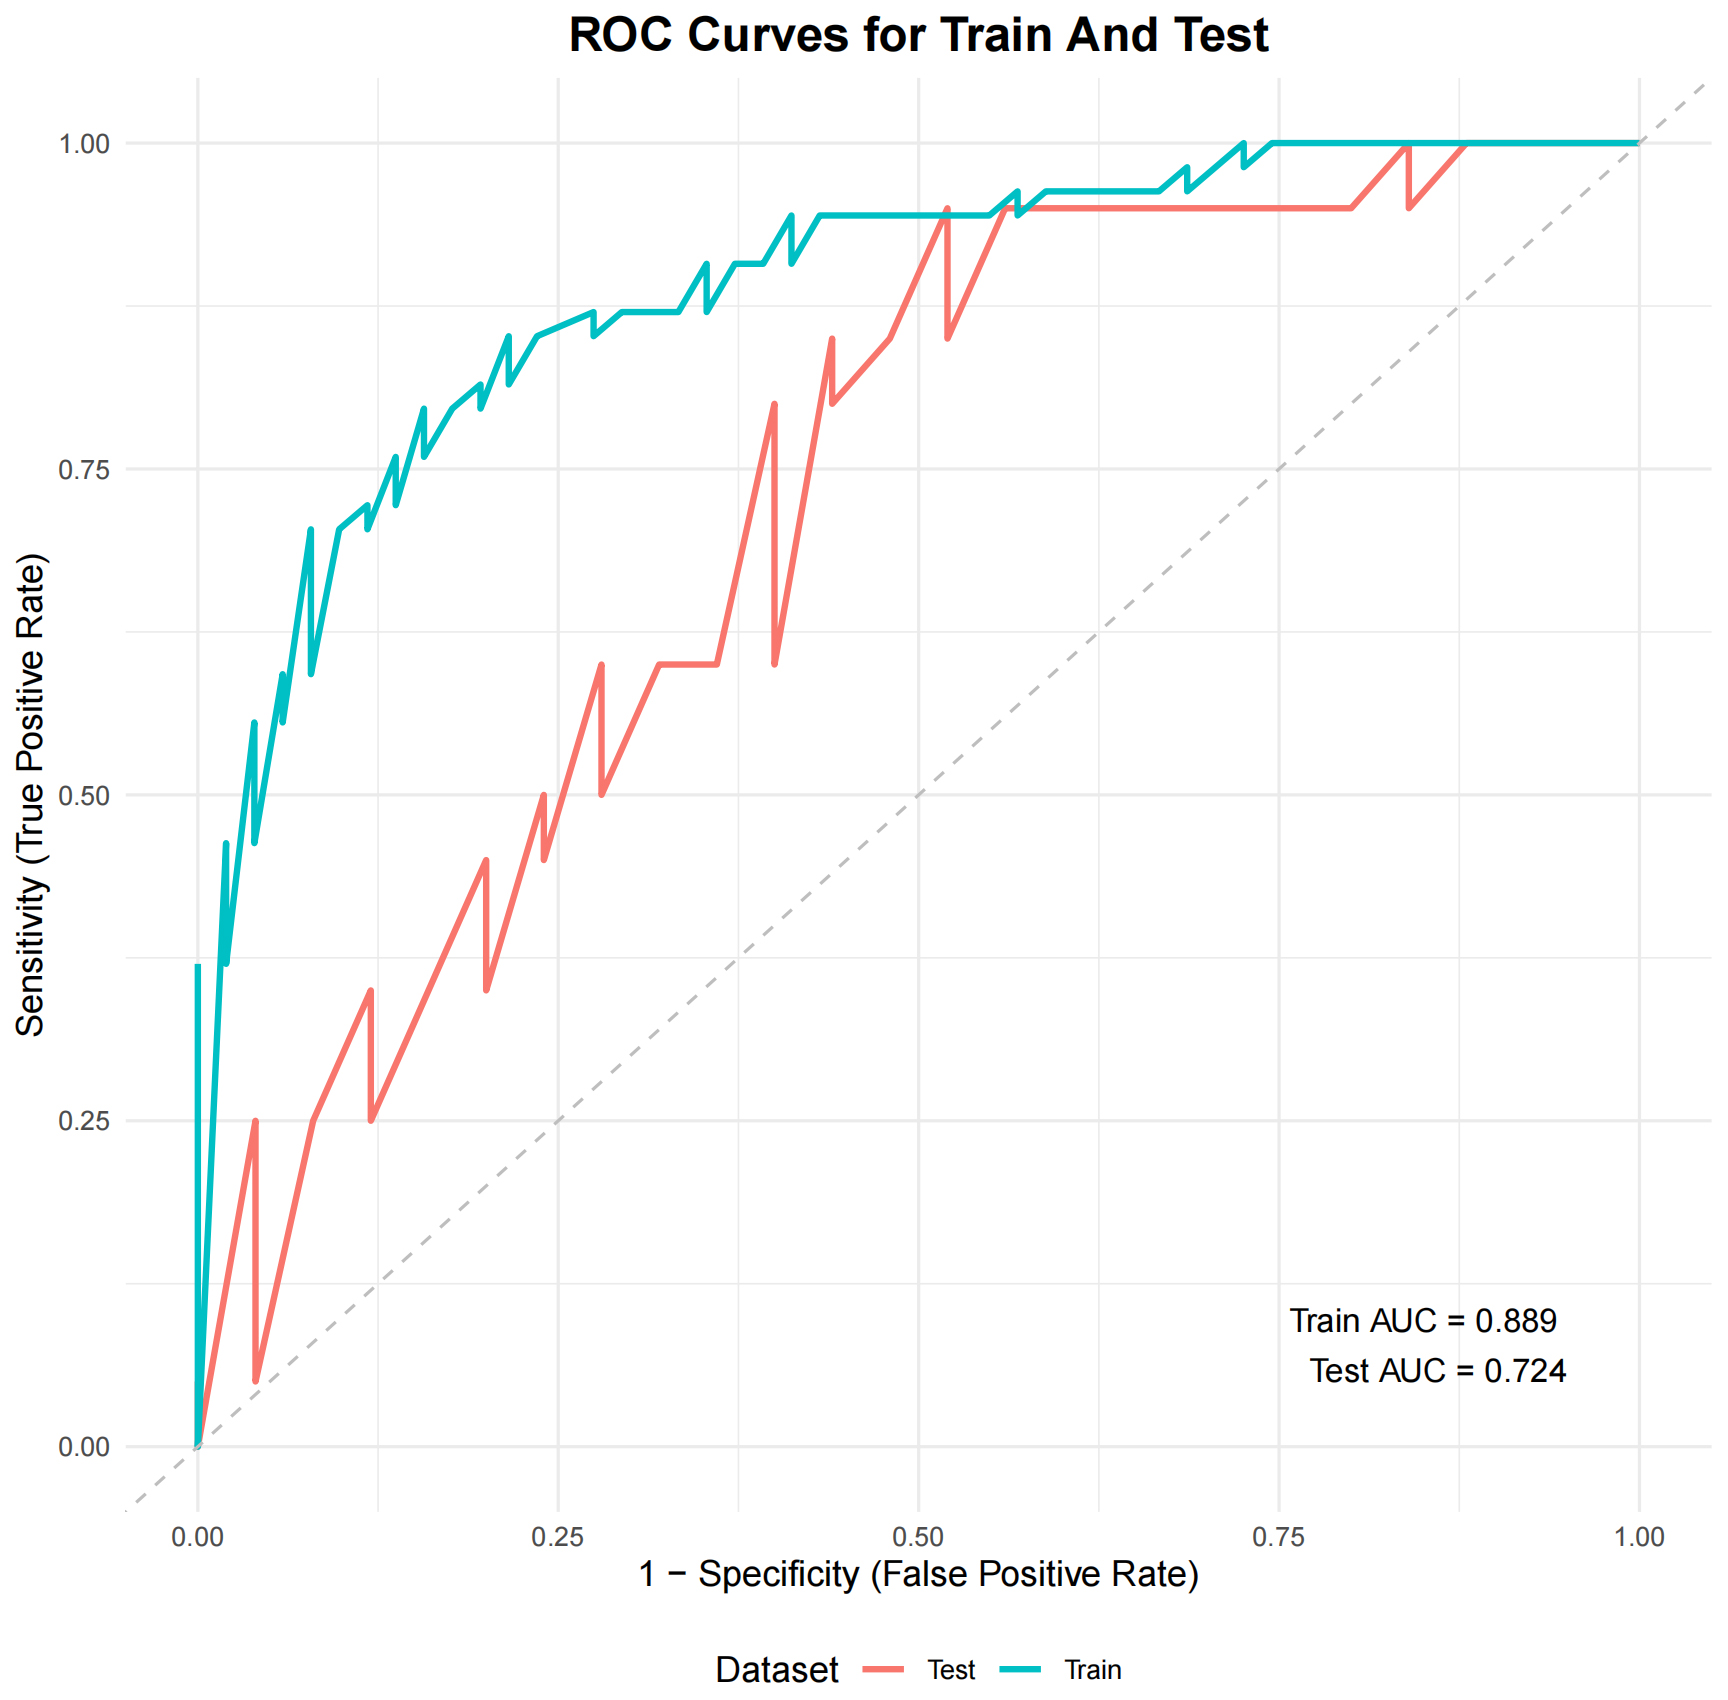
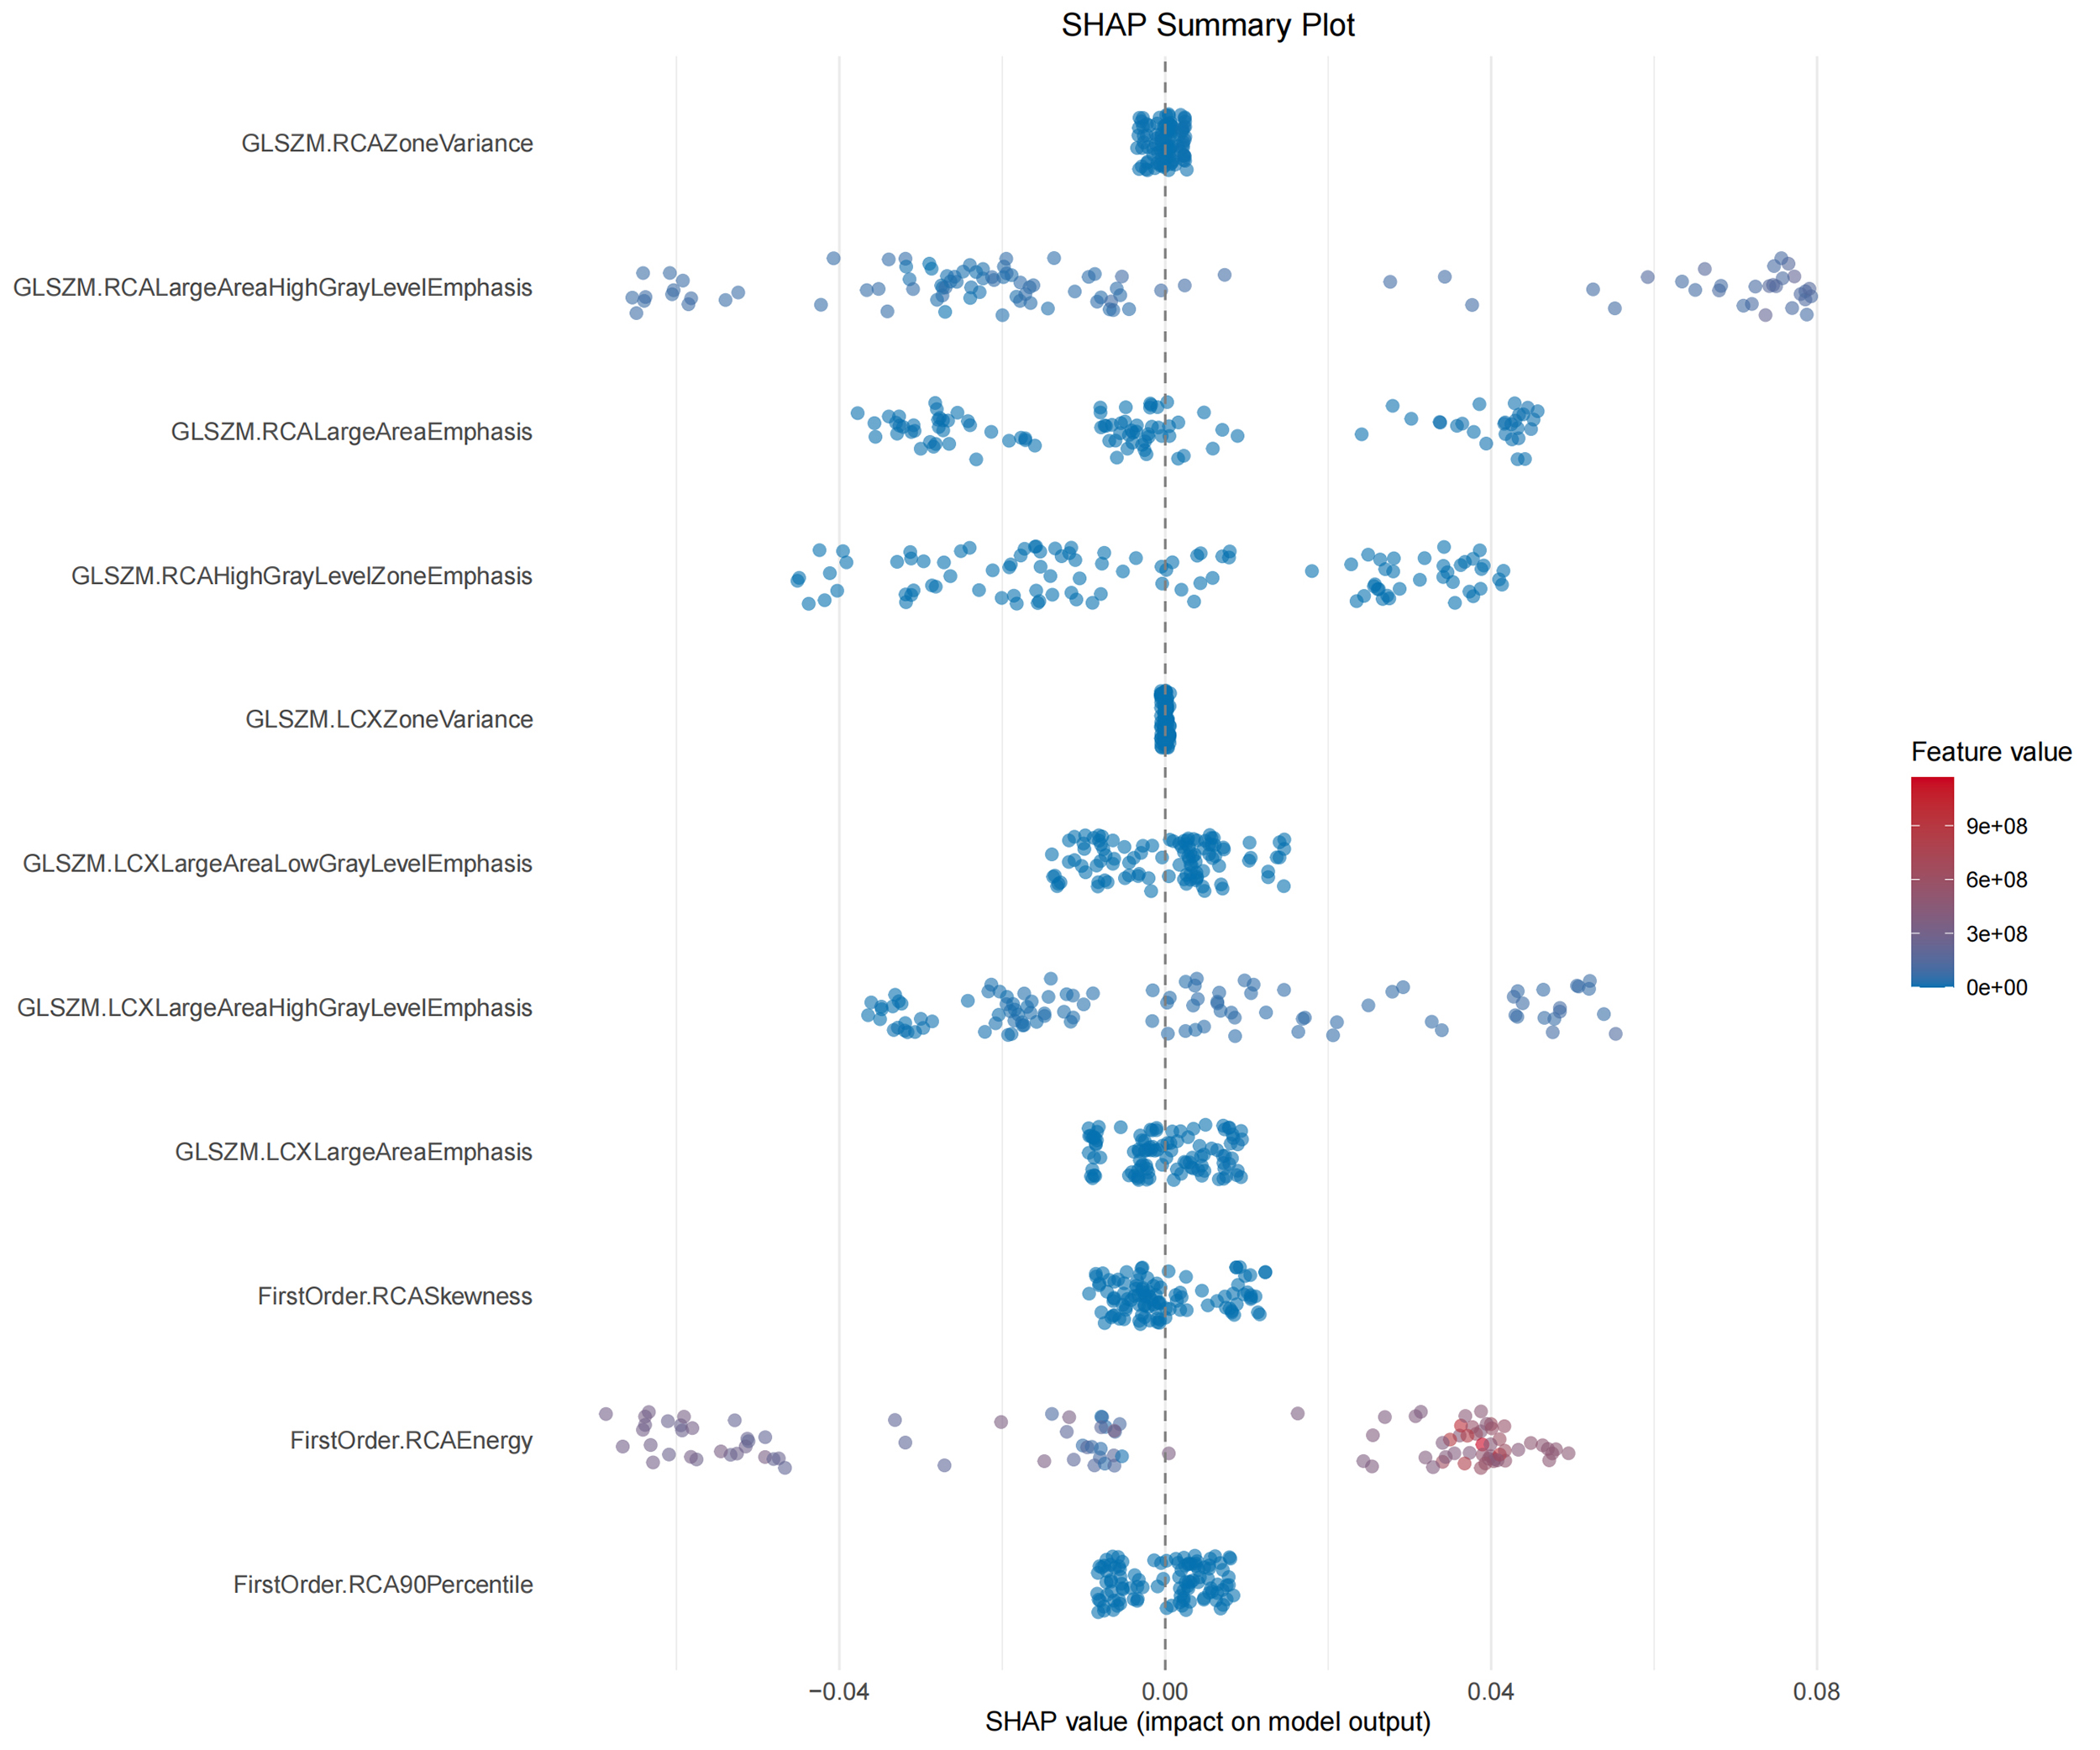
Among various machine learning models, the ensemble GBM model achieved the best performance, with an AUC of 0.889 in the training set and 0.724 in the internal hold-out test set (Fig. 5). SHAP analysis revealed that GLSZM.RCAZoneVariance consistently contributed to the discrimination of elevated LDL-C levels. Notably, the FirstOrder.RCAEnergy showed the highest contribution, whereas large high-gray-level zone features such as GLSZM.RCALargeAreaHighGrayLevelEmphasis and GLSZM.LCXLargeAreaHighGrayLevelEmphasis demonstrated substantial local driving effects for elevated LDL-C levels (Fig. 6). These results suggest that, in this cohort, PCAT regions exhibit more extensive and heterogeneous high-attenuation texture phenotypes in patients with elevated LDL-C levels.
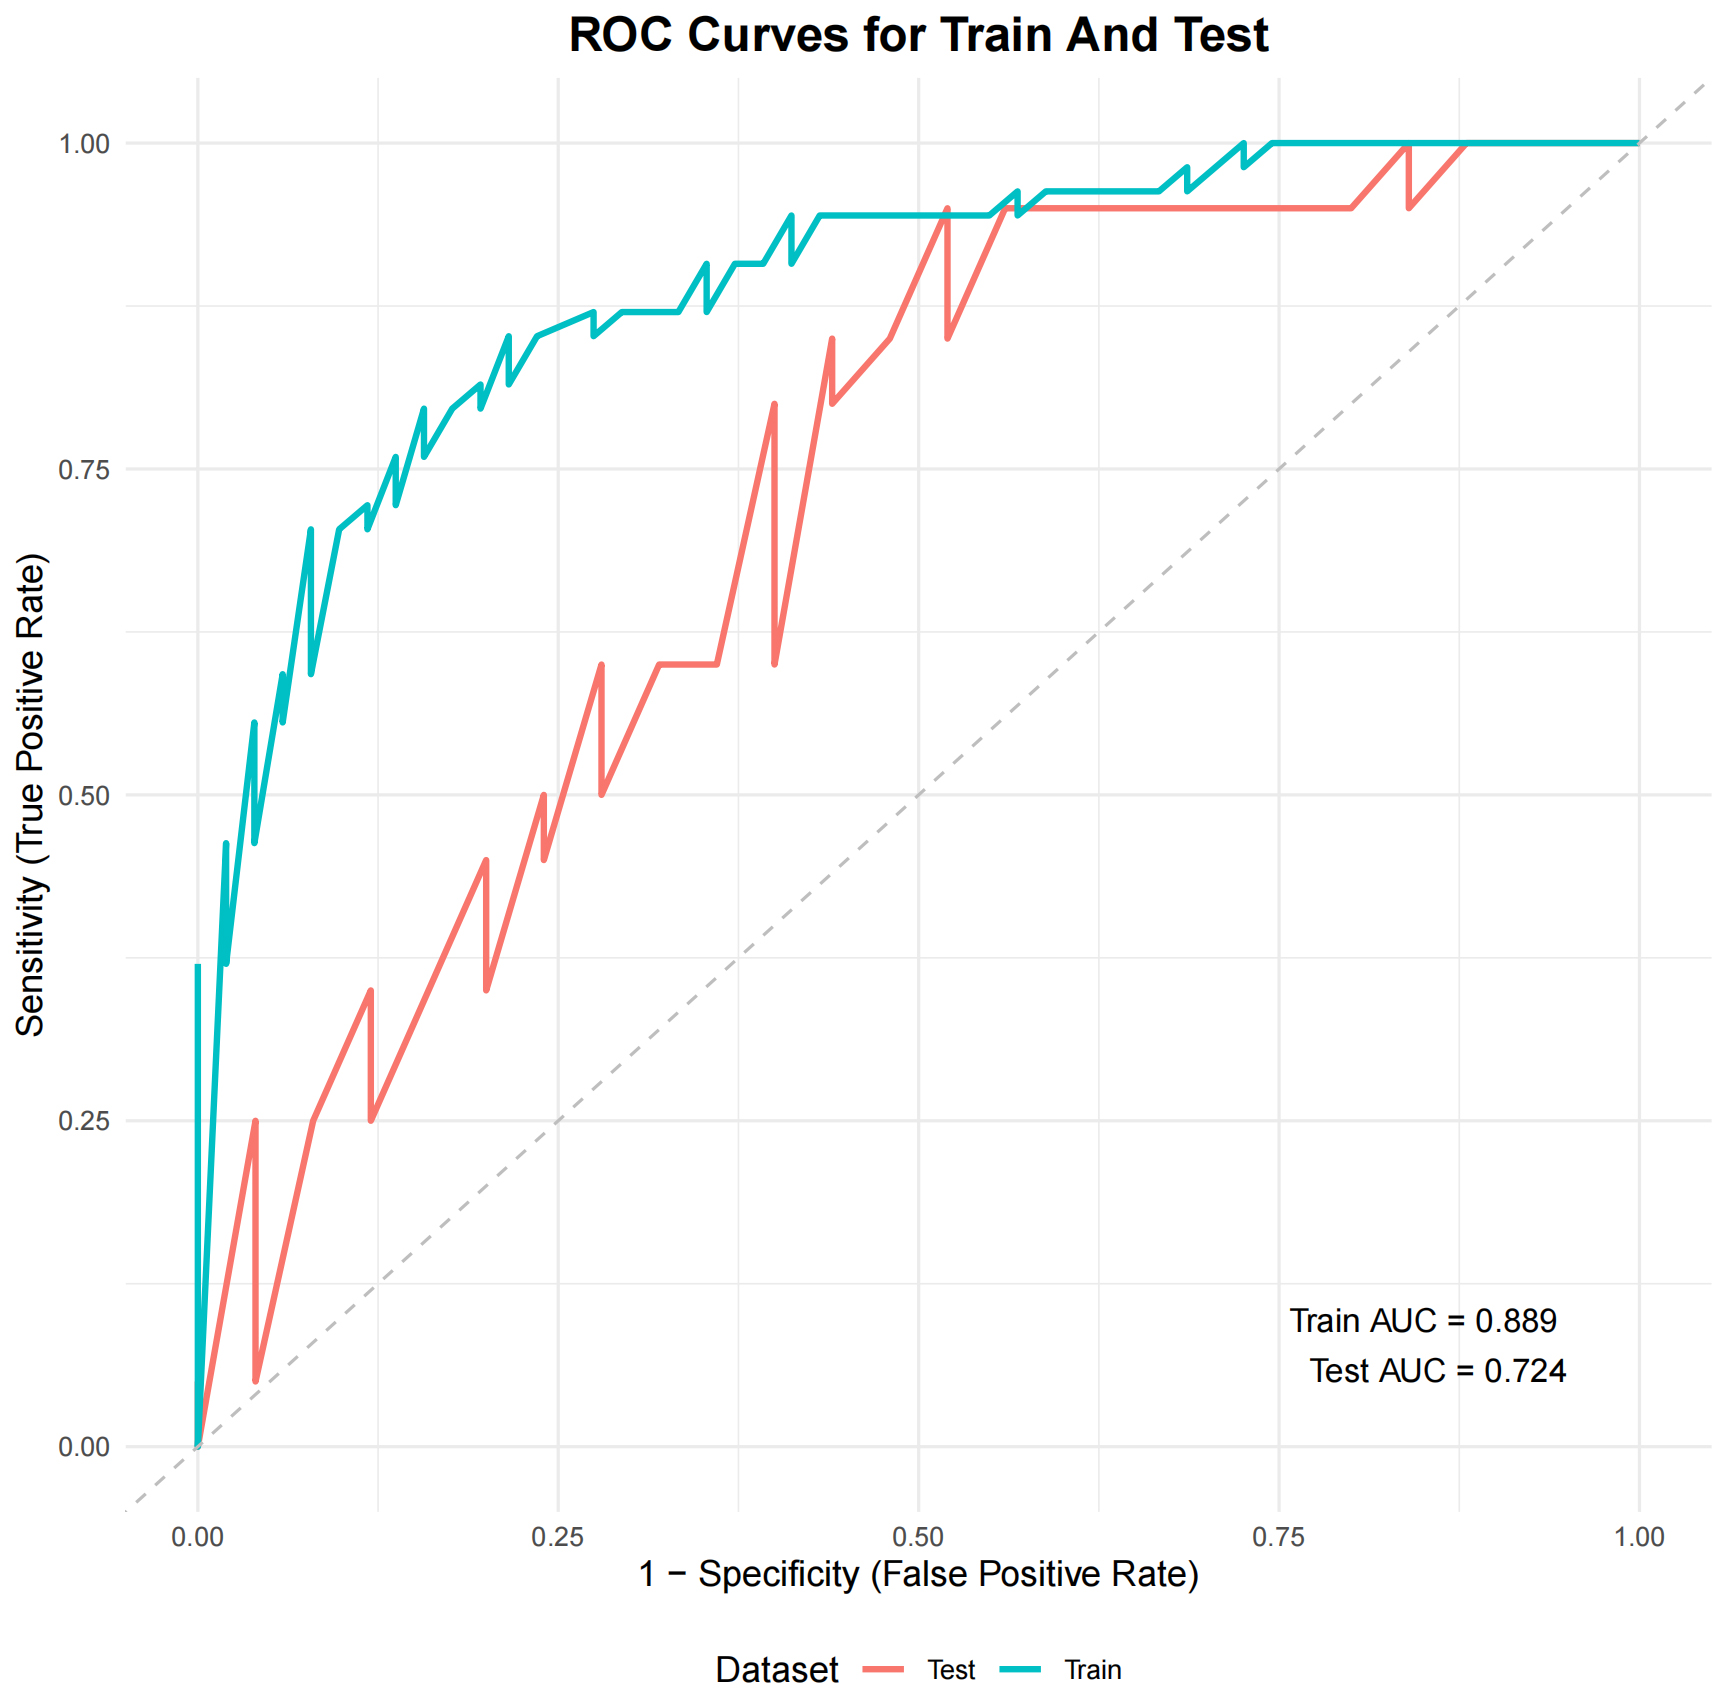 Fig. 5.
ROC curves of the GBM model for training and test sets. Abbreviations: AUC, area under the curve; GBM, gradient boosting machine; ROC, receiver-operating characteristic.
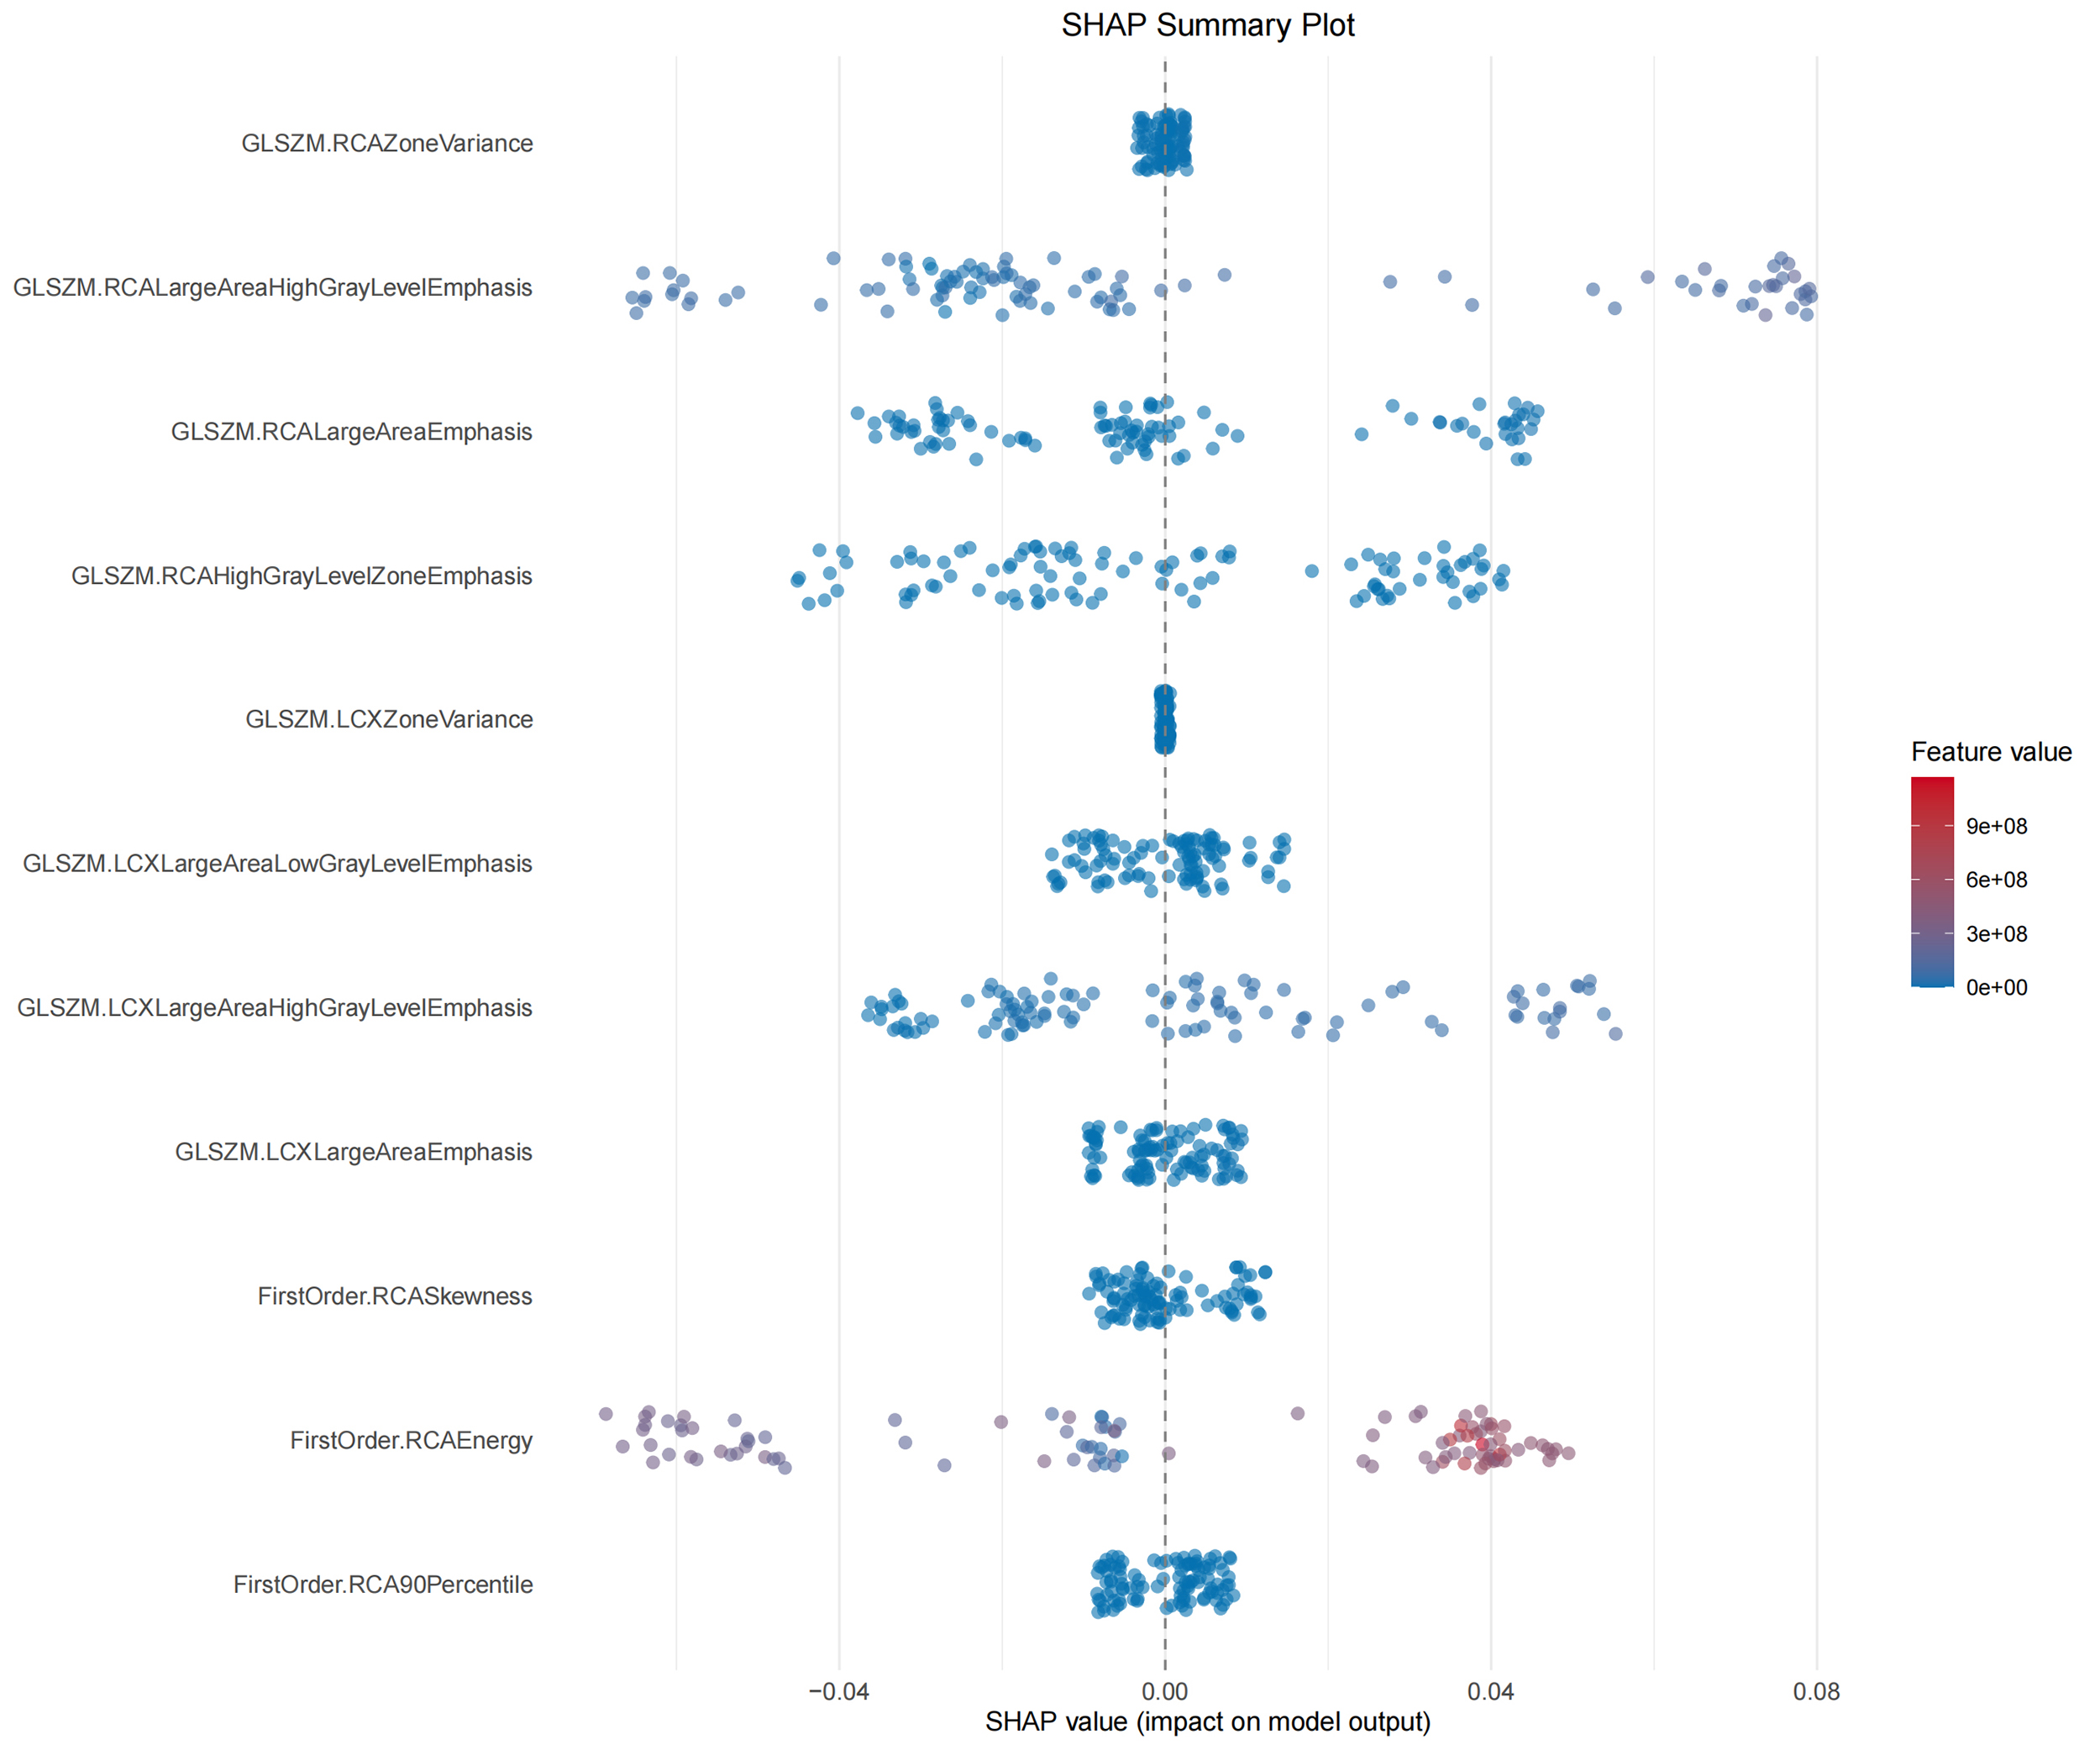 Fig. 6.
SHAP summary plot of radiomic features associated with elevated LDL-C levels. SHAP values indicate the contribution of each radiomic feature to the discrimination of elevated LDL-C levels, with color representing feature values from low (blue) to high (red). Abbreviations: LDL-C, low-density lipoprotein cholesterol; SHAP, shapley additive explanations.
To our knowledge, this study is among the first to evaluate the relationship between elevated LDL-C levels and PCAT phenotypes using CCTA-based radiomics. Individuals with higher lipid exposure demonstrated greater spatial heterogeneity of PCAT, characterized by larger high-attenuation (high-gray-level) regions. These observations are consistent with histologic evidence indicating that inflammation, fibrosis, and neovascularization contribute to adipose tissue inhomogeneity [1, 23, 24]. From a clinical perspective, these imaging changes are consistent with the cumulative metabolic burden of long-term LDL-C elevation, thereby providing imaging-based evidence supporting the link between cholesterol levels and localized coronary inflammation.
We identified several radiomic features associated with elevated LDL-C levels. Notably, second-order GLSZM metrics such as LargeAreaHighGrayLevelEmphasis and ZoneVariance were strongly related to LDL-C status, reflecting clustered regions of high gray-level voxels and increased textual heterogeneity within PCAT. These findings align with histopathological evidence: Mazurek et al. [23] demonstrated abundant inflammatory mediators, fibrosis, and microvascular proliferation within epicardial and pericoronary adipose tissue, providing biological support for the imaging manifestations of high-density clustering and increased heterogeneity. Mechanistically, LDL-C may influence PCAT through an “inside-out” signaling pathway, in which endothelial dysfunction activates adipocyte paracrine signaling, thereby promoting immune cell recruitment, lipid droplet remodeling, and stromal reorganization [11, 25, 26]. Animal studies have shown that high-fat diets exacerbate PCAT inflammation and remodeling [27], while human pathological studies corroborate these changes, showing reduced lipid droplet content, fibrosis, and inflammatory cell infiltration in hyperlipidemia and atherosclerosis [28, 29]. Taken together, these findings suggest that chronic LDL-C elevation may promote clustering and heterogeneity in PCAT, reflecting underlying inflammatory and structural remodeling processes, and strengthening the biological plausibility of our results. Nevertheless, these mechanistic interpretations remain hypothesis-generating and warrant independent biological validation in future studies.
Large-scale epidemiological studies have shown that lifelong elevation of LDL-C drives atherosclerosis, with cardiovascular risk increasing proportionally to both concentration and exposure duration [5, 6]. Further evidence indicates that statin therapy is associated with reduced PCAT attenuation, whereas untreated patients do not exhibit such changes [7, 8, 9]. Even after adjustment for potential confounders, changes in LDL-C remain independently correlated with percentage changes in PCAT attenuation. In the present study, first-order radiomic features reflected previously reported attenuation findings, whereas second-order features captured voxel clustering and heterogeneity, thereby providing structural insights beyond mean attenuation alone. These findings are consistent with mechanistic studies by Antonopoulos et al. [1], which demonstrated that local coronary inflammation alters PCAT through paracrine signaling, leading to impaired adipocyte maturation, lipid droplet depletion, and increased intracellular water [30, 31]. Collectively, these processes manifest as increased CT attenuation and greater textural complexity on imaging.
In prior work, Antonopoulos et al. [1] established PCAT attenuation–based metrics (FAI) as imaging surrogates of coronary inflammation and provided biological rationale linking vascular inflammation to perivascular fat remodeling. In parallel, Lin et al. [18] demonstrated that PCAT radiomics can capture spatial patterns beyond voxel intensity alone and may provide incremental discrimination compared with attenuation-only measures in specific clinical settings. Against this background, our study addresses a complementary question by focusing on the patient-level association between LDL-C status and multidimensional PCAT radiomic phenotypes (texture/heterogeneity). Accordingly, the radiomic signatures reported here should be interpreted as exploratory imaging biomarkers that may complement—rather than replace—established attenuation/FAI measures, pending further validation.
Within the framework of residual cardiovascular risk, low-grade inflammation
often explains adverse outcomes in statin-treated patients more effectively than
residual cholesterol burden [32, 33]. A large percutaneous coronary intervention
(PCI) registry showed that high-sensitivity C-reactive protein (hs-CRP) levels
This study extends existing evidence by linking elevated LDL-C levels with PCAT not only through established attenuation patterns but also through novel radiomic signatures of clustering and heterogeneity. These textural features enhance the interpretability of imaging along the lipid–inflammation axis. Importantly, they may serve as external imaging correlates of LDL-C elevation, potentially providing early warning signs of coronary inflammation beyond traditional lipid markers. However, given the single-center retrospective design and the absence of independent external validation, these radiomic signatures should be considered exploratory imaging biomarkers, and their performance and generalizability should be interpreted cautiously. With further validation, these features may evolve into adjunctive tools for therapeutic monitoring and risk stratification. Prospective multicenter studies with independent external validation and outcome follow-up are required to establish generalizability and clinical utility.
This single-center, retrospective study with a modest sample size (n = 150) may limit representativeness and generalizability. The machine-learning model was evaluated only internally without independent external validation; therefore, model optimism and potential overfitting cannot be fully excluded and the findings should be interpreted as exploratory. Residual confounding cannot be fully ruled out because multivariable adjustment was not performed, including potential effects of lipid-lowering therapy. In addition, although images were acquired on the same scanner using a standardized protocol, we did not perform formal radiomic reproducibility testing (e.g., ICC/test–retest) and did not assess reproducibility or harmonization across scanners/protocols. Finally, the analysis was cross-sectional and lacked outcome follow-up, precluding assessment of prognostic value and causal inference; the absence of histologic or molecular validation also limits definitive mechanistic interpretation. Future work should include multicenter external validation with longitudinal follow-up and, where feasible, biological validation to establish robustness, generalizability, and clinical utility.
Elevated LDL-C levels were significantly associated with increased spatial heterogeneity and high gray-level clustering in PCAT, providing imaging-based evidence of the LDL-C–PCAT association. These findings suggest that PCAT radiomic features may serve as external imaging phenotypes of lipid burden, offering more nuanced insight into the relationship between LDL-C and the local coronary microenvironment. Collectively, these radiomic features hold potential clinical value by supporting more precise assessment and management of coronary risk in patients with lipid dysregulation.
AUC, area under the curve; CAD, coronary artery disease; CCTA, coronary computed tomography angiography; FAI, fat attenuation index; GBM, gradient boosting machine; GLSZM, gray-level size zone matrix; HDL-C, high-density lipoprotein cholesterol; HU, hounsfield unit; LAD, left anterior descending artery; LCX, left circumflex artery; LDL, low-density lipoprotein; LDL-C, low-density lipoprotein cholesterol; PCAT, pericoronary adipose tissue; RCA, right coronary artery; ROI, region of interest; SHAP, shapley additive explanations; SVM, support vector machine.
The datasets used in this study are available from the corresponding author upon reasonable request.
FZ and XL designed and conducted the study. LY and XL performed PCAT segmentation and radiomics feature extraction using the CoronaryDoc platform and PyRadiomics. FZ and YZ performed the statistical analyses and developed the machine-learning workflow, including model training/validation and performance evaluation. FZ conducted model interpretation using SHAP analysis and drafted the manuscript. YY, ST, and FL screened patients, maintained the clinical database, coordinated patient identification and clinical data collection, and verified key clinical variables. XZ and XD designed the statistical analysis plan and optimized the modeling. NT, SZ, YX, and CZ assisted with image quality assessment, data curation, and data verification. LS and GS discussed and interpreted the data and revised the manuscript. All authors contributed to drafting and critical revision of the manuscript for important intellectual content, approved the final version, and agree to be accountable for all aspects of the work.
The study was carried out in accordance with the guidelines of the Declaration of Helsinki and approved by the Ethics Committee of Kunming Yan’an Hospital (Kunming, China; Approval No. 2023-083-01). Informed consent was waived due to the retrospective study design.
Not applicable.
The study was supported by Yunnan Provincial Department of Science and Technology-Kunming Medical University-Joint Project (NO. 202301AY070001-178), Yunnan Provincial Department of Science and Technology (NO. 202301AT070482), Kunming Health Science and Technology Talents Project (NO. 2023-SW(Leading talents)-03), Key Laboratory of Cardiovascular Disease of Yunnan Province (NO. 2018DG008), Kunming Health Research Project (NO. 20230901013).
The authors declare no conflicts of interest.
Supplementary material associated with this article can be found, in the online version, at https://doi.org/10.31083/RCM47037.
References
Publisher’s Note: IMR Press stays neutral with regard to jurisdictional claims in published maps and institutional affiliations.