


 , Nino Cocco 2, Francesco Gentile 3, Francesco Chietera 4, Leonardo De Luca 5
1 Division of Cardiology, South Padova General Hospitals, 35043 Monselice, Italy
2 Operative Research Unit of Emodinamica, Fondazione Policlinico Universitario Campus Bio-Medico, 00128 Roma, Italy
3 Fondazione Toscana Gabriele Monasterio, Division of Cardiovascular Medicine, 56126 Pisa, Italy
4 Cardiology Unit, IRCCS University Hospital of Bologna, Policlinico S. Orsola, 40138 Bologna, Italy
5 Division of Cardiology, Fondazione IRCCS Policlinico San Matteo, 27100 Pavia, Italy
Abstract
Atherosclerotic plaque progression and rupture are the chief determinants of acute coronary syndromes and long-term outcomes in obstructive coronary artery disease (CAD). Residual risk persists despite intensive low-density lipoprotein-lowering and contemporary secondary prevention, because vascular inflammation and microstructural frailty often remain unresolved. At the bedside, the lesion that precipitates infarction is seldom the tightest but rather the most unstable. This review integrates the mechanistic chain, from endothelial dysfunction and retention/oxidation of apolipoprotein B lipoproteins to maladaptive innate and adaptive immunity, failed efferocytosis with necrotic core expansion, and biomechanical forces that thin and fatigue the fibrous cap, with their corresponding in vivo imaging phenotypes. Thus, this study aimed to examine how intravascular ultrasound (IVUS), optical coherence tomography (OCT), and near-infrared spectroscopy (NIRS), alongside coronary computed tomography angiography (CCTA), cardiac magnetic resonance (CMR), and positron emission tomography (PET), characterize these processes and enable longitudinal tracking of disease activity. Moreover, we briefly discuss emerging therapeutic implications of plaque imaging, focusing on how improved identification of vulnerable plaque features may inform risk stratification. Finally, we evaluate therapies that extend beyond lipid-lowering to modulate inflammatory and immune pathways, reinforce cap stability, and support a risk-adapted, trajectory-based pathway in which serial imaging and biomarkers guide treatment intensity. Together, these advances support a shift in clinical practice from stenosis-centered revascularization to imaging-guided, vulnerability-centered prevention.
Keywords
- coronary artery disease
- atherosclerosis
- plaque rupture
- intravascular imaging
- optical coherence tomography
- coronary computed tomography angiography
Coronary artery disease (CAD) remains the leading cause of morbidity and mortality worldwide, affecting more than 180 million people [1, 2]. Its clinical expression, including myocardial infarction and stroke, arises from a chronic and multifactorial atherosclerotic process in which lipid accumulation, inflammation, and structural destabilisation converge within the arterial wall. Over the past decade, there has been a progressive focus shift from the traditional “stenosis hypothesis”, related to the identification of flow-limiting stenoses, to a broader “plaque hypothesis”, which emphasizes biological vulnerability and mechanical instability [3].
Atherosclerosis is a chronic inflammatory disorder initiated by endothelial dysfunction, lipid retention and oxidation, and maladaptive immune responses at sites of disturbed shear stress [4]. Subendothelial lipid accumulation and oxidation trigger monocyte recruitment and macrophage activation, foam-cell formation, and release of pro-inflammatory cytokines. With persistent inflammation, a necrotic core develops beneath a thinning fibrous cap, rendering the lesion prone to rupture and thrombosis; this transition from stability to instability is driven by macrophage-mediated inflammation, protease activation, and impaired clearance of apoptotic cells. Recent advances have clarified the lipid–inflammation interplay: oxidised lipoproteins, hypoxia, and metabolic stress amplify macrophage activation and efferocytosis failure, establishing a self-perpetuating inflammatory loop within the plaque [5]. Immune activation, metabolic dysfunction, and clonal haematopoiesis further sustain vascular inflammation and residual cardiovascular risk despite optimal lipid-lowering therapy [6]. Inflammation therefore complements—not replaces—lipid-driven mechanisms, bridging metabolic and immune pathways in atherogenesis [5, 6].
Overall, this evidence reframes atherosclerosis as a dynamic, evolving, and systemic disease, and no longer a mere consequence of luminal obstruction. It is therefore crucial for clinicians to evaluate how biological, mechanical, and inflammatory processes intertwine to drive plaque progression and rupture, opening therapeutic avenues that shift the clinical focus from treating stenosis to stabilising vulnerability, setting the stage for the mechanistic, imaging, and translational sections that follow.
Atherosclerosis begins at sites of disturbed shear stress with endothelial
dysfunction, increased permeability to apolipoprotein-B lipoproteins, and their
subendothelial retention. Retained low-density lipoproteins undergo oxidative and
enzymatic modification and trigger innate immune activation, monocyte
recruitment, foam-cell formation, and a cytokine milieu sustained by
NF-
Vascular smooth-muscle cells migrate and synthesize extracellular matrix, forming an initially stabilising fibrous cap; with persistent inflammatory and oxidative cues, they undergo apoptosis, matrix turnover accelerates, and phenotypic switching emerges towards macrophage-like, fibroblast-like, and osteochondrogenic states that contribute to plaque enlargement and calcification [8]. Endothelial cells exposed to disturbed flow activate mechanosensitive transcriptional programmes, including endothelial-to-mesenchymal transition, linking haemodynamics to regional vulnerability patterns [8, 9].
Impaired efferocytosis leads to secondary necrosis and expansion of the lipid
core, while sustained cytokine signalling—such as interleukin-6 and tumour
necrosis factor-
Plaque destabilization occurs when a lipid-rich but clinically silent lesion morphs into a biologically active substrate prone to rupture and thrombosis. It reflects converging axes—immune activation, extracellular-matrix degradation, programmed cell death, and haemodynamic stress—acting on an already remodelled wall. Persistent inflammation thins and weakens the fibrous cap by inducing smooth-muscle cell apoptosis and upregulating proteases that degrade collagen and elastin, culminating in structural failure [11].
Defective efferocytosis enlarges the necrotic core and creates an acellular, highly thrombogenic space enriched with tissue factor and cholesterol crystals. Hypoxia within this core activates hypoxia-inducible pathways, drives fragile neovascularisation, and favours intraplaque haemorrhage that accelerates growth of the lipid–necrotic zone [12].
The immune system both drives and executes this transition. Beyond classical
cytokine signalling, trained immunity and clonal haematopoiesis generate
hyper-responsive myeloid and T-cell populations that sustain inflammation and
prime a prothrombotic milieu—often before any mechanical disruption is evident
[13]. Two phenotypes dominate acute events. Rupture-prone plaques exhibit thin
caps (
The transition from angiographic to intravascular imaging has profoundly reshaped our understanding of coronary atherosclerosis, transforming it from a disorder defined by luminal stenosis to a dynamic, multifactorial disease of the vessel wall. Invasive imaging techniques such as intravascular ultrasound (IVUS), optical coherence tomography (OCT), and near-infrared spectroscopy (NIRS) have emerged as complementary instruments that reveal the microstructural, compositional, and biological determinants of plaque vulnerability. These modalities collectively provide a mechanistic link between arterial remodeling, inflammatory activation, and biomechanical instability, allowing a direct visualization of coronary pathology that bridges clinical practice with molecular vascular biology.
IVUS represents the foundational technique for quantitative plaque evaluation.
Its deep tissue penetration permits the assessment of global plaque burden,
vessel remodeling, and the extent of compensatory enlargement—a phenomenon
central to the concept of “outward remodeling” in high-risk lesions. The
landmark PROSPECT and PROSPECT II trials [18, 19] established that lesions with a
plaque burden
Beyond geometry, modern implementations such as radiofrequency-IVUS and hybrid
NIRS–IVUS have enabled tissue characterization and quantification of necrotic
cores. However, the spatial resolution of IVUS (100–150 µm) remains
insufficient to resolve the thin fibrous caps (
OCT provides a nearly histological level of resolution (10–15 µm), revealing the fine structure of the fibrous cap, macrophage infiltration, and microchannels within the intima [22]. Unlike IVUS, which provides depth and volumetric context, OCT excels at detailing the microanatomy of vulnerability. Through its capacity to identify TCFAs, lipid pools, macrophage accumulations, and calcified nodules, OCT has become the gold standard for the in vivo identification of unstable plaques [23]. In patients with acute coronary syndromes, pooled OCT analyses show that the cumulative burden of traditional risk factors tracks with multiple hallmarks of vulnerability—including TCFA, macrophages, microvessels, and cholesterol crystals—with plaque rupture increasing and erosion decreasing as risk factors accumulate [24, 25]. The technique has refined the diagnostic differentiation between plaque rupture, erosion, and calcified nodule—the triad underlying most acute coronary syndromes. Moreover, longitudinal OCT studies have provided dynamic insights into therapy-induced remodeling: statins, PCSK9 inhibitors, and anti-inflammatory agents have been shown to induce measurable cap thickening and attenuation of macrophage signals, highlighting the method’s potential as a surrogate biomarker of therapeutic efficacy [26]. Still, OCT’s limited tissue penetration restricts visualization of deep lipid cores and positive remodeling, necessitating multimodal integration for full assessment.
NIRS contributes a biochemical dimension by detecting lipid-rich necrotic cores
through their distinct absorption spectra. The lipid core burden index (LCBI),
particularly the maxLCBI4mm, has emerged as a quantitative marker of lipid
accumulation and inflammatory activity within plaques [27]. In PROSPECT II, the
integration of NIRS-derived maxLCBI4mm
Recent work has extended these modalities from static visualization to functional assessment of biomechanics. IVUS- and OCT-derived reconstructions can now estimate ESS and plaque structural stress (PSS), linking local mechanical forces with tissue remodelling. Low ESS fosters endothelial activation, lipid retention, and macrophage infiltration, whereas steep PSS gradients at plaque shoulders favour microfissuring and cap rupture [30].
When combined with NIRS-derived lipid content, stress mapping yields a three-dimensional view of how compositional and biomechanical vulnerabilities co-localise within the same lesion. In parallel, co-registration with computational fluid dynamics enables a form of “digital pathology” of the coronary tree—charting patterns of disease activity rather than lumen contours alone. In aggregate, high-resolution imaging and physics-based analysis are transforming the catheter laboratory into a functional observatory that stratifies risk beyond luminal obstruction and aligns intervention with the evolving biology of atherosclerosis—while hinting at an even finer layer of activity yet to be captured [24, 25, 31].
Non-invasive imaging has moved beyond depicting luminal narrowing to a multidimensional appraisal of plaque biology. Coronary computed tomography angiography (CCTA), positron emission tomography (PET), and cardiac magnetic resonance (CMR) now quantify plaque geometry, composition, and the perivascular milieu, offering insight into inflammation, calcification, and remodelling before events occur.
CCTA remains the anchor modality for identifying high-risk features. Low
attenuation (
CMR adds a tissue-specific lens that extends assessment beyond the coronaries.
High-intensity plaques on T1-weighted imaging—commonly expressed as a
plaque-to-myocardium ratio (PMR)
PET provides the functional counterpart to structural imaging. 18F-FDG
highlights metabolically active macrophages, whereas fluorine-18 sodium fluoride
(18F-NaF) localises microcalcification and extracellular-matrix turnover;
focal NaF uptake in non-stenotic plaques predicts myocardial infarction,
revealing subclinical disease activity [46]. Hybrid PET/CT and PET/MRI
co-register tracer uptake with morphology (including FAI), and novel
probes—68Ga-DOTATATE targeting somatostatin-receptor-2 on activated
macrophages and 18F-Galacto-RGD binding
The trajectory is integrative. Multimodality pipelines combine CT’s anatomical coverage with PET’s molecular specificity or CMR’s tissue characterisation to build a biological atlas of coronary disease; computational fluid-dynamics modelling from CT geometries maps regions of low shear that co-localise with increased NaF uptake, uniting biomechanics and inflammation within a single framework [49]. Translationally, CCTA-derived plaque burden and FAI serve as surrogates of residual inflammatory risk to guide anti-inflammatory escalation or lipid-lowering intensification, while quantified NaF activity offers a pharmacodynamic endpoint for agents targeting calcification and oxidative stress [50].
The ultimate goal of cardiovascular imaging is increasingly to intercept changes in biological activity before it manifests clinically, based on the non-invasive markers described above.
Structural hallmarks remain necessary yet insufficient; instability originates in dynamic processes—cellular inflammation, oxidative stress, hypoxia, and matrix breakdown—that may antedate visible morphological change by weeks to months [51]. Within the catheter laboratory, invasive molecular imaging has reframed assessment from static inspection to dynamic surveillance.
OCT–NIRF co-localises cap microstructure with signals of inflammation, oxidative stress, and endothelial disruption, delineating macrophage-rich and fibrin-laden regions that explain why a thin cap is biologically fragile [52, 53]. Intravascular photoacoustic imaging (IVPA) merges optical excitation with ultrasonic detection to generate spectroscopic maps of lipid, cholesterol, and haemoglobin; hybrid IVPA–IVUS systems now achieve sub-75-µm axial resolution and can track oxygenation dynamics in real time, exposing pockets of metabolic instability aligned with known mechanisms of progression [54, 55].
Fluorescence lifetime imaging integrated with OCT adds biochemical contrast for collagen integrity and macrophage density at near-histological precision, turning the catheter lab into a living laboratory of atherogenesis with pharmacodynamic read-outs that extend beyond morphology. Aligned with an activity-before-event paradigm, OCT microstructural signatures (thin cap, broad lipid arc, macrophages) act as biological surrogates of instability: in the 5-year extension of CLIMA, the co-occurrence of all four prespecified features identified a small subgroup at markedly higher risk, and even any TCFA alone remained predictive of long-term adverse outcomes [51].
Non-invasively, hybrid PET–CT and PET–MRI move from anatomy to pathway-level biology.
Rather than reiterating FDG/NaF, the emphasis here is on specific
tracers—68Ga-DOTATATE (somatostatin receptor-2 on activated macrophages)
and 18F-Galacto-RGD (
Against this backdrop, CCTA supplies the whole-heart scaffold on to which these molecular signals can be mapped: it quantifies total plaque burden and phenotype, detects high-risk non-obstructive disease that functional tests miss, and—crucially—can be repeated to track progression and treatment response, enabling disease-centred, personalised prevention [3]. Technical advances—photon-counting detectors and deep-learning reconstructions—are further improving spatial/spectral fidelity at lower dose, while artificial intelligence (AI)-driven quantitative plaque analysis standardises measurement and facilitates fusion with PET and MRI read-outs [58].
The next step is integration across scales. Invasive read-outs (OCT–near-infrared fluorescence (NIRF), IVPA) define the plaque microenvironment, while PET–CT/PET–MRI and radiomic CCTA capture the systemic milieu. A concise biological activity index that merges fluorescence intensity, PET tracer uptake, and CT-derived inflammatory metrics treats vulnerability as a continuum rather than a binary state [37, 59].
Superimposing computational fluid dynamics on CT geometries then maps endothelial shear and PSS onto these molecular signals, shifting assessment from categorical to temporal, indicating not only where risk resides, but when it is most likely to manifest—thereby informing follow-up cadence and the timing of therapy escalation.
Quantitative thresholds commonly adopted across imaging modalities for plaque vulnerability assessment are summarized in Table 1 (Ref. [14, 19, 20, 21, 23, 27, 28, 32, 33, 34, 37, 46, 60, 61]).
| Modality & metric | Working anchor (threshold) | Biological signal captured | Reference | |
| 1 | OCT – minimum fibrous-cap thickness | Cap fragility/TCFA (collagen & SMC depletion) | [14, 20, 21, 23, 60] | |
| 2 | NIRS – maxLCBI4mm | Lipid-rich necrotic core/macrophage activity | [19, 27, 28] | |
| 3 | CCTA – low-attenuation plaque & burden | Low attenuation |
Necrotic-core surrogates and overall plaque burden linked to ischaemia/events | [32, 33, 34, 61] |
| 4 | CCTA – perivascular FAI | Peri-coronary inflammation (residual risk) | [37] | |
| 5 | PET – focal 18F-NaF uptake | Presence of focal uptake | Active microcalcification/matrix turnover predictive of events | [46] |
Acronym key. OCT, optical coherence tomography; NIRS, near-infrared spectroscopy; LCBI, lipid core burden index; CCTA, coronary computed tomography angiography; PAV, percent atheroma volume; FAI, fat attenuation index; PET, positron emission tomography; 18F-NaF, fluorine-18 sodium fluoride; TCFA, thin-cap fibroatheroma; HU, Hounsfield units.
The foregoing sections establish that distinct technologies often describe the
same biology; what is missing is a shared quantitative language that allows
results to be compared, pooled, and tracked over time. A pragmatic core set of
cross-modality anchors already exists: cap thickness
On that foundation, a Biological Activity Index can fuse morphology (cap/burden), lipid–inflammation (LCBI, FAI, NaF), and, where available, lesion biomechanics into a single, interoperable score—reported per lesion and per patient—to complement clinical risk and guide treatment intensity. It is crucial that the index be serial by design: the same metrics acquired with the same protocols allow for objective and reliable measurement of change, rather than being inferred. Coronary lesions have time-dependent characteristics, alternating cycles of activation and quiescence over the course of months. The prognostic outcome of a lesion depends not only on how it is assessed from the baseline snapshot, but rather on the direction and speed of change, which have prognostic weight [63].
After infarction, serial IVUS shows that non-culprit lesions can drift toward a higher-risk phenotype, with TCFA becoming more frequent, necrotic core expanding, and only modest changes in lumen area—indicating that adverse biology may worsen before stenosis visibly does [64, 65]. Moreover, vulnerability is not confined to tight lesions: across angiographic severities, the absolute number of TCFAs is greatest in non-severe segments, even though relative prevalence, cap thinning, plaque burden, and positive remodelling intensify as stenosis increases [66, 67]. Together, these observations support a trajectory-aware reading of follow-up imaging—flagging lesions whose microstructural risk is rising despite limited anatomical progression and prioritising earlier reassessment or treatment intensification when vulnerability signals accumulate [68].
Where available, computational shear and structural-stress maps can be overlaid on CT geometries to identify segments where mechanical fatigue and inflammatory activity co-localise, aligning surveillance and intervention with the window in which risk is most likely to declare itself [69]. Finally, plaque vulnerability should be viewed as an emergent property of interacting imaging signals, underscoring the limitations of single-marker interpretations in clinical practice [70].
The Fig. 1 shows how multimodality imaging allows a comprehensive identification of HRP.
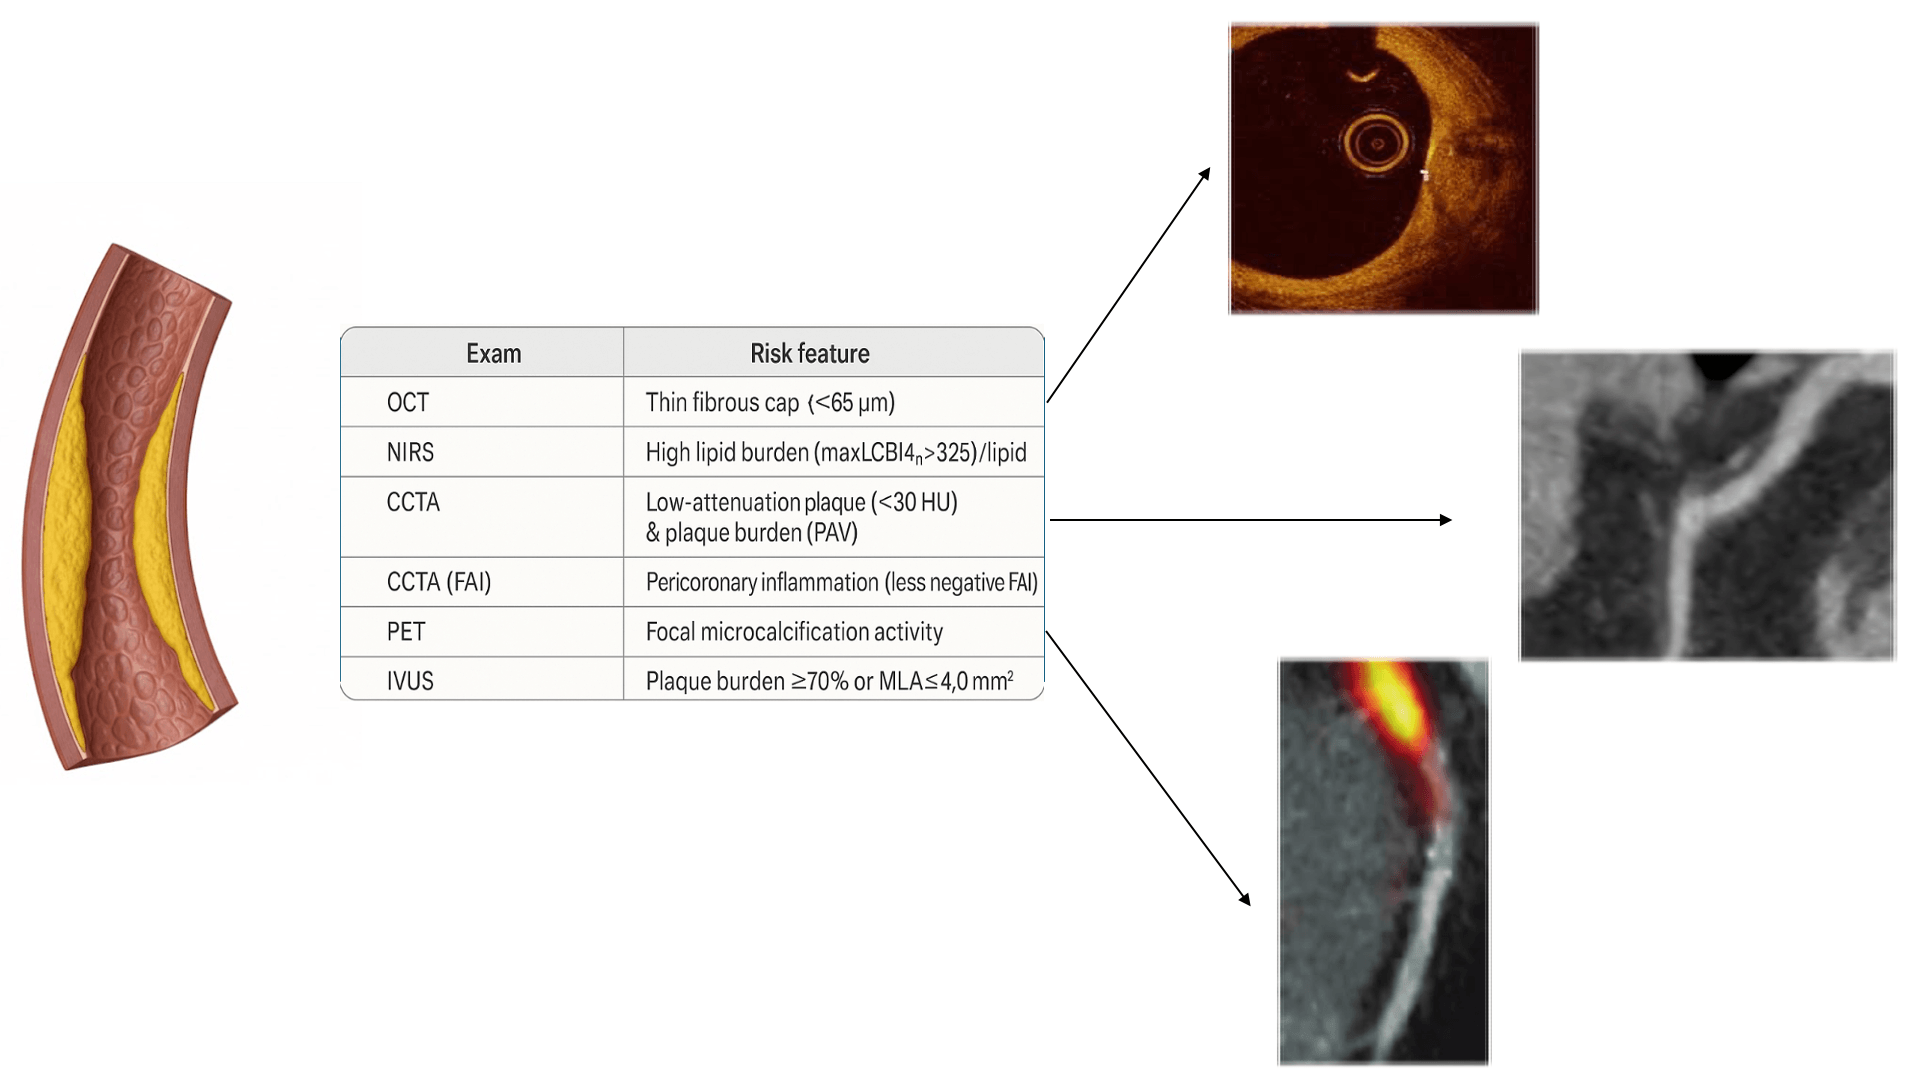 Fig. 1.
Coronary imaging modalities and high-risk plaque (HRP) features. OCT, optical coherence tomography; NIRS, near-infrared spectroscopy; LCBI, lipid core burden index; CCTA, coronary computed tomography angiography; PAV, percent atheroma volume; FAI, fat attenuation index; PET, positron emission tomography; HU, Hounsfield units; IVUS, intravascular ultrasound; MLA, minimal lumen area.
Risk-adapted care turns multimodal imaging into two levers of action: how intensively we treat and how closely we follow up.
After infarction, adverse biology can worsen before lumen change is obvious—serial intravascular imaging shows rising TCFA prevalence, expanding necrotic core, and only modest minimal lumen area (MLA) change—so lesions with biological deterioration deserve earlier reassessment even when angiographic progression is limited [64, 65]. At baseline, the cumulative weight of vulnerability features should guide prevention intensity across modalities: on OCT, thin cap with macrophage signal identifies higher risk [14, 52]; on NIRS–IVUS, high lipid content within large-burden plaques raises patient-level risk despite modest lesion-level PPV [27, 60]; on CCTA, low-attenuation burden and positive remodelling add risk beyond stenosis, while CT-FFR co-localises anatomy and physiology to prioritise management [33, 34, 40].
A simple triage schema is practical:
(i) Escalate now when multiple high-risk features cluster or worsen on
short-interval imaging, prioritising high-intensity lipid lowering, strict
blood-pressure targets, smoking cessation, weight and fitness goals, and—in
selected post-myocardial infarction patients—evidence-based anti-inflammatory
therapy [71, 72, 73, 74]. For lesions with negative fractional flow reserve (FFR
(ii) Intensified surveillance when vulnerability signals are present but stable, with earlier revisit if symptoms evolve; choice of modality should reflect the signal to be tracked, e.g., cap on OCT, lipid burden on NIRS–IVUS, low-attenuation volume or FAI on CCTA [53, 77, 78];
(iii) Standard surveillance when high-risk features are absent, and physiology is reassuring, reserving re-imaging for clinical change or risk-factor relapse.
Follow-up should be trajectory-aware rather than schedule-driven: shortening intervals when microstructural risk accumulates despite limited anatomical change, and lengthening them when cap thickens, and inflammatory surrogates abate under optimal therapy [47, 53].
Where available, overlays of endothelial shear and structural-stress maps on CT geometries can flag segments where mechanical fatigue and inflammatory activity co-localise, aligning surveillance and the timing of therapy with the window in which risk is most likely to declare itself [69].
Because the set of imaging features is more informative than any single sign, reports should summarize and integrate both the feature burden and a trajectory class (worsening, stable, improving). This could provide a concise and reproducible report that allows clinicians to use imaging biology information in bedside decisions and support shared decision-making, given the modest positive predictive value at the lesion level in natural history studies.
Neoatherosclerosis, a pathologic evolution of neointimal healing, may drive late stent failure and even very late stent thrombosis. OCT typically reveals lipid-rich or calcific neointima, macrophage accumulations, microvessels, or plaque-rupture–like features, as illustrated in Fig. 2 (Ref. [79]).
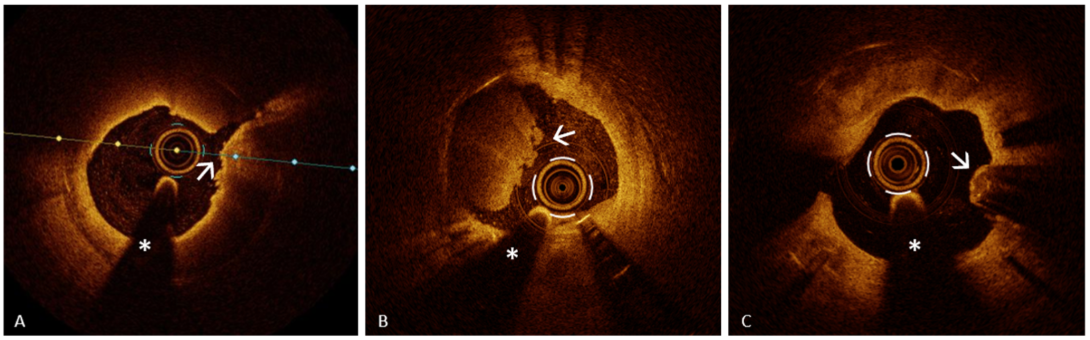 Fig. 2.
OCT features of neoatherosclerosis. Representative OCT examples of neoatherosclerosis showing key morphologic patterns observed in late stent failure. (A) Plaque rupture–like morphology (arrow) with overlying microthrombi in lipid-rich neointima with a thin fibrous cap. (B) Definite OCT erosion with mixed thrombus (arrow) in fibrocalcific neoatherosclerosis. (C) Eruptive calcified nodule with irregular luminal surface (arrow) in diffuse calcific neoatherosclerosis. The asterisk indicates the guidewire artifact. Reproduced from Buonpane A et al. [79]. Licensed under CC BY 4.0. OCT, optical coherence tomography; CN, calcified nodule; PR, plaque rupture.
AI is redefining cardiovascular imaging by turning plaque evaluation into a predictive and quantitative science [80, 81]. In REVEALPLAQUE, deep-learning analysis of CCTA closely matched IVUS–based references, enabling standardized, serial quantification of total and component plaque from routine scans [82]. Fully automated, end-to-end pipelines likewise classified stenosis and high-risk features with strong agreement and near–real-time turnaround, supporting scalable reporting without manual post-processing [83]. A contemporary systematic review corroborates high concordance and promising risk prediction but highlights heterogeneity and the need for prospective, outcome-linked validation; meanwhile, a transformer model for CT-based plaque erosion showed high diagnostic performance, pointing to non-invasive, potentially stent-sparing phenotyping pending multi-vendor external confirmation [84, 85].
AI-based plaque quantification has emerged as one of the most immediate clinical applications. In the Decisions for Treating Coronary Disease are Changed in Patients Evaluated with Quantified Plaque Analysis (DECODE) study, the integration of automated plaque analysis (AI-QCPA, HeartFlow, Inc., Redwood City, CA, USA) into standard CCTA interpretation led to reclassification of clinical management in two-thirds of patients, primarily by intensifying preventive therapy. This reclassification was most pronounced in cases with higher calcium burden or NCP, demonstrating that quantitative, standardized metrics can expose disease activity overlooked by conventional visual reading [86].
Across CCTA, IVUS, and OCT, AI-enabled pipelines show high concordance with intravascular reference measurements and reduce reader dependence, enabling standardized plaque-burden reporting and supporting efforts to derive population-, age-, and sex-specific reference curves for individualized risk assessment [87, 88].
From a technical standpoint, convolutional neural networks now automate segmentation, plaque composition analysis, and CAD-RADS 2.0 classification, integrating perivascular adipose-tissue mapping as a surrogate marker of coronary inflammation [84]. Machine-learning computation of computed tomography–derived fractional flow reserve (CT-FFR) now couples anatomic and physiologic readouts from the same CCTA scan; in acute chest pain cohorts, it was feasible in ~70% and tracked clinical outcomes for triage, though it adds little when frank plaque rupture is present [89]. In stable/suspected CAD, on-site CT-FFR would substantially cut downstream testing, reclassify management in ~50–60%, and reduce unnecessary invasive coronary angiography—supporting CT-first pathways (CRESCENT I/II). In parallel, radiomic models harvest texture signatures of lipid heterogeneity, microcalcification, and inflammatory tone, delivering a non-invasive “digital phenotype” of vulnerability that complements CT-FFR for risk-adapted care [90].
Longitudinal applications of AI are enabling temporal mapping of disease activity. Dynamic models quantify the velocity of change in fibrous-cap thickness, lipid burden, or perivascular attenuation, turning static imaging into a continuous measure of biological motion. This approach operationalizes the concept of Trajectory-Anchored Quantification, where the rate and direction of biological change—rather than absolute morphology—encode the patient’s evolving risk [69].
The integration of imaging data with biochemical and clinical variables forms the basis for risk-adapted prediction. Federated learning and cloud-based analytics allow multicenter algorithm refinement without sharing raw data, preserving privacy while improving generalizability. AI-driven platforms can thus merge quantitative imaging, inflammatory markers, and clinical context into dynamic models that predict residual risk and therapeutic response in near real time [91, 92].
Within the cath lab, AI for IVOCT now automates lumen/plaque segmentation and component typing, reducing interpretation time and variability and moving IVOCT toward real-time decision support, though broad clinical uptake still requires multicenter validation and workflow integration [93]. In parallel, where adherence to guideline-directed therapy is high, the incremental prognostic yield of “vulnerable plaque” markers over stenosis/burden appears modest—arguing that AI phenotyping should complement, not replace, systematic prevention [78]. Nonetheless, AI-guided quantitative CCTA plaque staging adds long-term prognostic value beyond calcium and stenosis and provides a practical substrate for therapy monitoring and risk tracking [94].
Still, current AI has temporary constraints: heterogeneous plaque definitions and acquisition protocols, small single-vendor datasets, and opaque models limit generalizability and trust—multicenter, outcome-linked validation (e.g., the Oxford Risk Factors And Non-invasive Imaging (ORFAN) study) and standardized ground truths are needed [90]. Bias can also enter at sampling, labeling, and deployment, yielding uneven performance across sex, race, and socioeconomic groups; equity-by-design, transparent reporting, and continuous auditing are essential to mitigate harm [90, 95].
Key areas where AI integrates into the coronary imaging workflow are outlined in Table 2 (Ref. [69, 82, 83, 84, 86, 89, 95]).
| Workflow touchpoint | AI capability (examples) | Primary benefit | Reference | |
| 1 | CCTA plaque segmentation & quantification | REVEALPLAQUE; end-to-end pipelines for stenosis/HRP | Fast, standardized plaque metrics at scale | [82, 83, 84] |
| 2 | Physiology from anatomy | ML CT-FFR computed from CCTA | Coupled anatomic-physiologic triage; fewer unnecessary ICA | [89] |
| 3 | Longitudinal monitoring & trajectory mapping | Dynamic models (cap thickness, lipid burden, FAI) | Turns snapshots into rates of change for follow-up planning | [69, 95] |
| 4 | Management impact & reclassification | Automated AI-QCPA (DECODE) | Up-tiers prevention; reclassifies care | [86] |
Acronym key. AI, artificial intelligence; ML, machine learning; CCTA, coronary computed tomography angiography; HRP, high-risk plaque; CT-FFR, computed tomography–derived fractional flow reserve; ICA, invasive coronary angiography; FAI, fat attenuation index; DECODE, Decisions for Treating Coronary Disease are Changed in Patients Evaluated with Quantified Plaque Analysis (DECODE) study.
Atherosclerosis is a dynamic, systemic disease: biology and biomechanics—not stenosis alone—govern risk. Multimodal imaging (IVUS/OCT/NIRS, CCTA/FAI, CMR, PET) converges on the same pathology, and clustered features outperform any single sign. Standardized thresholds and serial, reproducible acquisition convert imaging into a biomarker of change; a concise Biological Activity Index unifying cap integrity, lipid–inflammation (LCBI, FAI, NaF), and mechanical stress can anchor cross-modality reporting. Care should be risk-adapted: escalate when signals cluster or worsen, tighten surveillance when stable, and de-intensify as biology cools; prophylactic PCI remains investigational beyond trials. AI already scales quantification and trajectory mapping, but must be transparent, audited for bias, and validated across vendors and populations.
The paradigm shifts from the vulnerable plaque to the vulnerable patient—and the vulnerable time—enabling personalized prevention that is measurable, repeatable, and clinically actionable.
FAV conceived and designed the study and drafted the manuscript. NC, FG, GS, FC, and LDL contributed to data interpretation and critically revised the manuscript for important intellectual content. All authors read and approved the final manuscript. All authors meet the ICMJE authorship criteria and agree to be accountable for all aspects of the work.
Not applicable.
We would like to thank Dr. Greta Schiavon for her contribution to the manuscript in the field of artificial intelligence and image analysis.
This research received no external funding.
The authors declare no conflict of interest. Leonardo De Luca is serving as one of the Editorial Board members and Guest Editor of this journal. We declare that Leonardo De Luca had no involvement in the peer review of this article and has no access to information regarding its peer review. Full responsibility for the editorial process for this article was delegated to Zhonghua Sun and Brian Tomlinson.
References
Publisher’s Note: IMR Press stays neutral with regard to jurisdictional claims in published maps and institutional affiliations.