

 , Di Wang 1,†, Fangfang Li 1, Ying Wang 1, Zhenyu Wang 1, Kangde Zeng 1, Shujun Yan 1, Danyang Liu 1, Degen Pei 1, Yue Cao 1, Yang Yu 1, Ling Weng 1, Enze Jin 1,*
1 Department of Cardiovascular Medicine, The Fourth Affiliated Hospital of Harbin Medical University, 150081 Harbin, Heilongjiang, China
†These authors contributed equally.
Abstract
Lipoprotein(a) (Lp(a)) has emerged as an independent determinant of risk among the multiple factors associated with atherosclerotic cardiovascular disease. This study, which utilized data from the northern Chinese population, aimed to investigate the association between Lp(a) and conventional coronary heart disease risk factors. Furthermore, the Lp(a) level may reflect the severity of vascular stenosis in individuals affected by coronary heart disease, offering valuable insights for future clinical interventions.
A total of 778 individuals who underwent coronary angiography and were later confirmed to have coronary artery disease from September 2022 to December 2024 participated in this study. Baseline clinical information collected for each participant included sex, age, height, weight, smoking and drinking habits, history of hypertension, diabetes status, lipid parameters, and other pertinent medical characteristics.
The analysis demonstrated that progressive increases in circulating Lp(a) levels were associated with a pronounced escalation in vascular stenosis, a pattern reaching statistical significance (p < 0.05). An evaluation of the receiver operating characteristic (ROC) curve indicated that Lp(a) yielded an area under the curve (AUC) value of 0.673 (95% confidence interval (CI): 0.630–0.716; p < 0.001) for identifying severe coronary artery stenosis. A significant correlation (r = 0.306; p < 0.0001) was revealed in the assessment of the correlation between Lp(a) and the Gensini score. An independent association was observed between Lp(a) levels and the number of diseased coronary arteries (odds ratio (OR) = 1.029, 95% CI: 1.017–1.041; p < 0.001). Furthermore, individuals with higher Gensini scores exhibited significantly increased Lp(a) levels. Notably, patients with chronic total occlusion (CTO) lesions or multi-vessel disease also demonstrated markedly higher Lp(a) levels (all p values < 0.001).
Elevated Lp(a) concentrations are linked to increased severity of coronary heart disease, as evidenced by higher Gensini scores. Elevated Lp(a) concentrations are also associated with an increased occurrence of multi-vessel coronary artery stenosis or total occlusions.
Keywords
- lipoprotein(a)
- atherosclerotic cardiovascular disease
- Gensini score
Owing to its strong genetic determination, lipoprotein(a) exerts an independent influence on the risk of atherosclerotic cardiovascular disease [1]. It is primarily synthesized in the liver and can interact with vascular endothelial cells and cellular receptors, leading to impaired vascular endothelial barrier function. Within the low-density lipoprotein (LDL) variant Lp(a), the core apolipoprotein B100 is covalently connected to apolipoprotein(a) through disulfide linkages, thereby establishing a hydrophilic surface that encapsulates the molecule. The Lp(a) gene, located on the long arm of chromosome 6 at 6q2.6–2.7, encodes apolipoprotein(a) [2]. Although the precise physiological role of lipoprotein(a) remains undefined, the evolutionary resemblance between apolipoprotein(a) and plasminogen implies a potential anti-fibrinolytic function and involvement in prothrombotic pathways. Lp(a) may promote the development of a vulnerable plaque phenotype, thereby accelerating the occurrence of atherosclerotic thrombotic events [3, 4]. Furthermore, it promotes the expression of pro-inflammatory cytokines and induces cell apoptosis [5, 6]. Collectively, these pathways lead to endothelial dysfunction and inflammatory responses, which play a central role in the pathogenesis and advancement of atherosclerosis, a core mechanism underlying cardiovascular injury.
Elevated Lp(a) demonstrated an independent association with a higher likelihood
of acute myocardial infarction in a Chinese cohort, even when LDL concentrations
remained within the normal physiological range. In South Asian and Latino
cohorts, elevated Lp(a) was likewise linked to an increased likelihood of
myocardial infarction, independent of classic cardiovascular risk contributors
[7, 8]. Genetic profiles from a large population dataset indicated that the Lp(a)
locus shows the most pronounced association with coronary artery disease,
supported by variation analyses involving more than sixty thousand cases and over
one hundred thirty thousand controls [9]. The LipidCardio study, a
cross-sectional observational analysis, demonstrated that the group with raised
Lp(a) levels had greater SYNTAX-I and Gensini scores [10]. In a different
large-scale cross-sectional investigation, Lp(a) demonstrated an independent
association with high Gensini scores (
Owing to the complex molecular structure of Lp(a), particularly its polymorphic characteristics, the determination of its circulating levels has remained a significant challenge. Persistent variability in reproducibility among analytical approaches has underscored the need for standardized reference materials, a harmonization effort formally advanced by the IFCC to promote greater methodological alignment [12]. Recently, a novel immunoturbidimetric assay utilizing a five-point calibration approach exhibited minimal measurement bias for apo(a) allele size and quantifies Lp(a) in nmol/L [13, 14]. Nevertheless, the clinical application of Lp(a) continues to face challenges, including the lack of universally accepted critical thresholds for diverse global populations [15, 16]. Understanding lipoprotein(a) may provide essential guidance for the proactive management of traditional risk factors. Across six randomized trials comprising 444 participants, consolidated evidence indicated that treatment with mipomersen produced marked reductions in LDL-C, non-HDL-C, apolipoprotein B, and Lp(a) [17]. Network meta-analysis indicated that different types and doses of statins had no significant effect on Lp(a) levels [18]. Similarly, ezetimibe treatment had no significant effect on plasma Lp(a) [19]. In a meta-analysis of 14 randomized controlled trials (RCTs), niacin has been shown to reduce lipoprotein(a) levels [20]. Notably, an additional ~15% reduction in plasma Lp(a) levels was observed when a PCSK9 inhibitor was added to ongoing niacin therapy [21]. This study, utilizing data from the northern Chinese population, aims to investigate the association between Lp(a) and conventional coronary heart disease risk factors. Furthermore, this method explores the relationship between Lp(a) concentrations and the degree of coronary artery stenosis, contributing meaningful information for subsequent clinical applications.
This study was conducted with support from the Outstanding Young Project at the
Fourth Affiliated Hospital of Harbin Medical University. Between September 2022
and December 2024, a total of 778 patients diagnosed with coronary artery disease
(CAD), defined by coronary angiography showing
The severity of coronary artery stenosis was quantified using the Gensini
scoring system, which calculates scores by multiplying specific lesion segments
by their corresponding coefficients. The overall total of the values from all
segments forms the final score. Supplementary Table 1 provides detailed
scores and associated coefficients for each vessel. CAD was classified as follows
(1) Mild CAD
The level of Lp(a) was determined by latex-enhanced immunoturbidimetry. The reagent kit was provided by Shanghai Huizhong Biotechnology, China (CZ011) Co., Ltd. The approval number is National Medical Device Import 20152401845. Main components: R1: PBS buffer solution, R2: latex particle suspension; R1: glycine buffer solution, R2: anti-human Lp(a)-IgG sensitized latex; R1: Tris buffer solution, PEG6000, R2: anti-Lp(a) monoclonal antibody sensitized latex; R1: glycine buffer solution, bovine serum albumin, R2: Lp(a) antibody sensitized particles. The within-batch coefficient of variation of the latex-enhanced immunoturbidimetric method is less than 5.5%.
Sample addition: Take a microcentrifuge tube and add each component as shown in the table below:
Additives: Blank tube, Reagent 1 (R1): 240 µL, Distilled water: 5 µL.
Measuring tube, Reagent 1 (R1): 240 µL, Sample: 5 µL.
(1) Incubation: After thorough mixing, incubate at 37 °C in a constant temperature device for 3–5 minutes.
(2) Add Reagent Two: Add 60 µL of Reagent Two (R2) to each tube respectively, and mix well.
(3) Reading: Continue incubating at 37 °C. Read the absorbance A1 30 seconds after adding R2 and then read the absorbance A2 after an exact reaction time of 300 seconds.
(4) Calculation: Calculate the absorbance change value
Data analysis was conducted utilizing R software (R Core Team,4.2.0, 2022,
Vienna, Austria). Categorical variables within the baseline characteristics of
the study participants were displayed as frequencies and proportions. To assess
whether data were normally distributed, the Kolmogorov-Smirnov test was applied.
The presentation of continuous data was determined by their distribution:
normally distributed variables are expressed as mean
A total of 778 patients with coronary atherosclerosis were enrolled in this
study. The study cohort was divided into three groups according to the severity
of coronary artery stenosis, as determined by quantitative evaluation methods.
Table 1 provides an overview of the baseline characteristics for the respective
groups. Analysis revealed that patients with higher HDL levels tended to exhibit
milder coronary stenosis, with statistical significance (p
| Mild CAD (n = 379) | Moderate CAD (n = 200) | Severe CAD (n = 199) | p value | |
| Male, n (%) | 226 (59.63%) | 130 (65.00%) | 127 (63.82%) | 0.378 |
| Age, years | 64.00 (58.00, 69.00) | 64.50 (57.00, 70.00) | 65.00 (58.00, 71.00) | 0.323 |
| BMI | 24.71 |
24.85 |
25.16 |
0.202 |
| Cr, umol/L | 69.30 (59.40, 80.60) | 71.85 (60.58, 83.98) | 70.60 (60.30, 85.60) | 0.153 |
| TC, mmol/L | 4.72 |
4.67 |
4.88 |
0.495 |
| TG, mmol/L | 1.53 (1.14, 2.28) | 1.49 (1.09, 2.16) | 1.59 (1.12, 2.25) | 0.600 |
| HDL, mmol/L | 1.04 (0.91, 1.21) | 1.00 (0.87, 1.16) | 0.98 (0.84, 1.10) | |
| LDL, mmol/L | 2.61 |
2.72 |
2.86 |
0.044 |
| Lp(a), mg/dL | 13.50 (7.50, 24.20) | 16.55 (8.40, 33.90) | 25.40 (14.20, 46.80) | |
| Hypertension, n (%) | 211 (55.67%) | 123 (61.50%) | 132 (66.33%) | 0.040 |
| Diabetes, n (%) | 62 (16.36%) | 54 (27.00%) | 60 (30.15%) | |
| Smoker, n (%) | 148 (39.05%) | 81 (40.50%) | 75 (37.69%) | 0.847 |
| Gensini score | 10.00 (5.00, 18.00) | 38.00 (32.00, 44.00) | 65.00 (56.00, 80.00) | |
| CTO, n (%) | 0 (0%) | 31 (15.50%) | 99 (49.75%) | |
| Single-vessel disease, n (%) | 194 (51.19%) | 27 (13.50%) | 13 (6.53%) |
Data are presented as IQR, mean
Abbreviations: CAD, coronary artery disease; Cr, Creatinine; TC, Total cholesterol; TG, triglycerides; HDL, high-density lipoprotein cholesterol; LDL, low-density lipoprotein cholesterol; Lp(a), lipoprotein(a); CTO, obstructive coronary artery lesions.
The Lp(a) levels of patients were evaluated across groups categorized by varying
degrees of coronary artery stenosis, followed by inter-group comparisons.
Statistically significant differences were identified between the mild and
moderate stenosis groups, the moderate and severe stenosis groups, as well as the
mild and severe stenosis groups (p
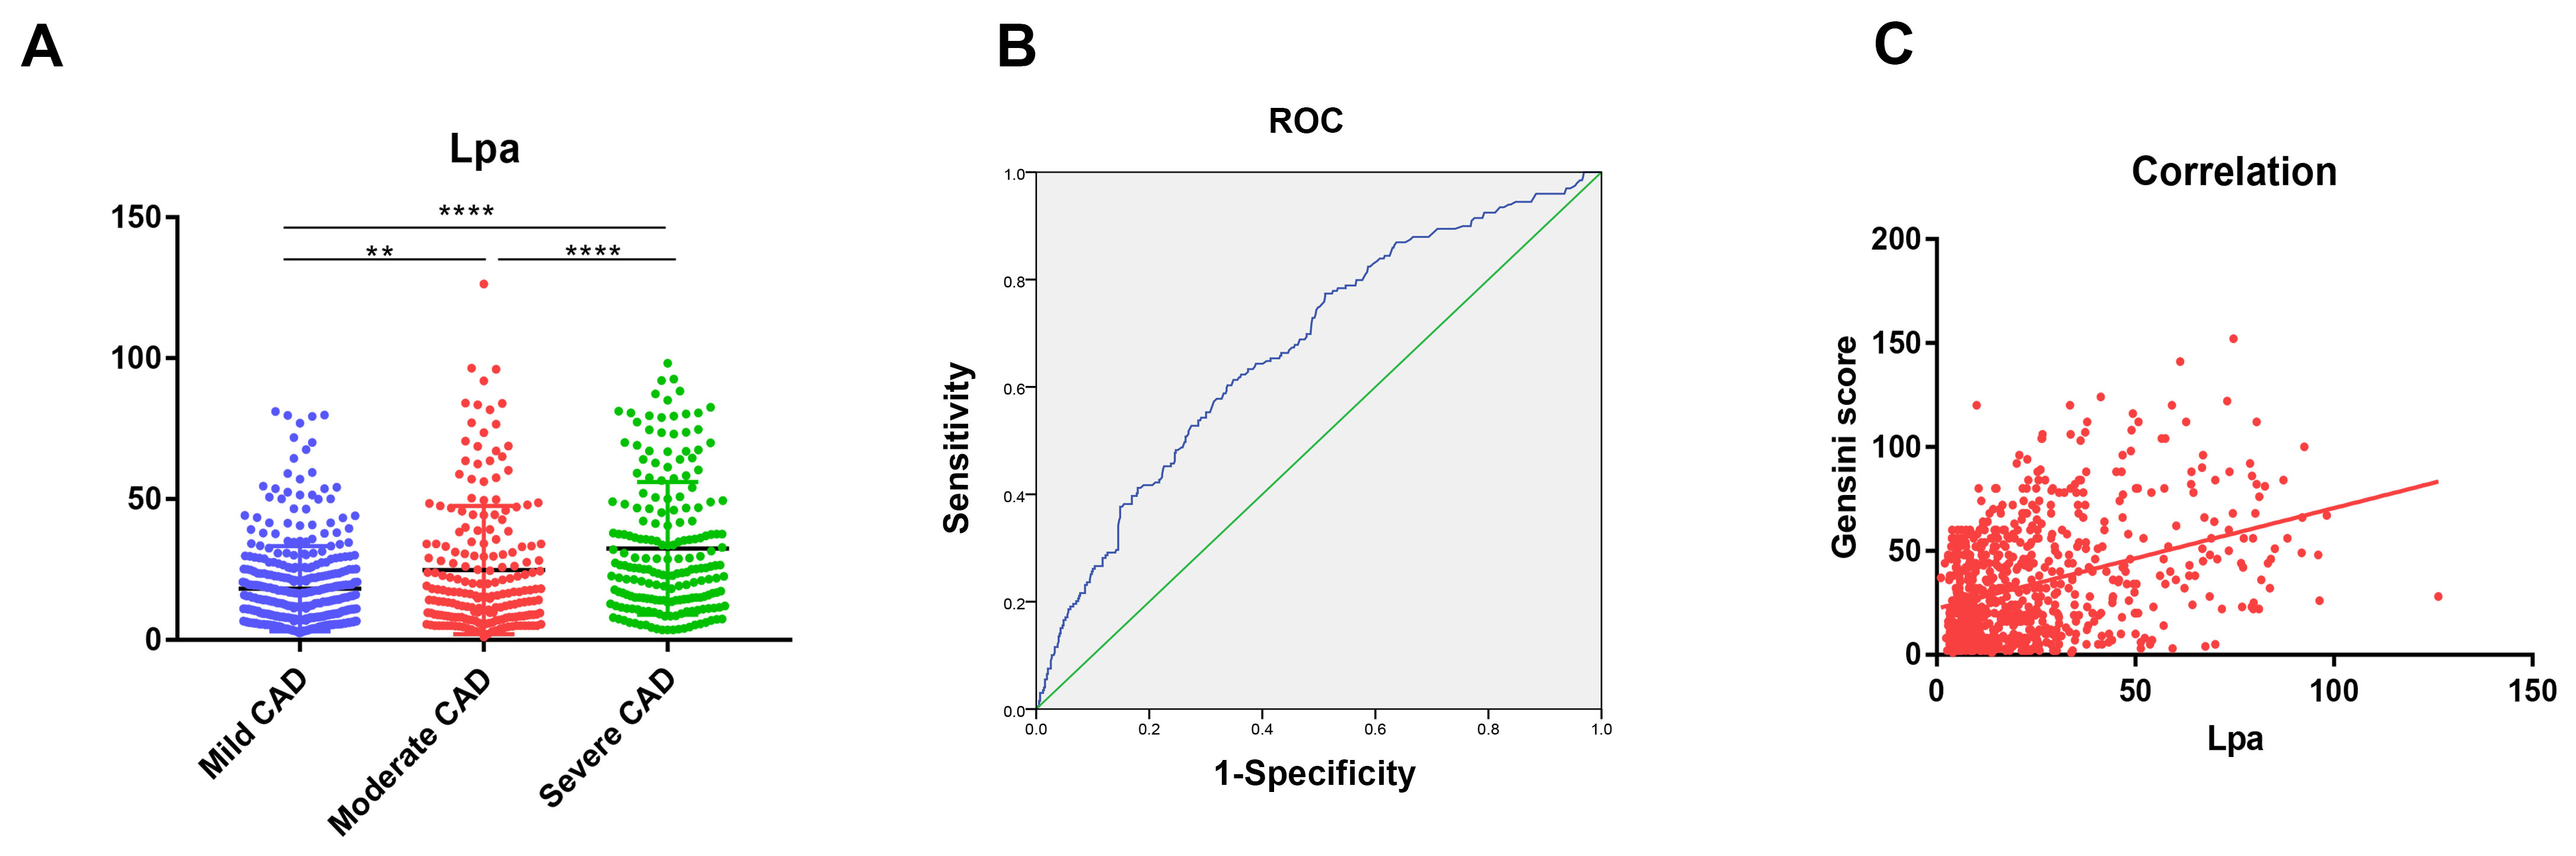 Fig. 1.
The levels of Lp(a) and correlations in patients with different
degrees of coronary artery stenosis. (A) Mild, Moderate and Severe group was
shown in Dot plot. ** p
| Correlation R | p value | |
| Age, years | 0.097 | 0.007 |
| TC, mmol/L | 0.137 | |
| TG, mmol/L | –0.054 | 0.133 |
| HDL, mmol/L | –0.012 | 0.743 |
| LDL, mmol/L | 0.203 | |
| Gender | –0.009 | 0.796 |
| Hypertension | 0.002 | 0.964 |
| Diabetes | 0.002 | 0.945 |
| Smoker | –0.017 | 0.645 |
Abbreviations: TC, Total cholesterol; TG, triglycerides; HDL, high-density lipoprotein cholesterol; LDL, low-density lipoprotein cholesterol.
This study applied multivariate logistic regression analysis to examine the
relationship between Lp(a) and the severity of coronary artery stenosis in
patients with coronary heart disease (Table 3). Analyses indicated that elevated
Lp(a) levels were significantly linked to severe coronary artery stenosis, with
an odds ratio of 1.036 (95% confidence interval: 1.026–1.046, p
| Model A | Model B | Model C | ||||
| OR (95% CI) | p value | OR (95% CI) | p value | OR (95% CI) | p value | |
| Mild CAD | 1 | 1 | 1 | |||
| Moderate CAD | 1.021 (1.011, 1.031) | 1.022 (1.012, 1.031) | 1.015 (1.005, 1.026) | 0.005 | ||
| Severe CAD | 1.036 (1.026, 1.046) | 1.037 (1.027, 1.046) | 1.029 (1.017, 1.041) | |||
Model A: unadjusted; Model B: controlled for hypertension and diabetes; Model C: controlled for diabetes, hypertension, HDL, LDL, single-vessel disease, and CTO. Abbreviations: CI, confidence interval; OR, odds ratio; TG, triglycerides; HDL, high-density lipoprotein cholesterol; LDL, low-density lipoprotein cholesterol; CTO, chronic total occlusion.
As detailed in Table 4, patient grouping was performed according to Lp(a)
levels, in accordance with the methodology described earlier. The baseline
characteristics of these groups are presented in Table 4. In individuals with
higher Lp(a) levels, elevations in total cholesterol and low-density lipoprotein
cholesterol were concurrently observed. Furthermore, individuals with higher
Gensini scores exhibited significantly increased Lp(a) levels. Notably, patients
with chronic total occlusion (CTO) lesions or multi-vessel disease also
demonstrated markedly higher Lp(a) levels (all p values
| Low-Lp(a) (n = 579) | High-Lp(a) (n = 199) | p value | |
| Male, n (%) | 357, 61.66% | 126, 63.32% | 0.678 |
| Age, years | 64.00 (57.00, 70.00) | 64.00 (57.00, 70.00) | 0.603 |
| BMI | 25.00 |
24.46 |
0.065 |
| Cr, umol/L | 70.10 (60.10, 80.90) | 71.20 (60.00, 90.30) | 0.098 |
| TC, mmol/L | 4.64 |
5.07 |
|
| TG, mmol/L | 1.54 (1.12, 2.27) | 1.42 (1.12, 2.16) | 0.266 |
| HDL, mmol/L | 1.01 (0.88, 1.17) | 1.02 (0.88, 1.17) | 0.858 |
| LDL, mmol/L | 2.59 |
3.03 |
|
| Lpa, mg/dL | 11.90 (7.10, 19.40) | 47.90 (36.90, 66.80) | |
| Hypertension, n (%) | 344, 59.41% | 122, 61.31% | 0.638 |
| Diabetes, n (%) | 130, 22.45% | 46, 23.12% | 0.847 |
| Smoker, n (%) | 222, 38.34% | 82, 41.21% | 0.475 |
| Gensini score | 22.00 (8.00, 45.00) | 44.00 (22.00, 74.00) | |
| CTO, n (%) | 79, 13.64% | 51, 25.63% | |
| Single-vessel disease, n (%) | 198, 34.20% | 36, 18.09% |
Data are presented as IQR, mean
Abbreviations: Cr, Creatinine; TC, Total cholesterol; TG, triglycerides; HDL, high-density lipoprotein cholesterol; LDL, low-density lipoprotein cholesterol; Lp(a), lipoprotein(a); CTO, obstructive coronary artery lesions.
It was observed that Lp(a) levels varied markedly with the complexity of coronary artery lesions, as evaluated by the Gensini score, in patients with coronary atherosclerotic heart disease. Specifically, individuals with a Gensini score greater than 50 show markedly elevated Lp(a) concentrations. Additionally, when Lp(a) exceeds 30 mmol/L, the severity and progression of coronary artery disease were notably exacerbated. The current literature provides a comprehensive account of Lp(a)’s role in atherosclerosis, yet global standardization of its measurement methods remains inadequate, limiting the precise identification of high-risk individuals. Furthermore, existing evidence supporting the clinical benefits of reducing Lp(a) levels is limited. It is expected that emerging therapeutic approaches in the coming years will provide innovative solutions for managing this condition [23].
A 2022 Consensus Statement by the European Atherosclerosis Society critically reviewed contemporary evidence on the involvement of Lp(a) in atherosclerotic cardiovascular disease. The 2022 Consensus Statement delivered current recommendations for detecting and managing elevated Lp(a) and evaluated the possibility of integrating it into comprehensive cardiovascular risk assessments. Evidence further establishes Lp(a) as a pathogenic factor contributing to adverse cardiovascular outcomes. Ongoing and future clinical trials specifically targeting Lp(a) reduction are deemed critical for establishing its clinical utility and therapeutic value in the prevention and management of cardiovascular disease [24]. Ethnic background may impact Lp(a) concentrations. Analysis of 460,506 middle-aged individuals from the UK Biobank cohort revealed a significant positive relationship between Lp(a) concentrations and the incidence of atherosclerotic cardiovascular disease, with the study population exhibiting a median Lp(a) level of 19.6 nmol/L [25]. Additionally, the 2017 European prospective cohort study assessed Lp(a) concentrations in over 52,000 participants, with a median value of approximately 21 nmol/L [26]. This pattern is clearly reflected in the UK Biobank dataset, which demonstrates a progressively increasing median concentration of Lp(a) among distinct ethnic populations, following the order of Chinese, White, South Asian, and Black individuals, with respective measured levels of 16, 19, 31, and 75 nmol/L [27].
In this research, patients were classified into three groups according to the severity of their coronary heart disease. The median lipoprotein(a) levels in those with mild, moderate, and severe disease were recorded at 13.5, 16.55, and 25.4 mg/dL (equivalent to roughly 34.8, 42.8 and 65.6 nmol/L), respectively. Overall, the median lipoprotein(a) concentration across all study participants was 16.9 mg/dL, or approximately 43.6 nmol/L. The data indicate that participants in our cohort exhibited relatively elevated Lp(a) levels compared to previous reports. One possible explanation for this discrepancy could be the ethnic homogeneity of our study population, as all participants were of Han Chinese descent. Research has demonstrated that certain East Asian populations commonly exhibit an increased number of Kringle IV type 2 repeat copies within the Lp(a) gene, which has been linked to decreased Lp(a) production [28]. Moreover, scientific evidence indicates that various factors—including single nucleotide polymorphisms, epigenetic modifications affecting promoter activity, and other mechanisms—may also contribute to the regulation of Lp(a) levels [29]. While genetic factors chiefly determine Lp(a) levels, other modulatory influences may also contribute, environmental factors may exert a modest modulatory effect in the context of underlying genetic backgrounds. For instance, consumption of diets high in saturated and trans fatty acids has been associated with slight increases in Lp(a) levels. Among individuals diagnosed with hyperlipoproteinemia, the use of L-carnitine, coenzyme Q10, and Xuezhikang corresponded with notable decreases in plasma Lp(a) concentrations [30]. Various natural agents, such as pectin, Ginkgo biloba extract, flaxseed, red wine, resveratrol, and curcumin derivatives, have been observed to exert a limited yet measurable effect in lowering elevated Lp(a) concentrations [31]. Certain chronic medical conditions, such as renal insufficiency, may also induce minor alterations in Lp(a) concentrations [32, 33]. Furthermore, multiple studies have reported that both endogenous elevations and exogenous administration of human growth hormone can lead to increased circulating Lp(a) levels [34, 35]. Our study has several limitations. Comprehensive dietary histories were not obtained from participants, and the use of oral hormonal therapies was not included in the analysis, both of which may influence Lp(a) measurements and potentially contribute to discrepancies when compared with previous investigations. To enhance the generalizability of future findings, it is recommended to conduct multi-center, multi-platform studies incorporating diverse ethnic populations, thereby improving sample heterogeneity and substantially increasing the total sample size.
The pivotal role of Lp(a) in cardiovascular disease development has led to
heightened research interest. Elevated concentrations of lipoprotein(a) are
closely linked to a heightened risk of aortic valve calcification. Evidence
suggests that overexpression of the Lp(a) gene may promote this pathological
process, potentially through mechanisms such as disruption of the transforming
growth factor-
In our present study, only the Gensini score was employed as the primary evaluation metric, while the SYNTAX score was not included. This limitation will be addressed in future research. Several additional limitations should also be acknowledged. Lp(a) levels were assessed at a single time point, and potential fluctuations over time were not considered, which may have influenced the study outcomes. Moreover, although adjustments were made for recognized confounding factors, the possibility of residual confounding cannot be excluded and may affect the reliability of the observed associations. Some important confounding factors such as estimated glomerular filtration rate, high-sensitivity C-reactive protein, and the use of antihypertensive drugs were not included in the multivariate model, which may reduce the specificity and sensitivity of the model’s diagnosis. In our study, each candidate underwent only a single Lp(a) test, which could be affected by the intra-batch and inter-batch coefficient of variation of the reagent kit, the time difference between sample collection and testing, and the storage time at 4 °C, potentially leading to errors in Lp(a) test data. This is a single-center, cross-sectional study. In the future, multi-center and multi-platform candidates should be included to expand the range of participants and increase the generalizability of the predictive value. Future studies will conduct follow-up of patients, and major cardiovascular events will be further included in the follow-up outcomes to enhance the clinical predictive results of the article.
Elevated concentrations of Lp(a) correspond to greater coronary heart disease severity, as indicated by higher Gensini scores. Individuals exhibiting elevated Lp(a) levels have a greater incidence of multi-vessel coronary stenosis or total occlusions, supporting its importance as an independent contributor to coronary heart disease. Consequently, timely and aggressive management may be crucial in mitigating the risk of cardiovascular complications in this patient group.
Lp(a), lipoprotein (a); LDL, Low-density lipoprotein; HDL, High-density lipoprotein; CTO, chronic total occlusion; ASCVD, atherosclerotic cardiovascular disease; CAD, Coronary artery disease; Cr, Creatinine; TC, Total cholesterol; TG, triglycerides.
Data and Materials can obtain on website: https://www.scidb.cn/en/s/bARni2.
LZ and DW conceived and designed the study and drafted the manuscript. YW, FL, ZW and KZ were responsible for data organization and the proofreading the background section after it is written. SY, DL, DP, YC and EJ performed the coronary angiography (CAG) procedures and were responsible for proofreading the written part after the discussion. LW and YY conducted statistical analyses and were responsible for proofreading the result section after it is written. The final manuscript has been thoroughly reviewed and endorsed by all contributing authors. All authors read and approved the final manuscript. All authors have participated sufficiently in the work and agreed to be accountable for all aspects of the work.
The execution of this cross-sectional observational study fully complied with the requirements set forth in the Declaration of Helsinki. Notably, during this study, no data pertaining to patient privacy or identifiable characteristics were collected. In accordance with ethical guidelines, after being fully informed about the study’s nature, purpose, as well as the associated risks and benefits, ethical approval for this study was granted by the Ethics Committee of the Fourth Affiliated Hospital of Harbin Medical University (Approval No.Ethics Review 2025-35), and all participants provided written informed consent voluntarily.
Sincere gratitude is extended to all investigators and participants who contributed to this project.
This research was supported by the Outstanding Young Project at the Fourth Affiliated Hospital of Harbin Medical University (Grant number is HYDSYYXQN2023012) .
The authors declare that they have no competing interests.
Supplementary material associated with this article can be found, in the online version, at https://doi.org/10.31083/RCM46656.
References
Publisher’s Note: IMR Press stays neutral with regard to jurisdictional claims in published maps and institutional affiliations.