


 , Haimei Zhu 2,†, Feiyi Sun 3, Zuowei Pei 1,2,4,*
1 Department of Central Laboratory, Central Hospital of Dalian University of Technology, 116033 Dalian, Liaoning, China
2 Faculty of Medicine, Dalian University of Technology, 116024 Dalian, Liaoning, China
3 Health Medical Department, Central Hospital of Dalian University of Technology, 116033 Dalian, Liaoning, China
4 Department of Cardiology, Central Hospital of Dalian University of Technology, 116033 Dalian, Liaoning, China
†These authors contributed equally.
Abstract
Cardiovascular disease (CVD) remains the leading cause of mortality among various diseases in China, with both the incidence and mortality rates associated with CVD continuing to rise. Obesity, as a key risk factor for CVD, exacerbates the disease burden. Concurrently, the rates of overweight and obese individuals among Chinese college students have been increasing annually. Maximal fat oxidation (FATmax)-intensity training, which precisely identifies the optimal exercise intensity for fat oxidation, can effectively improve cardiorespiratory function, regulate metabolic levels, and reduce the risk of chronic diseases. Thus, this study aimed to investigate the effects of FATmax-intensity exercise on cardiovascular disease risk factors in obese college students and to explore the associated underlying mechanisms.
A longitudinal single-group pre–post experimental design was adopted, with a 12-week intervention conducted on 24 obese college students. Measurements and comparisons of body composition, biochemical indicators, blood parameters, cardiorespiratory function, oxidative stress-related indicators, and immunoinflammatory cytokines were performed before and after the intervention.
The results demonstrated that FATmax-intensity training significantly reduced the body weight, body mass index (BMI), body fat percentage, waist-to-hip ratio, abdominal adipose tissue, subcutaneous fat, resting heart rate, endothelin-1 (ET-1), C–X–C chemokine receptor 1 (CXCR1), CXCR2, granulocyte–macrophage colony-stimulating factor (GM-CSF), interferon-gamma (IFN-γ) and interleukin-33 (IL-33) (p < 0.05) values in participants, while significantly increasing peak oxygen uptake (peak VO2), anaerobic threshold, the ratio of forced expiratory volume in one second to forced vital capacity (FEV1/FVC), maximal mid-expiratory flow (MMEF), endothelial nitric oxide synthase (eNOS), and vascular endothelial growth factor (VEGF) (p < 0.05).
These findings provide preliminary evidence that applying FATmax-intensity exercise improves body composition, oxidative stress indicators, immunomodulatory anti-inflammatory function, and reduces cardiovascular disease risk in young obese populations, thereby providing the foundation for further research on the effects of FATmax-intensity exercise on other cardiovascular risk factors and potential mechanisms.
Keywords
- aerobic exercise
- obesity
- cardiovascular risk factors
- oxidative stress
Cardiovascular diseases (CVD) are the leading cause of death globally and constitute a major public health challenge. They not only compromise individuals’ health and shorten lifespan, but also substantially reduce patients’ quality of life. In addition, they place a significant burden on global healthcare systems due to the high medical costs associated with their management [1]. The CVD burden is particularly severe in China, where it has consistently remained the leading cause of death among both urban and rural residents. By 2023, the number of CVD patients in China was estimated to reach 330 million, with no indication of a turning point in the growing disease burden [2]. Obesity, being one of the key pathogenic risk factors for CVD, can directly drive its onset and progression through metabolic and inflammatory pathways [3]. However, the current global prevalence of obesity is alarming: in 2021, approximately 211 million adults aged 25 and above were overweight or obese, accounting for nearly half of the global adult population [4]. Moreover, the issue of obesity among Chinese college students is becoming increasingly prominent and showing a continuous upward trend [5, 6].
Aerobic training, which focuses on aerobic metabolism, has been widely validated as an effective intervention for enhancing cardiorespiratory function, improving metabolic indicators, and reducing the risk of chronic diseases such as obesity and CVD [7, 8]. It has been established as a crucial measure for the primary prevention of CVD [9]. To maximize the fat-reducing effects of aerobic training, Jeukendrup and Achten [10] introduced the concept of “maximal fat oxidation (FATmax)-intensity” in 2001. This refers to the individualized exercise intensity corresponding to the peak rate of fat oxidation that occurs during a given time period [10]. FATmax training typically involves low to moderate exercise intensity efficiently mobilizing fat for energy, promoting fat reduction while preserving lean body mass, thereby effectively improving body composition, making it particularly suitable for overweight and obese populations [11, 12, 13].
In summary, given the high incidence and growing burden of CVD, the rising prevalence of obesity among college students, and the clear potential of FATmax training in improving cardiovascular health, this study aims to thoroughly investigate the relationship between FATmax-intensity training, obesity, and cardiovascular health outcomes. It will also explore the underlying mechanisms, providing a scientific basis for more precise and effective strategies for the prevention and intervention of CVD.
This study implemented a single-group pre-post design without a control group.
Participants were recruited from Dalian University of Technology. The inclusion
criteria included: primary obesity, body mass index (BMI)
Initially, 24 participants were recruited, but two withdrew for personal
reasons, resulting in a final sample size of 22 (18 males, four females), with an
average age of 22.14
All participants underwent cardiopulmonary exercise testing (CPET) through an incremental load exercise test. Oxygen consumption (VO2) and carbon dioxide output (VCO2) were continuously monitored to calculate the fat oxidation rate at each power level using the formula [15]:
Fat oxidation rate (g/min) = 1.6946
The heart rate corresponding to FATmax was set as the target exercise heart rate.
Starting from March 1, 2025, participants engaged in a 12-week aerobic exercise intervention, with progress tracked via a check-in system. The exercise frequency was 4–5 times per week, with each session lasting 45–60 minutes. Intensity was maintained within the target heart rate range corresponding to maximal fat oxidation. Participants could choose the mode of exercise based on their preference and circumstances, including running, rope skipping, yoga, etc. Additionally, starting from the 4th week of their training program, participants were encouraged to incorporate three sessions of resistance training per week. This was to overcome the weight loss plateaus and accelerate the improvement of cardiovascular risk factors. Each session included a 10-minute warm-up before exercise and a 10-minute cool-down after exercise to prevent injuries.
Body composition data, including body fat mass, muscle mass, body fat percentage, and visceral fat area, were assessed using a professional body composition analyzer X‑SCAN PLUS Ⅱ (Gyeongsan-si, Gyeongsangbuk-do, South Korea), manufactured by SELVAS Healthcare from South Korea. All participants emptied their bladders before undergoing body composition analysis. In the early morning, 5 mL of fasting venous blood was collected from each subject and injected into vacuum tubes containing an anticoagulant. Samples were analyzed using an automated biochemical analyzer ADVIA CHEMISTRY XPT, manufactured by SIEMENS from Japan, to obtain the values of biochemical indicators such as blood glucose, blood lipids (total cholesterol, triglycerides, high-density lipoprotein cholesterol, low-density lipoprotein cholesterol), and liver and kidney functions (alanine aminotransferase, aspartate aminotransferase, creatinine, urea nitrogen, etc.). Similarly, 2 mL of fasting venous blood was collected in the early morning in ethylenediaminetetraacetic acid dipotassium salt (EDTA-K2) anticoagulant tubes. Hematological parameters such as white blood cell count, red blood cell count, hemoglobin concentration, and platelet count in the blood samples were measured by the Mindray CAL8000 automatic hematology analysis line, which was manufactured by Mindray in Guangdong, China. The cardiopulmonary exercise testing of the subjects was conducted using the exercise cardiopulmonary tester Master Screen CPX (Hoechberg, Bavaria, Germany), manufactured by Vyaire Medical GmbH from Germany.
Before blood sample collection, participants fasted for at least 12 hours,
abstained from caffeine for 12 hours, and avoided alcohol and strenuous exercise
for 24 hours. Venous blood (5 mL) was collected in the morning under fasting
conditions, centrifuged at 1000
Data were statistically analyzed using GraphPad Prism 9.0 (GraphPad Software,
Inc., San Diego, CA, USA). The Shapiro-Wilk test was used for normality
testing. Data are presented as mean
After completing the training, the following significant changes in the body
weight composition were observed compared to before training: Significant
reductions were observed in body weight (p
| Pre | Post | p | |
| Weight (kg) | 100.5 |
93.91 |
|
| BMI (kg/m2) | 30.93 (29.97, 33.65) | 29.37 (27.51, 31.04) | |
| Body fat percentage%1 | 30.5 (28.2, 33.0) | 28.7 (26.5, 32.3) | 0.003** |
| Muscle mass1 (kg) | 25.63 |
23.09 |
0.091 |
| WHR1 | 0.88 (0.84, 0.89) | 0.85 (0.83, 0.88) | 0.001** |
| Visceral fat1 (kg) | 4.6 (3.6, 5.2) | 3.5 (3.2, 4.5) | |
| Subcutaneous fat1 (kg) | 25.63 |
23.09 |
|
| Basic metabolism1 (kcal) | 1820 |
1786 |
0.003** |
| Body water1 (kg) | 49 |
47.84 |
0.003** |
| Intracellular water1 (kg) | 30.8 (28.3, 33.4) | 30.6 (26.4, 32.8) | 0.001** |
| Extracellular water1 (kg) | 18.62 |
18.51 |
0.649 |
Abbreviation: BMI, body mass index; WHR, waist-to-hip ratio.
Data are means
Overall N = 22; 1N = 19 for indicated variables (3 participants missed the post-intervention body composition analysis due to personal reasons).
After the training period, significant reductions were observed in alanine
aminotransferase (ALT) (p
| Pre | Post | p | |
| ALT (U/L) | 36.5 (17.5, 62.5) | 26.0 (14.75, 36.0) | 0.008** |
| AST (U/L) | 24.5 (17.0, 39.25) | 19.0 (17.0, 22.0) | 0.007** |
| TP (g/L) | 76.65 (74.30, 79.48) | 75.6 (74.2, 79.0) | 0.753 |
| ALB (g/L) | 48.2 |
47.74 |
0.451 |
| GLB (g/L) | 28.62 |
28.7 |
0.636 |
| A/G | 1.7 |
1.65 |
0.143 |
| GGT (U/L) | 32.5 (19.0, 48.0) | 28.0 (16.5, 41.0) | 0.253 |
| ALP (U/L) | 81.0 (68.5, 104.8) | 80.5 (53.5, 91.5) | 0.007** |
| TBIL (µmol/L) | 15.4 (11.5, 21.05) | 12.55 (11.38, 16.93) | 0.086 |
| DBIL (µmol/L) | 5.9 (3.95, 7.17) | 4.5 (3.97, 6.0) | 0.112 |
| IBIL (µmol/L) | 10.22 |
9.10 |
0.196 |
| GLU (mmol/L) | 4.59 |
4.66 |
0.420 |
| UREA (mmol/L) | 4.73 (4.18, 5.18) | 4.40 (3.81, 5.27) | 0.301 |
| CREA (µmol/L) | 69.5 (62.78, 78.65) | 72.8 (64.95, 81.05) | 0.419 |
| eGFR-Cr [mL/(min·1.73 m2)] | 130.9 (120.3, 143.7) | 131.7 (114.9, 140.2) | 0.972 |
| UA (µmol/L) | 418 |
434.8 |
0.495 |
| T-CHOL (mmol/L) | 4.63 |
4.53 |
0.265 |
| TG (mmol/L) | 1.25 (0.94, 1.47) | 1.39 (0.94, 1.77) | 0.175 |
| HDL-C (mmol/L) | 1.01 (0.91, 1.24) | 0.96 (0.87, 1.14) | 0.061 |
| LDL-C (mmol/L) | 2.70 |
2.70 |
0.977 |
Abbreviation: ALT, alanine aminotransferase; AST, aspartate aminotransferase; TP, total protein; ALB, albumin; GLB, globulin; A/G, albumin/globulin ratio; GGT, gamma-glutamyl transferase; ALP, alkaline phosphatase; TBIL, total bilirubin; DBIL, direct bilirubin; IBIL, indirect bilirubin; GLU, glucose; UREA, Urea; CREA, creatinine; eGFR-Cr, estimated Glomerular Filtration Rate (by Creatinine); UA, uric acid; T-CHOL, total cholesterol; TG, triglycerides; HDL-C, high-density lipoprotein cholesterol; LDL-C, low-density lipoprotein cholesterol.
N = 22; Data are means
Following the training, significant reductions were identified in red blood cell
(RBC) (p
| Pre | Post | p | |
| WBC (×109/L) | 7.3 (6.78, 8.34) | 7.22 (6.72, 8.47) | 0.879 |
| Neu% | 55.2 |
55.5 |
0.855 |
| LY% | 36.22 |
35.72 |
0.746 |
| NLR | 1.68 (1.2, 1.86) | 1.52 (1.32, 1.97) | 0.848 |
| MO% | 5.8 (5.07, 6.55) | 6.2 (5.75, 6.55) | 0.238 |
| EO% | 1.85 (1.35, 2.67) | 1.85 (1.07, 2.6) | 0.629 |
| BASO% | 0.3 (0.1, 0.42) | 0.3 (0.2, 0.45) | 0.633 |
| Neu (×109/L) | 4.29 (3.28, 4.94) | 3.91 (3.58, 4.93) | 0.744 |
| LY (×109/L) | 2.62 (2.36, 3.05) | 2.47 (2.33, 2.79) | 0.913 |
| MO (×109/L) | 0.42 (0.37, 0.49) | 0.46 (0.39, 0.51) | 0.351 |
| EO (×109/L) | 0.15 (0.08, 0.21) | 0.13 (0.08, 0.22) | 0.850 |
| BASO (×109/L) | 0.02 (0.01, 0.03) | 0.02 (0.01, 0.03) | 0.306 |
| RBC (×1012/L) | 5.29 |
5.19 |
0.029* |
| HGB (g/L) | 155.9 |
152.2 |
0.006** |
| HCT (%) | 46.78 |
45.71 |
0.012* |
| MCV (fL) | 88.36 |
88.05 |
0.185 |
| MCH (pg) | 29.43 |
29.33 |
0.249 |
| MCHC (g/L) | 333.3 |
332.8 |
0.677 |
| RDW-CV (%) | 12.99 |
12.85 |
0.146 |
| RDW-SD (fL) | 41.94 |
41.31 |
0.615 |
| PLT (×109/L) | 272.5 (243.8, 294.3) | 254.5 (243, 285.3) | 0.192 |
| PCT (%) | 0.27 |
0.26 |
0.134 |
| MPV (fL) | 9.91 |
9.88 |
0.737 |
| PDW (%) | 16.05 (15.88, 16.3) | 16 (15.9, 16.23) | 0.818 |
Abbreviation: WBC, white blood cell; NEU, neutrophil; LY, lymphocyte; NLR, neutrophil-to-lymphocyte ratio; MO, monocyte; EO, eosinophil; BASO, basophil; RBC, red blood cell; HGB, hemoglobin; HCT, hematocrit; MCV, mean corpuscular volume; MCH, mean corpuscular hemoglobin; MCHC, mean corpuscular hemoglobin concentration; RDW-CV, red cell distribution width-coefficient of variation; RDW-SD, red cell distribution width-standard deviation; PLT, platelet; PCT, plateletcrit; MPV, mean platelet volume; PDW, platelet distribution width.
N = 22; Data are means
The training resulted in significant improvements in cardiorespiratory function.
Peak VO2 (p
| Pre | Post | p | |
| Peak VO2 (mL/min) | 26.63 |
31.49 |
|
| AT (mL/min) | 17.35 |
20.37 |
0.003** |
| Peak VO2/pred% | 79.27 |
88.95 |
0.003** |
| AT/Peak VO2% | 66.13 |
65.4 |
0.781 |
| VE/VCO2 slope (L/L) | 26.34 |
27.05 |
0.594 |
| Resting SBP (mmHg) | 132.5 (112, 138) | 120 (106.5, 129.8) | 0.068 |
| Resting DBP (mmHg) | 81.4 |
72.05 |
0.040* |
| SBP max (mmHg) | 181.2 |
184.1 |
0.672 |
| DBP max (mmHg) | 73.2 |
68.05 |
0.244 |
| Resting HR (1/min) | 96.25 |
88.4 |
0.039* |
| AT HR (1/min) | 136.6 |
144.3 |
0.086 |
| HRmax (1/min) | 191.4 |
196.2 |
0.344 |
| HRmax/pred% | 99.74 (92.74, 102.5) | 97.97 (96.87, 101) | 0.430 |
| FEV1/FVC% | 73.11 |
78.66 |
0.004** |
| MMEF (L/s) | 3.31 |
3.75 |
0.022* |
| PEF (L/s) | 7.05 |
7.60 |
0.189 |
| MVV (L/min) | 140.6 |
137.1 |
0.458 |
Abbreviation: Peak VO2, peak oxygen uptake; AT, anaerobic threshold; HR, heart rate; VE, minute ventilation; VCO2, carbon dioxide output; SBP, systolic blood pressure; DBP, diastolic blood pressure; FEV1, forced expiratory volume in one second; FVC, forced vital capacity; MMEF, maximal mid-expiratory flow; PEF, peak expiratory flow; MVV, maximum voluntary ventilation.
Data are means
N = 20 (2 participants missed the post-intervention cardiopulmonary exercise testing due to personal reasons).
After training, the endothelin-1 (ET-1) level was significantly decreased
(p
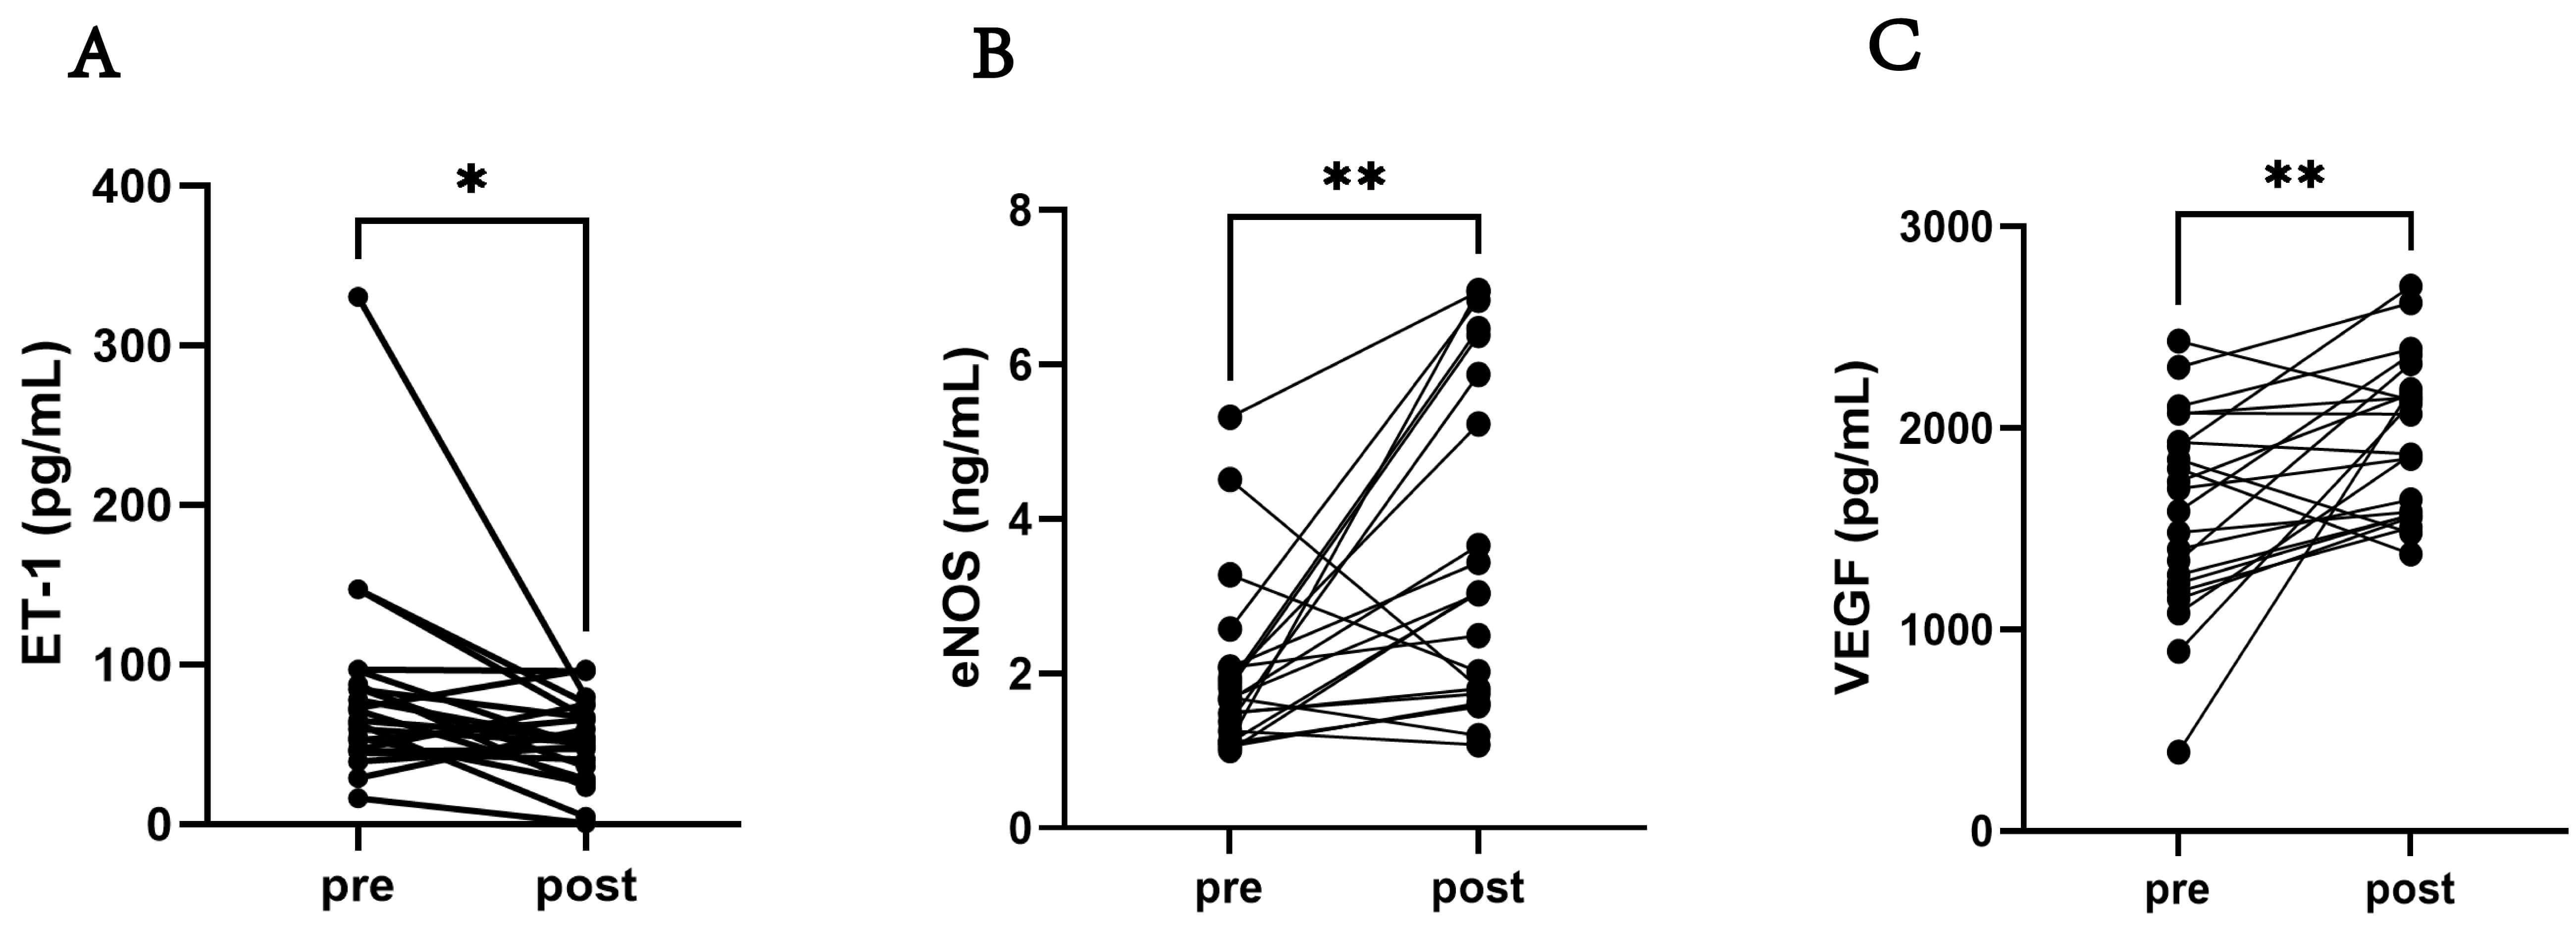 Fig. 1.
The oxidative stress-related indicators of the participants.
(A) Comparison of the ET-1 level pre-training and post-training. (B) Comparison
of the eNOS level pre-training and post-training. (C) Comparison of VEGF level
pre-training and post-training. Abbreviation: ET-1, endothelin-1; eNOS,
endothelial nitric oxide synthase; VEGF, vascular endothelial growth factor. N =
22; Data are expressed as means
After the training program, significant decreases were observed in the levels of
C–X–C chemokine receptor 1 (CXCR1) (p
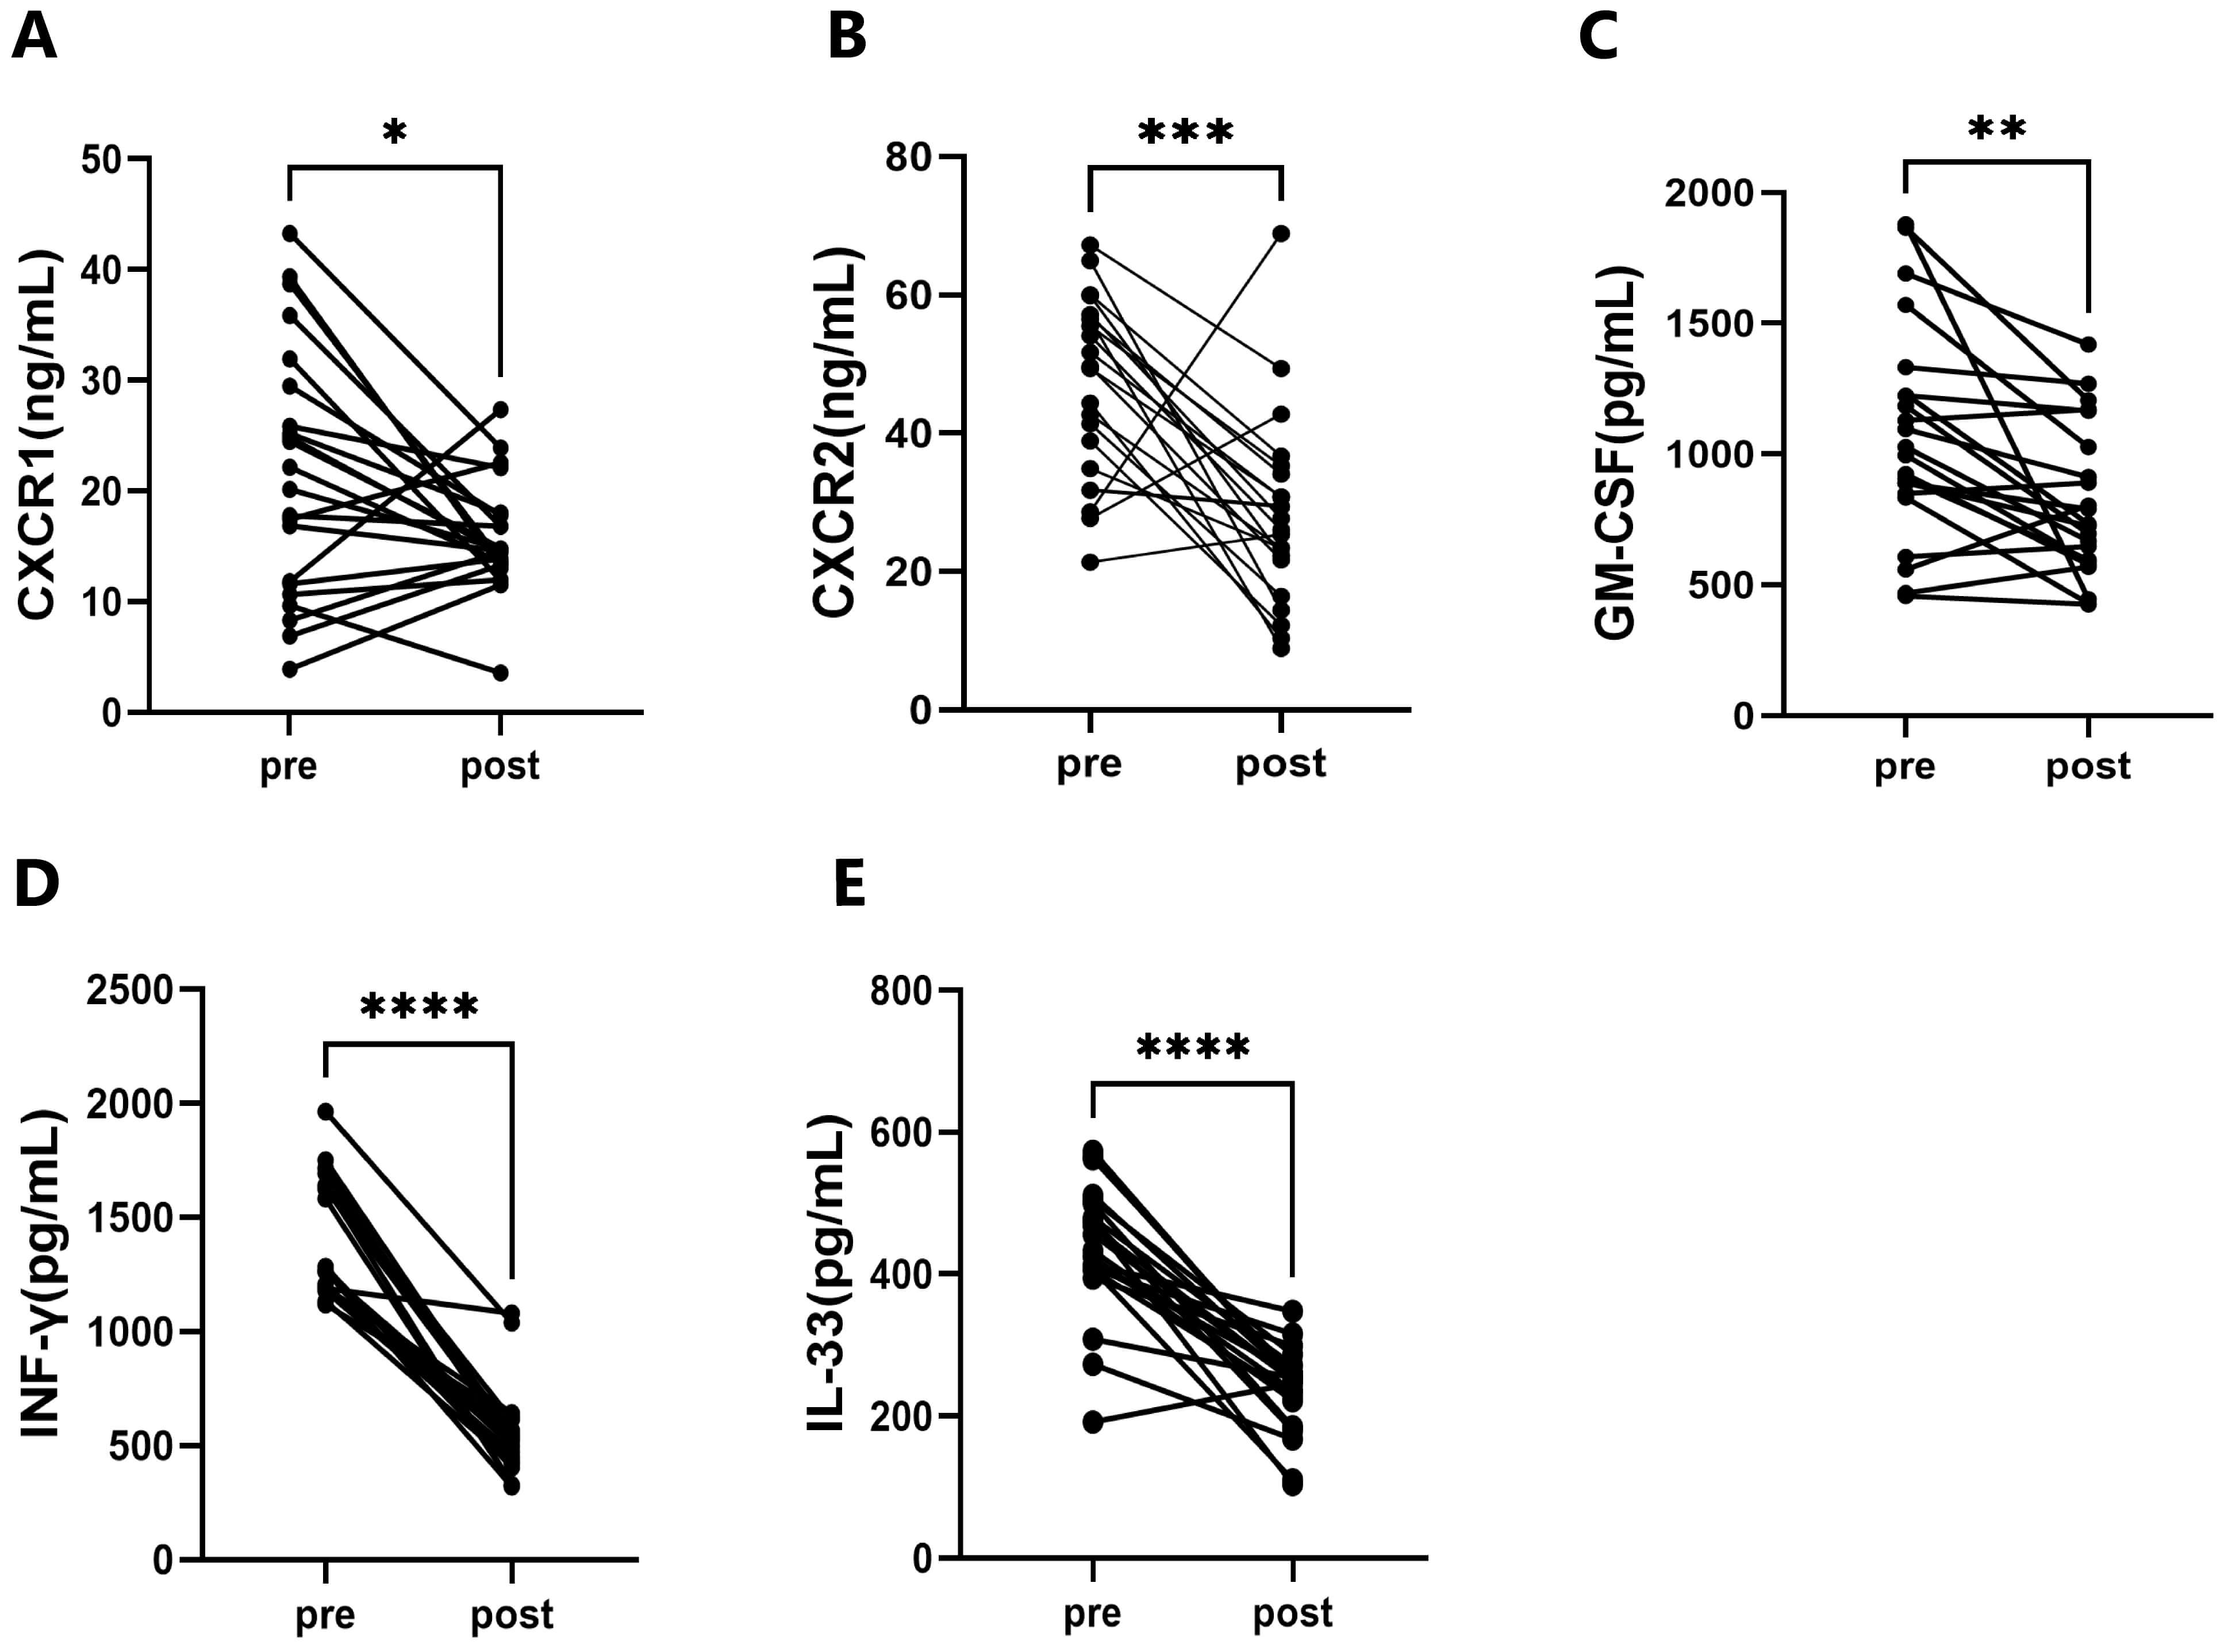 Fig. 2.
The Immunoinflammatory cytokines of the participants. (A)
Comparison of CXCR1 pre- and post-training. (B) Comparison of CXCR2 pre- and
post-training. (C) Comparison of GM-CSF pre- and post-training. (D) Comparison of
IFN-
This study presents evidence that a 12-week FATmax-intensity exercise training intervention can improve body composition, enhance cardiorespiratory function, and reduce CVD risk in college students. The significant improvements observed in various indicators suggest that this training model has potential protective effects on cardiovascular health within the population.
Notably, the study documented significant reductions in body weight, fat mass,
and WHR (all p
In terms of liver function, the significant reduction in AST activity compared
to pre-intervention (p
Regarding blood parameters, the observed reduction in red blood cell-related metrics may indicate exercise-induced physiological expansion of blood volume, release of erythropoietin (EPO), and enhanced antioxidant capacity, which are typically markers of good adaptation to regular exercise [28]. FATmax training stimulates the kidneys to release EPO through hypoxic stress; however, the activation of bone marrow hematopoiesis may take two or four weeks. Obese college students may experience more pronounced tissue hypoxia during training due to relatively poor cardiopulmonary function, resulting in a higher peak EPO release. Nevertheless, the rate of erythropoiesis still lags behind the rate of plasma volume expansion, leading to a short-term decrease in RBC, HGB, and HCT. This plasma volume expansion reduces blood viscosity, which can alleviate the low oxygen transport efficiency caused by dyslipidemia and blood hyperviscosity in obese populations, thereby enhancing the fat reduction effect of FATmax training [29]. Meanwhile, a lower HCT can decrease cardiac pumping resistance and reduce cardiovascular pressure in obese individuals with comorbidities such as hypertension and fatty liver disease [30]. It should be noted that if HGB levels drop below 130 g/L in males or 120 g/L in females and persist for more than 4 weeks, symptoms such as decreased maximal oxygen uptake, impaired exercise endurance, and increased fatigue may occur. Additionally, serum ferritin levels below 30 µg/L (or 12 µg/L in specific subgroups) can lead to reduced exercise performance, even if the criteria for overt anemia are not met [31]. The lack of expected change in the NLR may be due to FATmax training being of low to moderate intensity, which is less likely to cause severe inflammation or stress responses [32]. Other factors such as intervention duration, diet, or psychological stress may also have an impact [33]. Future studies could investigate incorporating high-intensity interval training (HIIT) to assess its additional effects on inflammatory markers and CVD risk.
Overall, improvements in cardiorespiratory function were a prominent finding of
this study. The significant increases in peak VO2, AT, percentage of
predicted peak VO2, FEV1/FVC ratio, and MMEF (all p
A significant decrease in ET-1 indicates that training may have improved vascular endothelial function, reduced vascular contractility, helped lower blood pressure, and alleviated strain on vascular walls, thereby exerting a protective effect on the cardiovascular system [41]. An increase in eNOS enhances vascular diastolic function, reduces peripheral vascular resistance, and promotes blood circulation, which exerts a positive impact on cardiovascular health. An increase in VEGF may help enhance myocardial blood and oxygen supply, promote the repair and regeneration of damaged blood vessels, and mitigate the development and progression of CVDs. Furthermore, VEGF may also play a role in regulating lipid metabolism and energy balance, thereby exerting a further beneficial effect on cardiovascular health [42, 43]. The improvements in these three indicators suggest that FATmax training can reduce the risk of cardiovascular diseases in obese college students through multiple pathways, such as improving vascular endothelial function, regulating vascular vasomotor status, and promoting angiogenesis.
Research has shown that CXCR1 and CXCR2 are closely involved in mediating
inflammatory infiltration in cardiovascular diseases by participating in the
recruitment and activation of leukocytes. In conditions such as atherosclerosis,
CXCR1/2 inhibitors have demonstrated benefits in animal models, including reduced
plaque area, improved lipid profiles, relief from ischemia-reperfusion injury,
regulation of blood pressure, and limiting cardiac remodeling [44, 45]. GM-CSF
can stimulate the proliferation, differentiation, and activation of granulocytes
and macrophages, promote the generation of inflammatory cells, and exacerbate
inflammatory responses in cardiovascular diseases. The serum GM-CSF level in
patients with acute myocardial infarction is significantly correlated with the
severity of the disease [46, 47]. IFN-
However, none of the college students participating in the training adopted the recommended intervention of “incorporating resistance training after four weeks of training”. The main reasons included loss of training confidence, lack of suitable training facilities, and scheduling conflicts. In addition, participants did not adhere to the study’s control requirements. To address these challenges, future studies will refine the experimental design to minimize these limitations and develop more comprehensive intervention strategies to further strengthen the training program.
This study has several limitations: short intervention period, limited sample size, the absence of a parallel control group, gender ratio imbalance, and different exercise modes in comparison groups. Future research should expand the sample size, extend the intervention period, establish control groups (e.g., other intensity aerobic exercise groups), and incorporate more comprehensive cardiovascular risk biomarkers. This will help further elucidate the exact effects and mechanisms of FATmax exercise on CVD risk in college students, providing a stronger theoretical basis for its promotion in public health.
A 12-week FATmax exercise training program can significantly improve college students’ body composition, cardiovascular function, pulmonary function, and oxidative stress markers. It may serve as an effective intervention strategy to reduce the risk of CVD in the college student population. Moreover, combining FATmax training with resistance training and supplementing it with proper dietary management can improve body composition and relevant functional indicators, further reducing CVD risk factors.
The data that support the findings of this study are available from the corresponding author upon reasonable request.
ZWP designed the study; JY and FYS carried out experiments; ZWP, JY, and HMZ analyzed the data; HMZ, ZWP, JY, and FYS drafted and wrote the manuscript; HMZ, ZWP, JY, and FYS revised the manuscript. All authors contributed to the critical revision of the manuscript for important intellectual content. All authors read and approved the final manuscript. All authors have participated sufficiently in the work and agreed to be accountable for all aspects of the work.
This study was performed in line with the principles of the Declaration of Helsinki. Approval was granted by the Ethics Committee of Central Hospital of Dalian University of Technology (Date 21/10/2024/No. YN2024-134-32). Informed consent was obtained from all individual participants included in the study.
Not applicable.
This study was supported by the Central Hospital of Dalian University of Technology ‘Climbing Plan’ [grant number: 2024ZZ022].
The authors declare no conflict of interest.
References
Publisher’s Note: IMR Press stays neutral with regard to jurisdictional claims in published maps and institutional affiliations.