


 , Liwen Chen 1,†, Nailiang Tian 2, Haidong Qin 1, Lei Bao 1,*
1 Department of Emergency, Nanjing First Hospital, Nanjing Medical University, 210006 Nanjing, Jiangsu, China
2 Department of Cardiology, Nanjing First Hospital, Nanjing Medical University, 210006 Nanjing, Jiangsu, China
†These authors contributed equally.
Abstract
Despite advances in treatment, cardiogenic shock (CS) remains a highly lethal complication of acute myocardial infarction (AMI), with mortality rates still exceeding 40%. Early identification of high-risk patients is critical, yet existing risk-stratification tools lack precision, particularly in integrating novel biomarkers such as the apolipoprotein B/A1 (ApoB/ApoA1) ratio, which reflects atherogenic lipid imbalance and has shown predictive value in cardiovascular disease.
This retrospective cohort study included patients admitted with an acute coronary syndrome between December 2022 and July 2025.
Using the least absolute shrinkage and selection operator (LASSO) regression, a predictive nomogram was developed incorporating eight independent predictors: heart rate, respiratory rate, systolic blood pressure, white blood cell count, D-dimer, albumin, glucose, and the ApoB/ApoA1 ratio. The model demonstrated strong discriminatory performance, with an area under the curve (AUC) of 0.839 in the training cohort and 0.832 in the validation cohort. Calibration and decision curve analyses further supported the clinical utility of the nomogram.
The inclusion of the ApoB/ApoA1 ratio, a marker associated with endothelial dysfunction, plaque instability, and metabolic dysregulation, adds significant prognostic value beyond conventional parameters. This nomogram provides a practical tool for early risk stratification, potentially guiding timely interventions and improving outcomes in high-risk patients with AMI.
Keywords
- cardiogenic shock
- acute myocardial infarction
- ApoB/ApoA1 ratio
- nomogram
Cardiogenic shock (CS) remains the most lethal complication of an acute myocardial infarction (AMI), with mortality rates exceeding 40% despite advances in revascularization and mechanical circulatory support [1, 2]. Early identification of high-risk patients is critical for timely intervention, yet existing risk stratification tools lack precision, particularly in integrating novel biomarkers that may enhance predictive accuracy [3, 4, 5]. The apolipoprotein (Apo) B/ApoA1 ratio, a marker of atherogenic lipid imbalance, has emerged as a promising candidate for risk assessment in cardiovascular diseases [6, 7]. Recent Mendelian randomization studies have demonstrated a significant causal relationship between the ApoB/ApoA1 ratio and cardiometabolic disorders, highlighting its potential role in mediating adverse cardiovascular outcomes [6]. Furthermore, the ratio’s incremental predictive value beyond conventional lipid measures suggests its utility in refining risk models for acute cardiovascular events [6].
The pathophysiological rationale for incorporating the ApoB/ApoA1 ratio into CS prediction lies in its association with endothelial dysfunction, plaque instability, and systemic inflammation—key contributors to hemodynamic collapse in AMI [6, 7]. While traditional risk factors such as hemodynamic instability, elevated cardiac biomarkers, and multivessel disease have been extensively studied in AMI-related CS [8, 9, 10], lipid metabolism disturbances remain underexplored in this context. Notably, oxidative stress, which is exacerbated in CS, may further amplify the atherogenic effects of an elevated ApoB/ApoA1 ratio, creating a vicious cycle of myocardial injury and microvascular dysfunction [7]. Prior studies have largely focused on acute-phase reactants and hemodynamic parameters, however, the integration of lipid-derived biomarkers could provide a more comprehensive assessment of CS risk [3, 11, 12].
Clinical prediction models for CS in AMI have predominantly relied on readily available clinical and laboratory variables, but their performance remains sub-optimal, with limited external validation [3, 4, 13]. The development of a robust nomogram incorporating the ApoB/ApoA1 ratio alongside routine markers (e.g., hemodynamic indices, inflammatory markers, and coagulation parameters) may address this gap by improving discriminative ability and clinical utility [2, 5, 14]. Such a tool could facilitate early triage, guide resource allocation for advanced therapies (e.g., mechanical circulatory support), and ultimately reduce mortality [15, 16]. The CULPRIT-SHOCK trial underscored the need for personalized risk stratification to optimize revascularization strategies in AMI-CS, further justifying the exploration of biomarker-enhanced models [3, 10]. This study aims to bridge these gaps by developing and validating a novel nomogram that utilizes the ApoB/ApoA1 ratio’s unique prognostic value, thereby offering a pragmatic tool for clinicians managing high-risk AMI populations [11, 17].
This retrospective cohort study included consecutive patients admitted to the
Coronary Care Unit (CCU) of the Nanjing First Hospital for chest pain between
December 2022 and July 2025. Inclusion criteria included: (1) age
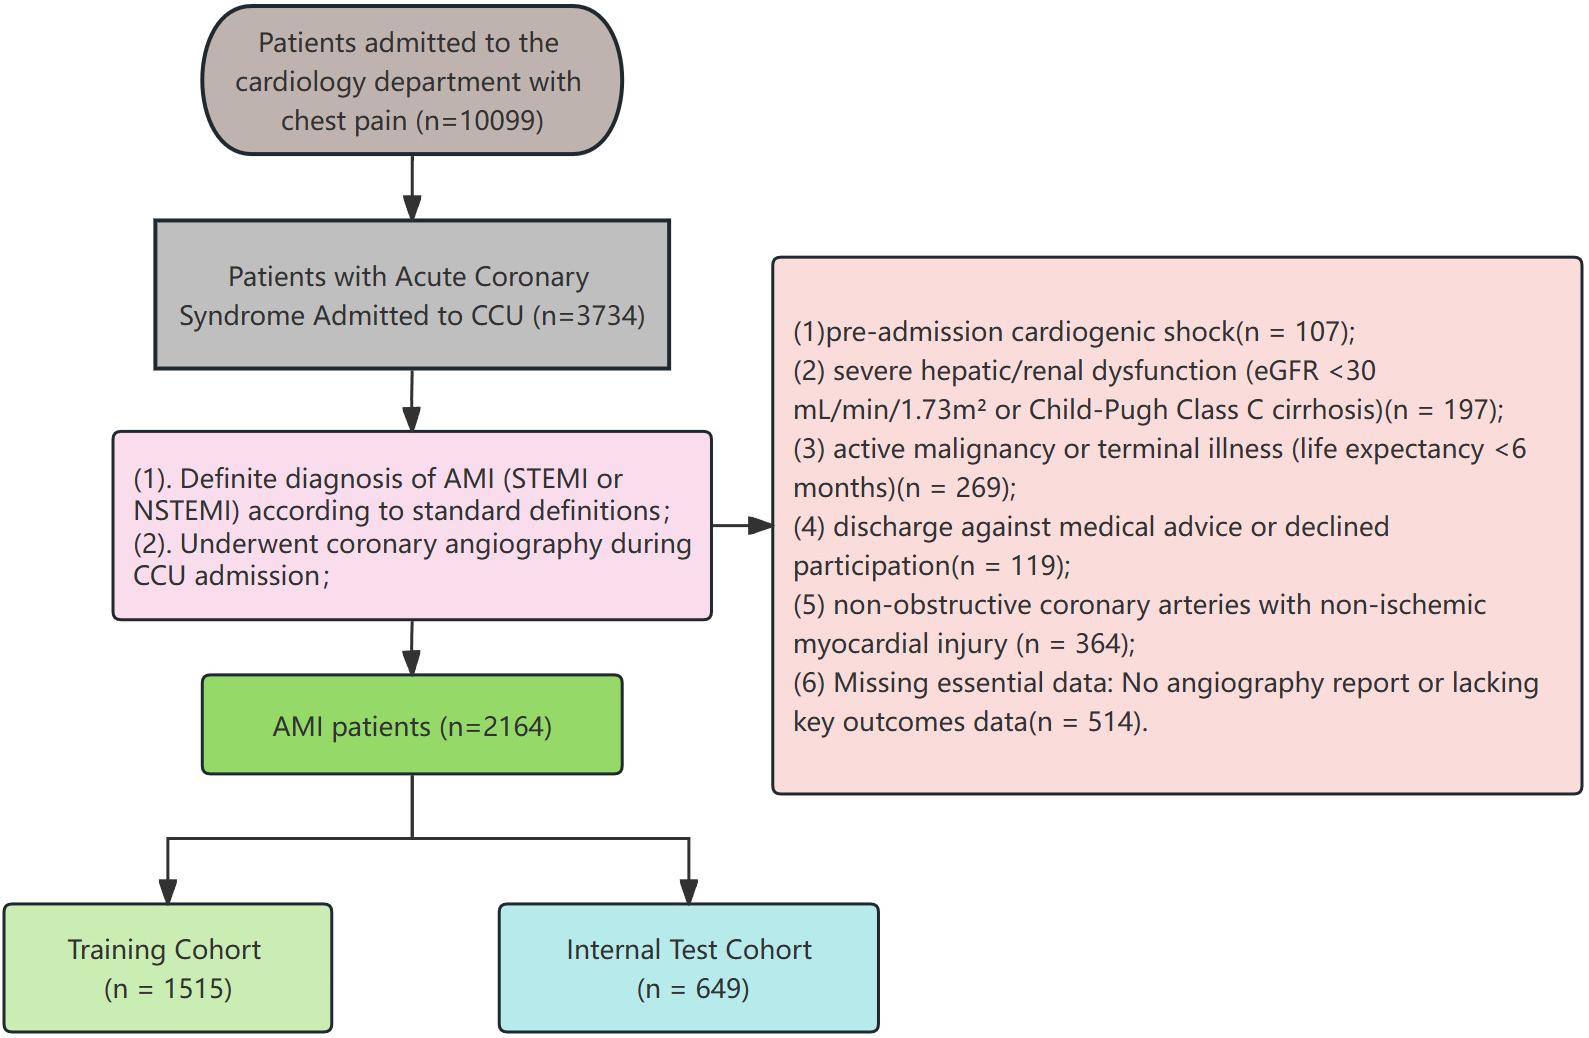 Fig. 1.
Flowchart of patient enrollment and cohort allocation. Abbreviations: ACS, acute coronary syndrome; AMI, acute myocardial infarction; CCU, coronary care unit; eGFR, estimated glomerular filtration rate; NSTEMI, non-ST-segment elevation myocardial infarction; STEMI, ST-segment elevation myocardial infarction.
Data were extracted from electronic medical record systems, including baseline demographic and clinical characteristics, laboratory results from fasting venous blood samples collected immediately upon admission, and clinical follow-up events. Demographic data included gender, age, and body mass index (BMI). Clinical characteristics included a history of cardiovascular and cerebrovascular diseases, and laboratory results.
The dataset collected from the Nanjing First Hospital was randomly divided into
training and validation sets in a 7:3 ratio, and baseline characteristics were
compared between cohorts. Continuous variables following normal distribution were
expressed as mean
Model performance was evaluated by receiver operating characteristic (ROC) curve analysis, with the area under the curve (AUC) ranging from 0.5 (no discriminative ability) to 1.0 (perfect discrimination). Calibration curves were generated to assess agreement between predicted and observed outcomes. Decision curve analysis (DCA) was further conducted to determine the clinical net benefit threshold of the prediction model.
As shown in Table 1, this study analyzed baseline characteristics in a training
cohort (N = 1515) and an internal test cohort (N = 649). No significant
differences existed in gender distribution (male: 79.8% vs 81.7%, p =
0.318), age (64
| Characteristic | Cohort | p-value | ||
| Training cohort | Internal test cohort | |||
| N = 1515 | N = 649 | |||
| Gender, n (%) | 0.318 | |||
| Female | 306 (20.2%) | 119 (18.3%) | ||
| Male | 1209 (79.8%) | 530 (81.7%) | ||
| Age, years | 64 |
63 |
0.810 | |
| BMI, kg/m2 | 24.8 (22.6, 27.0) | 24.6 (22.6, 26.8) | 0.454 | |
| HR, bpm | 81 |
82 |
0.655 | |
| RR, breaths/min | 17.5 |
17.5 |
0.925 | |
| SBP, mmHg | 137 |
136 |
0.406 | |
| DBP, mmHg | 84 |
84 |
0.955 | |
| Smoking, n (%) | 777 (51.3%) | 347 (53.5%) | 0.352 | |
| STEMI, n (%) | 776 (51.2%) | 336 (51.8%) | 0.814 | |
| Hypertension, n (%) | 691 (45.6%) | 308 (47.5%) | 0.430 | |
| Stroke, n (%) | 145 (9.6%) | 53 (8.2%) | 0.299 | |
| Type 2 diabetes, n (%) | 487 (32.1%) | 221 (34.1%) | 0.386 | |
| Atrial fibrillation, n (%) | 39 (2.6%) | 21 (3.2%) | 0.390 | |
| WBC, ×109/L | 9.7 |
10.1 |
0.060 | |
| Neutrophil count, ×109/L | 7.7 |
8.0 |
0.046 | |
| Lymphocyte count, ×109/L | 1.40 |
1.40 |
0.767 | |
| Hemoglobin, g/L | 135 |
136 |
0.250 | |
| Platelet count, ×109/L | 209 |
209 |
0.928 | |
| D-dimer, mg/L | 0.42 (0.23, 0.73) | 0.42 (0.23, 0.80) | 0.557 | |
| ALT, U/L | 31 (20, 51) | 31 (20, 49) | 0.734 | |
| AST, U/L | 63 (29, 157) | 63 (28, 162) | 0.909 | |
| Albumin, g/L | 38.6 |
38.6 |
0.672 | |
| Urea, mmol/L | 7.0 |
7.1 |
0.601 | |
| Creatinine, µmol/L | 77 (66, 93) | 77 (66, 96) | 0.493 | |
| Uric acid, µmol/L | 369 |
368 |
0.964 | |
| Glucose, mmol/L | 7.25 |
7.48 |
0.120 | |
| Triglycerides, mmol/L | 1.89 |
1.97 |
0.231 | |
| Total cholesterol, mmol/L | 4.52 |
4.52 |
0.918 | |
| HDL-C, mmol/L | 0.94 |
0.93 |
0.215 | |
| LDL-C, mmol/L | 2.62 |
2.61 |
0.867 | |
| Apolipoprotein A1 (ApoA1), g/L | 1.20 |
1.19 |
0.821 | |
| Apolipoprotein B (ApoB), g/L | 0.89 |
0.90 |
0.569 | |
| ApoB/ApoA1 ratio | 1.50 |
1.50 |
0.921 | |
| Lipoprotein(a), mg/L | 33 (15, 84) | 36 (15, 85) | 0.402 | |
Abbreviations: BMI, body mass index; HR, heart rate; RR, respiratory rate; SBP/DBP, systolic/diastolic blood pressure; STEMI, ST-elevation myocardial infarction; WBC, white blood cell count; ALT, alanine aminotransferase; AST, aspartate aminotransferase; HDL-C/LDL-C, high-/low-density lipoprotein cholesterol; ApoB/ApoA1, apolipoprotein B/apolipoprotein A1.
Candidate predictor variables included body mass index (BMI), heart rate (HR),
respiratory rate (RR), SBP, STEMI, hypertension, type 2 diabetes, stroke, atrial
fibrillation, white blood cell count (WBC), hemoglobin level, platelet count,
D-dimer, albumin, creatinine, glucose, low-density lipoprotein cholesterol,
apolipoprotein A1, apolipoprotein B, ApoB/ApoA1 ratio, and lipoprotein(a).
Following their inclusion in the initial model, LASSO regression analysis applied
to the training cohort ultimately identified eight potential predictors.
Supplementary Table 1 displays the regression coefficients for
each variable. As shown in Fig. 2, Fig. 2A,B illustrate LASSO cross-validation to
select the optimal
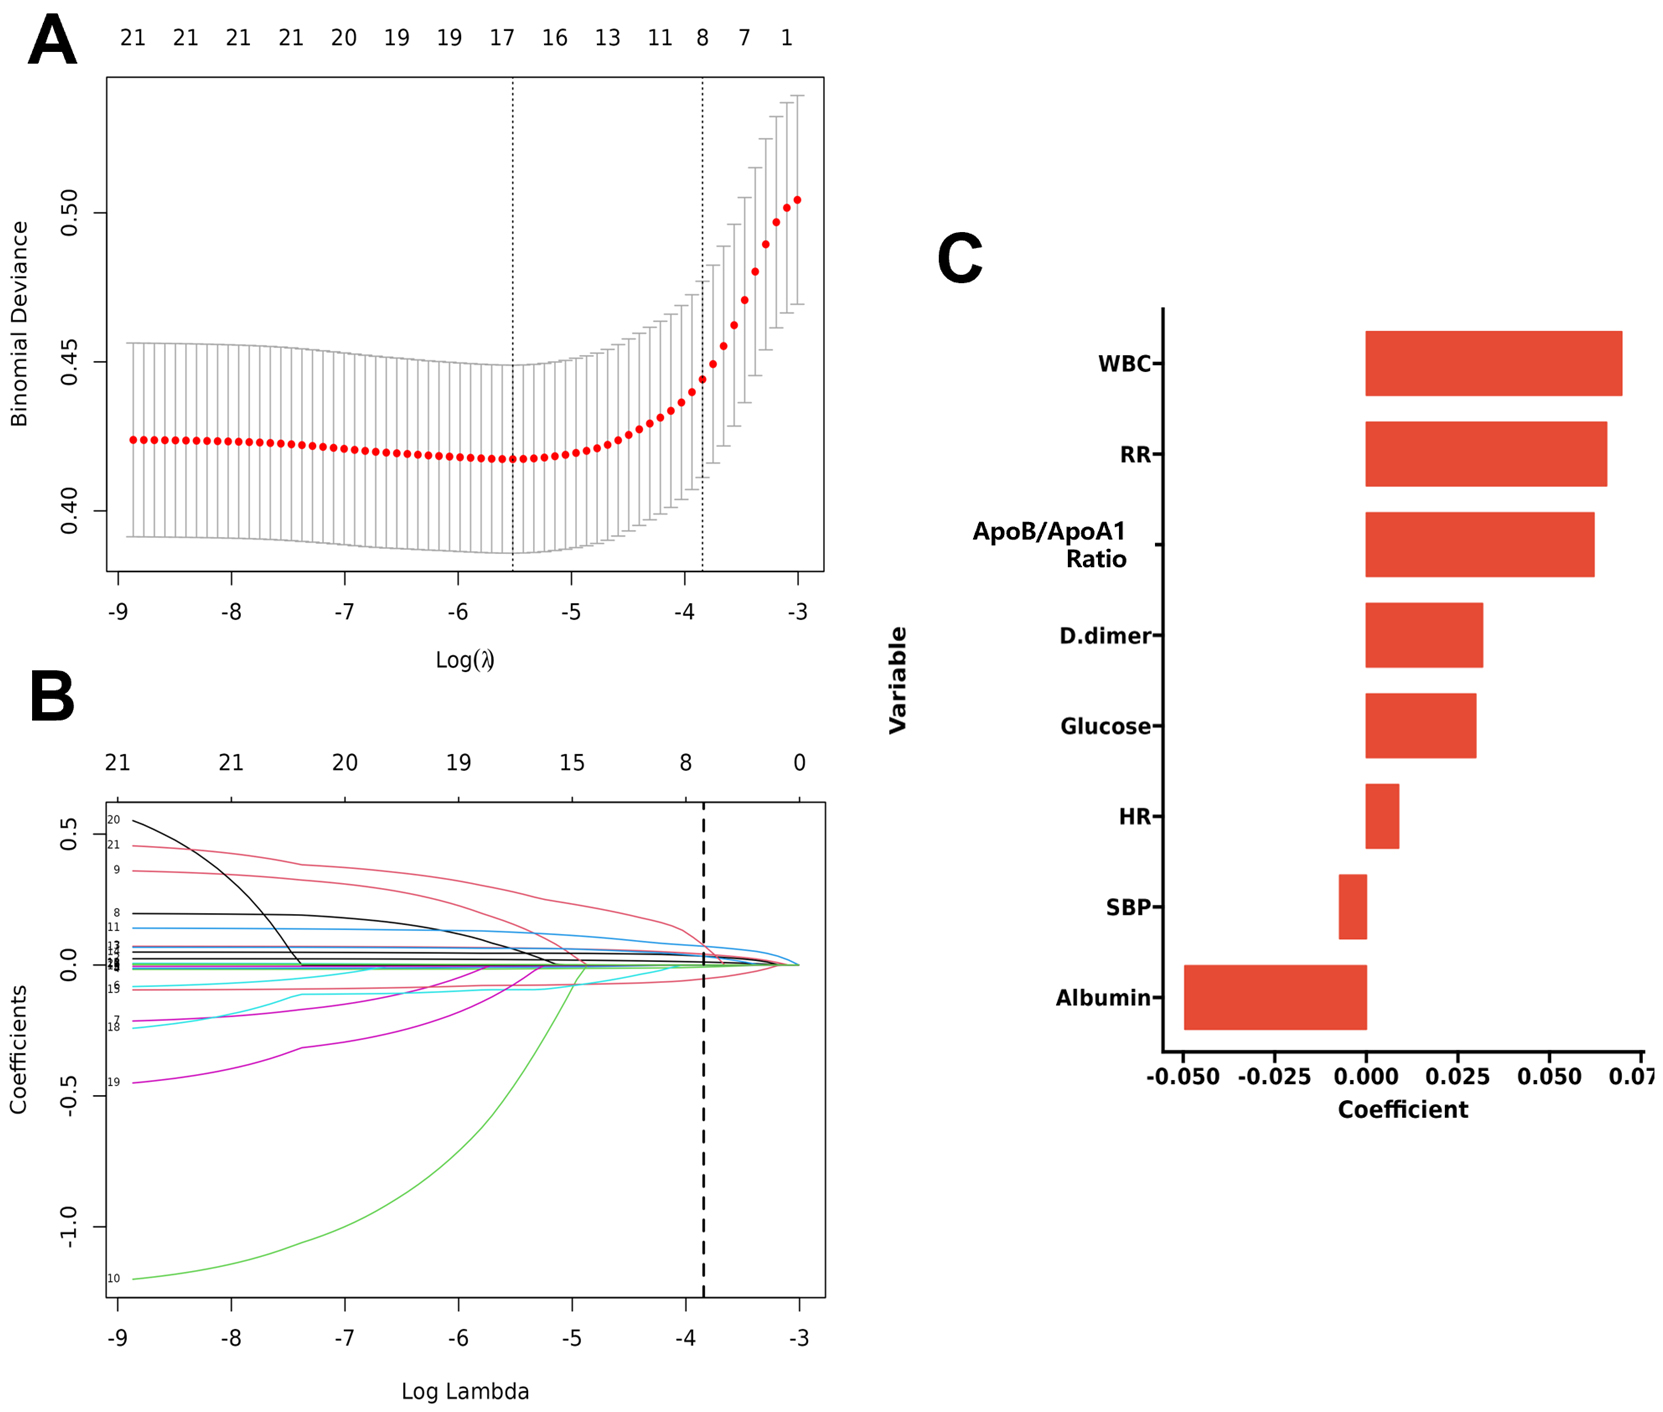 Fig. 2.
LASSO regression analysis for variable selection. (A) Binomial
Deviance vs. Log(
As shown in Fig. 3, the ROC analysis of the above-mentioned variables yielded
AUC values greater than 0.5. The ROC curve analysis demonstrated the
discriminative performance of individual variables in predicting the outcome
event (cardiogenic shock), with D-dimer exhibiting the highest predictive value
(AUC = 0.738, 95% CI: 0.691–0.784), followed by albumin (AUC = 0.697, 95% CI:
0.648–0.747) and WBC (AUC = 0.680, 95% CI: 0.625–0.734). SBP and RR showed
comparable predictive accuracy (AUC = 0.669, 95% CI: 0.611–0.727 and AUC =
0.669, 95% CI: 0.610–0.727, respectively), while HR and glucose displayed
moderate discrimination (AUC = 0.646, 95% CI: 0.580–0.713 and AUC = 0.648, 95%
CI: 0.592–0.705, respectively). The ApoB/ApoA1 ratio demonstrated the lowest
predictive capacity among all examined variables (AUC = 0.566, 95% CI:
0.502–0.630). These results indicate varying degrees of predictive utility
across different physiological and biochemical parameters for the outcome event.
The final logistic model included 8 independent predictors (HR, RR, SBP, WBC,
D-dimer, albumin, glucose, and ApoB/ApoA1 ratio) and was developed as a
simple-to-use nomogram, which is illustrated in Fig. 4. An additional
multivariate logistic regression analysis was performed in the training cohort,
with the results presented in Table 2. As demonstrated in Table 2, multivariable
logistic regression identified significant predictors of cardiogenic shock:
positive associations with HR (OR 1.02, 95% CI: 1.01–1.03), RR (OR 1.10, 95% CI:
1.04–1.16), WBC (OR 1.12, 95% CI: 1.06–1.18), D-dimer (OR 1.06, 95% CI: 1.02–1.11),
glucose (OR 1.08, 95% CI: 1.02–1.15), and ApoB/ApoA1 ratio (OR 1.53, 95% CI: 1.16–2.02)
(all p
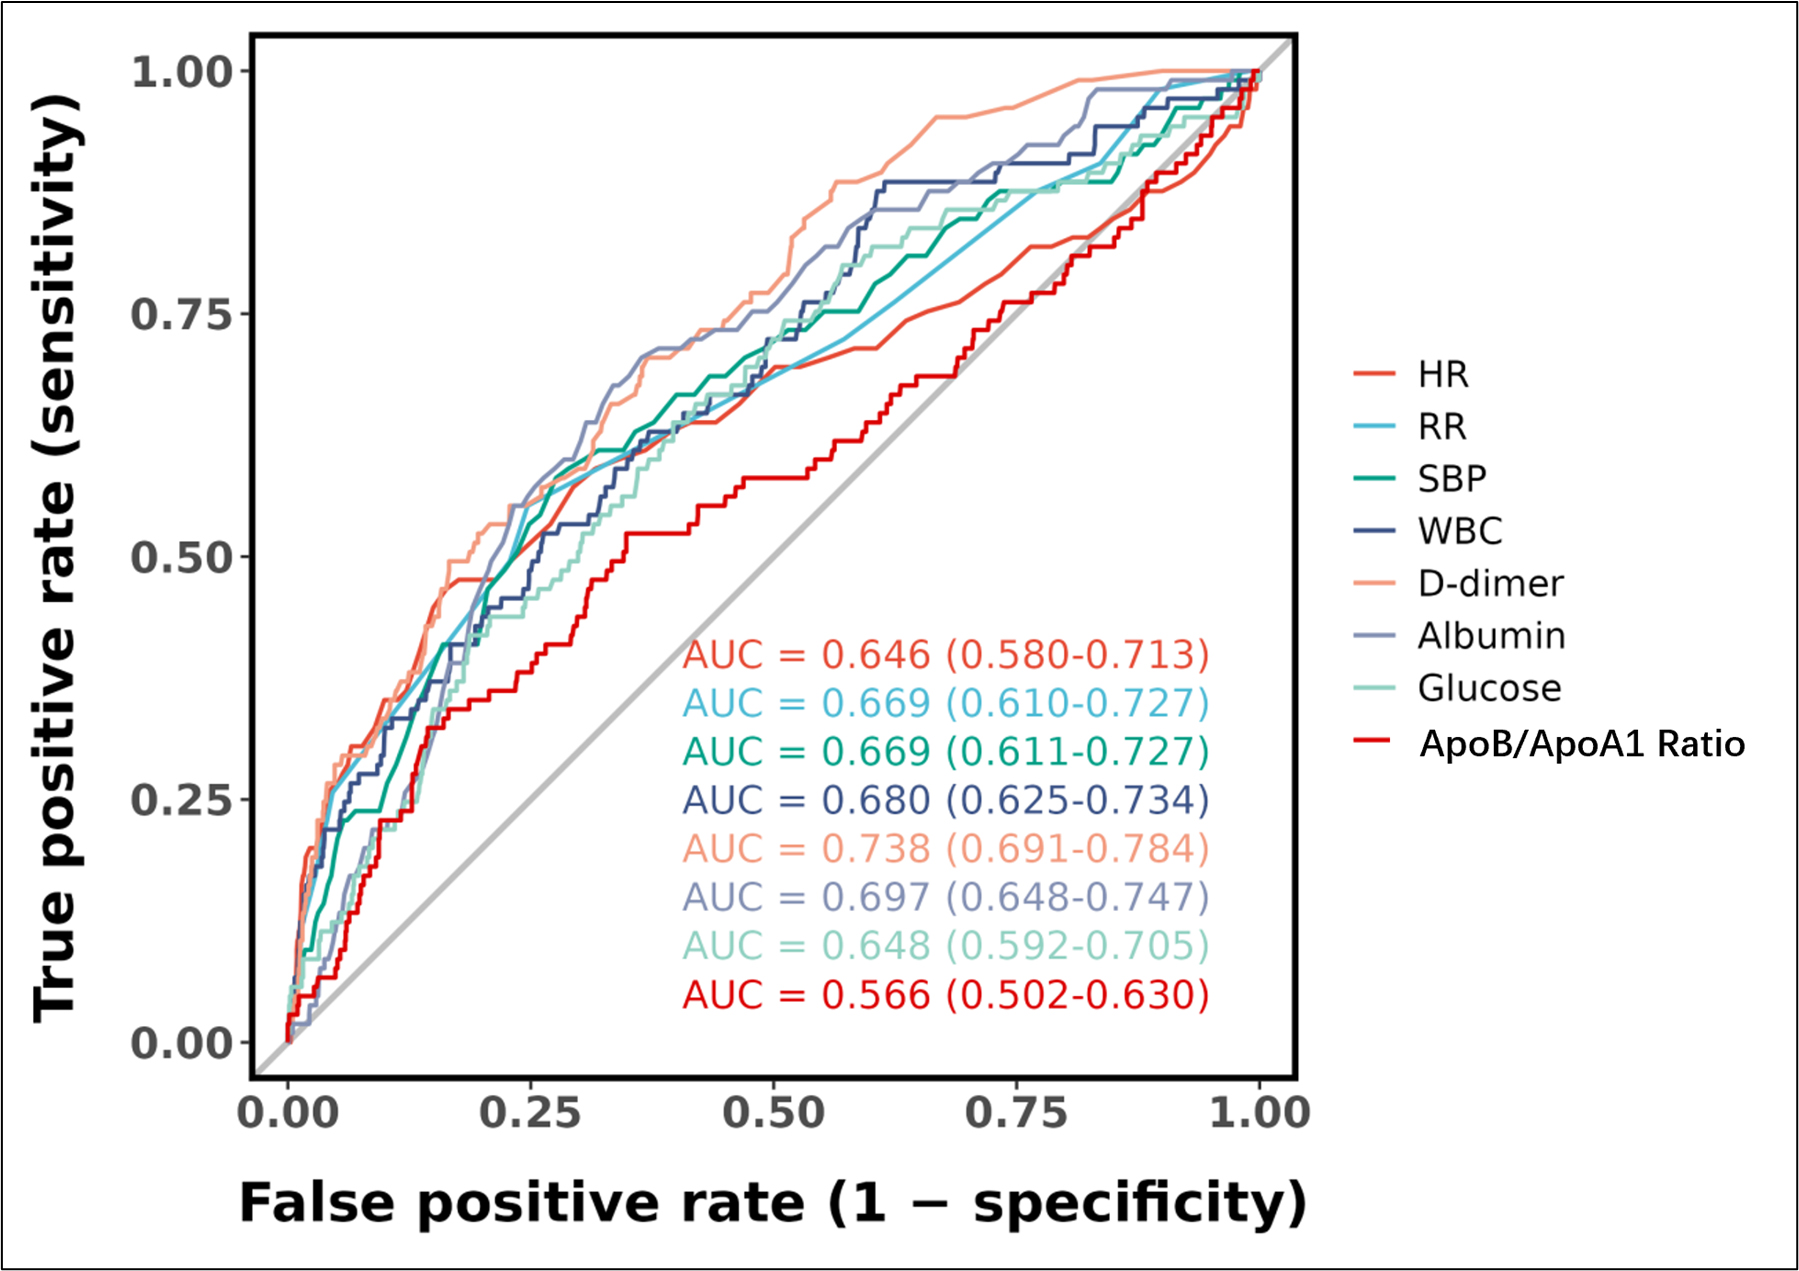 Fig. 3.
Receiver operating characteristic (ROC) curves for individual predictive variables. Abbreviations: AUC, area under the curve; CI, confidence interval; HR, heart rate; RR, respiratory rate; SBP, systolic blood pressure; WBC, white blood cell count; ApoB/ApoA1 ratio, apolipoprotein B/apolipoprotein A1 ratio.
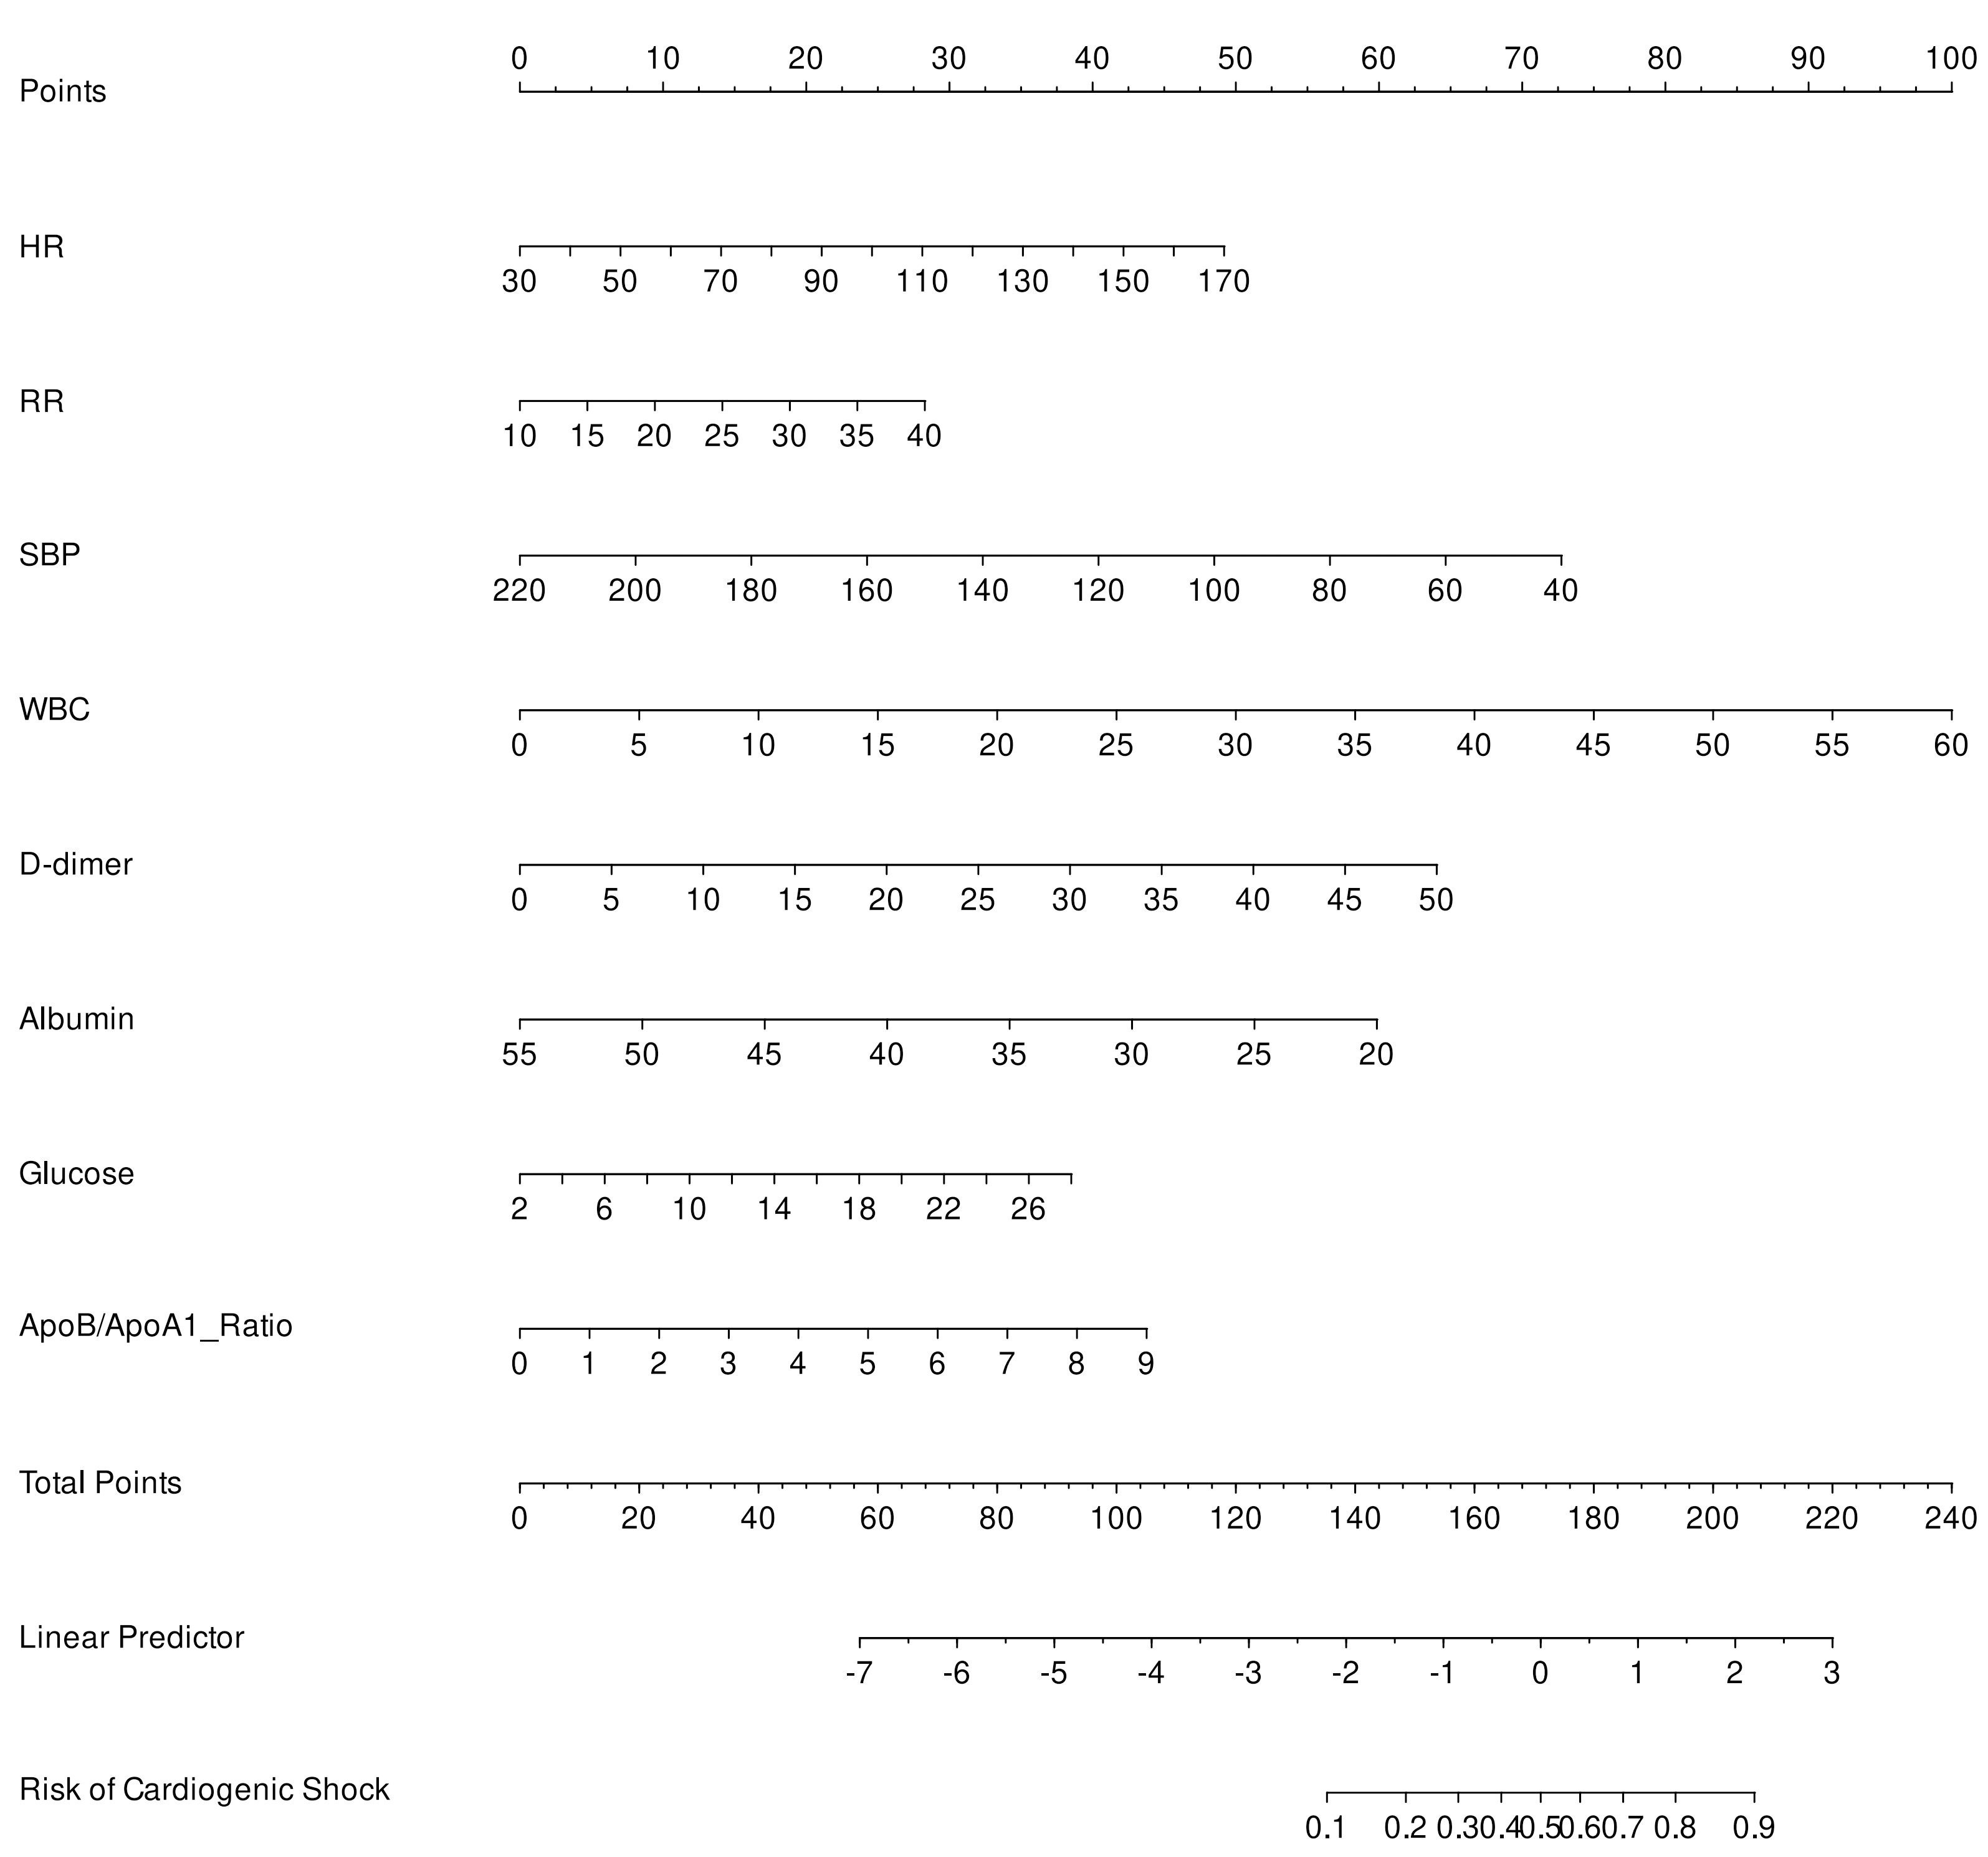 Fig. 4.
Nomogram for predicting the risk of post-myocardial infarction cardiogenic shock. Abbreviations: HR, Heart Rate; RR, respiratory rate; SBP, systolic blood pressure; WBC, white blood cell count; ApoB/ApoA1 ratio, apolipoprotein B/apolipoprotein A1 ratio.
| Characteristic | N | Event N | OR | 95% CI | p-value |
| HR | 1515 | 105 | 1.02 | 1.01, 1.03 | 0.002 |
| RR | 1515 | 105 | 1.10 | 1.04, 1.16 | |
| SBP | 1515 | 105 | 0.98 | 0.97, 0.99 | |
| WBC | 1515 | 105 | 1.12 | 1.06, 1.18 | |
| D-dimer | 1515 | 105 | 1.06 | 1.02, 1.11 | 0.010 |
| Albumin | 1515 | 105 | 0.90 | 0.85, 0.95 | |
| Glucose | 1515 | 105 | 1.08 | 1.02, 1.15 | 0.014 |
| ApoB/ApoA1 Ratio | 1515 | 105 | 1.53 | 1.16, 2.02 | 0.003 |
Abbreviations: OR, odds ratio; CI, confidence interval; HR, heart rate; RR, respiratory rate; SBP, systolic blood pressure; WBC, white blood cell count; ApoB/ApoA1, apolipoprotein B/apolipoprotein A1.
As shown in Fig. 5, the ROC curve analysis demonstrated that the predictive model achieved an AUC of 0.839 (95% CI: 0.799–0.879) for discriminating cardiogenic shock in the training cohort, indicating robust discriminative performance. Similarly, in the validation cohort, the model maintained excellent predictive accuracy with an AUC of 0.832 (95% CI: 0.776–0.889), showing consistent generalization across different datasets. The overlapping confidence intervals between the training and validation cohorts suggest stable model performance without significant degradation in predictive capability when applied to independent datasets. The calibration curves in Fig. 6A,B indicate moderate agreement between observed and predicted cardiogenic shock probabilities across cohorts, suggesting the nomogram may have reasonable predictive validity within this study population. The curves closely align with the ideal line, indicating robust predictive accuracy. As shown in Fig. 6C,D, DCA reveals significant net clinical benefit within the applicable threshold probability range, supporting the model’s clinical utility despite potential physician interpretation errors at high-risk thresholds.
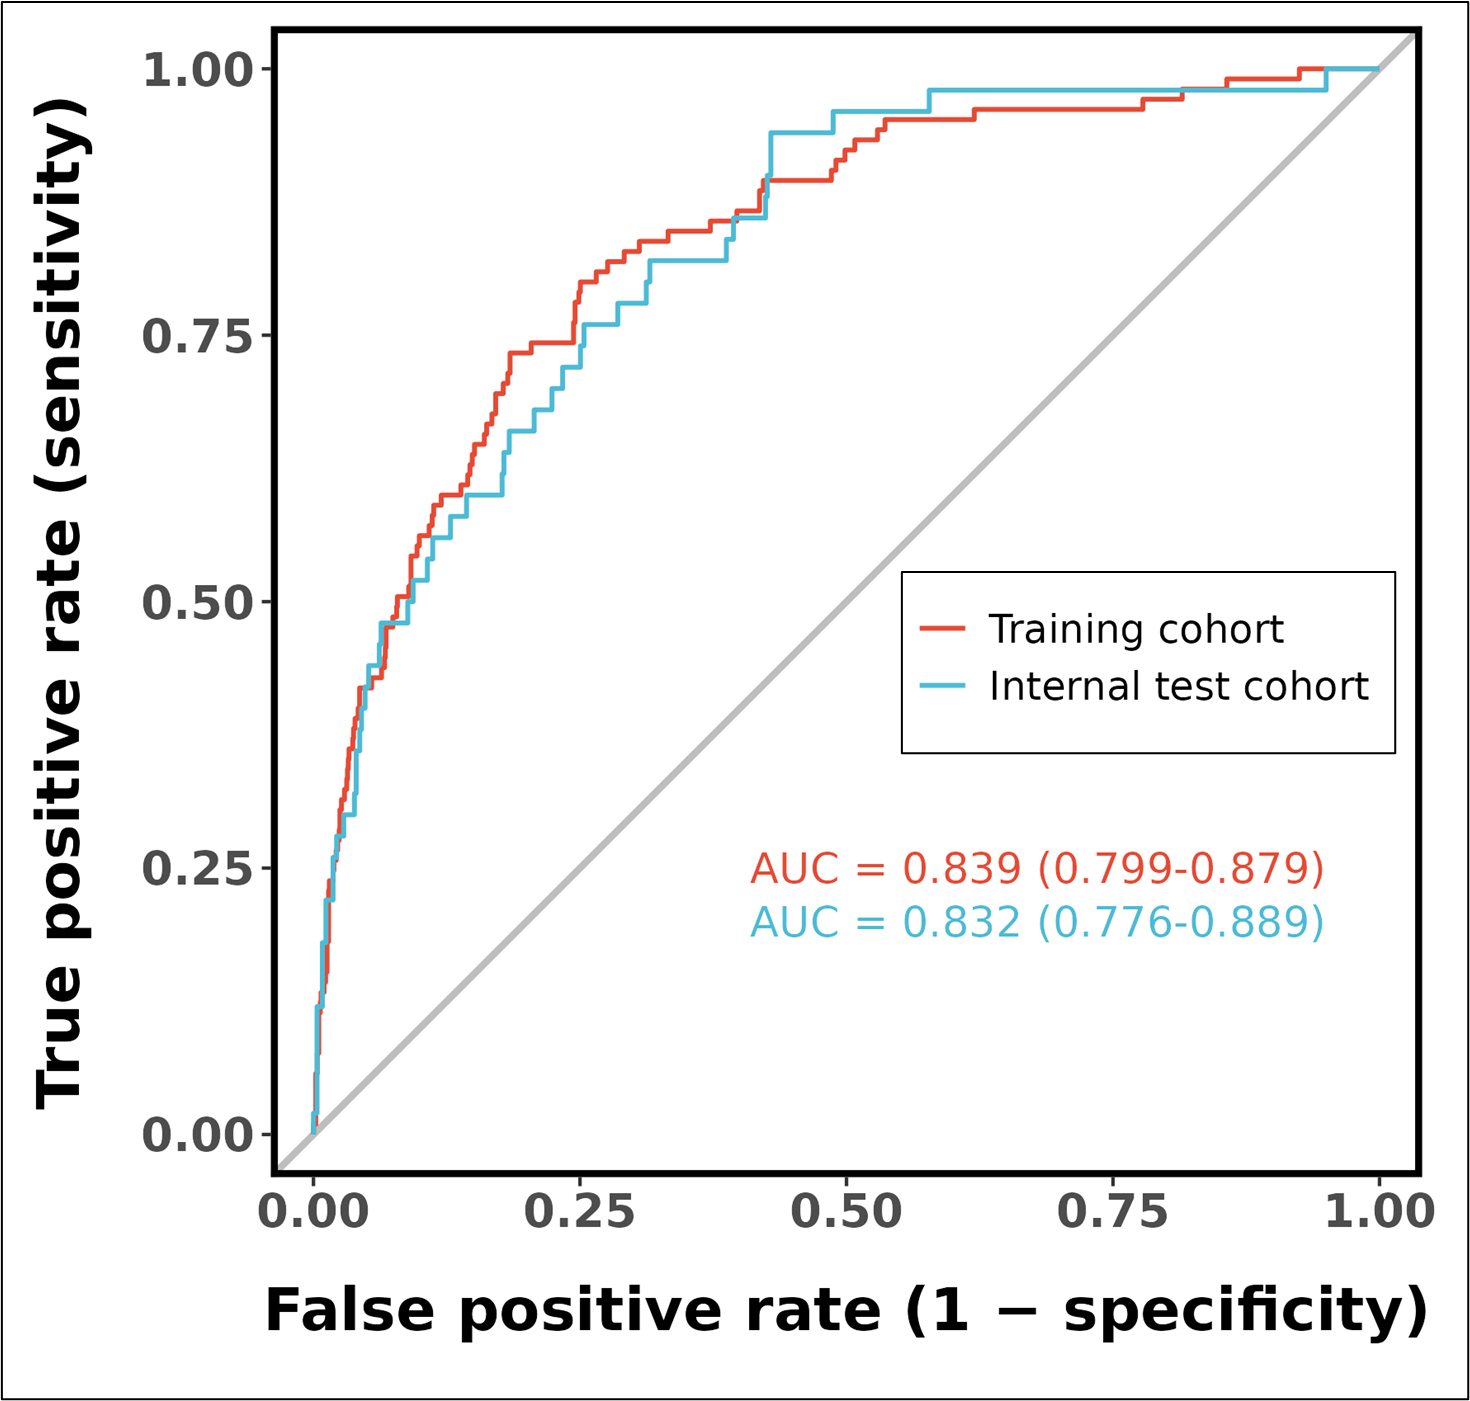 Fig. 5.
Receiver operating characteristic (ROC) curves of the predictive model in training and internal test cohorts. Abbreviations: AUC, area under the curve; CI, confidence interval.
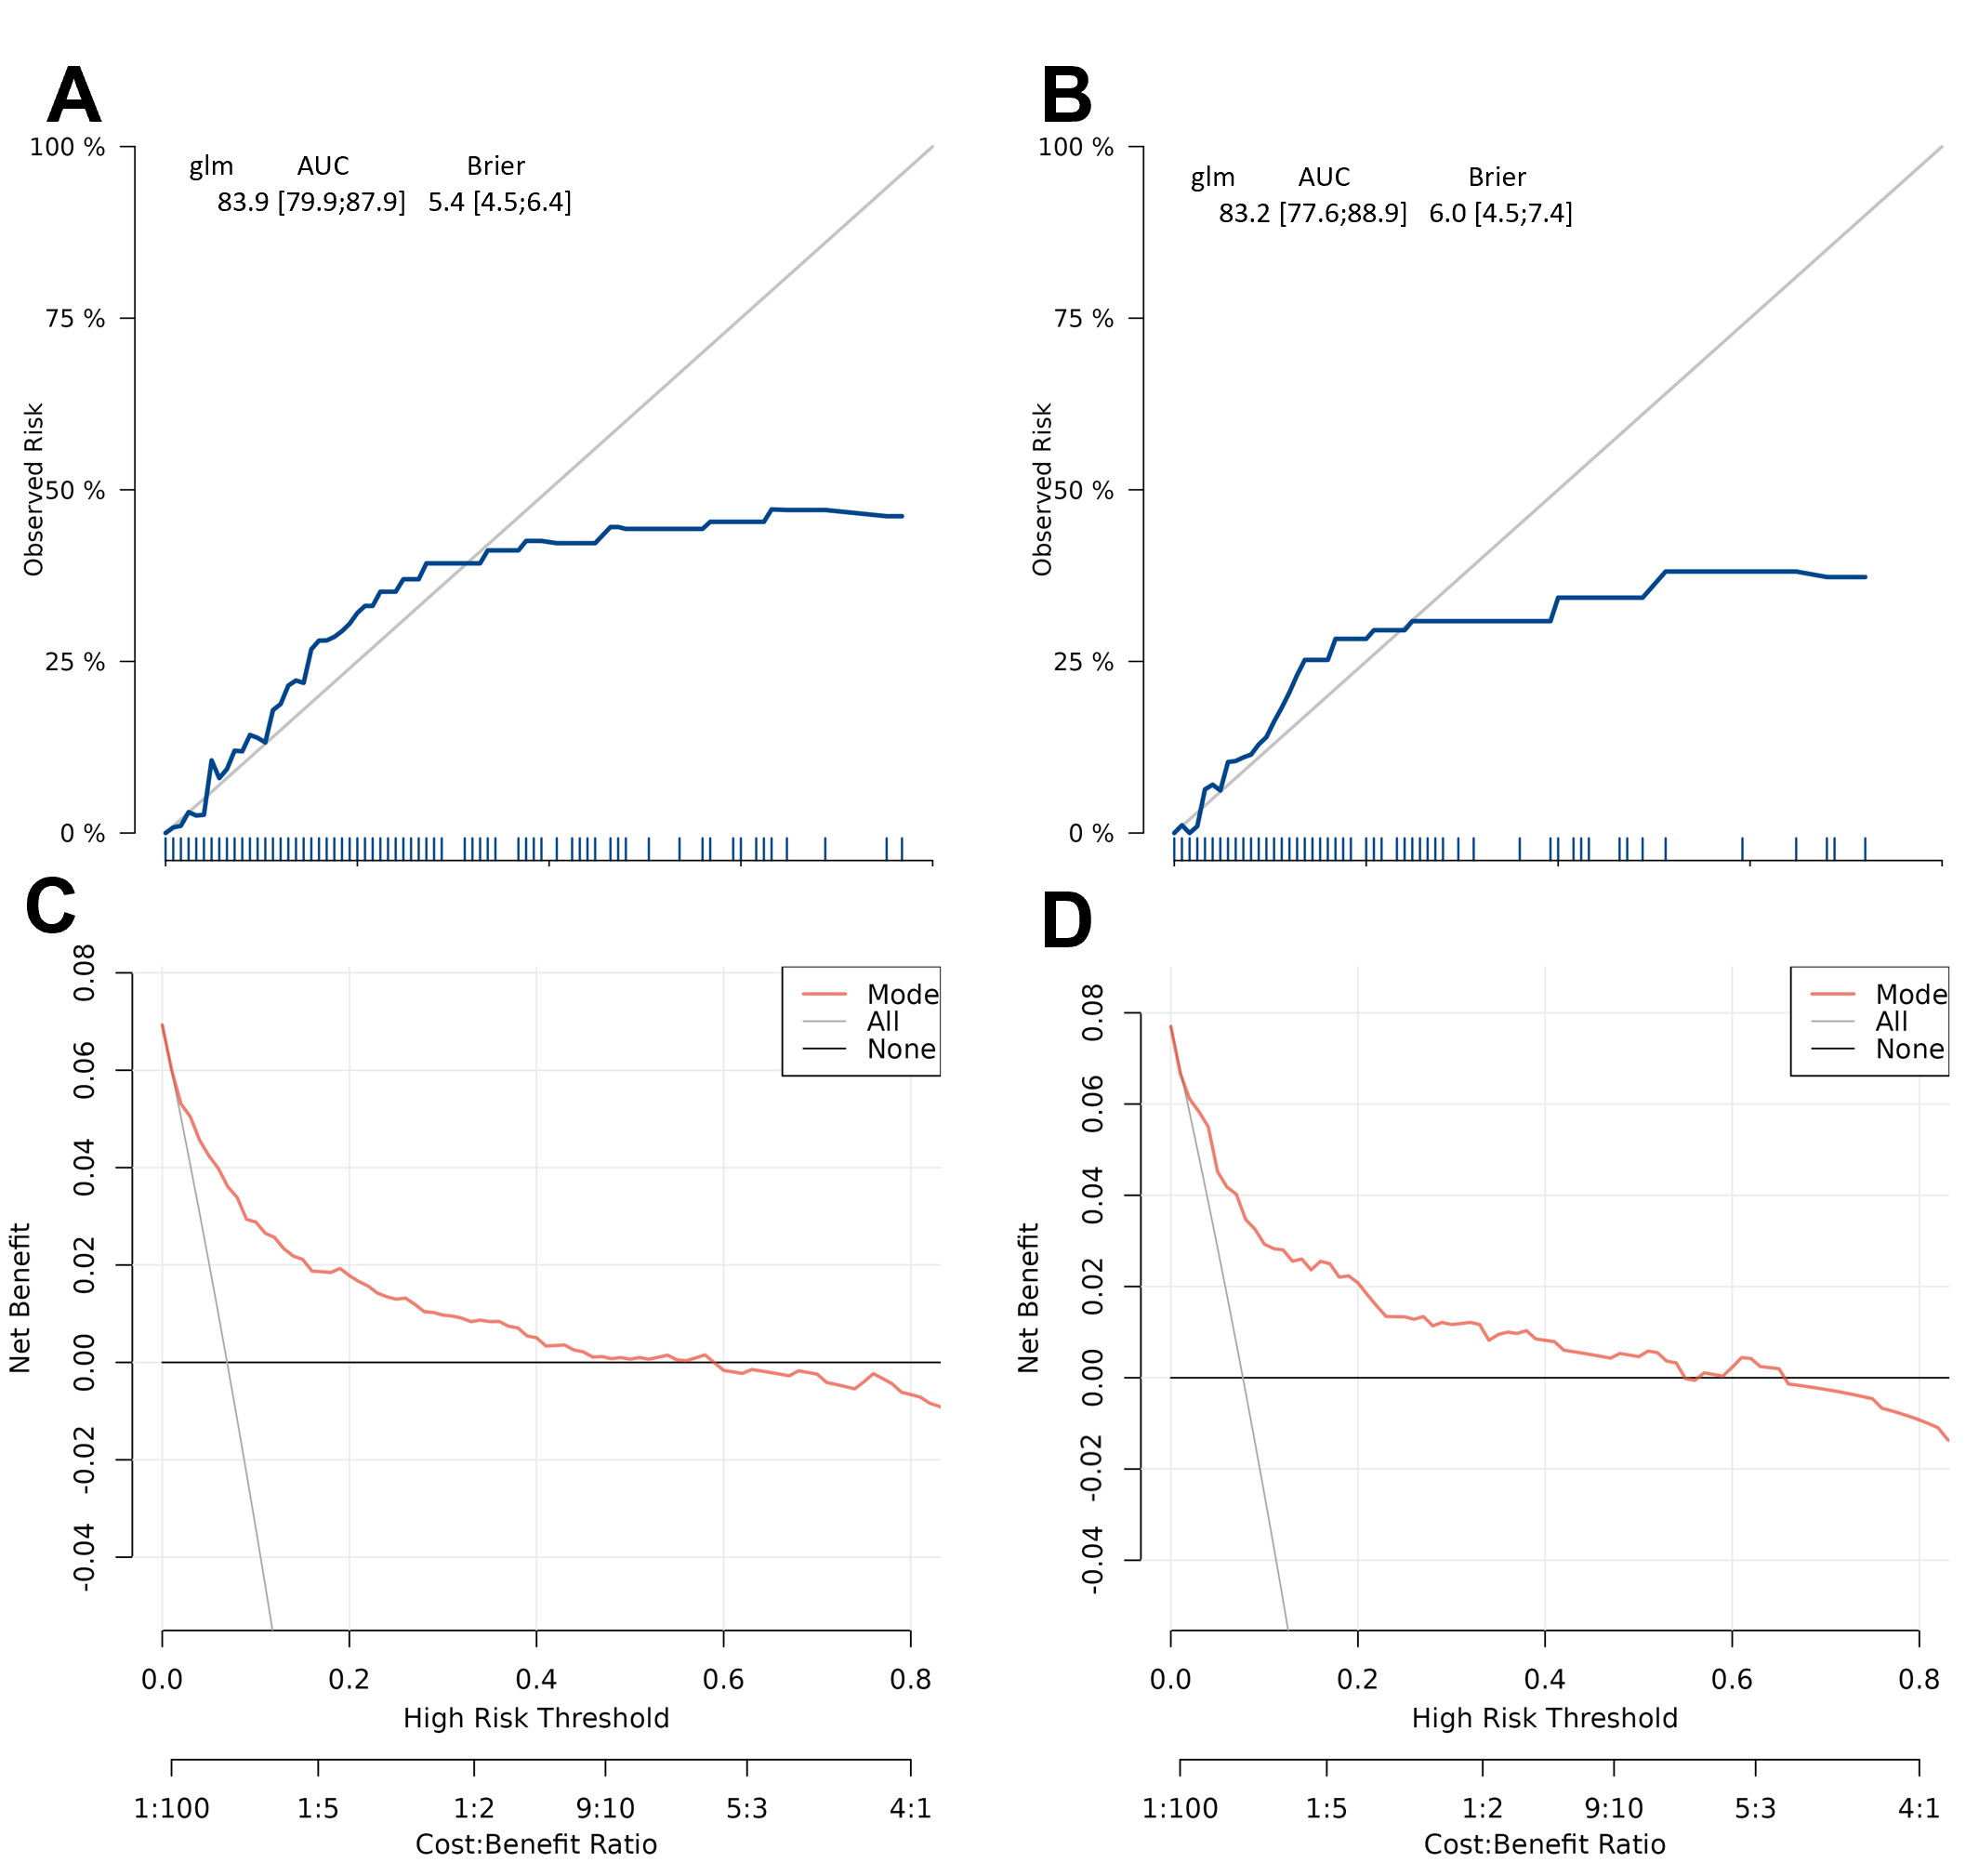 Fig. 6.
Calibration and clinical utility of the risk prediction model in training and validation cohorts. The model demonstrates reasonable calibration (blue line generally follows the diagonal with minor deviations in low-probability ranges) in both training (A) and test (B) cohorts, suggesting predicted risks show acceptable correspondence with observed outcomes. Decision curve analysis confirms the model provides meaningful net benefit across a range of high-risk thresholds, supporting its clinical utility for risk stratification in both training (C) and test (D) cohorts. Abbreviations: AUC, area under the curve; CI, confidence interval.
This study presents a novel prognostic nomogram incorporating the ApoB/ApoA1 ratio alongside established clinical and biochemical markers to predict the risk of cardiogenic shock in patients with acute myocardial infarction. The model demonstrated high discriminatory accuracy, precise calibration, and provided significant clinical net benefit based on DCA.
The multimodal nomogram developed in this study significantly improves upon
traditional CS risk models by integrating inflammatory, nutritional, and lipid
metabolic markers with conventional hemodynamic parameters. Traditional CS risk
stratification systems such as the IABP-SHOCK II score (age
The incorporation of the ApoB/ApoA1 ratio into predictive models for CS
following AMI has substantial clinical significance, as evidenced by extensive
research on its pathophysiological and prognostic implications. Mendelian
randomization studies have established a causal relationship between elevated
ApoB/ApoA1 ratios and cardiometabolic diseases (CMD), including ischemic heart
disease and major adverse cardiovascular events (p
This study provides three significant advancements: it addresses critical gaps in existing CS risk models by incorporating underutilized yet pathophysiologically relevant markers [3, 6, 20]; establishes the ApoB/ApoA1 ratio as a novel predictor capturing residual lipid risk beyond conventional parameters [6, 27]; and demonstrates superior discriminative performance relative to prior scores [3, 23, 35], while maintaining clinical practicality. By integrating readily obtainable ICU parameters with advanced biomarkers, our model creates a translational bridge between emergent risk stratification [23, 36] and approaches to personalized medicine [5, 37]. Prospective validation should assess performance across SCAI stages [20, 37] and CS phenotypes [37], particularly given the ratio’s potential mediation of metabolic dysregulation [6]. Future research must explore whether ratio-targeted interventions (e.g., ApoA1 infusion, PCSK9 inhibitors) could modify CS risk [34], potentially opening new therapeutic frontiers for this lethal condition.
This study has several limitations that warrant consideration. As a single-center observational study, the generalizability of findings may be influenced by institution-specific clinical practices and potential selection bias inherent in non-randomized designs. While internal validation demonstrated robust model performance, the generalizability of our nomogram requires further evaluation through external validation across diverse healthcare settings with varying resource availability, particularly regarding standardized ApoB/ApoA1 ratio measurement protocols. These considerations highlight important directions for future multicenter validation studies.
This study establishes a practical prediction tool for post-MI cardiogenic shock requiring IABP support by combining routine clinical signs (HR, RR, SBP) and key biomarkers (D-dimer, glucose, ApoB/ApoA1 ratio, albumin, WBC) into a nomogram. It enables early risk stratification, facilitating timely interventions to mitigate the severity of shock and to improve survival in this critical population.
The data from this study are available from the corresponding author upon reasonable request.
LB and XYZ designed the research study. XYZ and LWC performed the research. XYZ and LWC analyzed the data, and wrote the manuscript. NLT provided the patients. HDQ provided help and advice on the discussion. XYZ, LWC and NLT conceived the idea, participated in the revision. XYZ and LWC contributed equally to this work as co-first authors. All authors contributed to the conception and editorial changes in the manuscript. All authors reviewed and approved the final manuscript. All authors have participated sufficiently in the work and agreed to be accountable for all aspects of the work.
The study was conducted in accordance with the Declaration of Helsinki. It was approved by the Ethical Committee of Nanjing First Hospital affiliated to Nanjing Medical University (No. KY20250722-07). All participants in the study provided written informed consent.
We sincerely appreciate the data support provided by the teams of the Department of Information, Nanjing First Hospital.
This research received no external funding.
The authors declare no conflict of interest.
Supplementary material associated with this article can be found, in the online version, at https://doi.org/10.31083/RCM46493.
References
Publisher’s Note: IMR Press stays neutral with regard to jurisdictional claims in published maps and institutional affiliations.