

 , Wei Xu 2,†, Qirui Song 3, Zinan Zhao 4, Chenxi Xia 1,5, Yi Li 1,6, Yibo Xie 7, Jun Wang 1, Chenguang Yang 1,6, Zhenyan Zhao 8, Xuyang Meng 9,*
 , Fang Wang 1,6,*
1 Department of Cardiology, Beijing Hospital, National Center of Gerontology, Institute of Geriatric Medicine, Chinese Academy of Medical Sciences, 100730 Beijing, China
2 Emergency Center, Fuwai Hospital, State Key Laboratory of Cardiovascular Disease of China, National Center for Cardiovascular Diseases, National Clinical Research Center of Cardiovascular Diseases, Chinese Academy of Medical Sciences and Peking Union Medical College, 100037 Beijing, China
3 Hypertension Center, Fuwai Hospital, State Key Laboratory of Cardiovascular Disease of China, National Center for Cardiovascular Diseases of China, Chinese Academy of Medical Sciences and Peking Union Medical College, 100037 Beijing, China
4 Department of Pharmacy, Beijing Hospital, National Center of Gerontology, Institute of Geriatric Medicine, Chinese Academy of Medical Sciences, Beijing Key Laboratory of Assessment of Clinical Drugs Risk and Individual Application (Beijing Hospital), 100730 Beijing, China
5 Graduate School, Peking University Fifth School of Clinical Medicine, 100730 Beijing, China
6 Graduate School, Peking Union Medical College, Chinese Academy of Medical Science, 100730 Beijing, China
7 Department of Information Center, Beijing Hospital, National Center of Gerontology, Institute of Geriatric Medicine, Chinese Academy of Medical Sciences, 100730 Beijing, China
8 Department of Cardiology, Fuwai Hospital, National Center for Cardiovascular Diseases, Chinese Academy of Medical Sciences and Peking Union Medical College, 100037 Beijing, China
9 Clinical Trial Center, Beijing Hospital, National Center of Gerontology, Institute of Geriatric Medicine, Chinese Academy of Medical Sciences, 100730 Beijing, China
†These authors contributed equally.
Abstract
The atherogenic index of plasma (AIP), calculated from triglyceride and high-density lipoprotein cholesterol levels, is associated with atherosclerosis and coronary artery disease (CAD). However, evidence concerning the impact of the AIP on CAD severity remains limited. This study aims to assess the correlation between AIP and the severity of CAD.
This study included 19,929 hospitalized participants diagnosed with CAD. After excluding participants with missing data, aged >75 years, or diagnosed with chronic kidney disease or cancer, a total of 2561 individuals were included. The 2561 participants were divided into three AIP tertile groups: AIP1 (AIP <0.016, n = 854), AIP2 (0.016 ≤ AIP < 0.216, n = 853), and AIP3 (AIP ≥0.216, n = 854). In this study, CAD severity was determined by the count of coronary arteries exhibiting stenosis of 50% or greater. Multivessel CAD was defined as ≥50% stenosis in two or more major coronary arteries. The relationship between AIP and CAD severity was assessed using logistic regression models.
Results indicate that the AIP independently predicts CAD severity, with an odds ratio of 1.700 (95% confidence interval (CI): 1.160–2.491; p = 0.007). The AIP3 group demonstrated a significantly higher risk of multivessel CAD compared to the AIP1 group (odds ratio (OR), 1.441; 95% CI: 1.124–1.848; p = 0.004), particularly in patients without diabetes mellitus (OR, 1.421; 95% CI: 1.030–1.962; p = 0.033).
The AIP was significantly associated with CAD severity, suggesting that it could be a convenient and valuable marker for severity stratification in patients with CAD in clinical practice.
Keywords
- coronary artery disease
- diabetes mellitus
- dyslipidemia
- lipoproteins
- triglycerides
- high-density lipoproteins
Coronary artery disease (CAD) is a significant global public health issue, contributing substantially to morbidity and mortality [1]. Systemic inflammation-induced atherosclerosis is the fundamental pathological mechanism of CAD [2]. Traditional lipid markers such as total cholesterol (TC), triglyceride (TG), and low-density lipoprotein cholesterol (LDL-C) are recognized predictors of CAD [3, 4]. Composite parameters such as TC/high-density lipoprotein cholesterol (HDL-C), TG/HDL-C, LDL-C/HDL-C, and non-HDL (TC minus HDL-C) have shown greater predictive value than individual lipid markers [5, 6]. The atherogenic index of plasma (AIP), introduced by Dobiásová and Frohlich in 2001, is calculated as log10 (TG/HDL-C) and effectively represents the balance between proatherogenic and antiatherogenic factors [7, 8]. Numerous studies have validated the AIP as an effective predictor of atherosclerosis and CAD [9, 10, 11, 12, 13].
A higher AIP has been shown to correlate with smaller LDL particle size, reflecting an increased proportion of small dense LDL particles [14]. According to published reports, sdLDL is more potent than LDL in eliciting atherogenic effects because of its susceptibility to oxidation and its propensity to stimulate the production of foam cells [14, 15, 16, 17]. However, the measurement technology for assessing sdLDL is complex and costly [18]. AIP has emerged as a convenient and economical surrogate marker for sdLDL [19, 20].
Coronary artery disease severity, particularly multivessel CAD, is strongly associated with adverse clinical outcomes. Although recent studies have increasingly associated AIP with CAD prognosis [9, 20, 21], research on its impact on CAD severity remains scarce. Evidence on the correlation between AIP and coronary artery stenosis severity across varying diabetes statuses is lacking. This research aimed to determine how AIP relates to CAD severity among a large cohort of patients and whether this relationship is influenced by the presence of diabetes.
The study adhered to the Declaration of Helsinki and received approval from the
Beijing Hospital ethics committee. All the participants provided written informed
consent. This cohort study included 19,929 participants diagnosed with CAD and
hospitalized at Beijing Hospital between January 2016 and December 2021. All the
patients were diagnosed with CAD by experienced clinicians according to clinical
symptoms combined with CT angiography (CTA) or coronary angiography (CAG). Those
aged
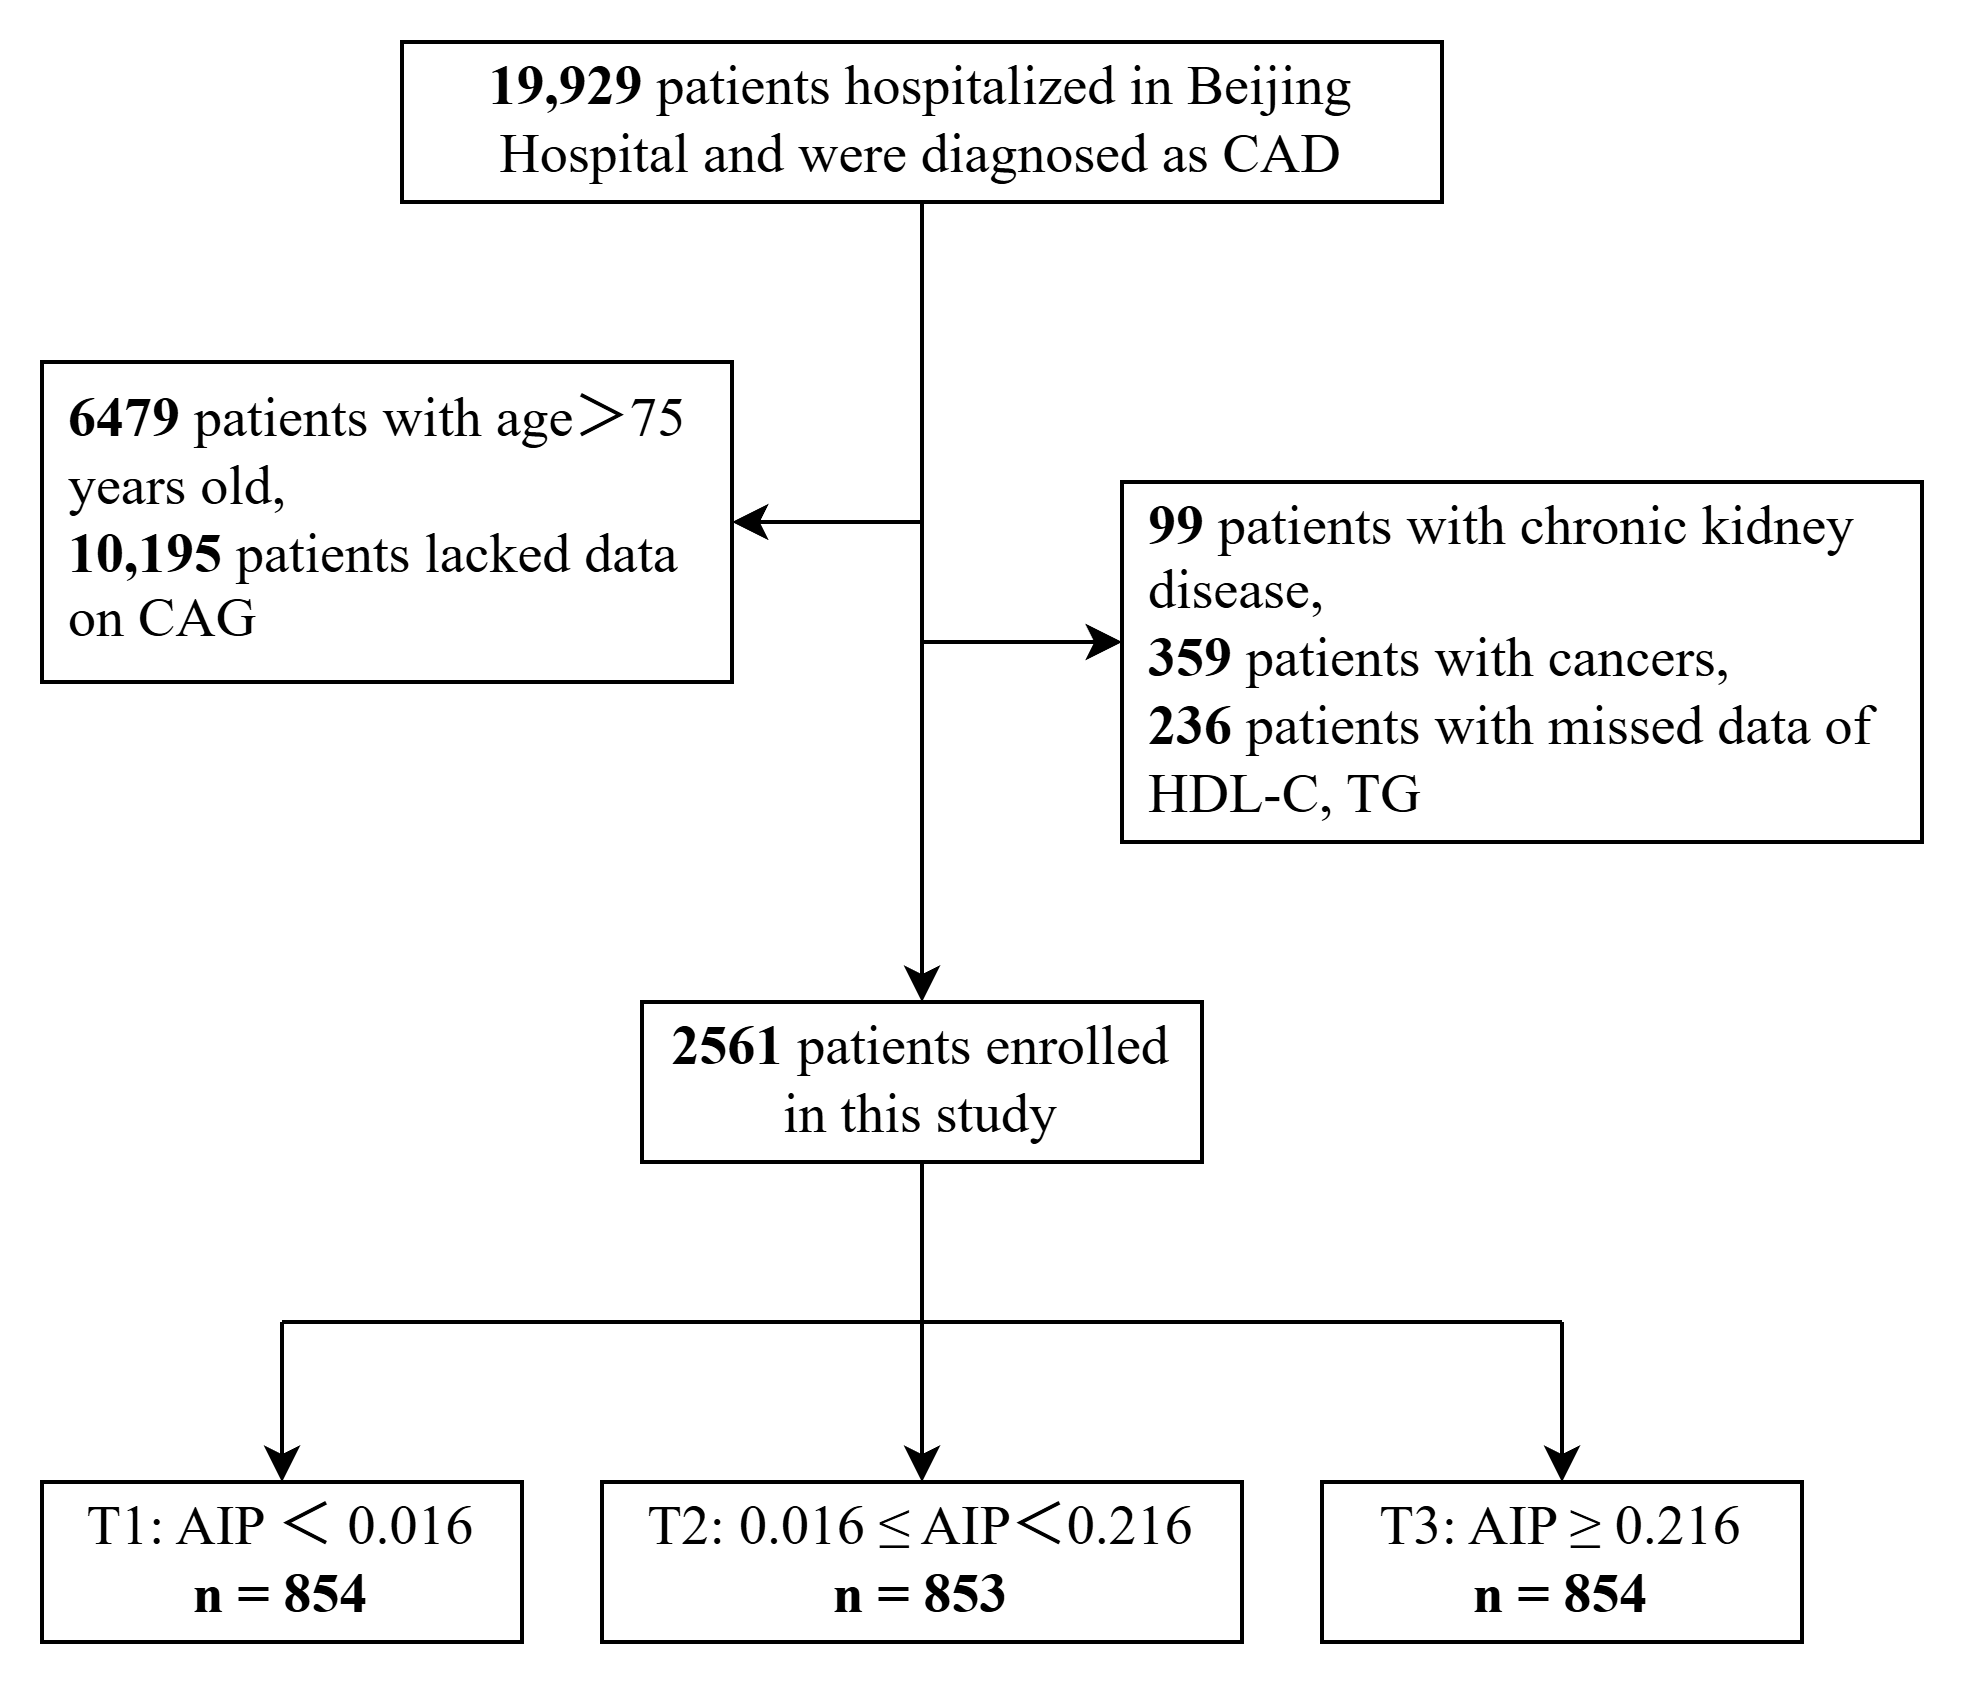 Fig. 1.
Flowchart of the study population. CAD, coronary artery disease; CAG, coronary angiography; HDL-C, high-density lipoprotein cholesterol; TG, triglyceride; AIP, atherogenic index of plasma.
Finally, 2561 participants were included in the present statistical analysis. We
divided the 2561 participants into three groups according to the AIP tertiles:
the AIP1 (AIP
The AIP was calculated using the formula log10 (TG/HDL-C). Fasting blood samples
(
The primary outcome was CAD severity. Experienced clinicians performed CAG
through percutaneous femoral access, remaining blinded to the study protocol.
Coronary artery disease severity was assessed by counting the coronary arteries
exhibiting stenosis of 50% or greater [22]. CAD was considered single-vessel if
only one major coronary artery had
Statistical analyses in this study were conducted using SPSS Statistics (Version
27.0.1; IBM, Armonk, NY, USA), R (Version 4.0.3; R Foundation for Statistical Computing, Vienna, Austria), and SAS (Version 9.4; SAS
Institute Inc., Cary, NC, USA). All p values were two-sided,
with p
Continuous variables are presented as mean
Three models were analyzed: Model 1 was unadjusted; Model 2 accounted for age and sex; Model 3 included additional adjustments for lifestyle factors, blood pressure, kidney function, BMI, and relevant medications, excluding those already considered in Model 2. Variables included in the multivariable regression were selected primarily on the basis of clinical experience and previously published literature [23].
Key clinical characteristics across AIP tertiles and CAD severity subgroups are
summarized below. The cohort included 2561 patients (mean age 63
| Variables | Total | AIP1 | AIP2 | AIP3 | p value | |
| (n = 2561) | (n = 854) | (n = 853) | (n = 854) | |||
| Age (years) | 63 |
65 |
63 |
61 |
||
| Male (n, %) | 1880 (73.41) | 572 (66.98) | 631 (73.97) | 677 (79.27) | ||
| FBG (mmol/L) | 6.41 |
5.99 |
6.32 |
6.92 |
||
| BMI (kg/m2) | 25.88 |
24.83 |
26.07 |
26.73 |
||
| HR (beats/min) | 77 |
76 |
77 |
78 |
0.81 | |
| SBP (mmHg) | 134 |
134 |
135 |
134 |
0.75 | |
| DBP (mmHg) | 78 |
77 |
78 |
78 |
0.02 | |
| HDL-C (mg/dL) | 1.03 |
1.22 |
1.00 |
0.86 |
||
| LDL-C (mg/dL) | 2.13 |
2.00 |
2.15 |
2.24 |
||
| TC (mg/dL) | 3.73 |
3.63 |
3.66 |
3.89 |
||
| TG (mg/dL) | 1.48 |
0.81 |
1.27 |
2.35 |
||
| HbA1c (%) | 6.65 |
6.42 |
6.60 |
6.91 |
||
| eGFR (mL/min) | 88.60 |
89 |
88.17 |
88.64 |
0.58 | |
| Tobacco users (n, %) | 1313 (51.27) | 374 (43.79) | 426 (49.94) | 513 (60.07) | ||
| Alcohol drinkers (n, %) | 1692 (66.07) | 540 (63.23) | 552 (64.71) | 600 (70.26) | 0.01 | |
| Hypertension (n, %) | 1752 (68.41) | 544 (63.70) | 585 (68.58) | 623 (72.95) | ||
| Glucose metabolism state | ||||||
| Non-DM (n, %) | 1388 (54.20) | 521 (61.01) | 476 (55.80) | 391 (45.78) | ||
| DM (n, %) | 1173 (45.80) | 333 (38.99) | 377 (44.20) | 463 (54.22) | ||
| Medications | ||||||
| Antiplatelets (n, %) | 2386 (93.17) | 798 (93.44) | 795 (93.20) | 793 (92.86) | 0.89 | |
| Antihypertensive drugs (n, %) | 2085 (81.41) | 662 (77.52) | 700 (82.06) | 723 (84.66) | ||
| Antilipidemic drugs (n, %) | 2388 (93.24) | 797 (93.33) | 799 (93.67) | 792 (92.74) | 0.74 | |
FBG, fasting blood glucose; BMI, body mass index; HR, heart rate; SBP, systolic blood pressure; DBP, diastolic blood pressure; LDL-C, low-density lipoprotein cholesterol; TC, total cholesterol; HbA1c, glycated hemoglobin A1c; eGFR, estimated glomerular filtration rate; DM, diabetes mellitus.
Table 2 presents the clinical and demographic characteristics of patients
categorized by single-vessel or multivessel CAD. A total of 1990 patients had
multivessel CAD. Patients with multivessel CAD were older and predominantly male
compared to those with single-vessel disease (all p
| Variables | Total | Single-vessel CAD | Multivessel CAD | p value | |
| (n = 2561) | (n = 571) | (n = 1990) | |||
| Age (years) | 63 |
62 |
63 |
0.05 | |
| Male (n, %) | 1880 (73.41) | 350 (61.30) | 1530 (76.88) | ||
| AIP | 0.11 |
0.08 |
0.12 |
0.08 | |
| FBG (mmol/L) | 6.41 |
5.91 |
6.55 |
||
| BMI (kg/m2) | 25.88 |
26.06 |
25.83 |
0.15 | |
| HR (beats/min) | 77 |
77 |
77 |
0.40 | |
| SBP (mmHg) | 134 |
134 |
134 |
0.77 | |
| DBP (mmHg) | 78 |
78 |
78 |
0.97 | |
| HDL-C (mg/dL) | 1.03 |
1.08 |
1.01 |
||
| LDL-C (mg/dL) | 2.13 |
2.15 |
2.13 |
0.47 | |
| TC (mg/dL) | 3.73 |
3.79 |
3.71 |
0.06 | |
| TG (mg/dL) | 1.48 |
1.47 |
1.48 |
0.77 | |
| HbA1c (%) | 6.65 |
6.26 |
6.76 |
||
| eGFR | 88.60 |
91.25 |
87.84 |
||
| Tobacco users (n, %) | 1313 (51.27) | 244 (42.73) | 1069 (53.72) | ||
| Alcohol drinkers (n, %) | 1692 (66.07) | 374 (65.50) | 1318 (66.23) | 0.74 | |
| Hypertension (n, %) | 1752 (68.41) | 361 (63.22) | 1391 (69.90) | ||
| Glucose metabolism state | |||||
| Non-DM (n, %) | 1388 (54.20) | 377 (66.02) | 1011 (50.80) | ||
| DM (n, %) | 1173 (45.80) | 194 (33.98) | 979 (49.20) | ||
| Medications | |||||
| Antiplatelets (n, %) | 2386 (93.17) | 523 (91.59) | 1863 (93.62) | 0.08 | |
| Antihypertensive drugs (n, %) | 2085 (81.41) | 437 (76.53) | 1648 (82.81) | ||
| Antilipidemic drugs (n, %) | 2388 (93.24) | 529 (92.64) | 1859 (93.42) | 0.52 | |
Higher AIP levels were consistently associated with greater CAD severity across unadjusted and fully adjusted models. Logistic regression outcomes are detailed in Table 3. In Model 1, univariate analysis indicated that the AIP was significantly correlated with CAD severity (OR, 1.667; 95% CI: 1.179–2.356; p = 0.004). Compared with the AIP1 group, AIP2 and AIP3 were associated with higher odds (AIP2: OR 1.384, 95% CI: 1.105–1.734; p = 0.005; AIP3: OR 1.459, 95% CI: 1.163–1.830; p = 0.001). In Model 2, after adjusting for age and sex, AIP, as a continuous variable, was significantly linked to multivessel CAD (OR, 1.770; 95% CI: 1.234–2.540; p = 0.002). Subsequent modifications revealed elevated risks of 1.339-fold for the AIP2 group (OR, 1.339; 95% CI: 1.057–1.698; p = 0.016) and 1.441-fold for the AIP3 group (OR, 1.441; 95% CI: 1.124–1.848; p = 0.004). After adjusting for age, sex, tobacco and alcohol use, SBP, DBP, eGFR, BMI, and the use of antiplatelet, antihypertensive, and antilipidemic drugs, multivariate analysis identified AIP as a continuous variable that remains an independent risk factor for CAD severity (OR, 1.700; 95% CI: 1.160–2.491; p = 0.007). Using the AIP1 group as a reference, the AIP2 group exhibited a 1.339-fold increased risk of multi-vessel CAD (OR, 1.339; 95% CI: 1.057–1.698; p = 0.016), while the AIP3 group showed a 1.441-fold increase (OR, 1.441; 95% CI: 1.124–1.848; p = 0.004).
| Groups | Model 1 | Model 2 | Model 3 | ||||||
| OR | 95% CI | p value | OR | 95% CI | p value | OR | 95% CI | p value | |
| AIP | 1.667 | 1.179–2.356 | 0.004 | 1.77 | 1.234–2.540 | 0.002 | 1.700 | 1.160–2.491 | 0.007 |
| AIP1 | Ref. | - | - | Ref. | - | - | Ref. | - | - |
| AIP2 | 1.384 | 1.105–1.734 | 0.005 | 1.38 | 1.091–1.737 | 0.006 | 1.339 | 1.057–1.698 | 0.016 |
| AIP3 | 1.459 | 1.163–1.830 | 0.001 | 1.481 | 1.169–1.876 | 0.001 | 1.441 | 1.124–1.848 | 0.004 |
Note: Model 1: Original model.
Model 2 is adjusted for both age and sex.
Model 3 was adjusted for variables including age, sex, tobacco and alcohol use, systolic and diastolic blood pressure, estimated glomerular filtration rate, body mass index, and the use of antiplatelet, antihypertensive, and antilipidemic medications. OR, odds ratio; CI, confidence interval.
Table 4 presents the relationship between AIP and CAD severity, categorized by diabetes status. In Model 3, with adjustment for age, sex, tobacco and alcohol use, SBP, DBP, eGFR, BMI, and the use of antiplatelet drugs, antihypertensive drugs, and antilipidemic drugs, the AIP2 (OR, 1.415; 95% CI: 1.051–1.904; p = 0.022) and AIP3 (OR, 1.421; 95% CI: 1.030–1.962; p = 0.033) groups were significantly linked to CAD severity in the non-DM subgroup.
| Diabetes status | Model 1 | Model 2 | Model 3 | |||||||
| OR | 95% CI | p value | OR | 95% CI | p value | OR | 95% CI | p value | ||
| Non-DM | ||||||||||
| AIP | 1.452 | 0.932–2.263 | 0.099 | 1.536 | 0.964–2.447 | 0.071 | 1.521 | 0.929–2.488 | 0.095 | |
| AIP1 | Ref. | - | - | Ref. | - | - | Ref. | - | - | |
| AIP2 | 1.489 | 1.125–1.971 | 0.005 | 1.483 | 1.114–1.974 | 0.007 | 1.415 | 1.051–1.904 | 0.022 | |
| AIP3 | 1.367 | 1.020–1.833 | 0.037 | 1.391 | 1.025–1.889 | 0.034 | 1.421 | 1.030–1.962 | 0.033 | |
| DM | ||||||||||
| AIP | 1.403 | 0.791–2.490 | 0.247 | 1.436 | 0.793–2.598 | 0.232 | 1.464 | 0.778–2.756 | 0.237 | |
| AIP1 | Ref. | - | - | Ref. | - | - | Ref. | - | - | |
| AIP2 | 1.118 | 0.759–1.647 | 0.574 | 1.099 | 0.740–1.633 | 0.639 | 1.114 | 0.739–1.679 | 0.607 | |
| AIP3 | 1.259 | 0.864–1.835 | 0.23 | 1.240 | 0.837–1.837 | 0.282 | 1.228 | 0.813–1.856 | 0.328 | |
Note: Model 1: Original model.
Model 2 is adjusted for both age and sex.
Model 3 was adjusted for variables including age, sex, tobacco and alcohol use, systolic and diastolic blood pressure, estimated glomerular filtration rate, body mass index, and the use of antiplatelet, antihypertensive, and antilipidemic medications.
The study identified a significant link between the AIP and multivessel CAD, suggesting that AIP could be a valuable indicator of CAD severity, even after accounting for clinical risk factors. Notably, this association was stronger in individuals without diabetes.
Recent studies indicate that composite lipid parameters, like the triglyceride–glucose (TyG) index and the AIP, are more effective than individual lipid components in predicting cardiovascular disease risk and mortality [24, 25]. sdLDL is highly susceptible to oxidation, forming oxidized low-density lipoprotein that triggers inflammatory responses in the subendothelial layer of blood vessels, leading to foam cell generation and atherosclerosis [26]. The AIP indicates the balance between triglycerides and HDL-C and is strongly correlated with sdLDL, supporting its predictive capability. Consequently, the AIP can be utilized as an alternative indicator for evaluating sdLDL levels [19, 20]. HDL-C, another characteristic of AIP, is antiatherogenic [27]. Since the AIP can reflect the esterification rate of HDL particles, it offers a more precise assessment of cardiovascular risk than measuring HDL-C alone does [7].
Wu et al. [28] employed a case–control design to investigate the subject, identified the AIP as an independent cardiovascular risk factor, consistent with previous studies. A prospective 7.8-year follow-up study involving 52,676 Turkish adults demonstrated that the AIP is a reliable predictor of CAD events and cardiovascular disease (CVD) in both genders. A meta-analysis revealed that elevated AIP values independently correlate with an increased risk of CAD [10]. The underlying mechanism may be related to the consistency between the AIP and plasma atherogenicity. The AIP was linked to atherogenic factors such as obesity, diabetes mellitus, serum uric acid, C-reactive protein, and oxidative stress [11, 14, 29, 30]. These risk factors contribute to CAD development and may explain the high predictive value of the AIP. This study reaffirms the AIP’s efficacy as a biomarker for severe CAD by further investigating its association with CAD severity.
Multivessel CAD is associated with a greater risk of adverse clinical outcomes compared to single-vessel CAD, even following percutaneous coronary intervention (PCI) therapy [31]. Multivessel CAD complicates PCI and indicates the severity of the condition. In this study, higher AIP levels were linked to an elevated risk of multivessel CAD, with AIP identified as an independent predictor of CAD severity. In an observational study that included 1478 young adults with acute coronary syndrome, the AIP was correlated with the number of diseased vessels [32]. Consistent with prior studies, our analysis revealed a strong link between increased AIP and the severity of CAD in a substantial patient cohort. Moreover, on the basis of our observations, the impact of the AIP on multivessel CAD was more pronounced in those without DM. The convergence of findings underscores the AIP’s potential as a biomarker for predicting CVD and suggests that, without diabetes-related metabolic disturbances, the AIP may have a clearer and more precise association with coronary artery lesion development. This may be because, in patients without DM, the absence of DM-related confounding factors on lipid metabolism and vascular function allows the AIP to more accurately represent the mechanisms of atherosclerotic progression. In clinical practice, the AIP may assist in identifying patients at higher risk of extensive coronary disease, particularly among those without diabetes. Future research could focus on exploring the specific pathophysiological pathways through which the AIP plays a predictive role in this particular patient group. Additionally, prospective studies are still necessary to further confirm the clinical utility of the AIP in predicting multivessel coronary artery lesions in patients without DM.
It is important to acknowledge certain limitations of this study. This single-center retrospective study may be subject to selection bias due to the exclusion of numerous patients lacking coronary angiography data, those over 75 years of age, or those meeting other exclusion criteria. Therefore, caution is advised when generalizing these findings to broader populations. Second, the presence of unknown confounding factors, such as variations in education, employment status, and lifestyle habits, which were not captured or analyzed in this study, could influence the observed associations. Future research should focus on overcoming these limitations by conducting larger, diverse prospective studies that thoroughly evaluate a broader spectrum of potential confounders. A limitation of this study is the exclusion of SYNTAX scores, preventing the analysis of their correlation with AIP scores. Future studies are required to clarify the relationship.
An in-depth analysis demonstrated a significant association between the AIP and the risk of multivessel CAD. This association underscores the potential of the AIP as a valuable marker for predicting disease severity and stratifying risk in patients with CAD.
AIP, atherogenic index of plasma; CAD, coronary artery disease; BMI, body mass index; eGFR, estimated glomerular filtration rate; HDL-C, high-density lipoprotein cholesterol; TC, total cholesterol; LDL-C, low-density lipoprotein cholesterol; TG, triglyceride; CVD, cardiovascular disease; sdLDL, small dense LDL; DM, diabetes mellitus; CAG, coronary angiography; SBP, systolic blood pressure; DBP, diastolic blood pressure; FBG, fasting blood glucose; HbA1c, glycated hemoglobin A1c; CI, confidence interval; OR, odds ratio; HR, heart rate.
The data underlying this study are not publicly available as they include patient-level data, but are available from the corresponding author on reasonable request.
XW, WX, XM, and FW contributed to the conception and design of the study and critically reviewed the manuscript for important intellectual content. FW, YX, and ZNZ organized the database and critically reviewed the revised manuscript. QS performed the statistical analysis and participated in revising the manuscript. WX and XM drafted the initial manuscript. ZYZ and CY contributed to the interpretation of results and critically reviewed the revised manuscript. YL, CX, and JW participated in the data collection work and assisted with manuscript revision. All authors read and approved the final manuscript. All authors have participated sufficiently in the work and agreed to be accountable for all aspects of the work.
This cohort study conformed to the Declaration of Helsinki and was approved by the Ethics Committee of Beijing Hospital (Approval No.: 2024BJYYEC-KY218-01). Written informed consent was obtained from all the patients.
The authors thank all the members of the Beijing hospital for their contribution.
This work was supported by National High-Level Hospital Clinical Research Funding (No. BJ-2024-180), National High-Level Hospital Clinical Research Funding (No. BJ-2023-170), National Natural Science Foundation of China (No. 82470363) and National High Level Hlospital Clinical Research Funding (No. BJ-2024-245).
The authors declare no conflict of interest.
Artificial intelligence tools (specifically, ChatGPT by OpenAI) were used to assist with language editing. The authors reviewed, edited, and approved all content, and accept full responsibility for the integrity and accuracy of the final version. No AI tools were used in the design, data collection, analysis, or interpretation of the study.
Supplementary material associated with this article can be found, in the online version, at https://doi.org/10.31083/RCM45510.
References
Publisher’s Note: IMR Press stays neutral with regard to jurisdictional claims in published maps and institutional affiliations.