


 , Chaoen Luo 3, Jinzhou Cai 1, Asfandyar Khan 1, Yaoguang Feng 1, Zhengwen Lei 1,*
1 Department of Cardiothoracic Surgery, The First Affiliated Hospital, Hengyang Medical School, University of South China, 421009 Hengyang, Hunan, China
2 Department of Thoracic Surgery, Yueyang Central Hospital, 414000 Yueyang, Hunan, China
3 Department of Thoracic Surgery, Yueyang People’s Hospital, Hunan Normal University, 414000 Yueyang, Hunan, China
Abstract
The mechanism involved in retrograde type A aortic dissection (RTAD) remains unclear, while research through morphological studies is limited. Therefore, this study aimed to compare the aortic geometric features between RTAD and type B aortic dissection (TBAD) and to identify specific anatomical predictors of RTAD.
A total of 60 patients diagnosed with acute aortic dissection, with the primary entry tear located in the descending aorta, were included based on aortic computed tomography angiography (CTA) performed at our center between November 2019 and November 2023. Among them, 21 were RTAD cases, and 39 were TBAD cases. Aortic CTA morphological data were collected using Carestream Image Suite V4 and EndoSize software. Retrospective statistical analysis was performed using SPSS 26 and RStudio to explore relationships among aortic and aortic arch morphologies, angles, primary tear location, tear size, and dissection type.
(1) No significant differences were observed between the two groups in gender, age, height, weight, body mass index (BMI), hyperlipidemia, hypertension, diabetes, coronary artery disease, or smoking history (all p > 0.05). (2) Multivariate logistic analysis revealed that reduced minimum diameter of the ascending aorta (odds ratio (OR) 0.488, 95% confidence interval (CI) 0.245–0.974; p = 0.042), increased maximum diameter of the ascending aorta (OR 2.318, 95% CI 1.107–4.857; p = 0.026), and reduced minimum diameter of the distal aortic arch (OR 0.594, 95% CI 0.362–0.974; p = 0.039) were significant predictors of RTAD. (3) The RTAD risk prediction model demonstrated excellent predictive performance and robustness across datasets and experimental conditions, effectively identifying high-risk patients and providing reliable support for clinical decision-making (C-index = 0.952; area under the curve (AUC) = 0.952). Calibration curves showed high consistency between predicted probabilities and observed outcomes, and decision curve analysis (DCA) indicated significant clinical net benefits across a wide range of threshold probabilities.
(1) Reduced minimum diameter of the ascending aorta, increased maximum diameter of the ascending aorta, and reduced minimum diameter of the distal aortic arch are specific predictors of TBAD progressing to RTAD. (2) The RTAD risk prediction model, incorporating these high-risk factors, offers clinical guidance for the prevention and early intervention of RTAD.
Keywords
- RTAD
- TBAD
- retrograde tear
- morphological high-risk factors
- risk prediction model
Aortic dissection is an acute, rapidly progressing, and life-threatening cardiovascular emergency characterized by a tear in the aortic intima, allowing blood to enter the medial layer and form true and false lumens. Based on the tear location and extent, aortic dissection is classified into two main types. The DeBakey classification divides it into types I (originating in the ascending aorta and extending to the arch and descending aorta), II (confined to the ascending aorta), and III (originating in the descending aorta). The Stanford classification categorizes it as type A (involving the ascending aorta) or type B (not involving the ascending aorta), with Stanford A encompassing DeBakey I/II and Stanford B corresponding to DeBakey III. Type A dissections are more common and clinically critical [1, 2]. The estimated annual incidence of aortic dissection is 2.5–3.5 per 100,000 individuals. Approximately 65% originate in the ascending aorta, 20% in the descending aorta, 10% in the aortic arch, and 5% in the abdominal aorta. It predominantly affects males (65%) aged 60–70 years [3, 4, 5, 6]. Due to its unique retrograde propagation characteristics, retrograde type A aortic dissection (RTAD) is relatively uncommon, accounting for 5% to 25% of Type A aortic dissections [7, 8]. RTAD represents a special subset of type A aortic dissection (TAAD), where the primary intimal tear originates distal to the left subclavian artery and propagates retrograde to involve the ascending aorta. RTAD constitutes approximately 9% of TAAD cases [9]. Sun Lizhong [10] proposed that RTAD represents a rare subtype of aortic dissection (Fig. 1), typically originating in the descending aorta and propagating retrogradely to the ascending aorta, classified as the “AC type” (complex Type A) in refined aortic dissection classifications due to its involvement of the aortic arch and branch arteries. Owing to its retrograde trajectory and invasion of the ascending aorta, RTAD poses significant therapeutic challenges, with high mortality rates and ongoing debates regarding optimal management [11]. Some studies suggest that RTAD patients may have better prognoses than classic TAAD patients, advocating for endovascular therapy or medical management [12, 13, 14]. Conversely, other experts recommend aggressive surgical intervention, including total arch replacement with frozen elephant trunk (FET) repair, combined with distal malperfusion correction and primary entry tear exclusion to prevent early- and mid-term complications [15, 16]. Morphological differences between dissection types influence pathophysiology, diagnosis, and treatment. RTAD-specific features may include tear location, false lumen characteristics, and hemodynamic variations [17, 18, 19, 20, 21]. However, research on RTAD morphology remains limited compared to clinical and therapeutic studies. This study compares RTAD and type B aortic dissection (TBAD) patients to identify RTAD-specific morphological risk factors, aiming to enhance clinical decision-making and prognosis.
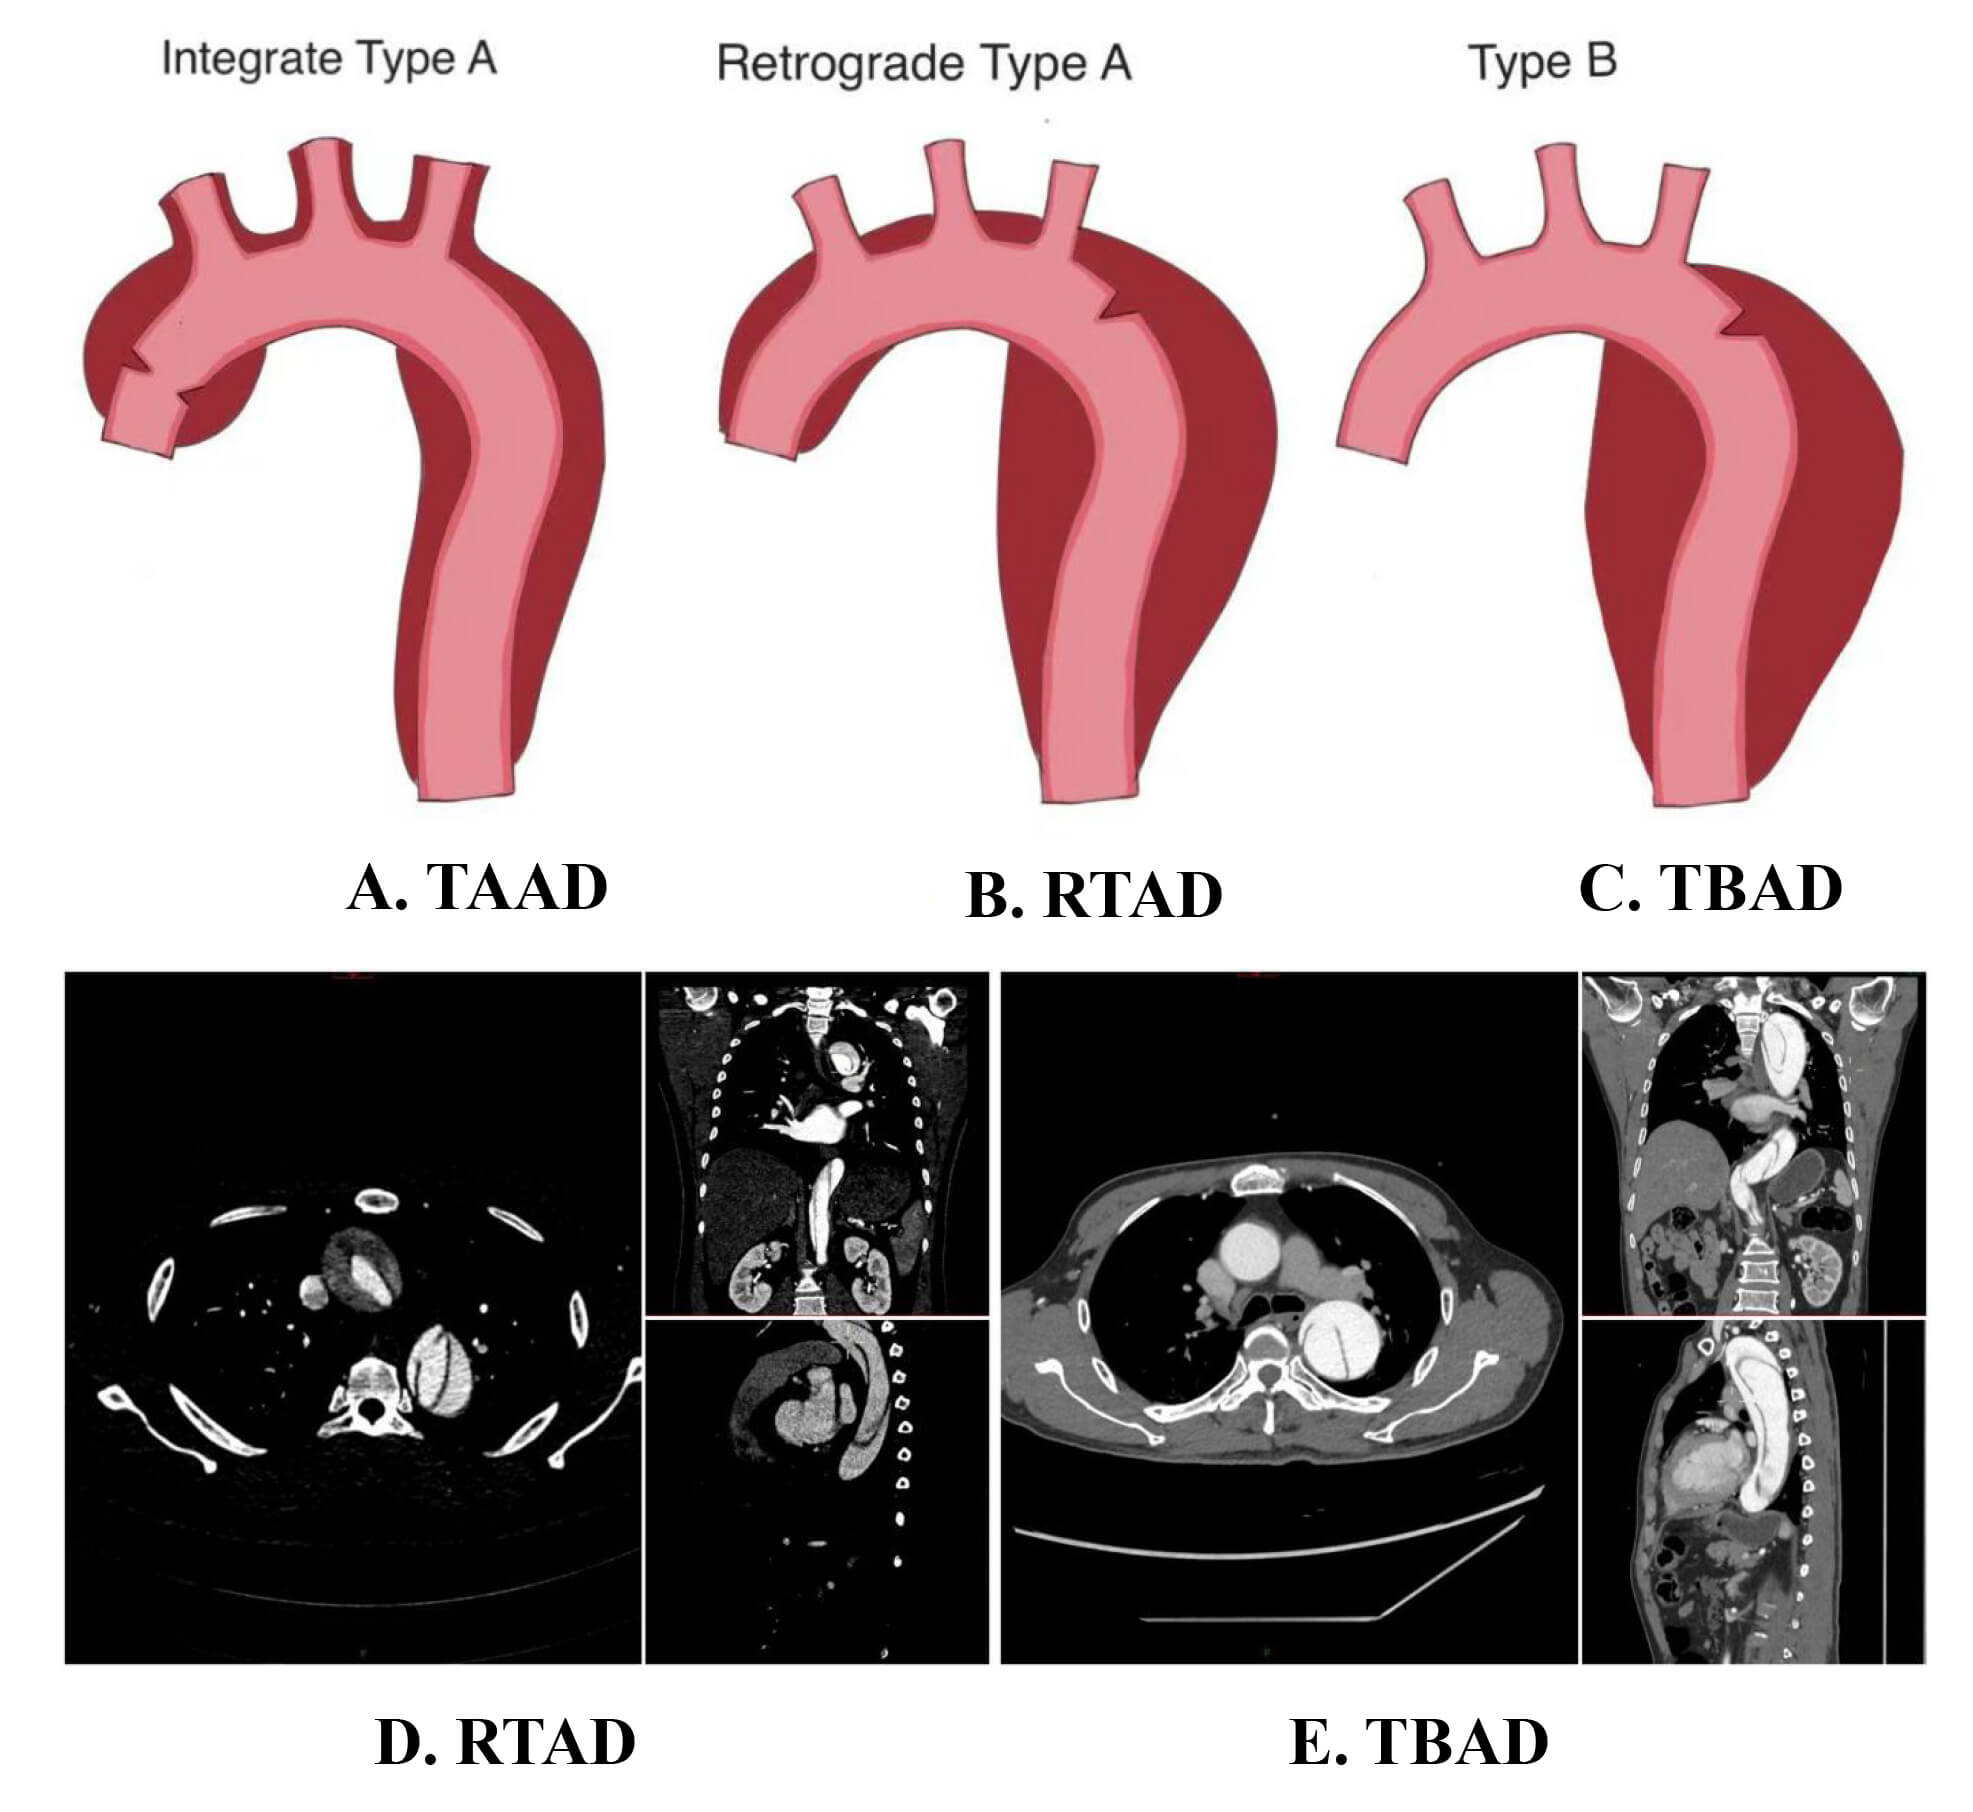 Fig. 1.
Schematic diagrams of different types of aortic dissection. (A) Tear location and extent of involvement in TAAD. (B) Tear location and extent of involvement in RTAD. (C) Tear location and extent of involvement in TBAD. (D) CTA imaging of RTAD in axial, coronal, and sagittal planes. (E) CTA imaging of TBAD in axial, coronal, and sagittal planes. TAAD, type A aortic dissection; RTAD, retrograde type A aortic dissection; TBAD, type B aortic dissection; CTA, computed tomography angiography.
This retrospective study analyzed 60 patients diagnosed with aortic dissection between November 2019 and November 2023, all with primary entry tears in the descending aorta. In the study design, we used a sample size estimation formula for binary variables based on the incidence rates reported in previous studies. We calculated with an alpha of 0.05 and a power of 0.80, and the results showed that at least 20 patients per group would meet the requirements for model analysis. The study ultimately included 21 patients with RTAD and 39 with TBAD. Demographic and clinical data, including gender, age, height, weight, body mass index (BMI), clinical presentation, medical history (e.g., hyperlipidemia, hypertension, diabetes, coronary artery disease), and prior cardiac/thoracic trauma/surgery, were collected from medical records. Aortic morphological parameters were measured using Carestream Image Suite V4 (New York, USA) and EndoSize (Endovastec, Shanghai, China) software, including:
(1) Maximum/minimum diameters of the aortic root, ascending aorta,
proximal/distal aortic arch, and true/false lumen areas. (2) Aortic arch
morphology, entry tear location (greater/lesser curvature, anterior/posterior
wall), tear size (length
(1) Confirmed diagnosis of aortic dissection via preoperative imaging (computed
tomography angiography (CTA), MRI, or ultrasound). (2) Complete imaging data
(dissection length, thickness, tear location, true/false lumen ratio). (3) RTAD
group: Dissection involving the ascending aorta but originating in the descending
aorta, with no tears in the ascending aorta/aortic arch and primary tear located
distal to the left subclavian artery. (4) Acute phase (symptom onset
(1) Chronic phase (symptom onset
The study selection process is shown in Fig. 2.
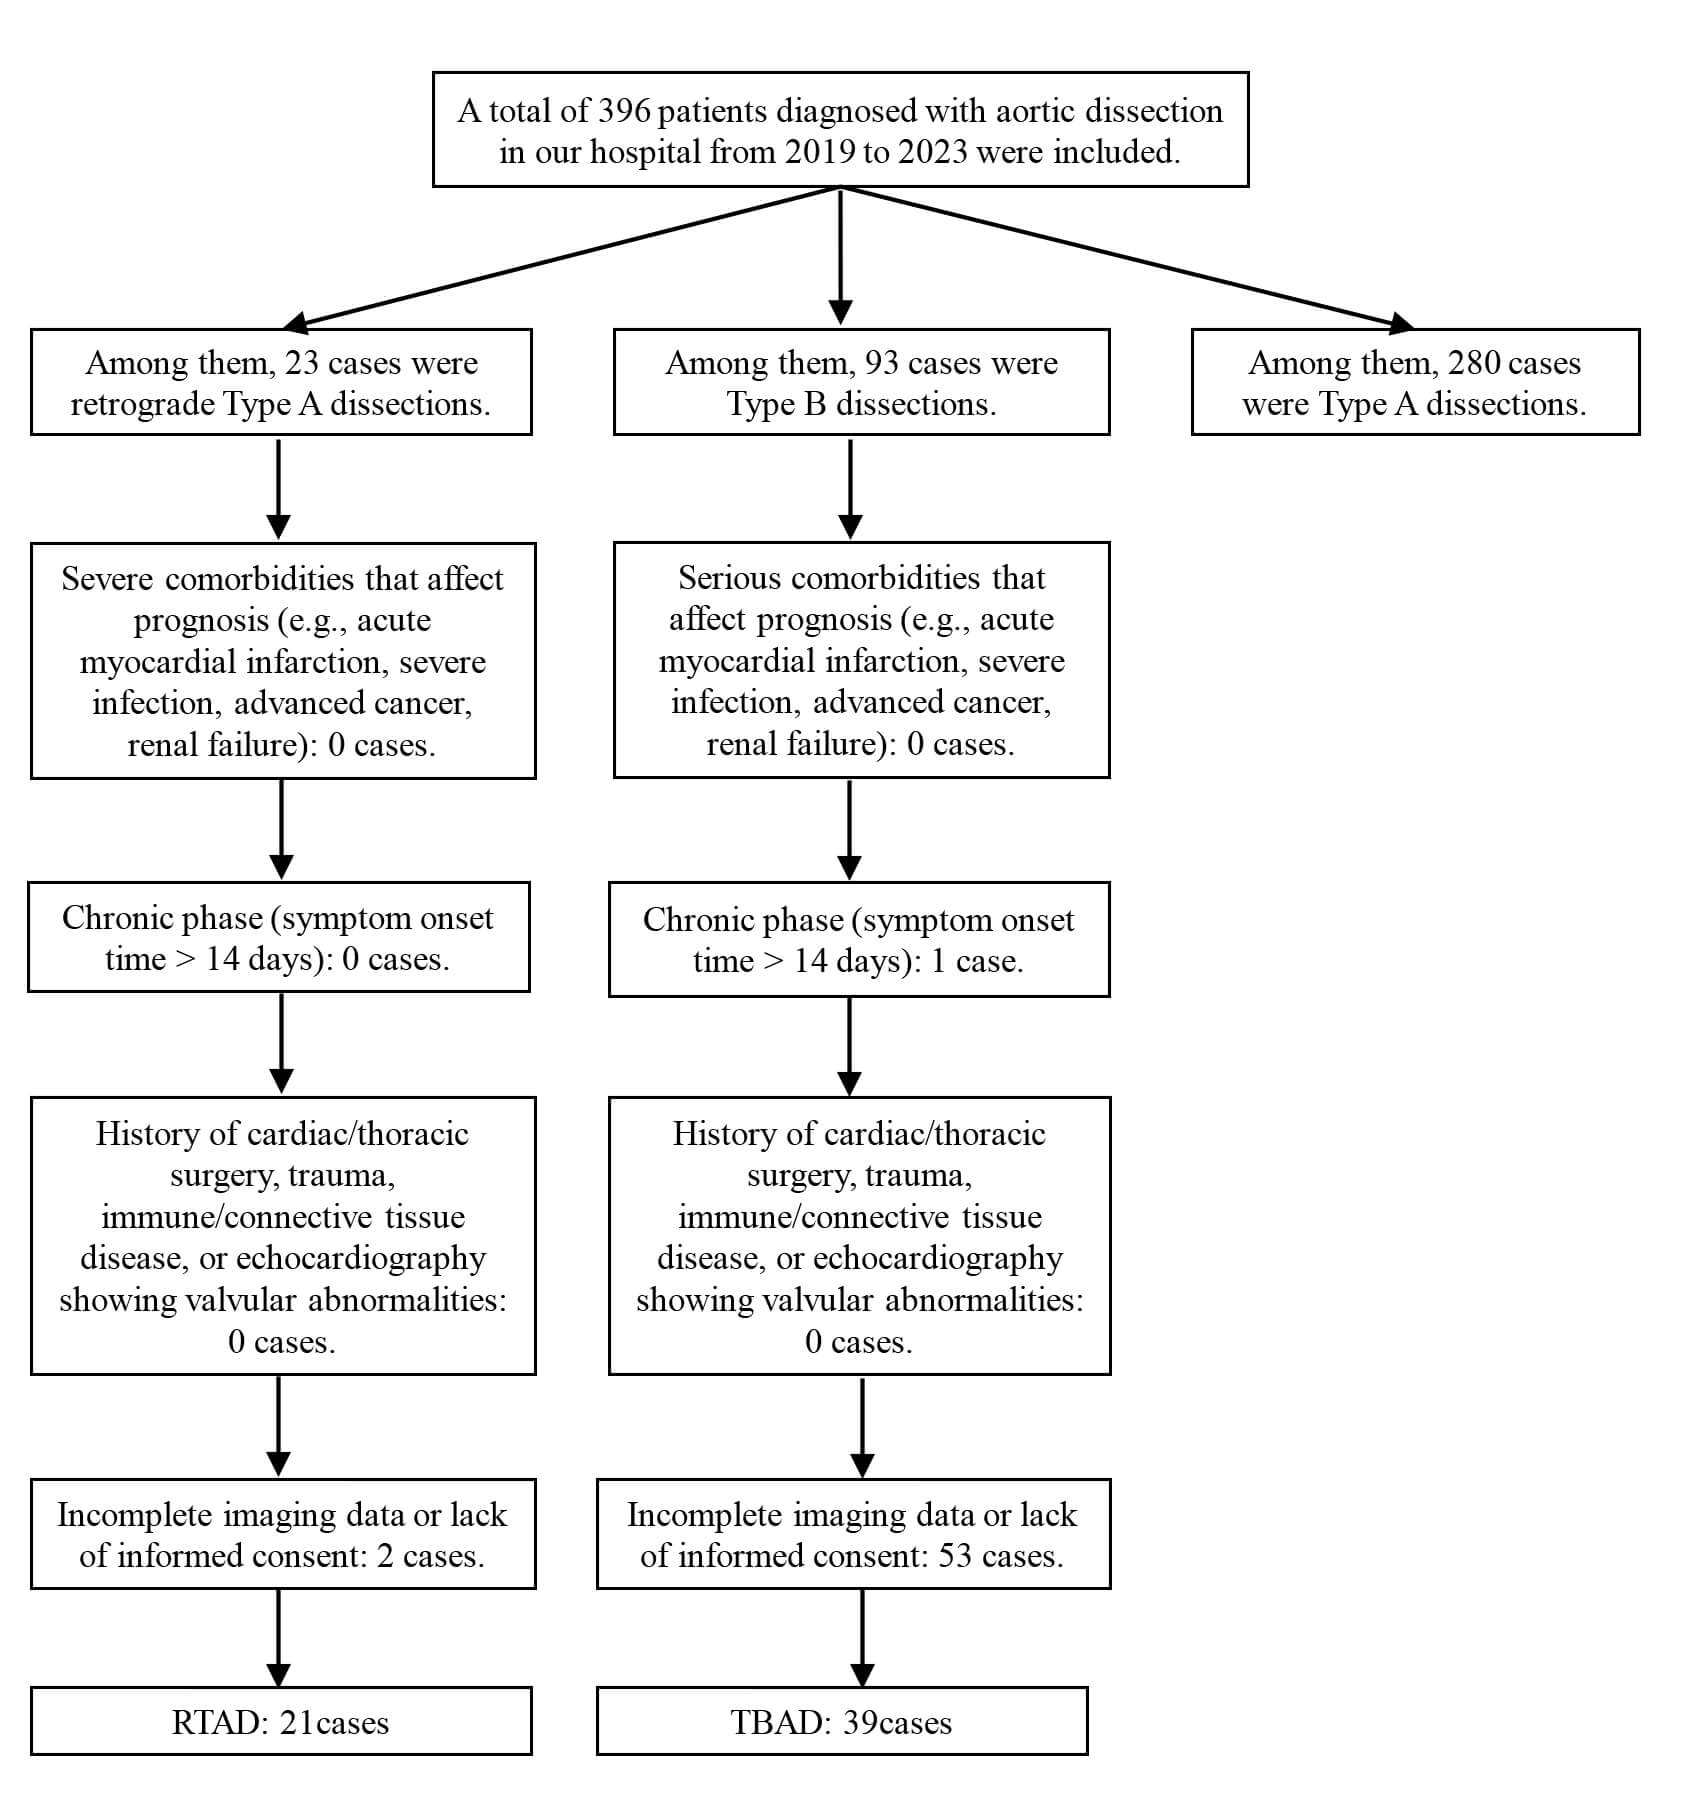 Fig. 2.
Flow Chart for Patient Selection.
Gender, age, height, weight, BMI, hyperlipidemia, hypertension, diabetes, coronary artery disease, and smoking history.
Statistical Analysis: IBM SPSS Statistics 26.0 (Armonk, New York, USA) was used to compare morphological parameters between groups, including aortic diameters, true/false lumen areas, tear characteristics, and aortic arch angles (Fig. 3). Least Absolute Shrinkage and Selection Operator (LASSO) Regression: Dimensionality reduction was applied to identify significant variables. Multivariate Logistic Analysis: Predictive factors were incorporated into a risk model to identify RTAD-specific high-risk factors. Imaging Analysis: Measurements were independently performed by two senior radiologists and one cardiothoracic surgeon to ensure consistency.
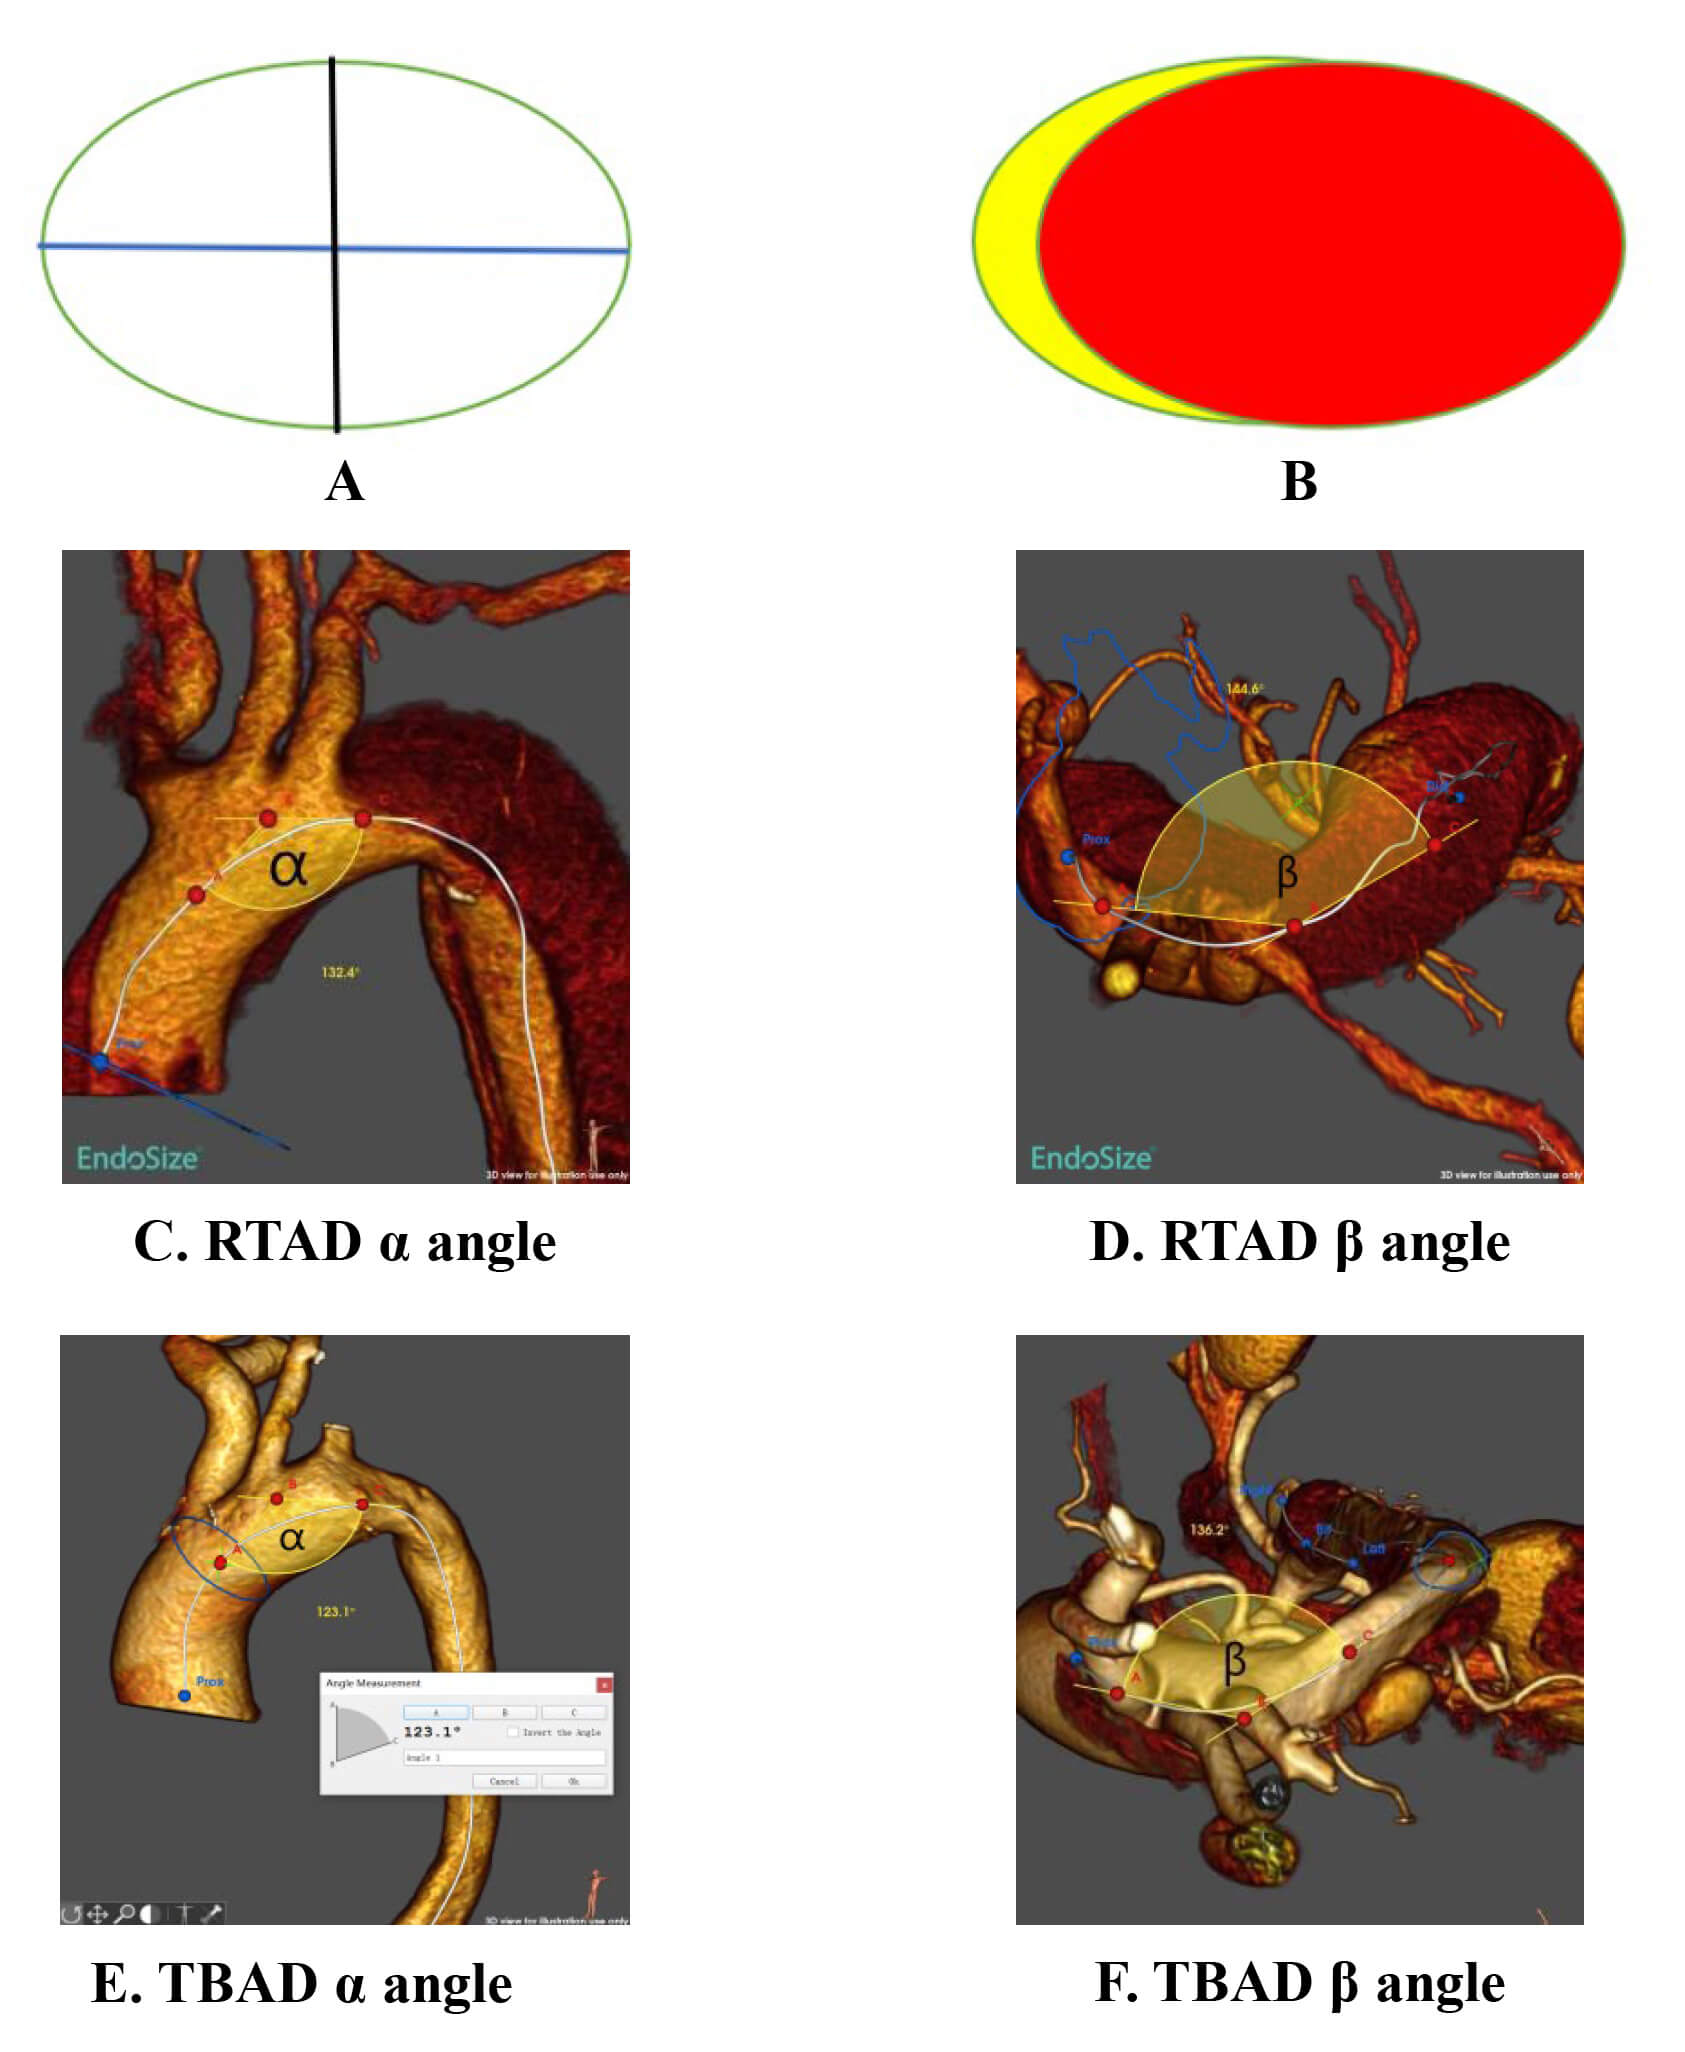 Fig. 3.
Schematic diagram of measurement methods for aortic diameter, angle, and area. (A) Black line: Minimum diameter; Blue line: Maximum
diameter. (B) Yellow: False lumen area; Red: True lumen area. (C) Maximum
projection direction of the aortic arch (alpha angle,
(1)
Procedure: The aortic centerline was reconstructed using EndoSize software. The
Continuous variables: Normally distributed data were expressed as mean
The diameter was measured at the aortic root, specifically at the sinus of Valsalva.
Both the maximum and minimum diameters were measured in the upper segment of the ascending aorta.
Based on the anatomical structure of the aortic arch, we defined two measurement levels for the proximal and distal segments. The proximal measurement was taken near the origin of the brachiocephalic artery, and the distal measurement was taken near the origin of the left subclavian artery.
The study included 60 patients: 39 in the TBAD group (32 males, 7 females; mean
age 54.18
| Clinical data | TBAD (n = 39) | RTAD (n = 21) | t/ |
p-value | |
| Sex | 1.071 | 0.301 | |||
| Male | 32 (82.1%) | 20 (95.2%) | |||
| Female | 7 (17.9%) | 1 (4.8%) | |||
| Age | 54.18 |
49.33 |
1.420 | 0.161 | |
| Height | 168.72 |
168.57 |
0.097 | 0.923 | |
| Weight (kg) | 71.26 |
71.14 |
0.040 | 0.968 | |
| BMI (kg/m2) | 24.97 |
24.92 |
0.071 | 0.944 | |
| Dyslipidemia | - | 0.287 | |||
| Yes | 4 (10.3%) | 0 (0%) | |||
| No | 35 (89.7%) | 21 (100.0%) | |||
| Hypertension | 0.012 | 0.914 | |||
| Yes | 37 (94.9%) | 19 (90.5%) | |||
| No | 2 (5.1%) | 2 (9.5%) | |||
| Smoking history | 2.883 | 0.090 | |||
| Yes | 18 (46.2%) | 5 (23.8%) | |||
| No | 21 (53.8%) | 16 (76.2%) | |||
| Diabetes | 0.293 | 0.558 | |||
| Yes | 5 (12.8%) | 1 (4.8%) | |||
| No | 34 (87.2%) | 20 (95.2%) | |||
| Coronary artery disease | |||||
| Yes | 3 (7.7%) | 1 (4.8%) | |||
| No | 36 (92.3%) | 20 (95.2%) | |||
BMI, body mass index.
For maximum aortic root diameter, minimum aortic root diameter, maximum ascending aortic diameter, minimum ascending aortic diameter, maximum proximal aortic arch diameter, minimum proximal aortic arch diameter, maximum distal aortic arch diameter, and minimum distal aortic arch diameter, the p-values of the difference analysis were all less than 0.05, indicating statistically significant differences between the two groups in these variables, with the RTAD group showing smaller diameters compared to the TBAD group. For other parameters, the p-values of the difference analysis were all greater than 0.05, suggesting no statistically significant differences between the two groups in those variables. Details are provided in Table 2.
| Clinical data | TBAD (n = 39) | RTAD (n = 21) | t value | p value |
| Maximum diameter of the aortic root | 37.78 |
32.53 |
3.639 | 0.001* |
| Minimum diameter of the aortic root | 33.95 |
23.92 |
5.964 | 0.001* |
| Maximum diameter of the ascending aorta | 35.90 |
30.87 |
4.125 | 0.001* |
| Minimum diameter of the ascending aorta | 33.45 |
21.41 |
8.812 | 0.001* |
| Maximum diameter of the proximal aortic arch | 35.28 |
31.73 |
3.247 | 0.002* |
| Minimum diameter of the proximal aortic arch | 32.11 |
22.42 |
8.522 | 0.001* |
| Maximum diameter of the distal aortic arch | 28.25 |
24.98 |
3.198 | 0.002* |
| Minimum diameter of the distal aortic arch | 23.42 |
18.29 |
5.511 | 0.001* |
| Maximum diameter of the aorta proximal to the primary tear | 27.67 |
26.00 |
1.157 | 0.252 |
| Minimum diameter of the aorta proximal to the primary tear | 17.86 |
15.85 |
1.662 | 0.102 |
| Maximum diameter of the aorta at the primary tear | 26.78 |
25.78 |
0.780 | 0.439 |
| Minimum diameter of the aorta at the primary tear | 17.28 |
16.01 |
1.170 | 0.247 |
| Maximum diameter of the aorta distal to the primary tear | 26.78 |
25.15 |
1.353 | 0.181 |
| Minimum diameter of the aorta distal to the primary tear | 16.46 |
16.44 |
0.014 | 0.989 |
| Maximum diameter at the celiac trunk level | 20.74 |
20.07 |
0.957 | 0.342 |
| Minimum diameter at the celiac trunk level | 13.23 |
11.74 |
1.717 | 0.091 |
| Maximum diameter at the renal artery level | 17.35 |
17.29 |
0.126 | 0.900 |
| Minimum diameter at the renal artery level | 11.99 |
11.53 |
0.486 | 0.629 |
| Maximum diameter at the aortic bifurcation | 15.85 |
15.34 |
0.517 | 0.607 |
| Minimum diameter at the aortic bifurcation | 11.62 |
11.31 |
0.249 | 0.804 |
Note: * indicates p
For the true lumen area of the aortic root, false lumen area of the aortic root, true lumen area of the ascending aorta, false lumen area of the ascending aorta, true lumen area of the proximal aortic arch, false lumen area of the proximal aortic arch, true lumen area of the distal aortic arch, and false lumen area of the distal aortic arch, the p-values of the difference analysis were all less than 0.05, indicating statistically significant differences between the two groups in these variables, with the RTAD group demonstrating higher values compared to the TBAD group. For other parameters (including entry tear area and distance from the tear site to the left subclavian artery), the p-values of the difference analysis were all greater than 0.05, suggesting no statistically significant differences between the two groups in those variables. Details are presented in Table 3.
| Clinical data | TBAD (n = 39) | RTAD (n = 21) | Z value | p value |
| True lumen area at the aortic root | 1079.80 (850.70, 1220.80) | 579.30 (419.15, 975.05) | –3.805 | 0.001* |
| False lumen area at the aortic root | 0.00 (0.00, 0.00) | 679.30 (505.00, 872.40) | –6.958 | 0.001* |
| True lumen area of the ascending aorta | 946.40 (831.60, 1117.10) | 488.30 (379.80, 793.70) | –4.673 | 0.001* |
| False lumen area of the ascending aorta | 0.00 (0.00, 0.00) | 702.70 (520.95, 899.65) | –7.205 | 0.001* |
| True lumen area of the proximal aortic arch | 868.50 (788.90, 992.80) | 541.00 (401.65, 729.15) | –4.998 | 0.001* |
| False lumen area of the proximal aortic arch | 0.00 (0.00, 0.00) | 463.80 (358.25, 623.65) | –7.205 | 0.001* |
| True lumen area of the distal aortic arch | 519.80 (472.30, 659.30) | 370.00 (270.65, 459.90) | –4.332 | 0.001* |
| False lumen area of the distal aortic arch | 0.00 (0.00, 156.00) | 398.60 (343.75, 496.30) | –5.804 | 0.001* |
| True lumen area proximal to the primary tear | 423.00 (313.40, 493.60) | 345.80 (252.95, 441.15) | –1.457 | 0.145 |
| False lumen area proximal to the primary tear | 442.10 (246.40, 555.30) | 483.80 (406.05, 575.70) | –1.620 | 0.105 |
| True lumen area at the primary tear | 390.80 (300.10, 483.30) | 317.50 (245.95, 399.80) | –1.806 | 0.071 |
| False lumen area at the primary tear | 485.10 (332.30, 636.50) | 521.00 (484.30, 716.45) | –1.496 | 0.135 |
| True lumen area distal to the primary tear | 358.50 (278.50, 436.80) | 320.40 (291.60, 393.30) | –0.628 | 0.530 |
| False lumen area distal to the primary tear | 564.30 (450.00, 721.20) | 554.70 (440.10, 750.60) | –0.054 | 0.957 |
| True lumen area at the celiac trunk level | 203.60 (153.40, 265.50) | 197.00 (144.95, 213.50) | –1.224 | 0.221 |
| False lumen area at the celiac trunk level | 229.40 (181.60, 305.40) | 273.10 (228.05, 320.60) | –1.186 | 0.236 |
| True lumen area at the renal artery level | 156.90 (119.60, 193.60) | 162.90 (101.45, 217.70) | –0.473 | 0.636 |
| False lumen area at the renal artery level | 151.60 (100.30, 203.80) | 180.50 (145.20, 209.75) | –1.410 | 0.159 |
| True lumen area at the aortic bifurcation | 132.80 (100.80, 181.40) | 124.70 (102.00, 164.40) | –0.457 | 0.648 |
| False lumen area at the aortic bifurcation | 93.20 (0.00, 167.80) | 116.40 (46.65, 181.10) | –0.478 | 0.633 |
| Tear size | 106.00 (42.00, 159.00) | 88.20 (47.25, 166.60) | –0.054 | 0.957 |
| Distance from the tear to the left subclavian artery | –24.00 (–29.00, –16.00) | –21.00 (–33.00, –9.50) | –0.706 | 0.480 |
Note: * indicates p
The p-values of the difference analysis for both aortic arch type and tear location were greater than 0.05, indicating no statistically significant differences between the two groups in these variables. Details are provided in Table 4.
| Clinical data | TBAD (n = 39) | RTAD (n = 21) | p value | ||
| Aortic arch morphology | 0.152 | 0.927 | |||
| Type I Arch | 14 (35.9%) | 8 (38.1%) | |||
| Type II Arch | 20 (51.3%) | 11 (52.4%) | |||
| Type III Arch | 5 (12.8%) | 2 (9.5%) | |||
| Tear location | 4.742 | 0.192 | |||
| Anterior Wall | 3 (7.7%) | 5 (23.8%) | |||
| Posterior Wall | 1 (2.6%) | 2 (9.5%) | |||
| Lesser Curvature | 11 (28.2%) | 5 (23.8%) | |||
| Greater Curvature | 24 (61.5%) | 9 (42.9%) | |||
The p-values of the difference analysis for both the alpha and beta angles of the aortic arch were greater than 0.05, indicating no statistically significant differences between the two groups in these variables. Details are presented in Table 5.
| Clinical data | TBAD (n = 39) | RTAD (n = 21) | t value | p value |
| 152.10 |
153.86 |
–0.570 | 0.571 | |
| 128.15 |
131.81 |
–1.390 | 0.170 |
A total of 44 independent variables were included in this study. Dimensionality
reduction was performed to screen for the most representative high-risk
predictors through LASSO regression analysis. The
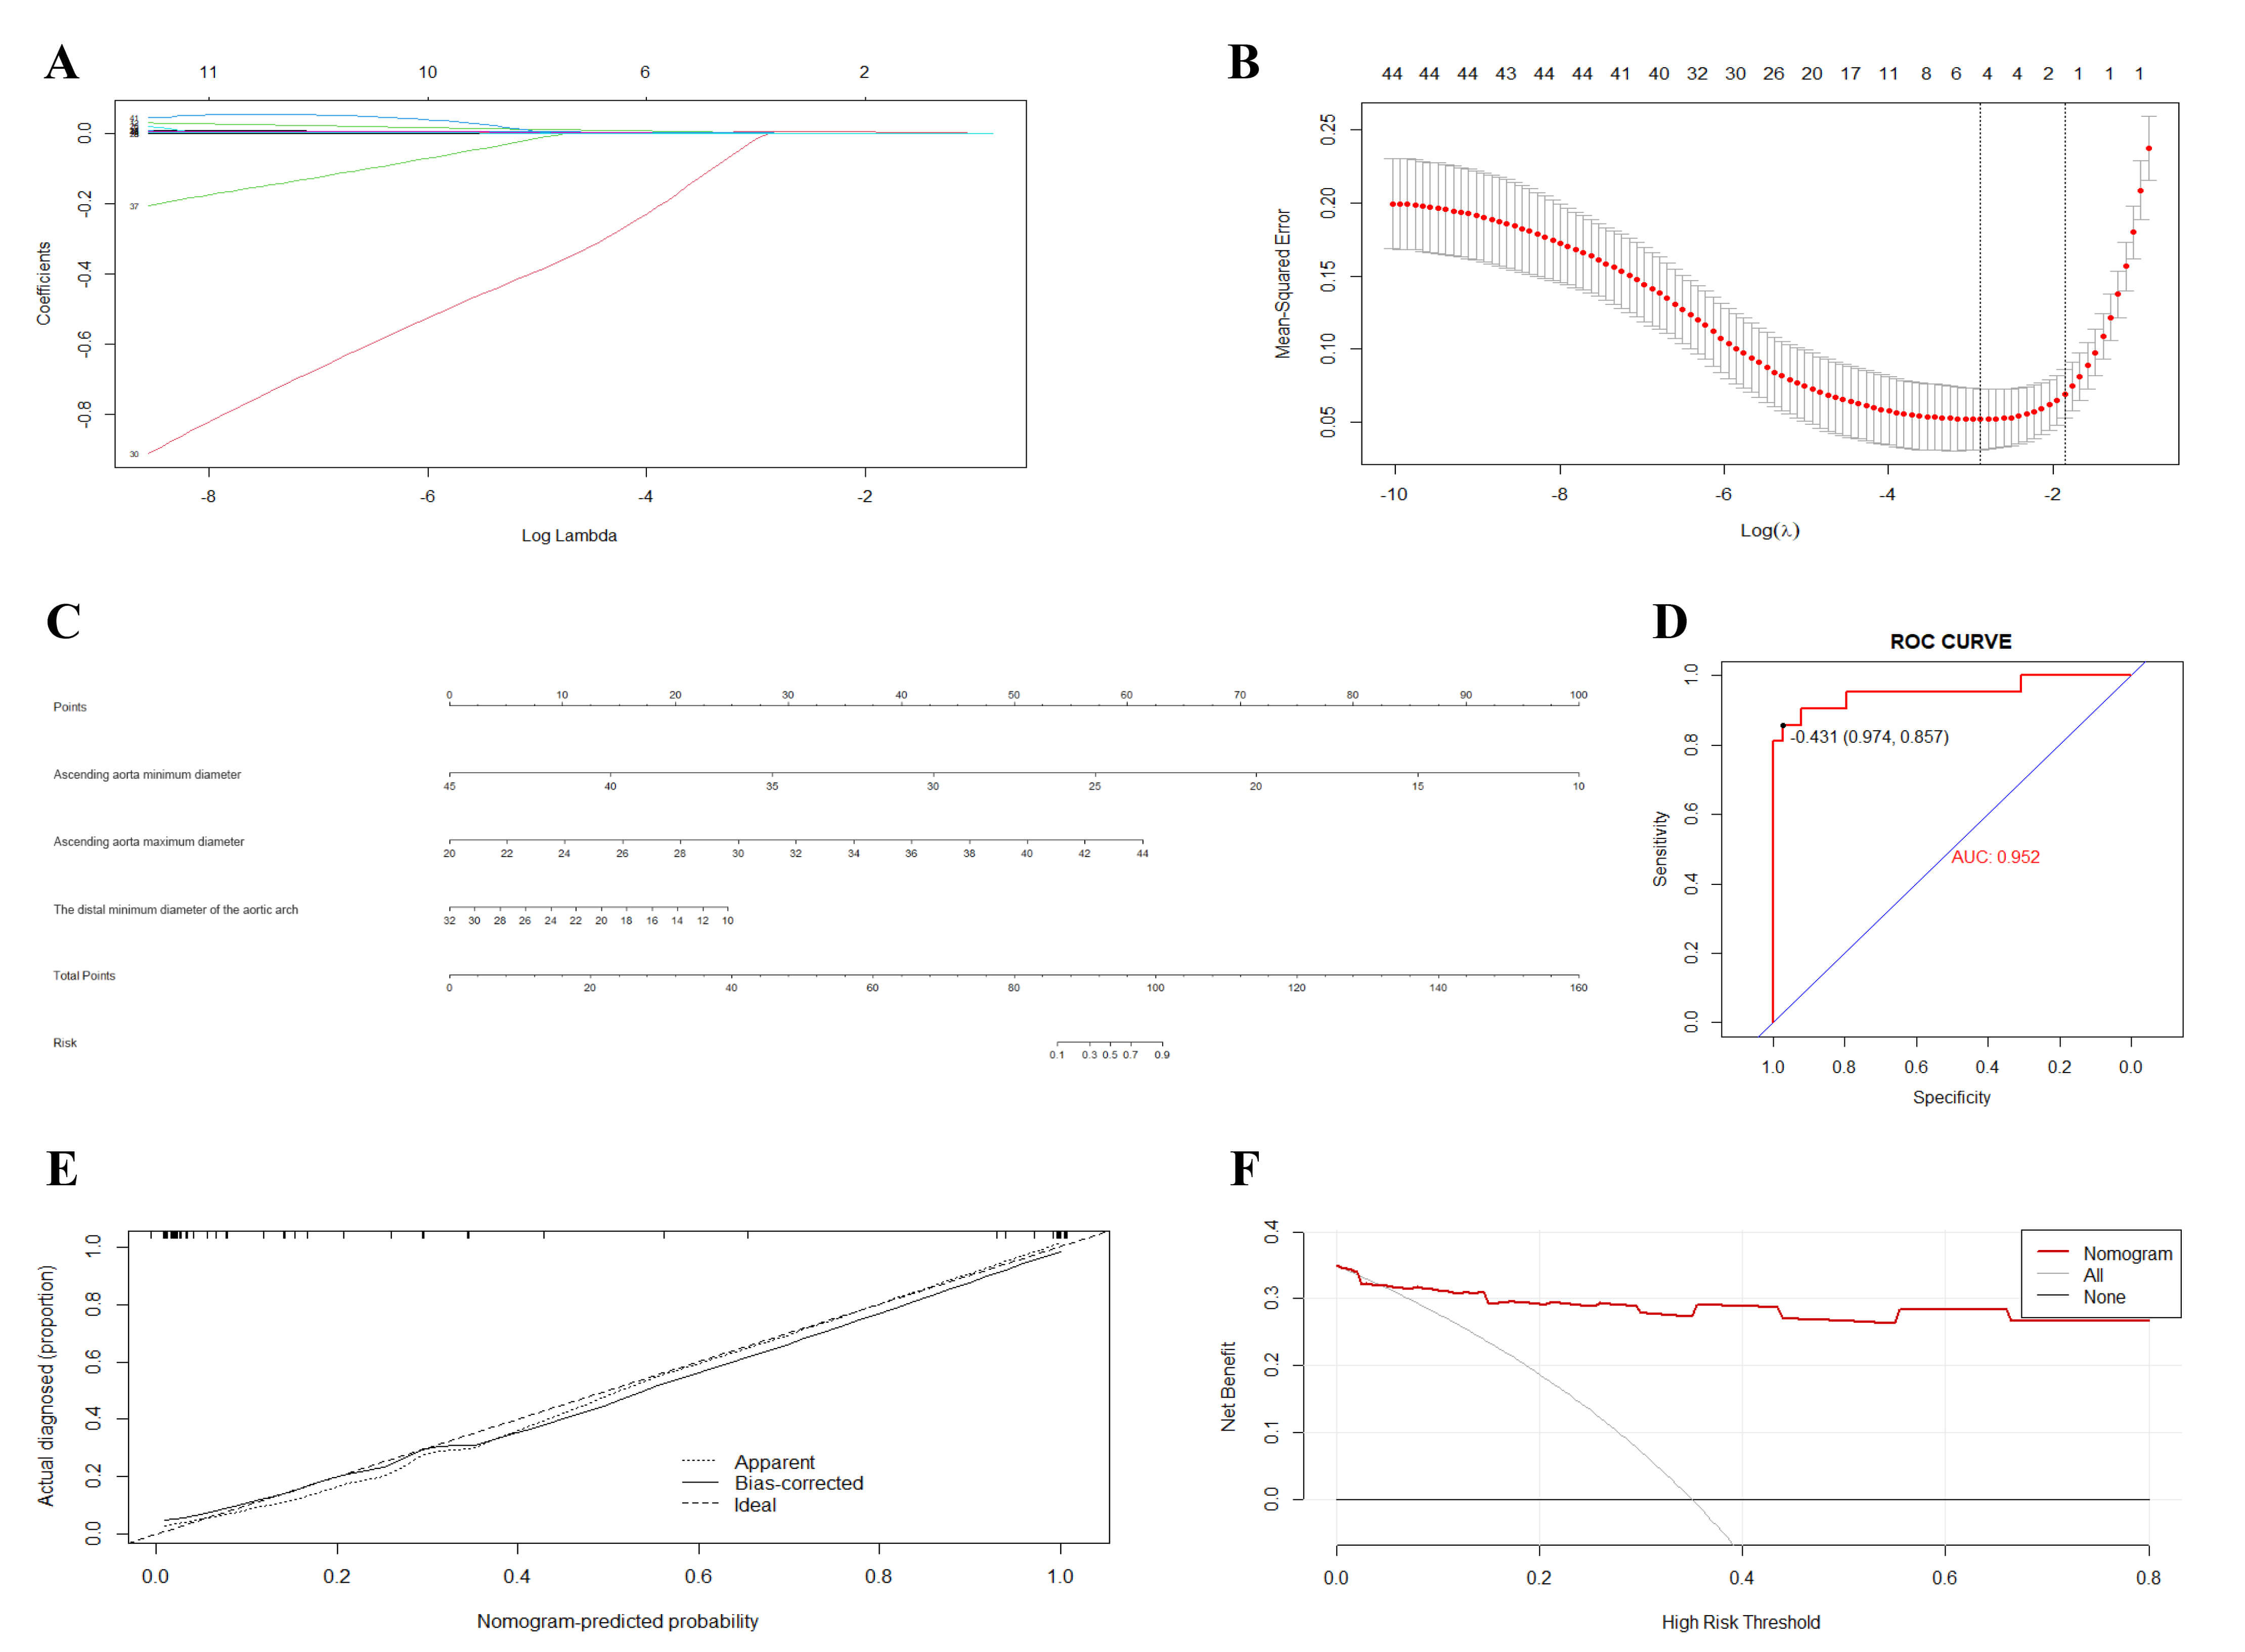 Fig. 4.
LASSO regression results for 44 predictor variables. (A) LASSO
Dimension Reduction Results. (B) Process of selecting optimal independent
variables via ten-fold cross-validation and identifying the optimal
The results of the multivariable logistic regression analysis for the selected predictors are as follows:
(1) Minimum ascending aortic diameter: The regression test p-value was
less than 0.05, indicating a statistically significant influence on the dependent
variable when controlling for other covariates. The odds ratio (OR) was less than
1 (OR
| Variable | Standard | Wald | p | OR | 95% CI for OR | ||
| Error | Lower | Upper | |||||
| Minimum diameter of the ascending aorta | –0.717 | 0.352 | 4.141 | 0.042* | 0.488 | 0.245 | 0.974 |
| Maximum diameter of the ascending aorta | 0.841 | 0.377 | 4.965 | 0.026* | 2.318 | 1.107 | 4.857 |
| Maximum diameter of the distal aortic arch | 0.272 | 0.184 | 2.188 | 0.139 | 1.313 | 0.915 | 1.884 |
| Minimum diameter of the distal aortic arch | –0.521 | 0.252 | 4.257 | 0.039* | 0.594 | 0.362 | 0.974 |
| True lumen area of the proximal aortic arch | –0.007 | 0.007 | 0.963 | 0.326 | 0.993 | 0.979 | 1.007 |
| Constant | 1.207 | 6.177 | 0.038 | 0.845 | 3.345 | ||
Note: Hosmer-Lemeshow = 13.310, p = 0.102
Fig. 4C presents the nomogram constructed using statistically significant variables from the logistic regression equation to predict the risk of RTAD occurrence. In the nomogram: (1) The Points scale (first row) provides a scoring reference for each variable. (2) For any individual patient, the corresponding Points can be assigned based on the value or category of each predictor variable. (3) Total Points are calculated by summing the individual points for all variables. (4) The Total Points are then mapped to the Risk scale (second-to-last row) to obtain the predicted probability of RTAD occurrence.
The concordance index (C-index) was 0.952 (SD = 0.0068), with a Z-statistic of
13.400 and a p-value of 0.001 (
As shown in the ROC curve below, the area under the curve (AUC) was 0.952 (95% confidence interval: 0.819–1.000), with a sensitivity of 85.7% and specificity of 97.4%, further demonstrating the model’s strong predictive capability. Details are provided in Fig. 4D.
Internal validation was performed using the Bootstrap resampling method with 1000 iterations to assess the model’s robustness. The calibration curve (Fig. 4E) demonstrates slight fluctuations between the observed model fit, expected model fit, and bias-corrected estimates, which may be attributable to the limited sample size. Overall, the model demonstrated good robustness and is generalizable for clinical application.
In combination with the ROC curve, decision curve analysis (DCA) was employed to evaluate the clinical utility of the prediction model. The DCA results further confirmed the robustness and practical applicability of our model. Compared with the “treat-all” and “treat-none” strategies, the model demonstrated a higher net benefit across the entire range of threshold probabilities, indicating good stability and reliability under different clinical decision thresholds. These findings suggest that the model has the potential to serve as an important tool for individualized RTAD risk stratification and clinical decision support. Detailed results are presented in Fig. 4F.
Aortic dissection (AD) is a life-threatening cardiovascular disease. Over the years, researchers have focused on identifying its high-risk factors. Studies have reported that age, hypertension, dyslipidemia, and inherited connective tissue disorders are significant risk factors for AD [22]. Additionally, aortic geometric morphology has been shown to play a critical role in the development of both Type A and Type B aortic dissections.
In TAAD, specific geometric features of the proximal aorta, including elongation, angulation, and tortuosity, may significantly influence pathogenesis [23, 24, 25, 26, 27, 28]. Ascending aortic diameter remains the only widely accepted morphological risk factor for TAAD, with prophylactic surgery recommended when the diameter exceeds 55 mm, even in asymptomatic patients [29]. However, Krüger et al. [23] argue that aortic diameter alone may not be the optimal predictor, as most dissections occur at diameters below 55 mm. They propose aortic elongation as a potential risk factor for TAAD [23].
Studies on TBAD highlight increased aortic arch curvature and angulation as independent and specific predictors [30]. Other factors, such as aortic elongation, incremental angulation, and tortuosity indices, are also associated with TBAD [31, 32]. However, spatial geometric measurements on CTA are complex and time-consuming, complicating risk assessment. Sun et al. [33] proposed an easily identifiable morphological parameter—aortic arch type—as a surrogate marker. Type III aortic arch, characterized by elongation, increased angulation, and tortuosity, serves as a comparable identifier for high-risk TBAD patients [33].
Previous studies have broadly focused on geometric features of AD or compared TAAD and TBAD. However, RTAD, a distinct subtype, remains understudied. DiMusto et al. [20] demonstrated that RTAD often occurs when the primary entry tear is near the aortic arch with poor false lumen decompression through distal branches. This may result from increased pressure in the false lumen due to thrombus formation or slow flow, leading to retrograde propagation into the ascending aorta. One possible reason is that the patient population we studied and the models or data used in the studies by DiMusto et al. [20] differ. For example, our study only included primary RTAD, while the studies by DiMusto et al. [20] may have covered different types of aortic dissection, and the sample size and population characteristics may also have been different. In addition, our study emphasized the relationship between changes in aortic geometry and the occurrence of RTAD, while the studies by DiMusto et al. [20] mainly focused on the impact of the tear location. Therefore, different research focuses may have led to these differences. Osswald et al. [21] identified elevated wall shear stress (WSS) at the subclavian artery distal region in RTAD patients using computational fluid dynamics, suggesting WSS as a potential screening marker when combined with clinical risk factors. Dziodzio et al. [19] highlighted the importance of primary entry tear location in porcine models, noting that tears on the aortic arch’s lesser curvature may predispose to RTAD. This study focuses on primary RTAD, distinct from iatrogenic or stent-graft-induced RTAD, emphasizing differences in pathophysiology compared to TBAD and TAAD.
This study identifies reduced minimum ascending aortic diameter, increased
maximum ascending aortic diameter, and reduced minimum distal aortic arch
diameter as specific predictors for RTAD development in TBAD patients. These
geometric changes may increase vascular eccentricity, altering hemodynamics and
wall shear stress to influence dissection propagation. Although Dziodzio
et al. [19] linked RTAD risk to primary tear location on the lesser
curvature, this study found no such association, possibly due to anatomical
differences between porcine and human aortas. Additionally, post-TEVAR RTAD risk
may correlate with aortic arch angulation and curvature [34], but no significant
differences in
The RTAD risk prediction nomogram, validated by a C-index of 0.952, ROC-AUC of 0.952, and robust calibration/DCA curves, provides clinical guidance for early intervention. High-risk patients should undergo intensified screening to mitigate retrograde progression risks.
This single-center retrospective study is limited by potential measurement variability despite standardized protocols. The small sample size and selection bias inherent to retrospective designs challenge generalizability. Future multi-center prospective studies with long-term follow-up are needed to validate these findings.
(1) Morphological Differences: Despite sharing entry tear locations, RTAD and TBAD exhibit distinct morphological progression mechanisms. Reduced minimum ascending aortic diameter, increased maximum ascending aortic diameter, and reduced minimum distal aortic arch diameter may serve as specific predictors for RTAD development in TBAD patients. (2) Clinical Utility: The RTAD risk prediction model, incorporating these unique factors, offers actionable insights for preventive strategies and early clinical intervention, potentially improving outcomes through targeted screening and management.
The datasets used in this study are available from the corresponding author upon reasonable request.
Authors CLon and JX contributed equally to this work. CLon and JX were primarily responsible for data collection, data analysis, result interpretation, and manuscript writing. CLuo, JC, AK, and YF were primarily responsible for drafting and translating the manuscript, as well as the conception and design of the study. ZL was mainly responsible for the conceptualization and design of the study. All authors contributed to editorial changes in the manuscript. All authors read and approved the final manuscript. All authors have participated sufficiently in the work to take public responsibility for appropriate portions of the content and agreed to be accountable for all aspects of the work, ensuring that questions related to its accuracy or integrity are addressed.
All patients/participants or their families/legal guardians provided written informed consent prior to participation in the study. The study was conducted in accordance with the Declaration of Helsinki. This retrospective analysis was approved by the Ethics Committee of the First Affiliated Hospital of the University of South China (ethics approval number: 2024LL0129002).
This study was supported by Shanghai MicroPort Endovascular MedTech (Group) Co., Ltd. and the colleagues from the Department of Thoracic and Cardiovascular Surgery, Radiology, and Medical Records Room of the First Affiliated Hospital of the University of South China. We sincerely appreciate their valuable contributions to the conduct of this research.
This work was supported by a grant from Hunan Provincial Natural Science Foundation (2023JJ50152) and Hunan Provincial Teaching Reform Research Project in Ordinary Higher Education Institutions (HNJG-20230600).
The authors declare no conflict of interest.
During the preparation of this work, the authors used ChatGPT-3.5 to check spelling and grammar. However, the overall structure and detailed content of the article were jointly written by the authors of this paper without the use of AI tools.
References
Publisher’s Note: IMR Press stays neutral with regard to jurisdictional claims in published maps and institutional affiliations.