


 , Guiling Wu 1, Xinghuan Liang 1, Yajuan Peng 2, Zhiyuan Dong 2, Yu Shen 3,*
 , Yingfen Qin 1,*
1 Department of Endocrinology, The First Affiliated Hospital of Guangxi Medical University, 530021 Nanning, Guangxi, China
2 Department of Endocrinology, The Fourth Affiliated Hospital of Guangxi Medical University, 545000 Liuzhou, Guangxi, China
3 Department of Neurology, The First Affiliated Hospital of Nanchang University, 330006 Nanchang, Jiangxi, China
Abstract
The association between the modified cardiometabolic index (MCMI) and the risk of incident stroke across patients with different glycemic statuses remains unclear. This study aimed to investigate the relationship between baseline MCMI levels and incident stroke in Chinese middle-aged and older adults with varying glucose metabolism states.
Data were obtained from the China Health and Retirement Longitudinal Study (CHARLS) conducted in 2011, 2013, 2015, and 2018. Kaplan–Meier curves, multivariable Cox proportional hazards models, and restricted cubic spline analyses were employed to assess the relationship between the MCMI and stroke risk stratified by glycemic status. Subgroup and sensitivity analyses were performed to confirm the robustness of the findings.
A total of 7455 participants were included. A total of 457 individuals (6.13%) experienced stroke events during a median follow-up of 7 years. A significant linear association was observed between a higher MCMI and increased stroke risk. A nonlinear relationship was detected among participants with normal glucose regulation (NGR), with a sharp increase in risk beyond an MCMI threshold of 1.904 (hazard ratio (HR) = 1.85; 95% confidence interval (CI): 1.24–2.76; p = 0.003). An increased MCMI was also associated with increased stroke risk in individuals with prediabetes (HR = 1.34, 95% CI: 1.03–1.75) but not in individuals with diabetes. The associations varied across subgroups according to gender, residence, body mass index, and use of cardiovascular medications. Sensitivity analyses supported the stability of the results.
An elevated MCMI is positively associated with incident stroke, particularly in individuals with NGR or prediabetes. Early identification of a high MCMI may be valuable for stroke prevention, risk stratification, and timely intervention in community populations.
Keywords
- cardiometabolic risk factors
- stroke
- glucose metabolism
- longitudinal studies
- China
Stroke is an acute focal injury of the central nervous system caused by a vascular event, including ischemic stroke, intracerebral hemorrhage, and subarachnoid hemorrhage, and it remains one of the leading causes of disability and death worldwide [1, 2]. With the progressive aging of the population, China’s stroke burden has become the highest worldwide, and stroke is now the leading cause of death among the Chinese population [3, 4]. These trends highlight an urgent need for refined risk stratification tools and targeted prevention strategies to mitigate the growing public health burden.
The cardiometabolic index (CMI), which is calculated as the product of the waist-to-height ratio and the triglyceride-to-high-density lipoprotein cholesterol (TG/HDL-C) ratio, integrates markers of abdominal obesity and dyslipidemia and was initially used to identify patients with diabetes [5]. Owing to its accessibility and cost-effectiveness, the CMI has also been shown to be predictive of conditions such as hyperuricemia, metabolic-associated fatty liver disease, and hypertensive metabolic syndrome [6, 7, 8]. Notably, previous studies have demonstrated associations between CMI and stroke. Multiple studies from China have identified CMI as an effective predictor of stroke in middle-aged and older adults, and similar findings have been reported in Western populations, supporting its utility in predicting cardiovascular events in aging cohorts [9, 10, 11, 12, 13]. Diabetes is a well-established independent risk factor for stroke, with diabetic individuals facing a 2–4-fold higher risk of ischemic stroke than the general population [14]. Insulin resistance (IR), the core pathological feature of type 2 diabetes, has also emerged as an independent risk factor for stroke, beyond the effects of hyperglycemia [15, 16]. The triglyceride-glucose (TyG) index, a reliable biomarker of IR, has been validated in numerous studies for its association with stroke risk [17, 18, 19]. Therefore, developing a composite index that incorporates IR, abdominal obesity, and dyslipidemia could be crucial for improving stroke risk prediction.
The modified cardiometabolic index (MCMI), derived from both CMI and TyG, combines parameters of insulin resistance, abdominal obesity, and lipid abnormalities and has recently been proposed to be a predictor of hepatic steatosis and fibrosis [20]. However, despite growing interest, no study has explored the association between the MCMI and incident stroke in individuals with different glycemic statuses. To address this gap, we conducted a longitudinal analysis using data from the China Health and Retirement Longitudinal Study (CHARLS) to investigate the relationship between MCMI and stroke risk among Chinese middle-aged and older adults stratified by glycemic status, aiming to provide new insights for stroke prevention, early diagnosis, and control.
The data were obtained from the China Health and Retirement Longitudinal Study (CHARLS) database, a nationally representative
longitudinal survey that has collected health-related data on individuals aged 45
years and older in China since 2011. The specific waves used in this study and their corresponding links are as follows: (1) 2011 National Baseline Survey (https://charls.charlsdata.com/pages/Data/2011-charls-wave1/zh-cn.html), (2) 2013 National Follow-up Survey (https://charls.charlsdata.com/pages/Data/2013-charls-wave2/zh-cn.html), (3) 2015 National Follow-up Survey (https://charls.charlsdata.com/pages/Data/2015-charls-wave4/zh-cn.html). Participants are followed up with every two
years through face-to-face computer-assisted personal interviews [21]. In this
prospective cohort study, we analyzed data from the CHARLS baseline wave in 2011
through the follow-up in 2018. The initial cohort included 17,708 participants.
Participants were excluded based on the following criteria: (1) implausible
anthropometric measurements at baseline, including body mass index (BMI)
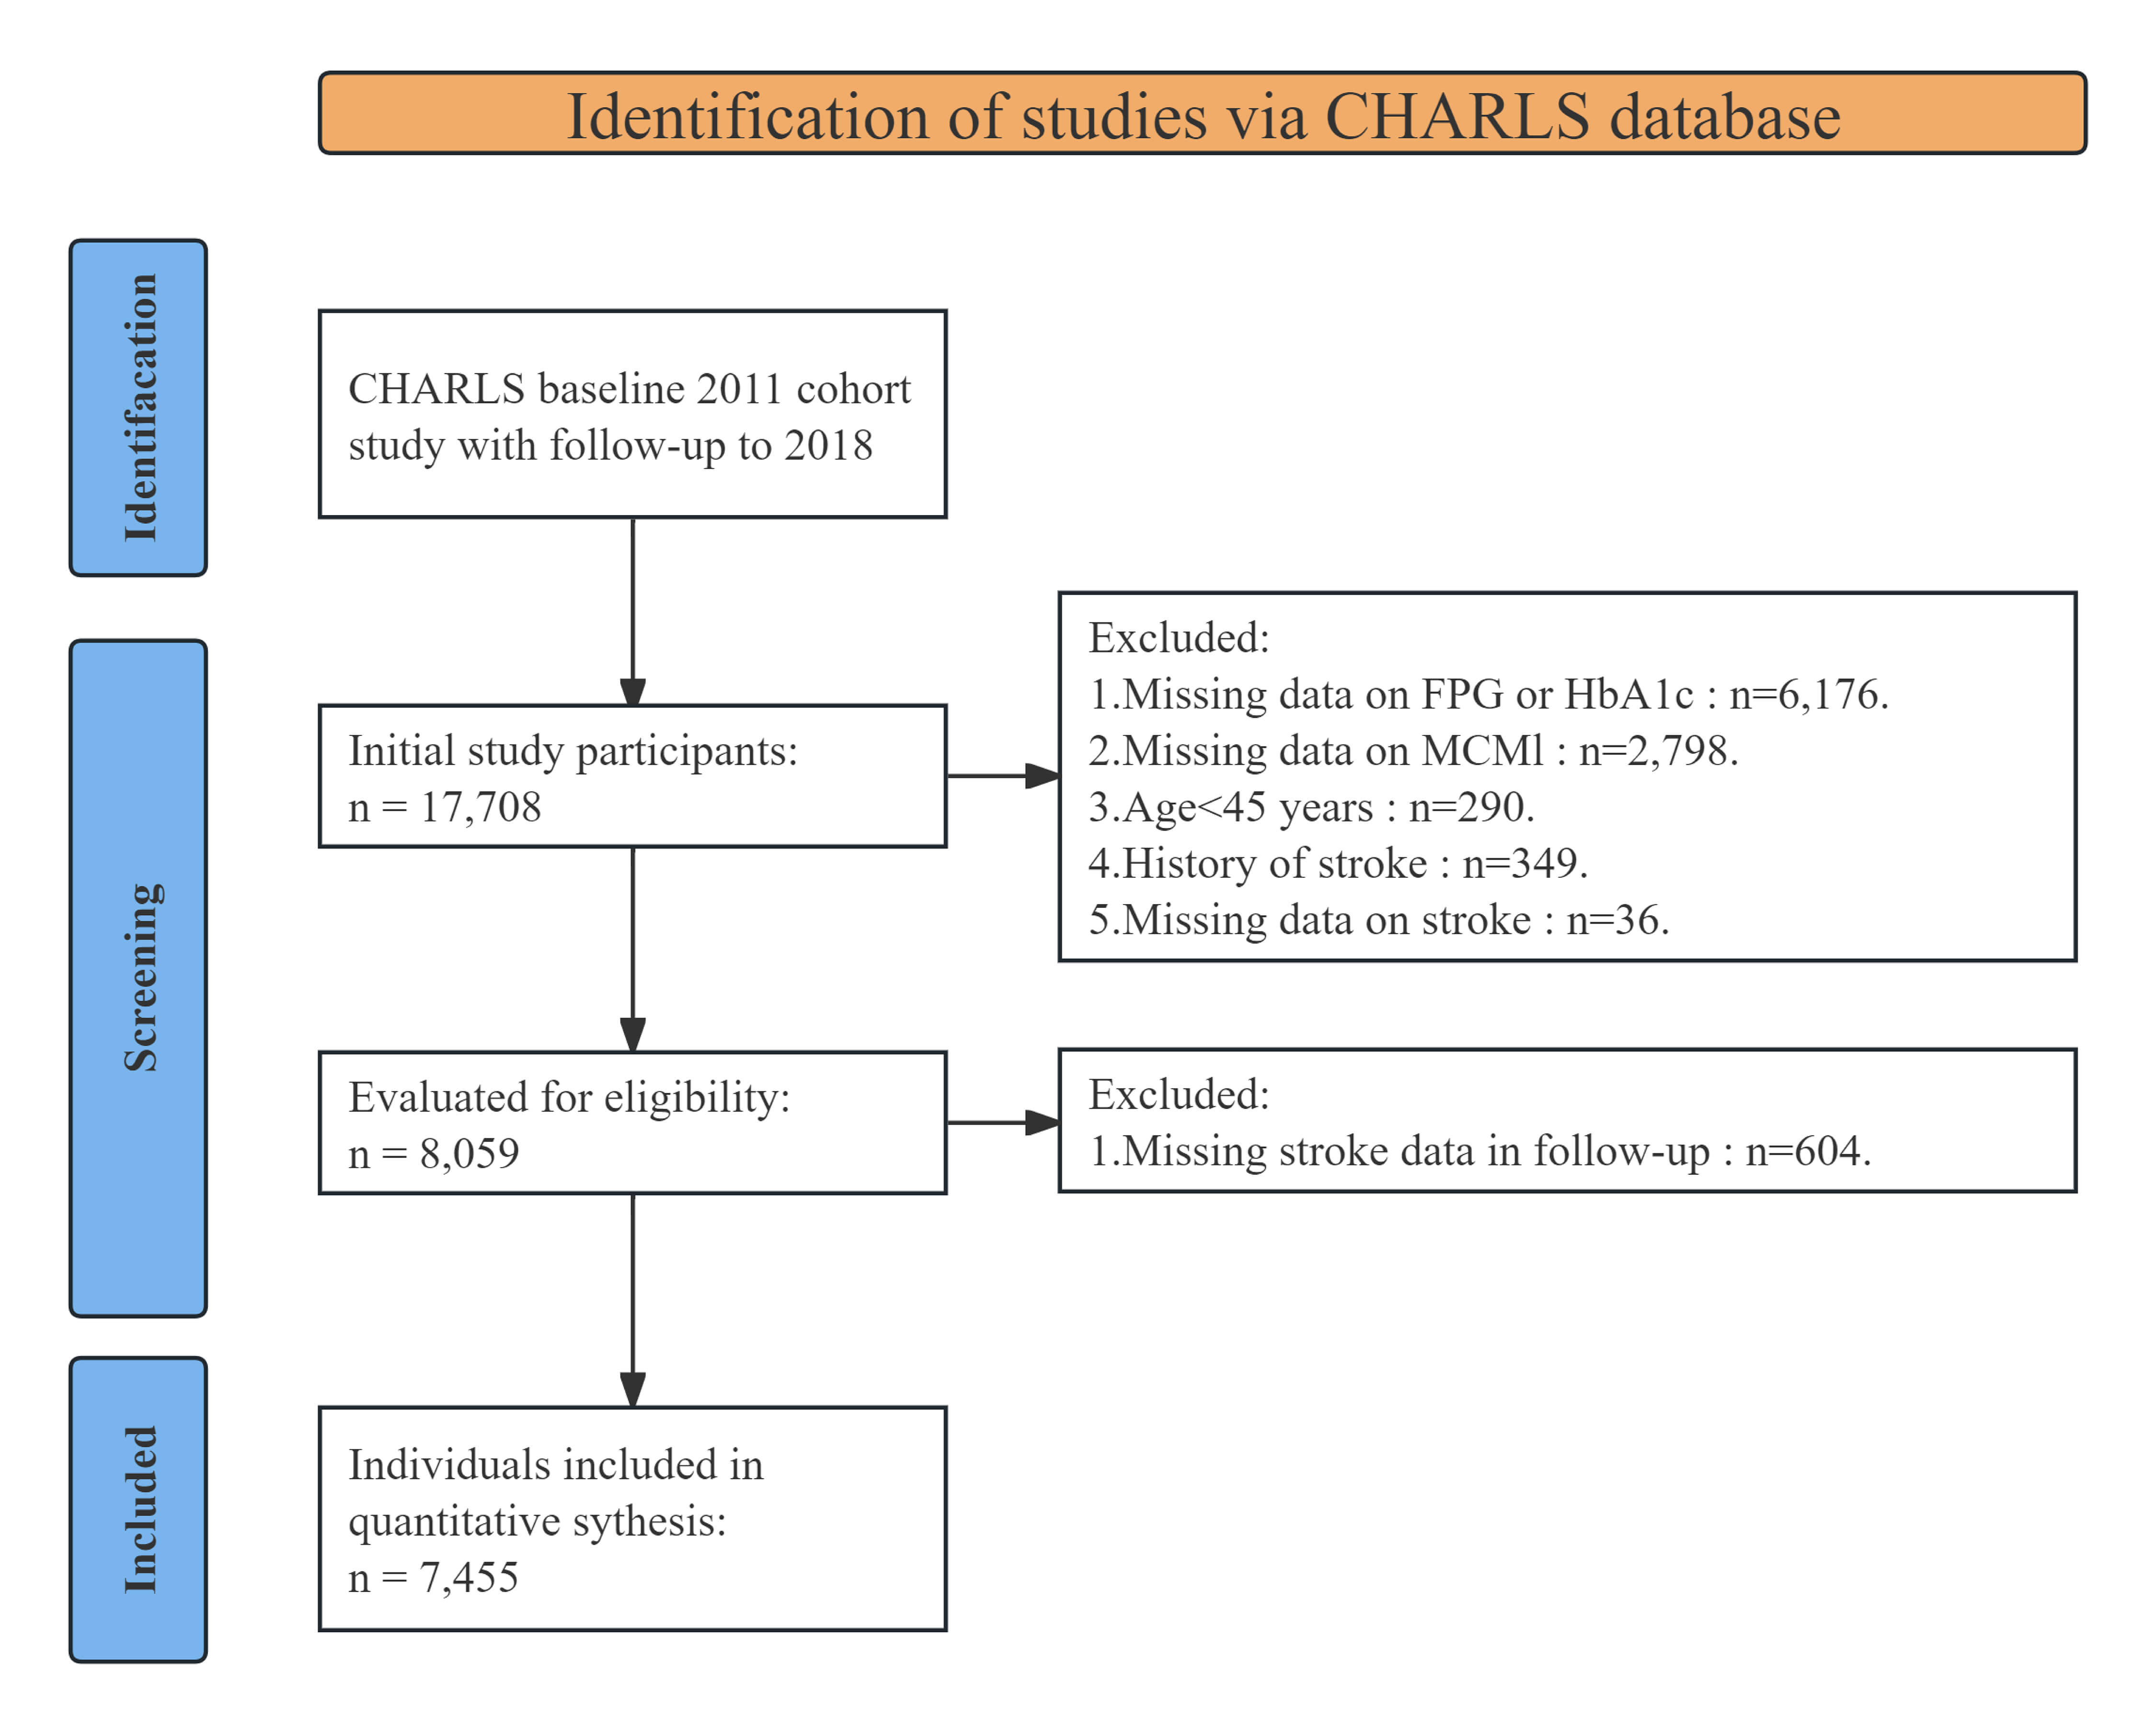 Fig. 1.
Flowchart of patients included in the study. CHARLS, China Health and Retirement Longitudinal Study; FPG, fasting plasma glucose; HbA1c, glycated hemoglobin; MCMI, modified cardiometabolic index.
During the baseline survey in 2011, trained personnel collected and recorded demographic information and health-related behaviors using standardized questionnaires. The collected data included gender, age, education level, marital status, smoking and alcohol consumption status, and medical history, including cardiovascular disease, stroke, kidney disease, dyslipidemia, hypertension, and the use of antihypertensive or lipid-lowering medications. Anthropometric measurements were also obtained, including height, weight, WC, and blood pressure, were also obtained. In addition, fasting venous blood samples were collected and processed for laboratory testing.
The MCMI was calculated using the following formula: MCMI = ln [TG
(mg/dL)
The incidence of stroke during the follow-up period was determined based on self-reported data. Trained interviewers asked participants the following questions: (1) “Have you ever been diagnosed with a stroke by a doctor?” (2) “Since the last interview, have you been diagnosed with a stroke by a doctor?” and (3) “When were you first diagnosed with this condition, or when did you first become aware of it?” The time of stroke onset was defined by the participant’s response to question (3).
Participants were categorized as underweight (BMI
Details of the missing data are provided in Supplementary Table 1. To
enhance the robustness of the findings, MCMI was analyzed as a continuous
variable and by quartiles: Q1 (MCMI
During the 7-year follow-up period, a total of 7455 participants were included, with a mean age of 58.80 years, 3419 of whom (45.86%) were male. The anthropometric and biochemical characteristics of participants stratified by MCMI quartiles are presented in Table 1. The results indicated that parameters such as BMI, WC, systolic blood pressure (SBP), diastolic blood pressure (DBP), FPG levels, HbA1c levels, TC levels, TG levels, C-reactive protein (CRP) levels, and BMI showed a significant upward trend with increasing MCMI levels. In contrast, the HDL-C level and blood urea nitrogen (BUN) level tended to decrease.
| Characteristic | MCMI quartiles | p | |||||
| Overall | Q1 | Q2 | Q3 | Q4 | |||
| No. of subjects | 7455 | 1864 | 1864 | 1863 | 1864 | ||
| Age (year) | 58.80 |
58.65 |
58.68 |
58.65 |
59.23 |
0.142 | |
| Age | 0.252 | ||||||
| 45–59 | 4257 (57.10%) | 1082 (58.05%) | 1079 (57.89%) | 1068 (57.33%) | 1028 (55.15%) | ||
| 60 and over | 3198 (42.90%) | 782 (41.95%) | 785 (42.11%) | 795 (42.67%) | 836 (44.85%) | ||
| Gender | |||||||
| Female | 4036 (54.14%) | 741 (39.75%) | 969 (51.98%) | 1073 (57.60%) | 1253 (67.22%) | ||
| Male | 3419 (45.86%) | 1123 (60.25%) | 895 (48.02%) | 790 (42.40%) | 611 (32.78%) | ||
| Education | 0.004 | ||||||
| Second school and over | 2201 (29.52%) | 558 (29.94%) | 528 (28.33%) | 591 (31.72%) | 524 (28.11%) | ||
| Primary | 3047 (40.87%) | 793 (42.54%) | 798 (42.81%) | 715 (38.38%) | 741 (39.75%) | ||
| Illiterate | 2207 (29.60%) | 513 (27.52%) | 538 (28.86%) | 557 (29.90%) | 599 (32.14%) | ||
| Marital status | 0.627 | ||||||
| Married | 6570 (88.13%) | 1649 (88.47%) | 1642 (88.09%) | 1651 (88.62%) | 1628 (87.34%) | ||
| Other | 885 (11.87%) | 215 (11.53%) | 222 (11.91%) | 212 (11.38%) | 236 (12.66%) | ||
| Location | |||||||
| Village | 4876 (65.41%) | 1356 (72.75%) | 1309 (70.23%) | 1157 (62.10%) | 1054 (56.55%) | ||
| Community | 2579 (34.59%) | 508 (27.25%) | 555 (29.77%) | 706 (37.90%) | 810 (43.45%) | ||
| Drinking status | |||||||
| Never | 5233 (70.19%) | 1135 (60.89%) | 1298 (69.64%) | 1375 (73.81%) | 1425 (76.45%) | ||
| Seldom | 1046 (14.03%) | 300 (16.09%) | 268 (14.38%) | 237 (12.72%) | 241 (12.93%) | ||
| Often | 1176 (15.77%) | 429 (23.02%) | 298 (15.99%) | 251 (13.47%) | 198 (10.62%) | ||
| Smoking status | |||||||
| Never | 4600 (61.70%) | 927 (49.73%) | 1131 (60.68%) | 1218 (65.38%) | 1324 (71.03%) | ||
| Former | 607 (8.14%) | 142 (7.62%) | 142 (7.62%) | 150 (8.05%) | 173 (9.28%) | ||
| Current | 2248 (30.15%) | 795 (42.65%) | 591 (31.71%) | 495 (26.57%) | 367 (19.69%) | ||
| Stroke | 457 (6.13%) | 66 (3.54%) | 106 (5.69%) | 116 (6.23%) | 169 (9.07%) | ||
| Hypertension | 3025 (40.58%) | 493 (26.45%) | 622 (33.37%) | 822 (44.12%) | 1088 (58.37%) | ||
| Dyslipidemia | 3537 (47.44%) | 319 (17.11%) | 585 (31.38%) | 1028 (55.18%) | 1605 (86.11%) | ||
| Heart problem | 835 (11.20%) | 151 (8.10%) | 165 (8.85%) | 223 (11.97%) | 296 (15.88%) | ||
| Kidney disease | 422 (5.66%) | 125 (6.71%) | 97 (5.20%) | 103 (5.53%) | 97 (5.20%) | 0.149 | |
| GMS | |||||||
| NGR | 3005 (40.31%) | 1068 (57.30%) | 890 (47.75%) | 684 (36.71%) | 363 (19.47%) | ||
| Prediabetes | 3292 (44.16%) | 695 (37.29%) | 805 (43.19%) | 907 (48.68%) | 885 (47.48%) | ||
| Diabetes | 1158 (15.53%) | 101 (5.42%) | 169 (9.07%) | 272 (14.60%) | 616 (33.05%) | ||
| BMI status | |||||||
| Underweight | 484 (6.49%) | 352 (18.88%) | 92 (4.94%) | 29 (1.56%) | 11 (0.59%) | ||
| Normal | 3917 (52.54%) | 1338 (71.78%) | 1338 (71.78%) | 856 (45.95%) | 385 (20.65%) | ||
| Overweight | 2192 (29.40%) | 144 (7.73%) | 405 (21.73%) | 805 (43.21%) | 838 (44.96%) | ||
| Obesity | 862 (11.56%) | 30 (1.61%) | 29 (1.56%) | 173 (9.29%) | 630 (33.80%) | ||
| Lipid-lowering drugs | 359 (4.82%) | 31 (1.66%) | 47 (2.52%) | 79 (4.24%) | 202 (10.84%) | ||
| Antihypertensive drugs | 1382 (18.54%) | 165 (8.85%) | 231 (12.39%) | 396 (21.26%) | 590 (31.65%) | ||
| Heart problem medications | 550 (7.38%) | 109 (5.85%) | 111 (5.95%) | 129 (6.92%) | 201 (10.78%) | ||
| BMI, kg/m2 | 23.55 |
20.76 |
22.31 |
24.29 |
26.83 |
||
| WC, cm | 84.30 |
72.76 |
81.67 |
87.81 |
94.99 |
||
| SBP, mmHg | 130.07 |
124.66 |
127.67 |
131.17 |
136.80 |
||
| DBP, mmHg | 75.59 |
72.38 |
74.54 |
76.28 |
79.17 |
||
| FPG, mg/dL | 109.49 |
99.21 |
102.41 |
107.97 |
128.39 |
||
| HbA1c, % | 5.28 |
5.10 |
5.14 |
5.25 |
5.63 |
||
| TC, mg/dL | 194.78 |
187.05 |
190.67 |
194.90 |
206.49 |
||
| TG, mg/dL | 131.17 |
72.57 |
96.73 |
127.05 |
228.35 |
||
| LDL, mg/dL | 117.59 |
110.89 |
118.37 |
122.55 |
118.56 |
||
| BUN, mg/dL | 15.71 |
16.35 |
15.68 |
15.61 |
15.18 |
||
| Scr, mg/dL | 0.78 |
0.78 |
0.77 |
0.78 |
0.77 |
0.480 | |
| CRP, mg/dL | 2.54 |
2.29 |
2.40 |
2.60 |
2.88 |
0.049 | |
| SUA, mg/dL | 4.42 |
4.28 |
4.27 |
4.43 |
4.68 |
||
| HDL, mg/dL | 51.59 |
64.06 |
54.92 |
47.91 |
39.45 |
||
Abbreviation: MCMI, modified cardiometabolic index; BMI, body mass
index; WC, waist circumference; SBP, systolic blood pressure; DBP, diastolic
blood pressure; FPG, fasting plasma glucose; HbA1c, glycated hemoglobin; TC,
total cholesterol; TG, triglyceride; LDL‑C, low-density lipoprotein cholesterol;
HDL-C, high-density lipoprotein cholesterol; SUA, serum uric acid; BUN, blood
urea nitrogen; Scr, serum creatinine; GMS, glucose metabolism status; NGR, normal
glucose regulation; CRP, C-reactive protein. The data are presented as mean
Moreover, with increasing MCMI, the baseline proportions of participants who were urban residents, who were nonsmokers, who were nondrinkers, who were female, obese, hypertensive, diabetic, or dyslipidemic, who had a history of heart disease, and who were using antihypertensive, lipid-lowering, or cardiac medications also increased. Conversely, the proportions of rural residents and male participants decreased across MCMI quartiles.
During the 7-year follow-up period, 457 incident stroke cases (6.13%)
were identified among the 7455 participants. The incidence of stroke increased
progressively with higher baseline MCMI quartiles. Specifically, the number of
new-onset stroke cases across quartiles Q1 to Q4 was 66 (3.54%), 106 (5.69%),
116 (6.23%), and 169 (9.07%), respectively. Kaplan‒Meier cumulative incidence
curves indicated a stepwise increase in stroke events from Q1 to Q4 across all
glycemic status subgroups (Fig. 2A). We next further compared stroke incidence by
age and gender. When stratified by 10-year age groups, stroke incidence increased
with age in males, while in females, it increased with age until approximately 70
years, after which it slightly decreased. Notably, among individuals aged
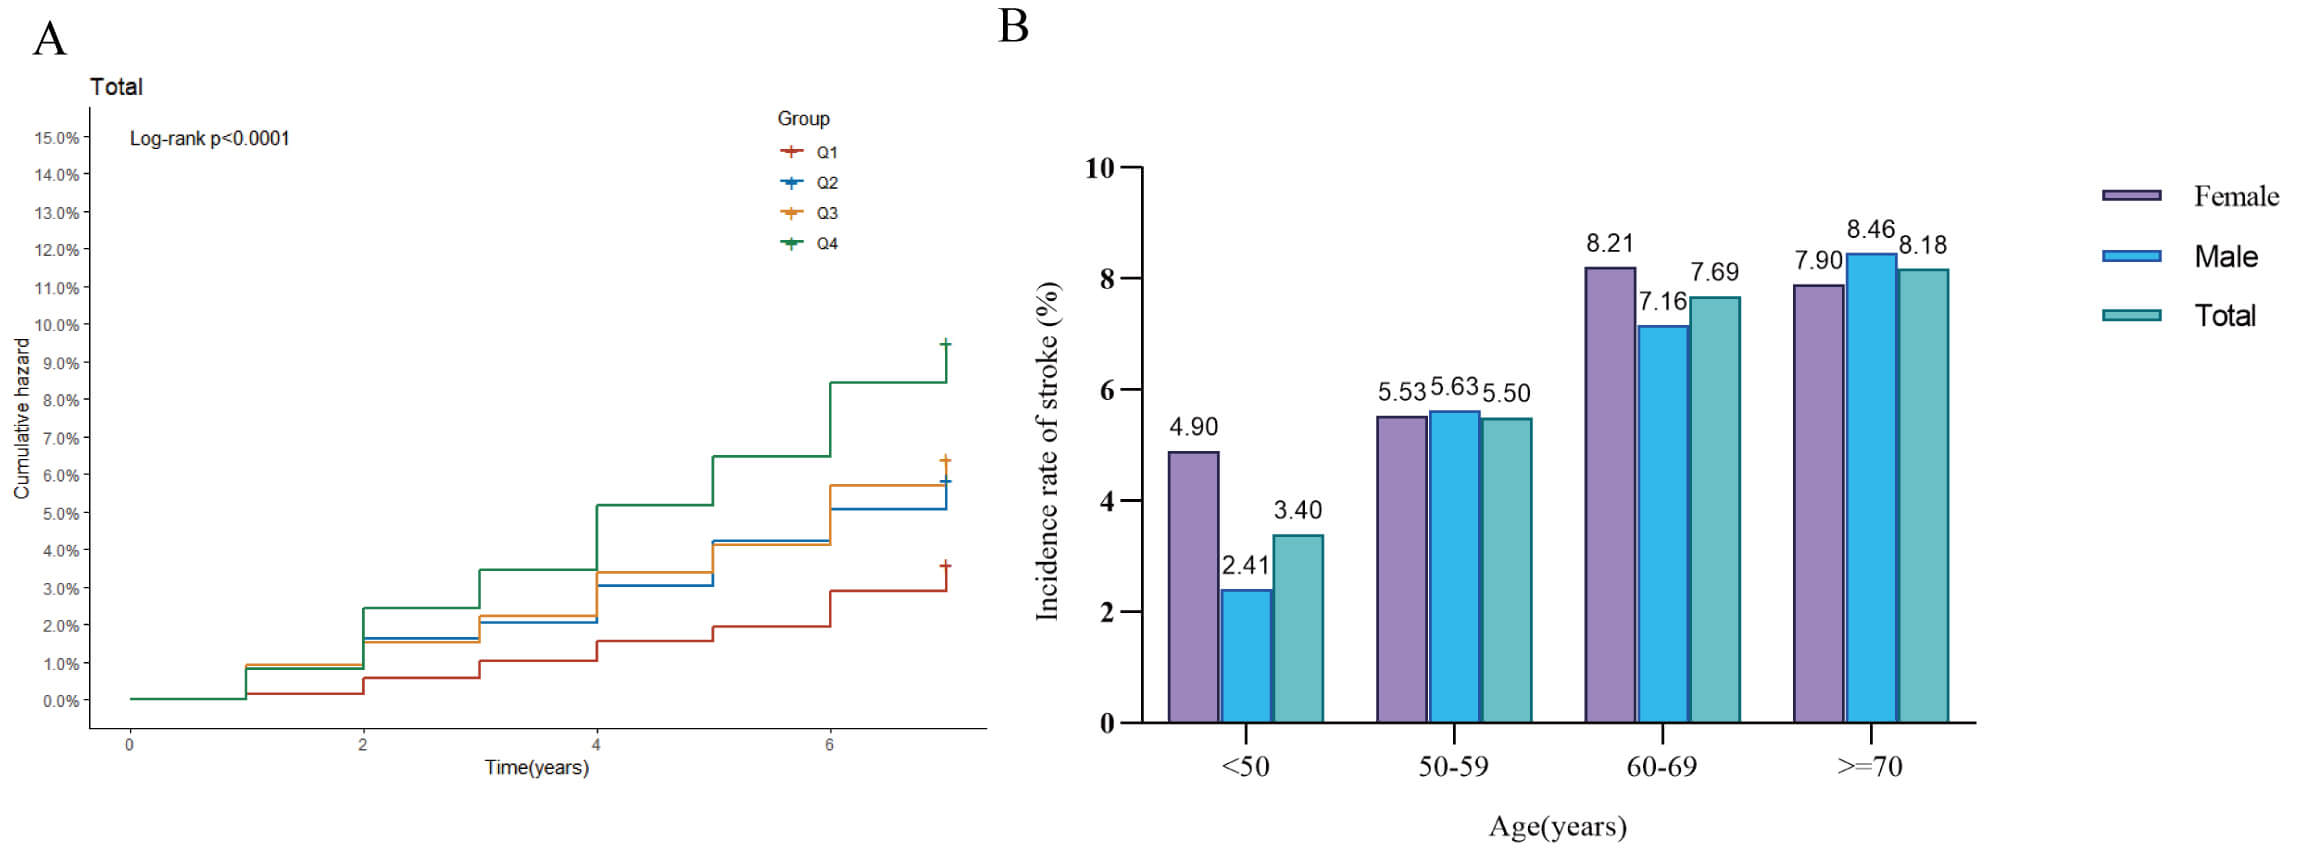 Fig. 2.
Stroke incidence analysis. (A) Kaplan–Meier curve showing the cumulative incidence of stroke across the four quartiles of MCMI; (B) Bar chart comparing stroke incidence by gender within different age groups.
| Characteristic | Model 1 | Model 2 | Model 3 | |||||||
| HR | 95% CI | p-value | HR | 95% CI | p-value | HR | 95% CI | p-value | ||
| MCMI | 1.14 | 1.09–1.18 | 1.15 | 1.10–1.20 | 1.27 | 1.08–1.48 | 0.003 | |||
| MCMI4 | ||||||||||
| Q1 | Ref. | Ref. | Ref. | |||||||
| Q2 | 1.63 | 1.20–2.22 | 0.002 | 1.67 | 1.23–2.28 | 0.001 | 1.57 | 1.15–2.14 | 0.005 | |
| Q3 | 1.79 | 1.32–2.42 | 1.88 | 1.39–2.56 | 1.54 | 1.12–2.13 | 0.008 | |||
| Q4 | 2.65 | 1.99–3.52 | 2.80 | 2.08–3.75 | 2.05 | 1.45–2.89 | ||||
Abbreviation: MCMI, modified cardiometabolic index; HR, Hazard Ratio; CI, Confidence Interval.
Model 1: Unadjusted.
Model 2: Adjusted for age, gender, education level, marital status, place of residence, smoking, and drinking history.
Model 3: Model 2 + adjusted for history of hypertension, dyslipidemia, heart disease, chronic kidney disease, use of antihypertensive drugs, use of lipid-lowering drugs, treatment with heart disease medications, body mass index, C-reactive protein, serum uric acid, blood urea nitrogen, serum creatinine.
During the follow-up period, 150 (4.99%) incident stroke cases occurred in the NGR group, 208 (6.32%) in the prediabetes and 99 (8.55%) in the diabetes group (Fig. 3A). Kaplan‒Meier cumulative incidence curve analysis revealed a progressive increase in stroke events from the Q1 to Q4 groups across all glycemic status categories, with statistically significant differences observed (Fig. 3B–D). The Cox proportional hazards regression results are presented in Table 3. Model 3 demonstrated a significant association between the MCMI and stroke risk in both NGR and prediabetic individuals. Although the NGR group showed no statistically significant association when MCMI was treated as a continuous variable, a significant increase in stroke risk with increasing MCMI was observed when the MCMI was analyzed as a categorical variable. These findings suggest a potentially nonlinear relationship between the MCMI and stroke occurrence in NGR individuals. For prediabetic individuals, each 1-unit increase in MCMI was associated with a 34% increase in stroke risk (HR =1.34, 95% CI: 1.03–1.75). However, no significant association was detected in diabetic individuals.
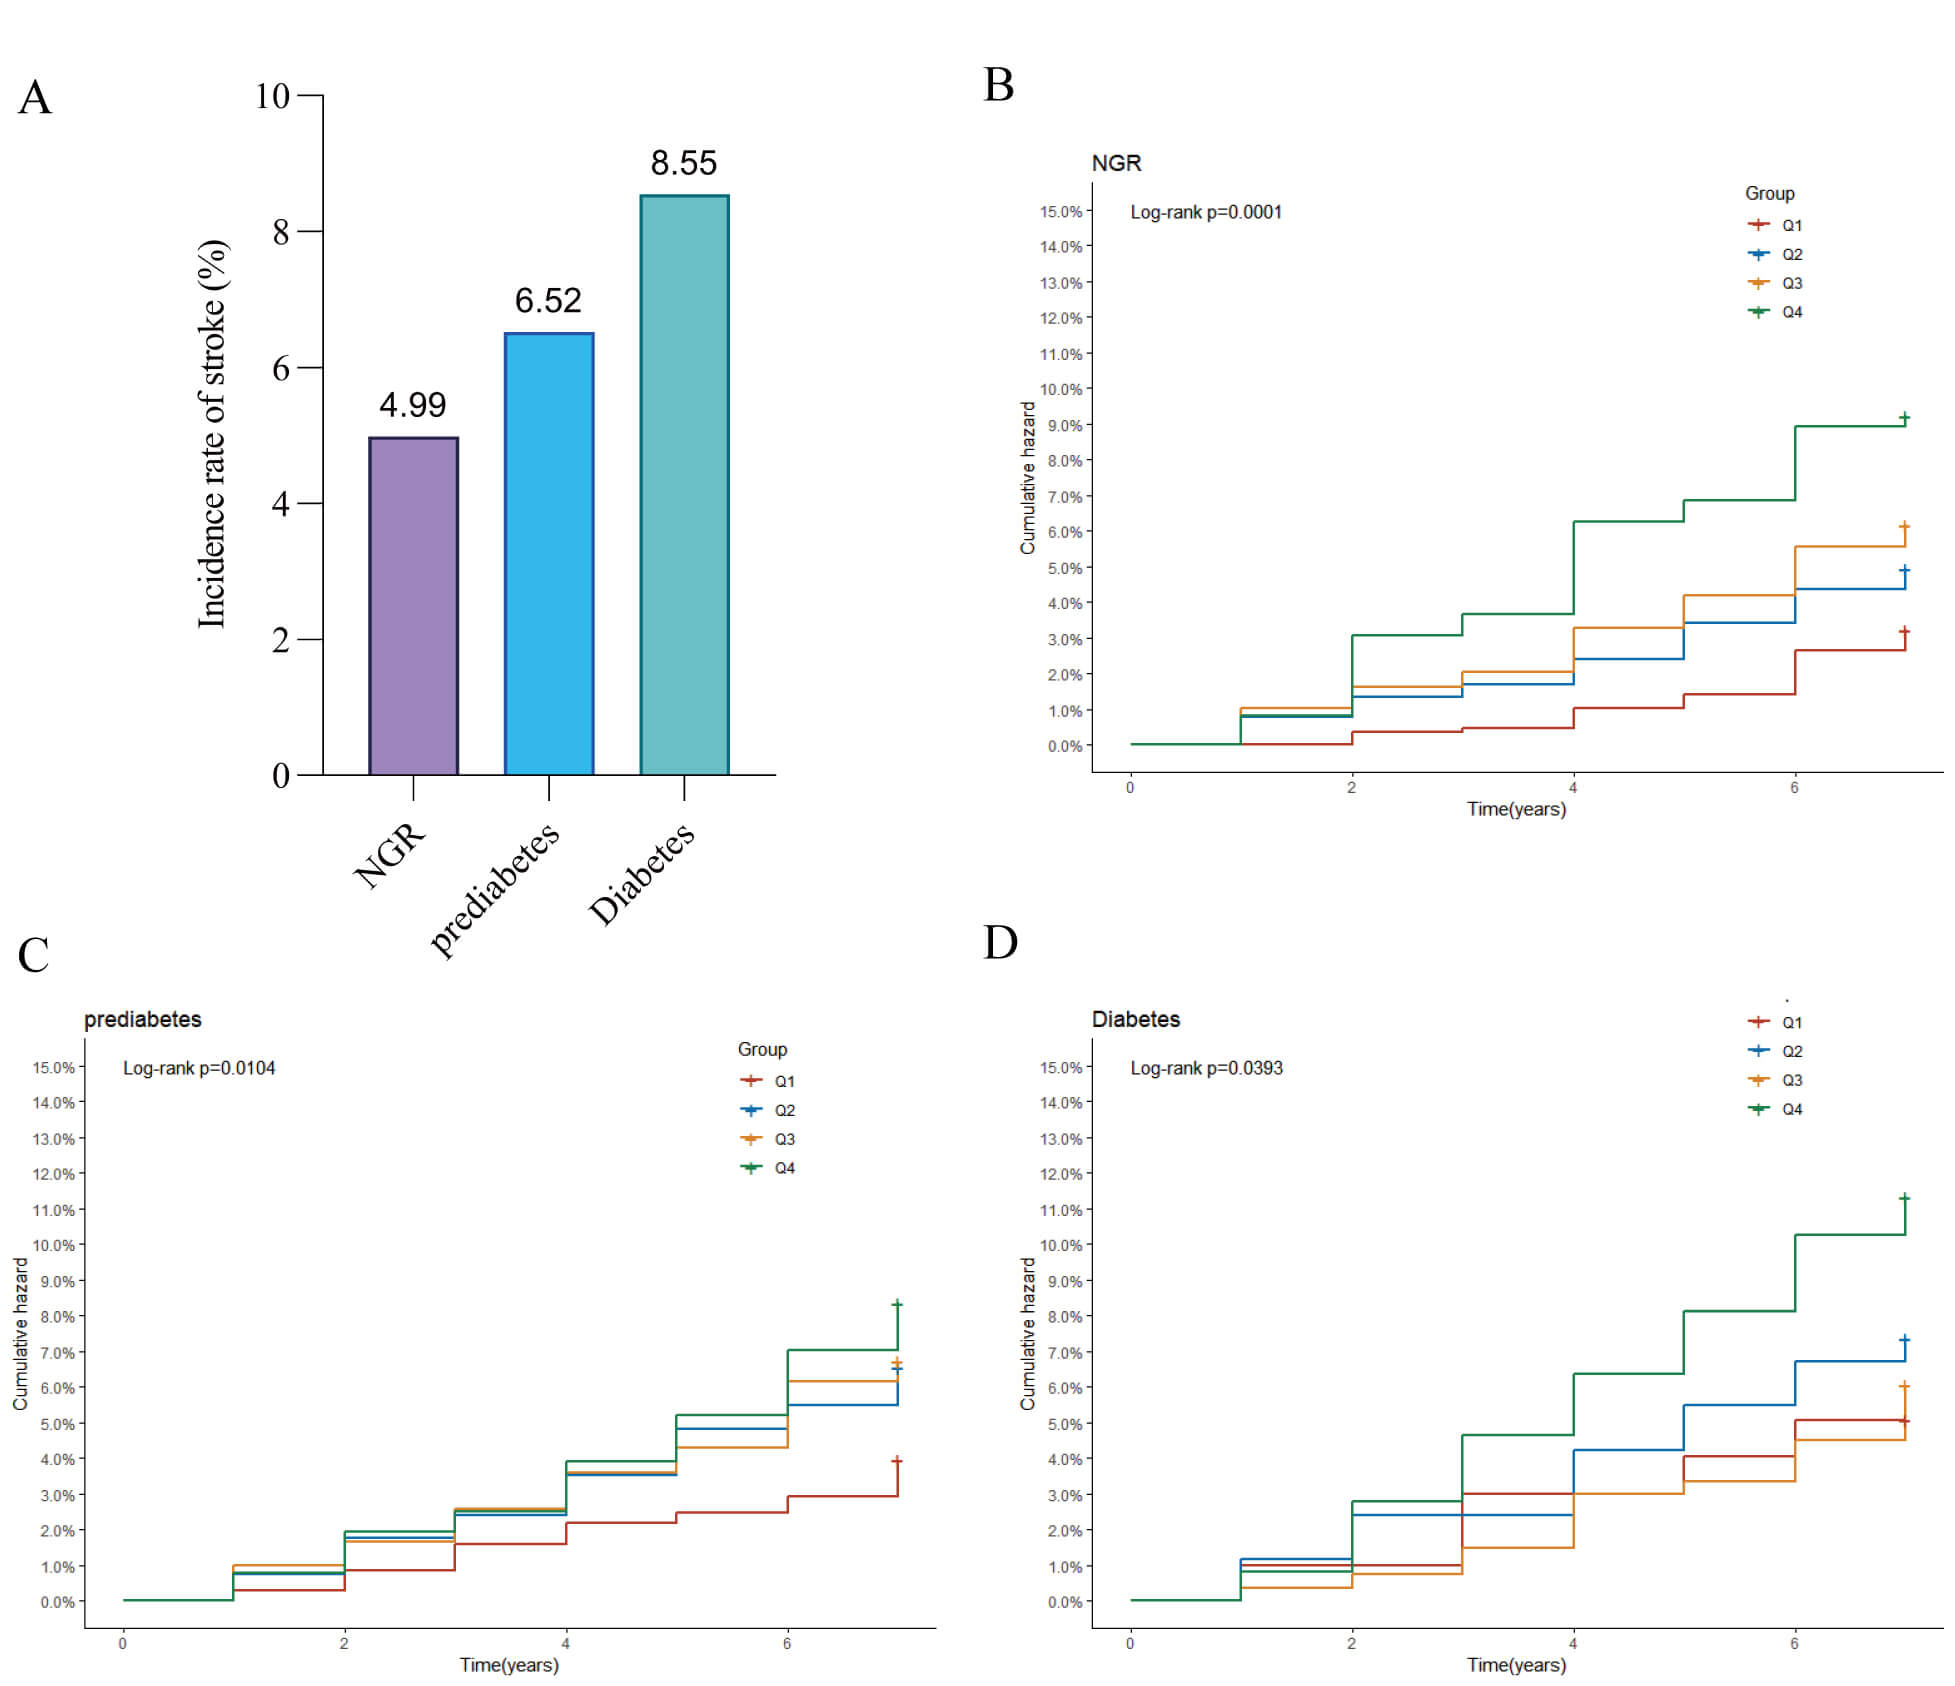 Fig. 3.
Stroke incidence by blood glucose status. (A) Bar chart of stroke incidence rates across different blood glucose status groups; (B) Kaplan–Meier curve of cumulative stroke incidence in participants with normal glucose regulation; (C) Kaplan–Meier curve of cumulative stroke incidence in pre-diabetic participants; (D) Kaplan–Meier curve of cumulative stroke incidence in diabetic participants.
| Characteristic | Model 1 | Model 2 | Model 3 | |||||||
| HR | 95% CI | p-value | HR | 95% CI | p-value | HR | 95% CI | p-value | ||
| NGR | ||||||||||
| MCMI | 1.22 | 1.06, 1.41 | 0.005 | 1.21 | 1.05, 1.40 | 0.01 | 1.34 | 0.93, 1.92 | 0.115 | |
| MCMI4 | ||||||||||
| Q1 | Ref. | Ref. | Ref. | |||||||
| Q2 | 1.54 | 0.98, 2.41 | 0.061 | 1.56 | 0.99, 2.46 | 0.054 | 1.51 | 0.95, 2.39 | 0.083 | |
| Q3 | 1.92 | 1.22, 3.03 | 0.005 | 1.99 | 1.25, 3.17 | 0.004 | 1.85 | 1.12, 3.04 | 0.016 | |
| Q4 | 2.88 | 1.78, 4.68 | 2.94 | 1.78, 4.86 | 2.59 | 1.43, 4.71 | 0.002 | |||
| Prediabetes | ||||||||||
| MCMI | 1.1 | 1.03, 1.18 | 0.004 | 1.12 | 1.05, 1.19 | 0.001 | 1.34 | 1.03, 1.75 | 0.028 | |
| MCMI4 | ||||||||||
| Q1 | Ref. | Ref. | Ref. | |||||||
| Q2 | 1.66 | 1.04, 2.64 | 0.034 | 1.69 | 1.06, 2.70 | 0.028 | 1.64 | 1.02, 2.63 | 0.041 | |
| Q3 | 1.7 | 1.08, 2.68 | 0.022 | 1.81 | 1.14, 2.87 | 0.012 | 1.51 | 0.93, 2.44 | 0.097 | |
| Q4 | 2.11 | 1.35, 3.28 | 2.3 | 1.45, 3.64 | 1.7 | 1.00, 2.88 | 0.048 | |||
| Diabetes | ||||||||||
| MCMI | 1.19 | 1.01, 1.39 | 0.035 | 1.18 | 1.00, 1.40 | 0.044 | 1.06 | 0.79, 1.42 | 0.689 | |
| MCMI4 | ||||||||||
| Q1 | Ref. | Ref. | Ref. | |||||||
| Q2 | 1.45 | 0.51, 4.11 | 0.487 | 1.39 | 0.49, 3.99 | 0.536 | 1.28 | 0.44, 3.69 | 0.648 | |
| Q3 | 1.18 | 0.43, 3.23 | 0.744 | 1.14 | 0.41, 3.15 | 0.799 | 0.82 | 0.29, 2.32 | 0.709 | |
| Q4 | 2.23 | 0.90, 5.52 | 0.085 | 2.18 | 0.86, 5.56 | 0.101 | 1.37 | 0.50, 3.72 | 0.539 | |
Abbreviation: MCMI, modified cardiometabolic index; HR, Hazard Ratio; NGR, normal glucose regulation; CI, Confidence Interval.
Model 1: Unadjusted.
Model 2: Adjusted for age, gender, education level, marital status, place of residence, smoking, and drinking history.
Model 3: Model 2 + adjusted for history of hypertension, dyslipidemia, heart disease, chronic kidney disease, use of antihypertensive drugs, use of lipid-lowering drugs, treatment with heart disease medications, body mass index, C-reactive protein, serum uric acid, blood urea nitrogen, serum creatinine.
RCS analysis indicated an overall significant linear relationship between MCMI and stroke events (Fig. 4A). A significant nonlinear association was observed in the NGR group (Fig. 4B), while prediabetic individuals showed a significant linear relationship (Fig. 4C). Conversely, no significant dose-response correlation was detected between the MCMI and stroke risk in diabetic patients (Fig. 4D). Given the nonlinear relationship between the MCMI and stroke events in the NGR group, we identified an inflection point for the MCMI at 1.904 using threshold analysis. Subsequent two-piece Cox proportional hazards regression modeling was used to determine the HRs and CIs on either side of this threshold. As shown in Table 4, the HR was 0.29 (95% CI: 0.12–0.67) before the inflection point and 1.85 (95% CI: 1.24–2.76) thereafter.
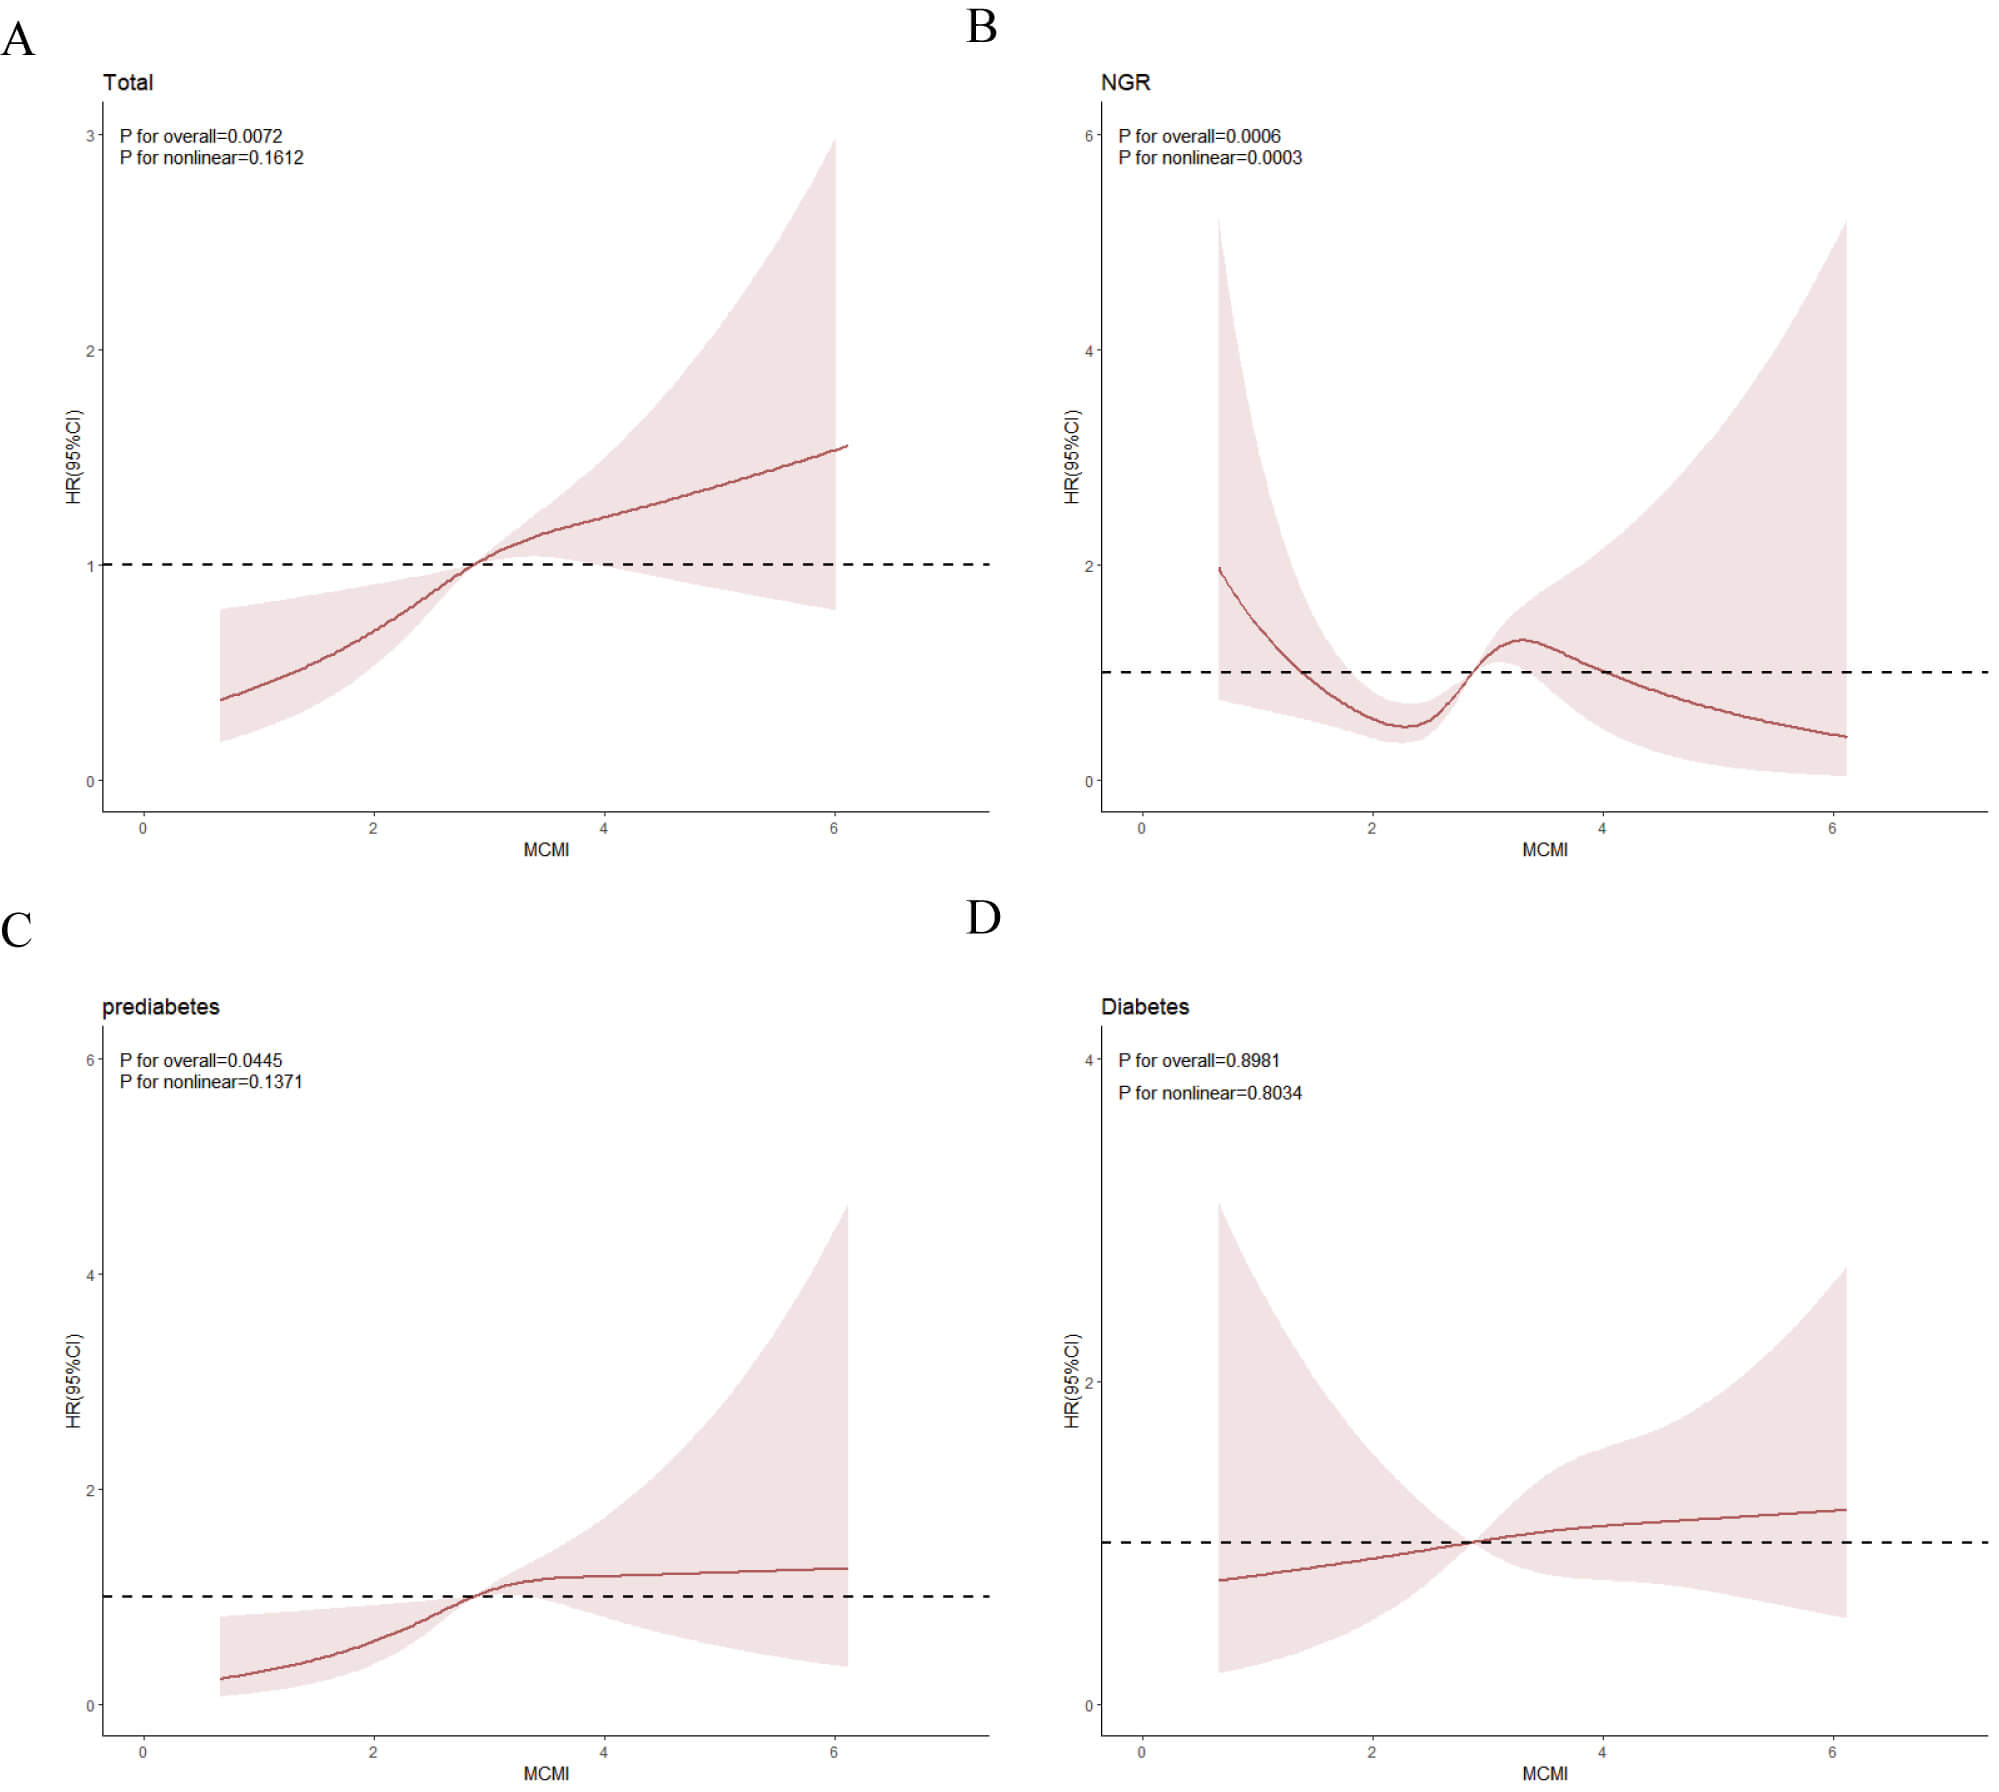 Fig. 4.
The association between the MCMI index and the risk of stroke as analyzed by RCS. All participants (A); NGR participants (B); participants with prediabetes (C); participants with diabetes (D). RCS, restricted cubic spline.
| Outcome: incident stroke | HR (95% CI) | p value | |
| Fitting model by standard linear regression | 1.34 (0.93–1.92) | 0.115 | |
| Fitting model by two-piecewise linear regression | |||
| Inflection point | 1.904 | ||
| 0.29 (0.12–0.67) | 0.004 | ||
| 1.85 (1.24–2.76) | 0.003 | ||
| p for the likelihood ratio test | 0.002 | ||
Model: The model takes into account age, gender, educational level, marital status, place of residence, smoking, drinking, history of hypertension, abnormal blood lipid levels, history of heart disease, chronic kidney disease, use of antihypertensive drugs, use of lipid-lowering drugs, heart disease treatment, body mass index, C-reactive protein, serum uric acid, blood urea nitrogen, serum creatinine.
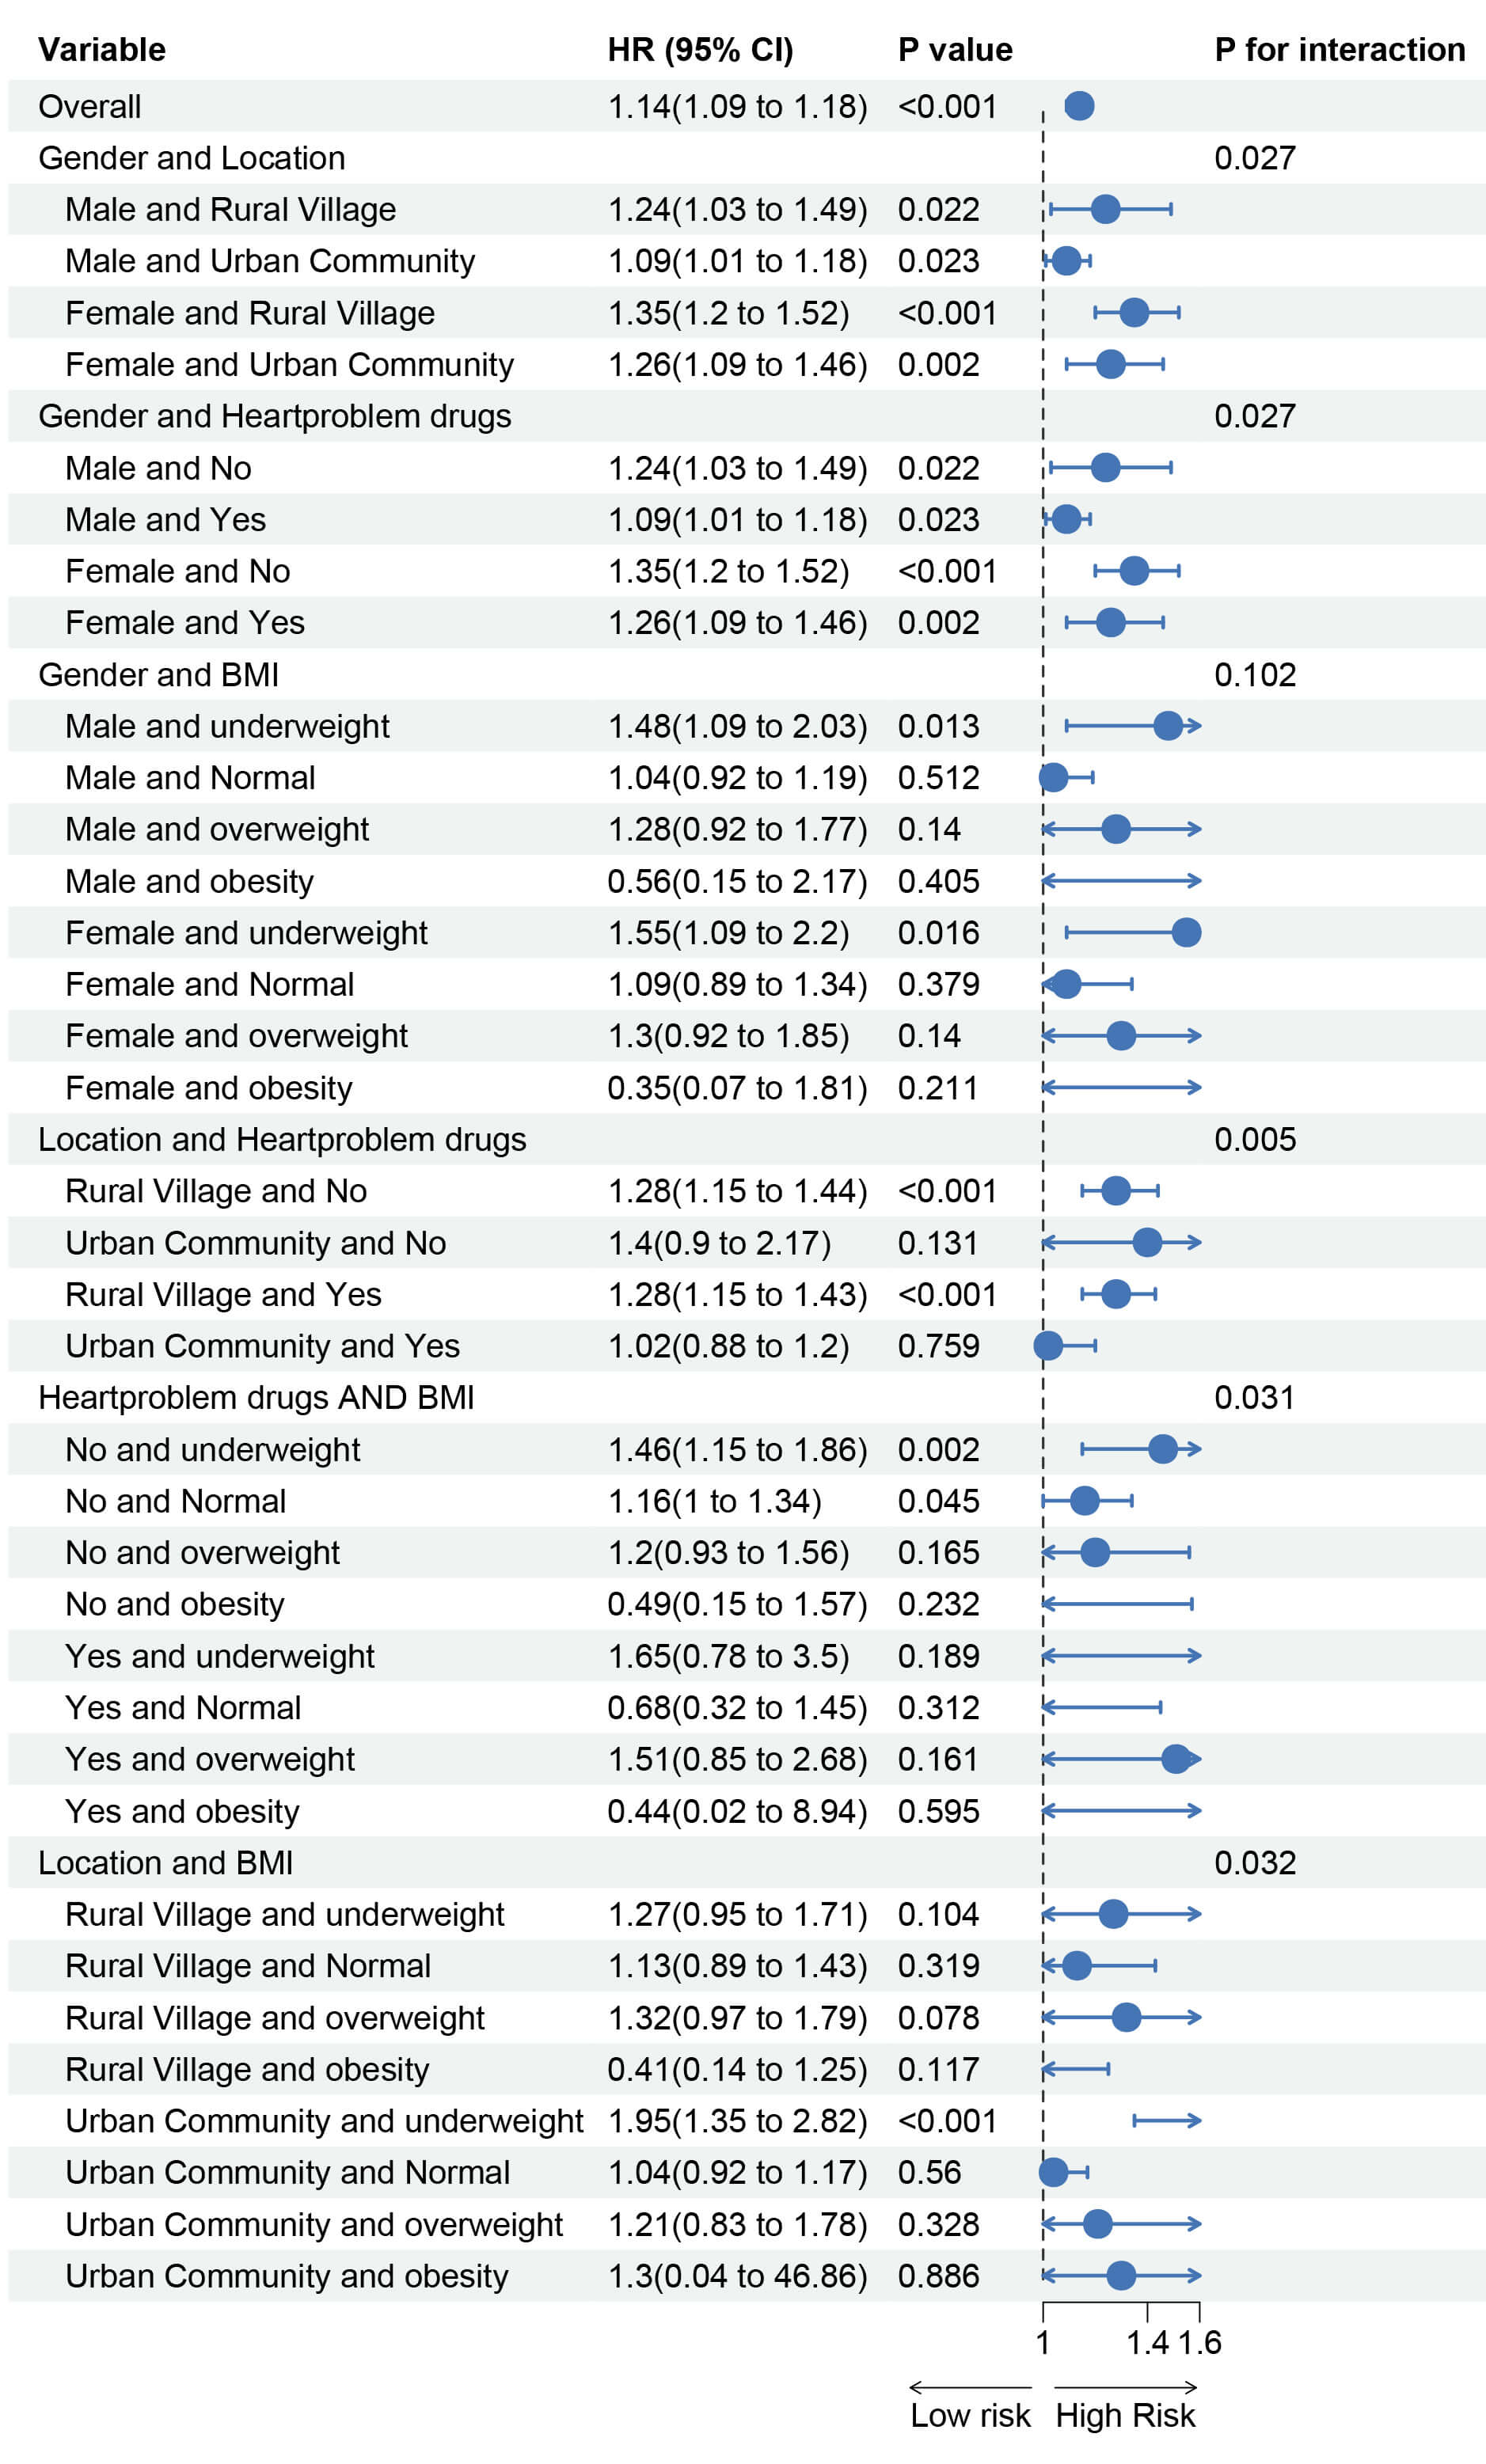
Subgroup analyses were performed based on gender, age, education level, residence (urban/rural), marital status, smoking status, alcohol consumption, BMI, relevant medical history, and medication use. The results (Fig. 5) indicate that the association between MCMI and incident stroke varied by gender, residence, BMI, and cardiac medication use. This suggests that male gender, rural residence, normal weight, and no use of cardiac medications were associated with a relatively higher risk of MCMI-related stroke. We further explored the combined effects of these high-risk factors on the association between MCMI and stroke. The results revealed that females living in rural areas, those who did not receive cardiac medication treatment, and individuals who were underweight in rural areas had a relatively higher risk of developing MCMI-related stroke (Fig. 6).
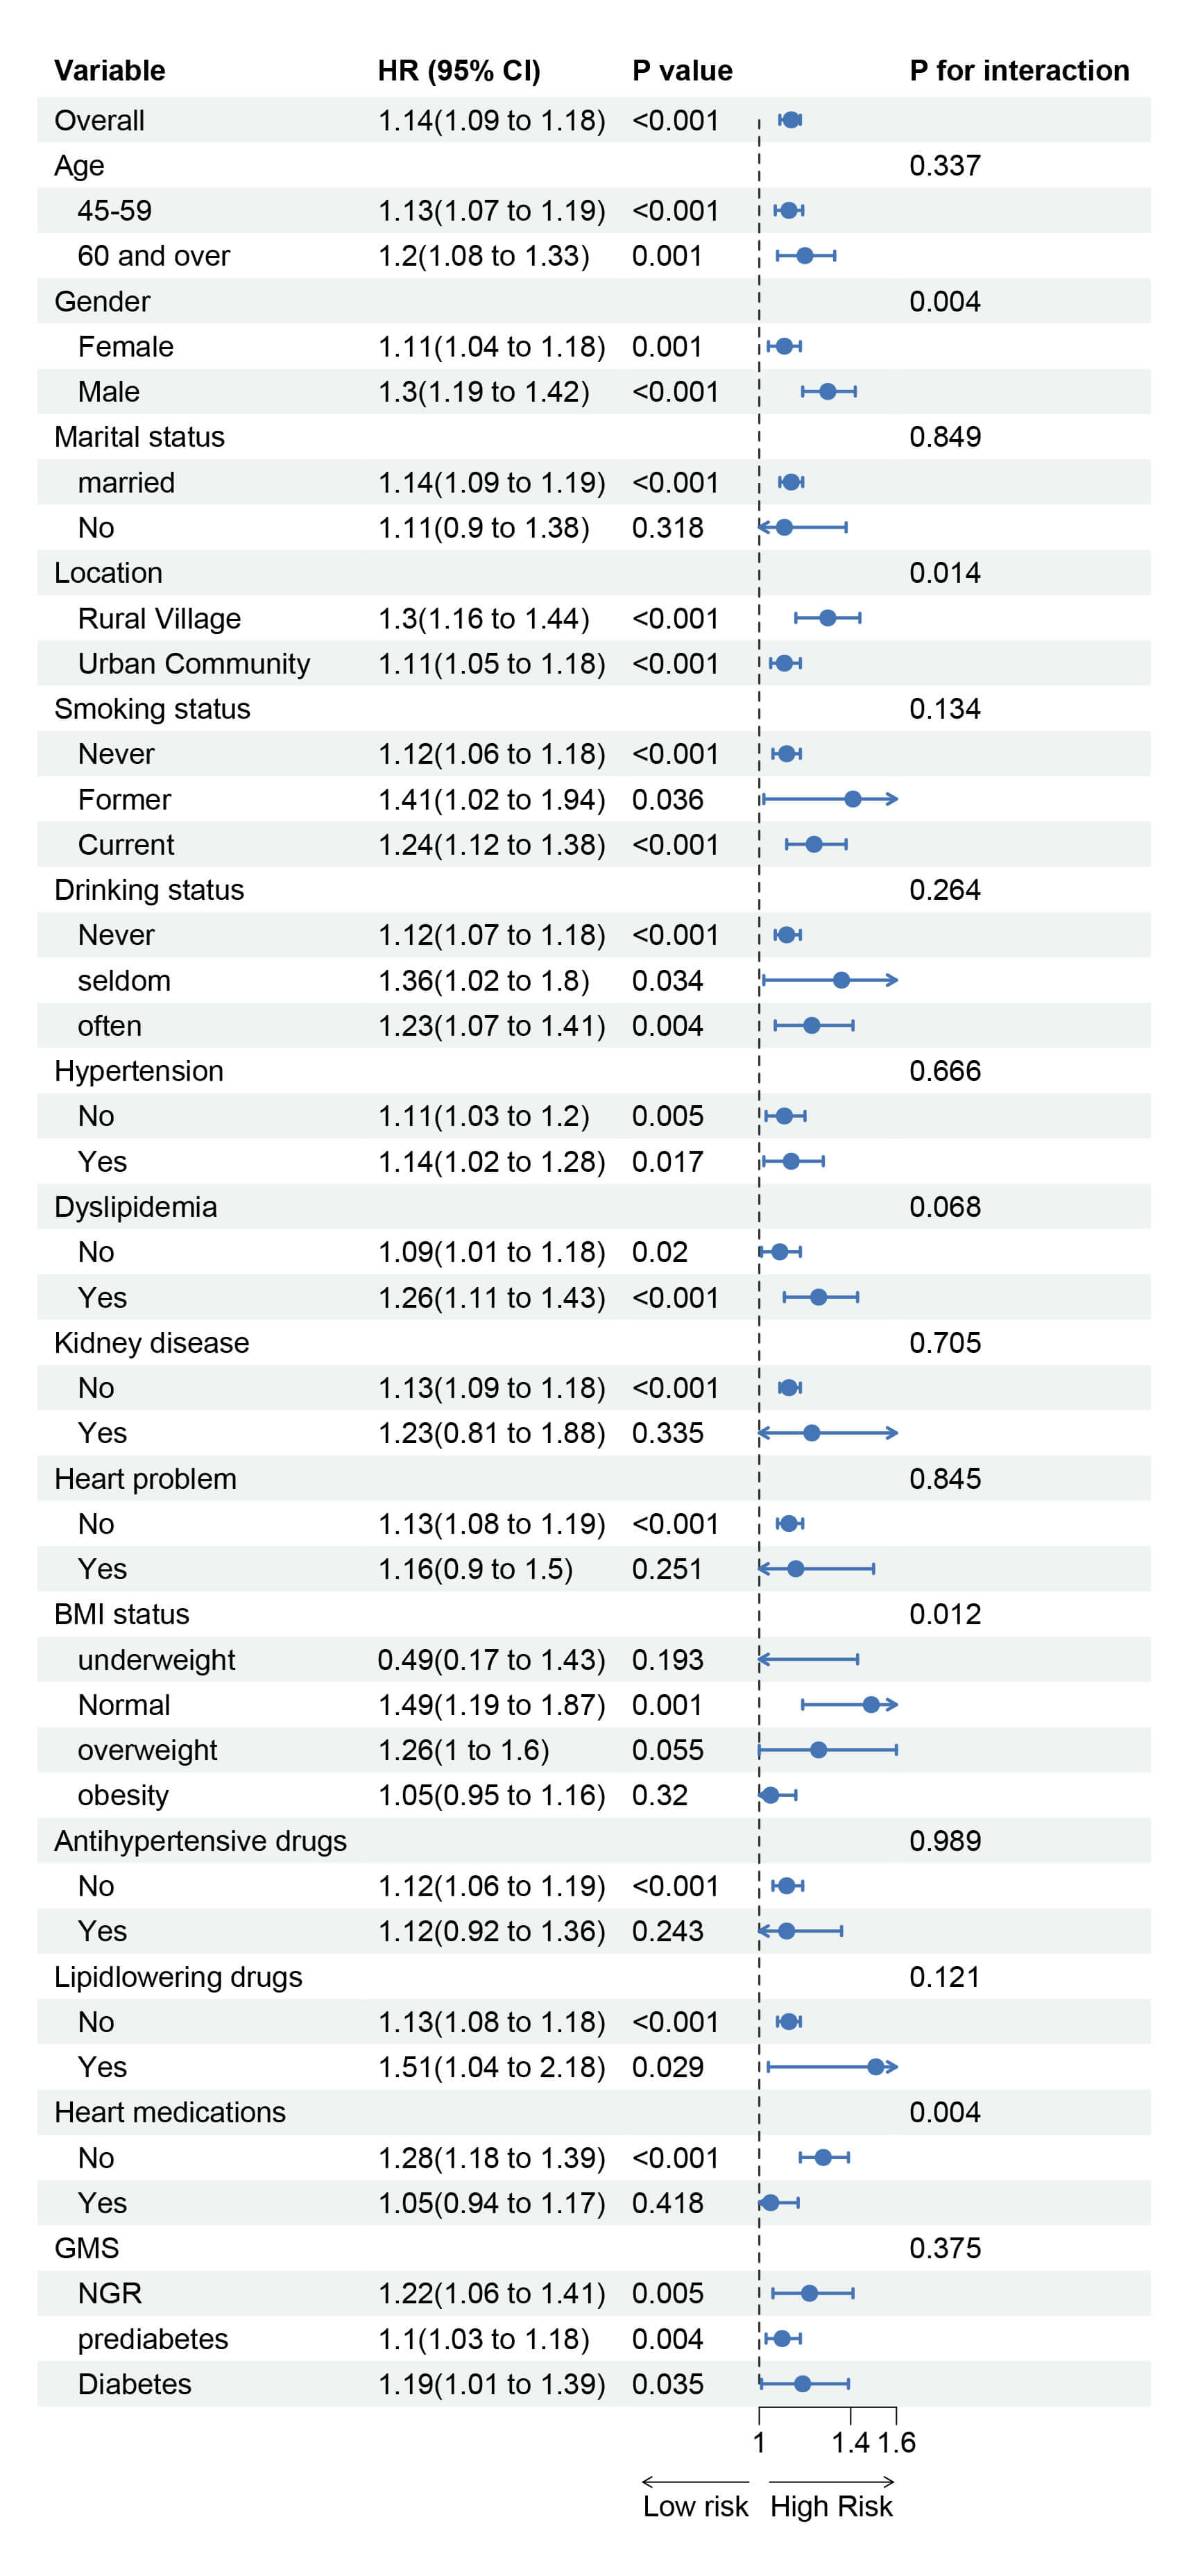 Fig. 5.
Subgroup and interaction analysis of the association between MCMI and stroke risk.
To assess the robustness of our findings, we conducted multiple sensitivity analyses. First, after all missing data were excluded, the results remained largely unchanged (Supplementary Tables 3,4; Supplementary Figs. 1–3). Second, when we removed all deceased participants and reanalyzed the data, no substantial changes were observed (Supplementary Tables 5,6; Supplementary Figs. 4–6). Third, the results remained stable when a logistic regression model was used (Supplementary Tables 7,8; Supplementary Fig. 7). Additionally, the E value for MCMI was calculated based on Model 3, yielding an E value of 1.86. This suggests that a relatively strong unmeasured confounder would be needed to fully explain the observed HRs. The diagnostic performance of the MCMI, CMI, TyG index, and WHtR for the identification of new strokes is shown in Supplementary Fig. 8. The MCMI has the highest AUC for identifying strokes, with a value of 0.599, which is superior to those of the CMI (AUC = 0.578), TyG index (AUC = 0.576), and WHtR (AUC = 0.589). Supplementary Tables. 9–12 contain additional data provided in response to reviewer comments.
This study revealed a positive correlation between the MCMI and stroke risk. Notably, among participants with different glycemic statuses, the MCMI showed a significant nonlinear association with stroke risk in those with NGR. When the MCMI exceeded 1.904, the risk increased significantly. Higher MCMI levels were associated with increased stroke risk in prediabetic individuals. To our knowledge, this is the first study to investigate the relationship between the MCMI and stroke incidence among middle-aged and elderly Chinese individuals across different glucose metabolism states, providing new insights for stroke prevention, early diagnosis, and control.
The MCMI was developed by Guo et al. [20] and was initially used to predict NAFLD and liver fibrosis incidence. This index combines the CMI, TyG, and WHtR indices, and existing research has clearly demonstrated associations between these three indices and stroke risk. A meta-analysis revealed that the CMI, by integrating multiple cardiovascular and metabolic factors, is strongly correlated with increased stroke risk and can serve as a comprehensive predictor of stroke risk [29]. The TyG index is an independent risk factor for stroke and can predict stroke onset, recurrence, and mortality risk [17, 30]. Additionally, compared with other obesity indicators, such as BMI and WC, the WHtR is significantly positively correlated with stroke risk and has better predictive value [31, 32]. Therefore, we initially hypothesized that the MCMI might be related to stroke, and our study confirmed an association between the MCMI and stroke, supporting the hypothesis that an elevated MCMI is positively correlated with stroke risk. This comprehensive approach could help clinicians identify high-risk patients for stroke, enabling accurate risk assessment and targeted interventions to reduce stroke incidence.
Although the underlying mechanisms linking the MCMI to stroke are not fully understood, the MCMI is influenced primarily by fasting glucose levels, lipid levels, and the waist-to-height ratio. A higher MCMI may reflect states of hyperglycemia, dyslipidemia, or visceral fat accumulation. Hyperglycemia, dyslipidemia, and elevated WHtR can independently increase stroke risk [33, 34, 35]. The potential mechanisms through which chronic hyperglycemia contributes to stroke include vascular endothelial dysfunction, the promotion of atherosclerotic plaque formation, and increased cholesterol levels through pathways such as the polyol pathway, protein kinase C activation, and advanced glycation end product accumulation [36, 37]. Additionally, hyperglycemia increases blood viscosity, reduces erythrocyte deformability, and promotes platelet aggregation and thrombosis [38]. Similarly, dyslipidemia increases ischemic stroke risk by promoting atherosclerosis, activating the coagulation system, increasing blood viscosity, and inhibiting the fibrinolytic system, leading to thrombosis and hemodynamic abnormalities [39, 40]. The waist-to-height ratio, as a core indicator of visceral obesity, directly reflects excessive abdominal fat accumulation, and visceral obesity has been identified as a key risk factor for stroke [41, 42]. Therefore, this study highlights the clinical importance of maintaining lower MCMI levels.
Analysis stratified by glycemic status revealed that the MCMI was significantly associated with stroke risk in NGR and prediabetic individuals, but no such association was observed in diabetic individuals. The lack of a significant association between the MCMI and stroke in diabetic patients may be attributed to several factors. In patients with diabetes, stroke risk may be primarily caused by mechanisms directly caused by hyperglycemia, such as vascular endothelial damage and coagulation abnormalities, rather than by dyslipidemia or visceral fat metabolism [43]. Diabetes is a strong risk factor for stroke, increasing ischemic stroke risk by 2- to 4-fold [44]. Thus, diabetes may overshadow the role of the MCMI as the dominant risk factor. Additionally, patients with diabetes often have other complications, such as nephropathy and neuropathy, which may contribute more significantly to stroke risk, diluting the impact of the MCMI [45, 46, 47]. Most importantly, the RCS results revealed that while stroke risk generally increased with an increasing MCMI, the association plateaued at very high MCMI levels. Compared with NGR and prediabetic individuals, diabetic individuals typically have MCMI levels in the higher range, where glucose, lipids, and visceral fat are already at stable high levels, reducing the sensitivity of the MCMI in predicting stroke risk [48]. These results emphasize the potential of the MCMI as an early marker for stroke and highlight the importance of managing MCMI levels based on glucose metabolism status. Specifically, the MCMI should be maintained below 1.904 in individuals with NGR, while prediabetic individuals should aim to lower MCMI levels to reduce stroke risk.
Subgroup analysis revealed significant relationships between the MCMI and stroke, with higher MCMI-related stroke risk observed in males, rural residents, normal-weight individuals, and those who did not use cardiac medications. These findings align with previous studies. In terms of gender differences, the global stroke incidence is 33% greater in males than in females, and abdominal obesity is more common in males, significantly increasing stroke risk even among individuals with a normal weight [49, 50]. With respect to rural–urban disparities, stroke prevalence is higher in rural China [51]. With respect to medication differences, cardiac patients who do not use anticoagulants/antiplatelet drugs have a significantly greater risk of stroke [52]. The higher MCMI-related stroke risk in normal-weight individuals may be due to visceral fat accumulation in some normal-BMI individuals, which increases stroke risk through metabolic disturbances. In contrast, in obese individuals, obesity itself and associated metabolic abnormalities may dominate stroke risk, masking the independent effects of the MCMI.
Our findings may significantly influence future randomized trials focused on stroke and atherosclerotic cardiovascular disease prevention, potentially benefiting from selectively recruiting high-risk individuals and targeting MCMI reduction. However, several limitations should be acknowledged. First, while the CHARLS dataset provides representative data for Chinese middle-aged and elderly people, it may not fully reflect broader population diversity. Second, residual confounding is possible due to the observational design. Although known covariates were adjusted for, unmeasured variables such as dietary intake, physical activity, and medication adherence were not included, potentially leading to over- or underestimation of the true association. Third, using self-reported physician-diagnosed stroke may have introduced recall or reporting bias, particularly in individuals with limited health literacy, possibly diluting association strength and subgroup analysis accuracy. Finally, the study did not account for changes in glycemic status or MCMI levels over time. Future research should consider these dynamic effects for a more comprehensive understanding.
In this study, we demonstrated that the MCMI serves as a valuable predictor of stroke risk in middle-aged and elderly Chinese individuals. Our findings revealed significant associations between the MCMI and stroke incidence among individuals with NGR and those with prediabetes, across different glycemic statuses. These results underscore the necessity of developing tailored risk management strategies based on individual glucose metabolic profiles. Optimizing diet structure, increasing moderate-intensity aerobic exercise, and controlling body weight are recommended to comprehensively improve the metabolic health of the heart and improve the MCMI value. Particularly in resource-limited settings where access to advanced biomarker measurement or imaging technologies may be constrained, incorporating MCMI measurements into routine clinical practice could significantly enhance early identification of individuals at high risk for stroke. The simplicity and cost-effectiveness of MCMI calculation make it particularly suitable for widespread clinical application in such environments.
All relevant data are described within the paper. Deidentified data can be requested. Data can be requested by all interested researchers, who can be contacted via the corresponding author.
TD: Conceptualization, Methodology, Writing-Original Draft, Investigation, Data Curation; YQ: Conceptualization, Methodology, Writing-Original Draft, Formal Analysis; YS: Formal Analysis, Investigation, Data Curation, Writing-Review & Editing; GW: Investigation, Resources, and contributed to editorial changes in the manuscript; XL: Investigation, Resources, and contributed to editorial changes in the manuscript; YP: Investigation, Resources, and contributed to editorial changes in the manuscript; ZD: Investigation, Resources, and contributed to editorial changes in the manuscript. All authors reviewed and approved the final manuscript and are accountable for all aspects of the work.
The study was carried out in accordance with the guidelines of the Declaration of Helsinki. Ethical approval for the CHARLS study was granted by the Ethics Committee of Peking University (IRB00001052-11015), and written informed consent was obtained from all participants. The data used in this study were fully de-identified and accessed from the CHARLS official website.
Not applicable.
The work was supported by the Science and Technology Project of Guangxi Health Commission (Z-B20241466).
The authors declare no conflict of interest.
Supplementary material associated with this article can be found, in the online version, at https://doi.org/10.31083/RCM45989.
References
Publisher’s Note: IMR Press stays neutral with regard to jurisdictional claims in published maps and institutional affiliations.