


1 Department of Endocrinology, The First Affiliated Hospital of Fujian Medical University, Fujian Medical University, 350005 Fuzhou, Fujian, China
2 Department of Endocrinology, National Regional Medical Center, Binhai Campus of the First Affiliated Hospital of Fujian Medical University, Fujian Medical University, 350212 Fuzhou, Fujian, China
3 Clinical Research Center for Metabolic Diseases of Fujian Province, The First Affiliated Hospital of Fujian Medical University, Fujian Medical University, 350005 Fuzhou, Fujian, China
4 Fujian Key Laboratory of Glycolipid and Bone Mineral Metabolism, The First Affiliated Hospital of Fujian Medical University, Fujian Medical University, 350005 Fuzhou, Fujian, China
5 Diabetes Research Institute of Fujian Province, The First Affiliated Hospital of Fujian Medical University, Fujian Medical University, 350005 Fuzhou, Fujian, China
6 Department of Cardiology, The First Affiliated Hospital of Fujian Medical University, Fujian Medical University, 350005 Fuzhou, Fujian, China
7 Department of Cardiology, National Regional Medical Center, The First Affiliated Hospital of Fujian Medical University, Fujian Medical University, 350212 Fuzhou, Fujian, China
8 Department of Cardiovascular and Metabolic Medicine, Institute of Life Course and Medical Sciences, University of Liverpool, L7 8TX Liverpool, UK
9 Liverpool Centre for Cardiovascular Science at University of Liverpool, Liverpool John Moores University and Liverpool Heart and Chest Hospital, L7 8TX Liverpool, UK
Abstract
Cardiovascular–kidney–metabolic (CKM) syndrome embodies the interconnection between cardiovascular, renal, and metabolic disorders. Anthropometric indices reflect distinct aspects of obesity and may aid in stratifying the severity of CKM syndrome and predicting mortality. Thus, this study aimed to assess and compare the relationships between multiple obesity-related measures and advanced CKM stages, as well as the risk of mortality.
Data included in this analysis were from the National Health and Nutrition Examination Survey (NHANES). Participants were categorized into quartiles (Q1–Q4) based on each anthropometric index. We estimated the associations with all-cause, cardiovascular, and non-cardiovascular mortality outcomes using Cox proportional hazards models, and evaluated the odds of an advanced CKM stage (stages 3/4) using logistic regression. Possible non-linear exposure–outcome patterns were further investigated through restricted cubic spline modelling. Then, to compare the predictive performance of the indices, we calculated the area under the receiver operating characteristic curve (AUC).
We included 28,911 adults from the NHANES (1999–2018) (median age (interquartile range (IQR)) 55.0 (40.0–67.0) years, 52.5% male), comprising 21,789 in CKM stages 1–2 and 7122 in stages 3–4. The anthropometric indices varied significantly across CKM stages (p < 0.001), with body mass index, waist circumference, Weight-adjusted Waist Index (WWI), and relative fat mass increasing with disease severity. In stages 1–2, the highest quartile (Q4) of A Body Shape Index (ABSI), WWI, waist-to-height ratio (WHtR), and Conicity Index (C-index) was associated with higher all-cause and cardiovascular mortalities, often following U-shaped or J-shaped non-linear patterns. In stages 3–4, predictive strength diminished, with only the ABSI and WWI showing consistent associations with mortality. For CKM progression, the ABSI (AUC = 0.73), WWI (AUC = 0.70), and C-index (AUC = 0.69) demonstrated the best discrimination.
This study shows that several anthropometric indices, particularly the ABSI, WWI, WHtR, and C-index, are strongly associated with advanced CKM stage and increased mortality risk. These associations were stronger for central adiposity measures than for general adiposity, suggesting the potential relevance of central fat distribution and supporting the possible role of anthropometric indices in early risk stratification and targeted intervention in CKM syndrome.
Keywords
- anthropometry
- cardio-renal syndrome
- metabolic syndrome
- mortality
- disease progression
Cardiovascular-kidney-metabolic (CKM) syndrome is a new medical concept introduced and officially defined by the American Heart Association (AHA) in 2023. It aims to emphasize the close connections, mutual influences, and shared pathophysiological basis between metabolic disorders, chronic kidney disease (CKD), and cardiovascular diseases (CVD) (such as obesity, type 2 diabetes, and metabolic dysfunction-related fatty liver disease) [1]. The global pandemics of obesity, prediabetes/diabetes, and population aging signal that the prevalence of CKM syndrome will continue to rise [1, 2]. CKM syndrome is a major cause of premature death, disability, and skyrocketing healthcare costs. It represents one of the most significant challenges currently facing global public health [3].
CKM syndrome refers to a comprehensive condition where CKD, metabolic risk
factors, and metabolic disorders (especially obesity and insulin resistance)
collectively elevate the risk of CVD [1]. Its core mechanism lies in excess
adiposity, which drives chronic low-grade inflammation and insulin resistance,
establishing a reinforcing cycle that leads to progressive cardiac, renal, and
vascular injury [4]. Over 90% of adults will experience overweight or obesity
during their lifetime, and most of them will have at least one metabolic
abnormality or target organ damage, indicating that the majority of
overweight/obese individuals are at risk for CKM syndrome [5]. Systemic obesity
(body mass index [BMI], A Body Shape Index [ABSI], and Weight-adjusted Waist
Index [WWI]) can trigger insulin resistance, hyperglycemia, and dyslipidemia,
further promoting the development of atherosclerosis and CKD [6, 7, 8]. Visceral fat
(lipid accumulation product [LAP] and visceral adiposity index [VAI]) secretes
pro-inflammatory factors (such as TNF-
Research on predicting the prognosis of CKM has developed various risk assessment models. The high-sensitivity C-reactive protein/high-density lipoprotein cholesterol (HDL-C) ratio is closely linked to all-cause mortality risk in CKM patients [18], while the estimated glucose disposal rate (eGDR) effectively predicts prognosis by assessing insulin resistance [19]. Additionally, models incorporating social factors, like those from the China Health and Retirement Longitudinal Study (CHARLS), highlight the impact of the social environment on mental health [20]. Machine learning techniques, such as random forests and XGBoost, improve prediction accuracy [21]. These advancements offer valuable insights for clinical management. Growing research attention has been directed toward newly proposed obesity- and lipid-related indices, as accumulating evidence suggests that they may be closely associated with CKM. The AHA classifies CKM into stages from CKM 0 to CKM 4, with CKM stages 1 and 2 involving multiple metabolic risk factors but no organ damage [1]. Stages 3 and 4 of CKM are characterized by structural organ damage and functional failure, with obesity shifting to sarcopenic obesity and central fat accumulation. The disease is often irreversible at this stage [22, 23]. Elevated BMI, WC, and BRI are linked to a higher risk of cardiovascular mortality [24, 25, 26]. A higher metabolic score for visceral fat (METS-VF) is related to higher risks of CVD and all-cause mortality in individuals with varying glycaemic status [27]. A nationwide longitudinal study reported that abdominal obesity, as assessed by the BRI, is closely related to the progression of frailty across different stages of the CKM syndrome [28].
Given the substantial differences in mortality risk between CKM stages 1–2 and 3–4 reported in a previous publication [29], it is essential to assess prognostic markers within early and advanced stages separately. Therefore, this study aimed to utilise data from National Health and Nutrition Examination Survey (NHANES) to (1) compare the associations of multiple anthropometric indices with all-cause and cause-specific mortality in patients with CKM stages 1–2 and 3–4, respectively; and (2) compare the cross-sectional associations of multiple anthropometric indicators with advanced CKM staging.
This analysis used data from the NHANES, a nationally representative programme conducted by the U.S. Centers for Disease Control and Prevention to monitor population health and nutritional status. The survey protocol received approval from the National Center for Health Statistics Ethics Review Board, and written informed consent was obtained from all participants. The datasets are publicly accessible at: https://www.cdc.gov/nchs/nhanes/. The study followed the Strengthening the Reporting of Observational Studies in Epidemiology (STROBE) reporting guidelines (Supplementary Table 1) [30].
A total of 55,081 adults aged
We extracted demographic factors (age, race, sex, height, weight, WC, hip measurement), socioeconomic indicators (marital status, poverty-to-income ratio, education level), lifestyle behaviors (physical activity, smoking status, alcohol consumption), comorbid conditions (diabetes, hypertension, CKD, prior stroke, CVD), and laboratory indicators (hemoglobin A1c, high-density lipoprotein cholesterol [HDL-C], urine albumin-to-creatinine ratio [UACR]), estimated glomerular filtration rate (eGFR), total cholesterol, 10-year predicted CVD risk score, Systemic Immune-Inflammation Index (SII), and frailty score (Supplementary Table 2) [29].
CKM staging followed the AHA classification framework and prior publications [1, 29, 31]. Participants were assigned to CKM stages 1–4 using a predefined
algorithm that integrates metabolic abnormalities, kidney disease, and CVD.
Metabolic abnormalities included obesity, dysglycemia, hypertension,
hypertriglyceridemia, or metabolic syndrome. CVD was defined as clinical CVD
(heart failure, coronary heart disease, myocardial infarction, or stroke) or
elevated subclinical risk, estimated using the AHA PREVENT 10-year CVD risk
equations (
Height, Weight, WC, and hip measurements were measured with calibrated equipment according to established protocols (https://wwwn.cdc.gov/Nchs/Data/Nhanes/Public/1999/DataFiles/BMX.htm). Anthropometric measures included BMI, WC, BRI, WWI, ABSI, RFM, WHtR, C-index, VAI, LAP, WHR, BAI, AVI were determined using specified equations (Supplementary Table 6).
Three mortality outcomes were considered in the analysis: all-cause mortality, cardiovascular mortality, and non-cardiovascular mortality. Vital status and causes of death were identified through the National Death Index, which is integrated with NHANES and overseen by the U.S. Centers for Disease Control and Prevention. Mortality follow-up extended until 31 December 2019. Causes of death were classified using the Tenth Revision of the International Classification of Diseases. Person-time was calculated from the date of each participant’s NHANES interview to either death or the end of follow-up.
In this study, missing values were excluded from the analyses. Continuous measures were summarized using the median and interquartile ranges (IQR). Between-group comparisons for continuous variables employed nonparametric Kruskal-Wallis tests. Categorical variables were evaluated through Fisher’s exact tests or Pearson’s chi-square tests, with outcomes presented as frequency counts and proportional percentages.
Participants were classified into early CKM stage (CKM stages 1–2) and advanced CKM stage (CKM stages 3–4). For each anthropometric indicator, individuals were further grouped by quartiles (Q1–Q4). To examine mortality risk, we fitted Cox proportional hazards models for each index (BMI, WC, BRI, WWI, RFM, ABSI, WHtR, and C-index) with Q1 serving as the reference category, and reported hazard ratios (HRs) and 95% confidence intervals (CIs). The models were adjusted for a range of potential confounders, including age, sex, race, socioeconomic status (poverty income ratio, marital status, education), lifestyle factors (smoking, alcohol use, physical activity), and comorbid conditions (CVD, hypertension, diabetes, CKD, and stroke). To investigate possible non-linear dose–response relationships, restricted cubic spline (RCS) functions were applied to continuous forms of the anthropometric indices. Furthermore, the discriminatory capacity of each index for predicting mortality among individuals with CKM was assessed by receiver operating characteristic (ROC) analysis, with area under the receiver operating characteristic curve (AUC) values reported and pairwise differences compared using the DeLong test.
Then, we performed multivariable logistic regression to evaluate the relationships between anthropometric indicators and advanced CKM stage (stages 3–4 vs. 1–2), adjusting for the same covariates as in the Cox models. Odds ratios (ORs) and 95% CIs were calculated by comparing the highest quartile (Q4) with the lowest quartile (Q1) for each anthropometric index. To assess potential non-linear dose–response patterns, RCS models were applied. The predictive performance of the indices for advanced CKM stage and CKM-related mortality was evaluated using ROC curves, and AUC values were statistically compared using the DeLong test.
We conducted two sensitivity analyses: first, to address potential residual confounding, we performed additional sensitivity analyses in which we further adjusted the Cox proportional hazards models for frailty score; second, to mitigate reverse causality, we excluded patients who died within the first two years of follow-up and re-examined the impact of various obesity-related indicators on mortality among CKM stage 3–4 patients.
Additionally, patients with missing data on triglycerides (N = 12,426) and hip circumference (N = 25,897) were excluded from the respective analyses. Specifically, ROC analyses of VAI and LAP were conducted within the triglyceride-available cohort, and those of WHR, BAI, and AVI were performed within the hip circumference-available cohort. In each subset, these indices were compared against the primary anthropometric measures to evaluate relative discriminatory performance.
Statistical analyses were conducted using SPSS Statistics (version 27; IBM
Corporation, Armonk, NY, USA) and R software (version 4.4.2; R Foundation for
Statistical Computing, Vienna, Austria). A two-sided significance threshold of
p
A total of 28,911 eligible participants were included in this analysis, with a
median age of 55.0 years (IQR: 40.0–67.0), 52.5% males. Table 1 presented the
baseline characteristics of participants, categorized by CKM staging. The cohort
consisted of 21,789 CKM stage 1–2 patients and 7122 CKM stage 3–4 patients.
Anthropometric indices showed notable differences across CKM stages. BMI, WC,
RFM, WWI and other adiposity-related measures were generally higher in CKM stages
2–4 compared with stage 1, although the specific pattern of change varied by
index. Overall, all anthropometric indices differed significantly across CKM
stages (p
| Characteristics | All CKM (N = 28,911) | CKM stage 1 (N = 3254) | CKM stage 2 (N = 18,535) | CKM stage 3 (N = 3336) | CKM stage 4 (N = 3786) | p | |
| Age, years | 55.0 (40.0, 67.0) | 40.0 (30.0, 51.0) | 50.0 (39.0, 61.0) | 78.0 (72.0, 80.0) | 68.0 (60.0, 77.0) | ||
| Male, n (%) | 15,187.0 (52.5) | 1589.0 (48.8) | 9408.0 (50.8) | 1917.0 (57.5) | 2273.0 (60.0) | ||
| Race, n (%) | |||||||
| Mexican American | 4820.0 (16.7) | 618.0 (19.0) | 3367.0 (18.2) | 435.0 (13.0) | 400.0 (10.6) | ||
| Non-Hispanic Black | 6008.0 (20.8) | 658.0 (20.2) | 4029.0 (21.7) | 567.0 (17.0) | 754.0 (19.9) | ||
| Non-Hispanic White | 13,372.0 (46.3) | 1298.0 (39.9) | 7894.0 (42.6) | 1976.0 (59.2) | 2204.0 (58.2) | ||
| Hispanic and others | 4711.0 (16.3) | 680.0 (20.9) | 3245.0 (17.5) | 358.0 (10.7) | 428.0 (11.3) | ||
| Poverty income ratio | 2.2 (1.2, 4.1) | 2.5 (1.2, 4.5) | 2.3 (1.2, 4.3) | 1.9 (1.2, 3.3) | 1.8 (1.1, 3.3) | ||
| Education, n (%) | |||||||
| College or above | 14,181.0 (49.1) | 1938.0 (59.6) | 9395.0 (50.7) | 1316.0 (39.4) | 1532.0 (40.5) | ||
| High school or equivalent | 11,159.0 (38.6) | 1065.0 (32.7) | 7125.0 (38.4) | 1324.0 (39.7) | 1645.0 (43.4) | ||
| Less than high school | 3571.0 (12.4) | 251.0 (7.7) | 2015.0 (10.9) | 696.0 (20.9) | 609.0 (16.1) | ||
| Marital status, n (%) | |||||||
| Unmarried | 3872.0 (13.4) | 749.0 (23.0) | 2764.0 (14.9) | 123.0 (3.7) | 236.0 (6.2) | ||
| Married | 17,804.0 (61.6) | 2044.0 (62.8) | 11,701.0 (63.1) | 1853.0 (55.5) | 2206.0 (58.3) | ||
| Divorced | 7235.0 (25.0) | 461.0 (14.2) | 4070.0 (22.0) | 1360.0 (40.8) | 1344.0 (35.5) | ||
| Smoking status, n (%) | |||||||
| Current smoker | 5826.0 (20.2) | 589.0 (18.1) | 4233.0 (22.8) | 243.0 (7.3) | 761.0 (20.1) | ||
| Former smoker | 8161.0 (28.2) | 674.0 (20.7) | 4464.0 (24.1) | 1438.0 (43.1) | 1585.0 (41.9) | ||
| Never smoker | 14,924.0 (51.6) | 1991.0 (61.2) | 9838.0 (53.1) | 1655.0 (49.6) | 1440.0 (38.0) | ||
| Alcohol consumption, n (%) | |||||||
| Heavy | 3973.0 (13.7) | 559.0 (17.2) | 3004.0 (16.2) | 118.0 (3.5) | 292.0 (7.7) | ||
| Mild to moderate | 6512.0 (22.5) | 955.0 (29.3) | 4628.0 (25.0) | 375.0 (11.2) | 554.0 (14.6) | ||
| Non-drinker | 18,426.0 (63.7) | 1740.0 (53.5) | 10,903.0 (58.8) | 2843.0 (85.2) | 2940.0 (77.7) | ||
| Physical activity, n (%) | |||||||
| Less than moderate | 17,050.0 (59.0) | 1795.0 (55.2) | 10,629.0 (57.3) | 2193.0 (65.7) | 2433.0 (64.3) | ||
| Moderate | 7139.0 (24.7) | 763.0 (23.4) | 4530.0 (24.4) | 881.0 (26.4) | 965.0 (25.5) | ||
| Vigorous | 4722.0 (16.3) | 696.0 (21.4) | 3376.0 (18.2) | 262.0 (7.9) | 388.0 (10.2) | ||
| Comorbidities | |||||||
| CVD | 3786.0 (13.1) | 0.0 (0.0) | 0.0 (0.0) | 0.0 (0.0) | 3786.0 (100.0) | ||
| Hypertensive | 16,418.0 (56.8) | 0.0 (0.0) | 10,683.0 (57.6) | 2775.0 (83.2) | 2960.0 (78.2) | ||
| Diabetes | 6614.0 (22.9) | 151.0 (4.6) | 3453.0 (18.6) | 1510.0 (45.3) | 1500.0 (39.6) | ||
| CKD | 6876.0 (23.8) | 0.0 (0.0) | 3250.0 (17.5) | 1902.0 (57.0) | 1724.0 (45.5) | ||
| Stroke | 1352.0 (4.7) | 0.0 (0.0) | 0.0 (0.0) | 0.0 (0.0) | 1352.0 (35.7) | ||
| Laboratory indicators | |||||||
| Total cholesterol, mg/dL | 195.0 (169.0, 224.0) | 191.0 (166.0, 214.0) | 200.0 (174.0, 229.0) | 190.0 (164.0, 217.0) | 179.0 (152.0, 211.0) | ||
| HDL-C, mg/dL | 50.0 (41.0, 61.0) | 57.0 (51.0, 66.0) | 48.0 (40.0, 60.0) | 49.0 (41.0, 60.0) | 47.0 (39.0, 58.0) | ||
| eGFR, mL/min/1.73 m2 | 91.1 (74.1, 106.0) | 104.3 (91.0, 116.8) | 95.6 (81.6, 108.6) | 64.4 (50.3, 79.3) | 73.3 (55.6, 88.7) | ||
| UACR, mg/g | 7.7 (4.7, 17.0) | 5.2 (3.8, 7.8) | 7.3 (4.7, 14.6) | 14.7 (7.4, 42.0) | 11.5 (6.2, 34.7) | ||
| Hemoglobin A1c | 5.6 (5.3, 6.0) | 5.4 (5.1, 5.6) | 5.5 (5.3, 5.9) | 5.9 (5.5, 6.6) | 5.8 (5.5, 6.4) | ||
| SII | 476.1 (338.5, 669.4) | 430.4 (310.2, 598.5) | 473.5 (340.0, 660.2) | 502.0 (355.2, 719.2) | 505.4 (344.6, 724.0) | ||
| 10-year CVD risk score | 5.8 (1.6, 15.3) | 1.0 (0.4, 2.8) | 4.1 (1.4, 9.6) | 26.0 (22.7, 30.7) | 18.3 (9.4, 27.6) | ||
| Frailty score | 0.1 (0.1, 0.2) | 0.1 (0.1, 0.1) | 0.1 (0.1, 0.2) | 0.2 (0.1, 0.2) | 0.3 (0.2, 0.3) | ||
| Anthropometric indices | |||||||
| BMI, kg/m2 | 28.7 (25.3, 33.1) | 27.3 (25.1, 30.7) | 29.1 (25.5, 33.7) | 27.9 (24.7, 31.5) | 29.0 (25.6, 33.4) | ||
| WC, cm | 100.4 (91.1, 110.7) | 94.0 (87.3, 102.7) | 100.5 (91.0, 111.0) | 102.0 (93.3, 110.8) | 104.1 (95.2, 114.5) | ||
| BRI | –1.2 (–1.2, –1.1) | –1.2 (–1.2, –1.2) | –1.2 (–1.2, –1.1) | –1.2 (–1.2, –1.1) | –1.2 (–1.2, –1.1) | ||
| WWI | 11.2 (10.6, 11.7) | 10.7 (10.2, 11.2) | 11.1 (10.6, 11.6) | 11.7 (11.2, 12.1) | 11.5 (11.1, 12.0) | ||
| ABSI | 0.1 (0.1, 0.1) | 0.1 (0.1, 0.1) | 0.1 (0.1, 0.1) | 0.1 (0.1, 0.1) | 0.1 (0.1, 0.1) | ||
| RFM, % | 35.2 (29.6, 43.3) | 34.8 (27.6, 41.3) | 35.5 (29.5, 43.7) | 34.6 (30.6, 43.1) | 35.0 (30.4, 43.4) | ||
| WHR | 0.6 (0.5, 0.7) | 0.6 (0.5, 0.6) | 0.6 (0.5, 0.7) | 0.6 (0.6, 0.7) | 0.6 (0.6, 0.7) | ||
| C-Index | 1.3 (1.3, 1.4) | 1.3 (1.2, 1.3) | 1.3 (1.3, 1.4) | 1.4 (1.3, 1.4) | 1.4 (1.3, 1.4) | ||
Values are expressed as the median (interquartile range) or percentage (%).
Abbreviations: ABSI, A Body Shape Index; BMI, body mass index; BRI, Body Roundness Index; C-index, Conicity Index; CKD, chronic kidney disease; CKM, cardiovascular-kidney-metabolic syndrome; CVD, cardiovascular disease; eGFR, estimated glomerular filtration rate; HDL-C, high-density lipoprotein cholesterol; RFM, relative fat mass; UACR, urinary albumin to creatinine ratio; SII, Systemic Immune-Inflammation Index; WC, waist circumference; WHR, waist-to-height ratio; WWI, Weight-adjusted Waist Index.
Participants in CKM stages 1–2 had comparatively low mortality, with 8.7% dying from all causes, 1.8% from cardiovascular disease, and 6.9% from non-cardiovascular causes. In contrast, mortality was substantially higher among those in CKM stages 3–4, with 45.9% all-cause, 14.1% cardiovascular, and 31.8% non-cardiovascular deaths (Supplementary Fig. 2).
Table 2 presents the associations between anthropometric indices and mortality
outcomes among patients with CKM stages 1–2. Q4 of BMI was linked to increased
cardiovascular mortality (HR 1.41, p = 0.020) and lower
non-cardiovascular mortality (HR 0.78, p = 0.002). Q4 of WC, BRI, RFM,
and WHtR were linked to increased cardiovascular mortality (HR 1.39 vs. 1.42 vs.
1.73 vs. 1.56, all p
| All-cause mortality | Cardiovascular mortality | Non-cardiovascular mortality | |||||
| HR (95% CI) | p | HR (95% CI) | p | HR (95% CI) | p | ||
| BMI | |||||||
| Q1 | Reference | Reference | Reference | ||||
| Q2 | 0.79 (0.69, 0.89) | 1.09 (0.77, 1.45) | 0.553 | 0.73 (0.64, 0.85) | |||
| Q3 | 0.81 (0.71, 0.92) | 0.001 | 1.04 (0.77, 1.40) | 0.802 | 0.77 (0.66, 0.88) | ||
| Q4 | 0.88 (0.77, 1.01) | 0.079 | 1.41 (1.05, 1.89) | 0.020 | 0.78 (0.68, 0.91) | 0.002 | |
| WC | |||||||
| Q1 | Reference | Reference | Reference | ||||
| Q2 | 0.86 (0.76, 0.98) | 0.030 | 0.88 (0.65, 1.19) | 0.416 | 0.86 (0.75, 0.99) | 0.045 | |
| Q3 | 0.83 (0.73, 0.95) | 0.008 | 0.97 (0.72, 1.32) | 0.874 | 0.80 (0.69, 0.94) | 0.004 | |
| Q4 | 0.99 (0.87, 1.13) | 0.920 | 1.39 (1.04, 1.85) | 0.024 | 0.90 (0.77, 1.05) | 0.192 | |
| BRI | |||||||
| Q1 | Reference | Reference | Reference | ||||
| Q2 | 0.81 (0.71, 0.92) | 0.001 | 0.95 (0.71, 1.28) | 0.747 | 0.78 (0.67, 0.90) | ||
| Q3 | 0.82 (0.72, 0.94) | 0.005 | 0.89 (0.65, 1.22) | 0.487 | 0.81 (0.70, 0.94) | 0.005 | |
| Q4 | 0.96 (0.84, 1.10) | 0.589 | 1.42 (1.06, 1.92) | 0.019 | 0.86 (0.74, 1.10) | 0.064 | |
| WWI | |||||||
| Q1 | Reference | Reference | Reference | ||||
| Q2 | 1.09 (0.78, 1.51) | 0.611 | 1.00 (0.85, 1.18) | 0.973 | 0.94 (0.80, 1.09) | 0.426 | |
| Q3 | 1.56 (0.83, 1.60) | 0.385 | 1.15 (0.98, 1.36) | 0.077 | 1.05 (0.90, 1.23) | 0.493 | |
| Q4 | 1.62 (1.16, 2.25) | 0.004 | 1.38 (1.17, 1.63) | 1.16 (1.09, 1.37) | 0.040 | ||
| ABSI | |||||||
| Q1 | Reference | Reference | Reference | ||||
| Q2 | 1.02 (0.87, 1.18) | 0.793 | 1.09 (0.78, 1.52) | 0.611 | 1.00 (0.84, 1.18) | 0.973 | |
| Q3 | 1.16 (1.01, 1.34) | 0.047 | 1.15 (0.83, 1.60) | 0.385 | 1.15 (0.98, 1.36) | 0.077 | |
| Q4 | 1.43 (1.23, 1.65) | 1.62 (1.16, 2.25) | 0.004 | 1.38 (1.17, 1.63) | |||
| RFM | |||||||
| Q1 | Reference | Reference | Reference | ||||
| Q2 | 0.94 (0.82, 1.07) | 0.376 | 1.11 (0.82, 1.47) | 0.491 | 0.90 (0.77, 1.04) | 0.163 | |
| Q3 | 0.94 (0.78, 1.13) | 0.540 | 1.47 (0.98, 2.19) | 0.057 | 0.83 (0.67, 1.03) | 0.091 | |
| Q4 | 0.98 (0.78, 1.21) | 0.857 | 1.73 (1.07, 2.80) | 0.025 | 0.84 (0.66, 1.07) | 0.174 | |
| WHtR | |||||||
| Q1 | Reference | Reference | Reference | ||||
| Q2 | 0.84 (0.74, 0.96) | 0.011 | 1.12 (0.82, 1.51) | 0.465 | 0.79 (0.68, 0.91) | 0.002 | |
| Q3 | 0.92 (0.81, 1.05) | 0.222 | 1.24 (0.92, 1.68) | 0.155 | 0.86 (0.75, 1.00) | 0.043 | |
| Q4 | 1.03 (0.89, 1.17) | 0.709 | 1.56 (1.56, 2.11) | 0.004 | 0.92 (0.86, 0.75) | 0.313 | |
| C-index | |||||||
| Q1 | Reference | Reference | Reference | ||||
| Q2 | 0.89 (0.77, 1.03) | 0.110 | 0.93 (0.67, 1.29) | 0.670 | 0.88 (0.75, 1.03) | 0.115 | |
| Q3 | 1.00 (0.87, 1.15) | 0.970 | 1.13 (0.83, 1.55) | 0.423 | 0.97 (0.83, 1.13) | 0.717 | |
| Q4 | 1.18 (1.03, 1.35) | 0.018 | 1.56 (1.14, 2.13) | 0.005 | 1.10 (0.94, 1.28) | 0.235 | |
Cox proportional hazards model was adjusted for age, sex, race and ethnicity, poverty income ratio, marital status, education, smoking status, alcohol consumption, physical activity, cardiovascular disease, hypertensive, diabetes, chronic kidney disease, stroke.
Abbreviations: ABSI, A Body Shape Index; BMI, body mass index; BRI, Body Roundness Index; CI, confidence interval; C-index, Conicity Index; CKM, cardiovascular-kidney-metabolic syndrome; HR, hazard ratio; RFM, relative fat mass; WC, waist circumference; WHtR, waist-to-height ratio; WWI, Weight-adjusted Waist Index.
RCS revealed non-linear associations between anthropometric indices and
mortality outcomes in CKM stages 1–2 patients (Fig. 1). For all-cause mortality
(Fig. 1a), BMI, WHtR, BRI, and C-index showed U-shaped relationships, with the
lowest risk observed at a BMI of 25–27 kg/m2 and a WHtR of around 0.5. In
contrast, WC and WWI demonstrated J-shaped curves, indicating a continuous
increase in risk with greater central adiposity. For cardiovascular mortality
(Fig. 1b), WC, WHtR, BRI, and C-index displayed steep J-shaped patterns, with
risk rising sharply at higher values. For non-cardiovascular mortality (Fig. 1c),
BMI retained a U-shaped association, with elevated risk at BMI
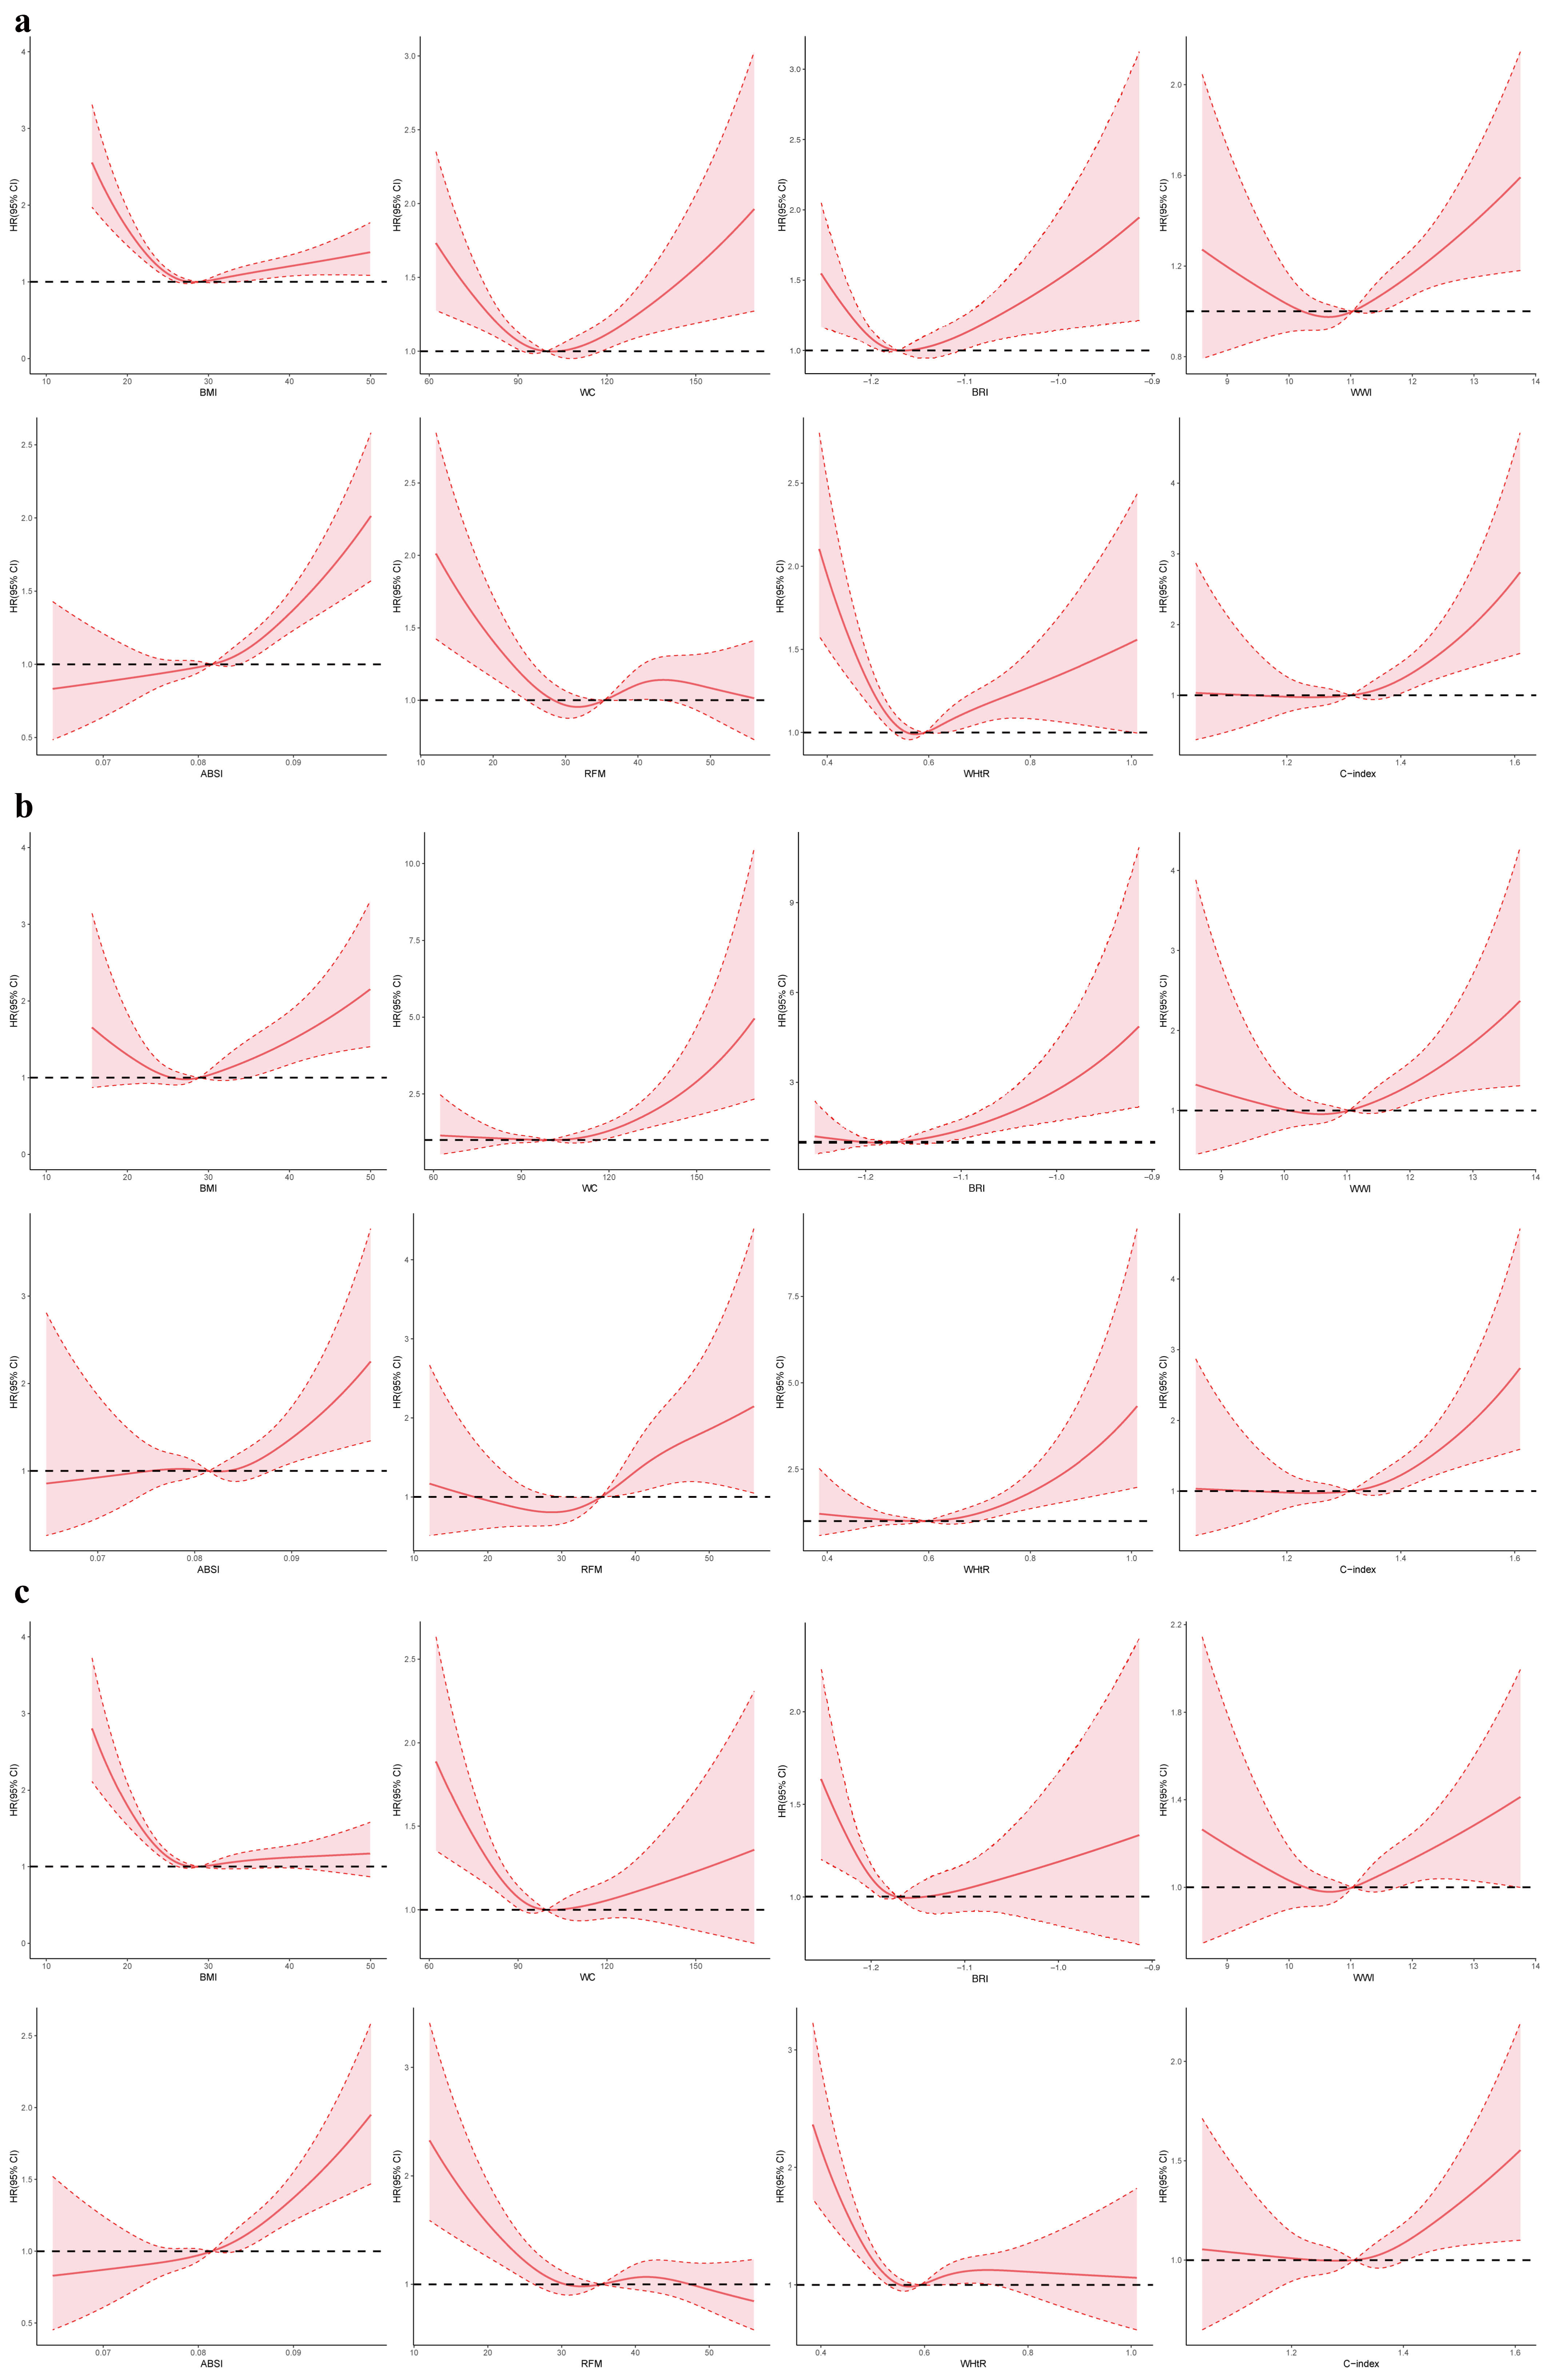 Fig. 1.
Restricted cubic spline modelling of the association between anthropometric indices and mortality among individuals with CKM stages 1–2. (a–c) correspond to all-cause, cardiovascular, and non-cardiovascular mortality, respectively. HR, hazard ratio; CI, confidence interval; CKM, cardiovascular-kidney-metabolic syndrome; ABSI, A Body Shape Index; BMI, body mass index; BRI, Body Roundness Index; C-index, Conicity Index; RFM, relative fat mass; WC, waist circumference; WHtR, waist-to-height ratio; WWI, Weight-adjusted Waist Index.
Anthropometric indices showed significant associations with mortality outcomes
in CKM stages 3–4 (Table 3). Q4 of BMI, WC, BRI, and WHtR were linked to
decreased all-cause mortality (HR 0.87 vs. 0.87 vs. 0.84 vs. 0.86, all p
| All-cause death | Cardiovascular death | Non-cardiovascular death | |||||
| HR (95% CI) | p | HR (95% CI) | p | HR (95% CI) | p | ||
| BMI | |||||||
| Q1 | Reference | Reference | Reference | ||||
| Q2 | 0.86 (0.78, 0.94) | 0.002 | 0.94 (0.90, 1.11) | 0.490 | 0.83 (0.74, 0.93) | ||
| Q3 | 0.78 (0.71, 0.86) | 0.85 (0.71, 1.01) | 0.062 | 0.76 (0.67, 0.85) | |||
| Q4 | 0.87 (0.78, 0.98) | 0.021 | 0.95 (0.78, 1.16) | 0.658 | 0.84 (0.74, 0.96) | 0.014 | |
| WC | |||||||
| Q1 | Reference | Reference | Reference | ||||
| Q2 | 0.84 (0.75, 0.93) | 0.89 (0.74, 1.08) | 0.245 | 0.82 (0.71, 0.92) | |||
| Q3 | 0.77 (0.69, 0.85) | 0.90 (0.75, 1.09) | 0.297 | 0.71 (0.63, 0.81) | |||
| Q4 | 0.87 (0.78, 0.97) | 0.014 | 0.93 (0.77, 1.14) | 0.530 | 0.85 (0.74, 0.96) | 0.012 | |
| BRI | |||||||
| Q1 | Reference | Reference | Reference | ||||
| Q2 | 0.78 (0.70, 0.86) | 0.85 (0.71, 1.03) | 0.102 | 0.75 (0.60, 0.85) | |||
| Q3 | 0.74 (0.66, 0.82) | 0.84 (0.69, 1.02) | 0.078 | 0.70 (0.62, 0.93) | |||
| Q4 | 0.84 (0.75, 0.94) | 0.002 | 0.90 (0.73, 1.11) | 0.355 | 0.81 (0.71, 0.93) | 0.003 | |
| WWI | |||||||
| Q1 | Reference | Reference | Reference | ||||
| Q2 | 0.96 (0.84, 1.12) | 0.639 | 1.32 (0.99, 1.76) | 0.051 | 0.85 (0.72, 1.01) | 0.065 | |
| Q3 | 0.95 (0.82, 1.08) | 0.425 | 1.24 (0.95, 1.63) | 0.118 | 0.85 (0.73, 1.00) | 0.050 | |
| Q4 | 1.01 (0.88, 1.16) | 0.832 | 1.35 (1.03, 1.76) | 0.029 | 0.91 (0.78, 1.06) | 0.242 | |
| ABSI | |||||||
| Q1 | Reference | Reference | Reference | ||||
| Q2 | 0.98 (0.84, 1.16) | 0.870 | 1.19 (0.87, 1.64) | 0.262 | 0.91 (0.75, 1.11) | 0.365 | |
| Q3 | 1.05 (1.03, 1.38) | 0.493 | 1.33 (0.98, 1.78) | 0.062 | 0.96 (0.80, 1.15) | 0.679 | |
| Q4 | 1.18 (1.03, 1.38) | 0.022 | 1.41 (1.06, 1.89) | 0.019 | 1.11 (0.94, 1.32) | 0.219 | |
| RFM | |||||||
| Q1 | Reference | Reference | Reference | ||||
| Q2 | 0.97 (0.88, 1.07) | 0.562 | 1.07 (0.90, 1.27) | 0.426 | 0.93 (0.83, 1.05) | 0.226 | |
| Q3 | 1.03 (0.89, 1.18) | 0.691 | 1.03 (0.79, 1.33) | 0.817 | 1.03 (0.86, 1.22) | 0.737 | |
| Q4 | 0.84 (0.71, 1.00) | 0.054 | 0.91 (0.66, 1.25) | 0.563 | 1.04 (1.01, 1.06) | 0.046 | |
| WHtR | |||||||
| Q1 | Reference | Reference | Reference | ||||
| Q2 | 0.84 (0.75, 0.93) | 0.95 (0.78, 1.16) | 0.663 | 0.78 (0.69, 0.89) | |||
| Q3 | 0.82 (0.74, 0.90) | 0.91 (0.75, 1.10) | 0.350 | 0.78 (0.69, 0.88) | |||
| Q4 | 0.86 (0.77, 0.96) | 0.007 | 1.00 (0.82, 1.21) | 0.998 | 0.81 (0.71, 0.92) | ||
| C-index | |||||||
| Q1 | Reference | Reference | Reference | ||||
| Q2 | 0.81 (0.69, 0.95) | 0.011 | 1.02 (0.78, 1.33) | 0.893 | 0.86 (0.75, 0.99) | 0.037 | |
| Q3 | 0.76 (0.65, 0.88) | 1.15 (0.89, 1.46) | 0.273 | 0.86 (0.76, 0.98) | 0.023 | ||
| Q4 | 0.89 (0.77, 1.04) | 0.148 | 1.09 (0.86, 1.39) | 0.460 | 0.94 (0.84, 1.07) | 0.398 | |
Cox proportional hazards model was adjusted for age, sex, race and ethnicity, poverty income ratio, marital status, education, smoking status, alcohol consumption, physical activity, cardiovascular disease, hypertensive, diabetes, chronic kidney disease, stroke.
Abbreviations: ABSI, A Body Shape Index; BMI, body mass index; BRI, Body Roundness Index; C-index, Conicity Index; CI, confidence interval; CKM, cardiovascular-kidney-metabolic syndrome; HR, hazard ratio; RFM, relative fat mass; WC, waist circumference; WHtR, waist-to-height ratio; WWI, Weight-adjusted Waist Index.
RCS demonstrated non-linear associations between anthropometric indices and mortality outcomes in CKM stages 3–4 patients (Fig. 2). For all-cause mortality (Fig. 2a), BMI, WC, BRI, WWI, WHtR, and C-index showed U-shaped relationships, with the lowest risk observed at a BMI of 25–27 kg/m2, WC of 95–105 cm, and WHtR around 0.5. In contrast, ABSI exhibited a J-shaped curve, indicating a continuous adverse effect of central adiposity. For cardiovascular mortality (Fig. 2b), BMI, WC, BRI, and WHtR displayed U-shaped patterns, whereas WWI, ABSI, and C-index followed J-shaped trends. For non-cardiovascular mortality (Fig. 2c), BMI, WC, BRI, WWI, WHtR, and C-index again showed U-shaped associations, while ABSI exhibited a J-shaped curve and RFM remained largely flat.
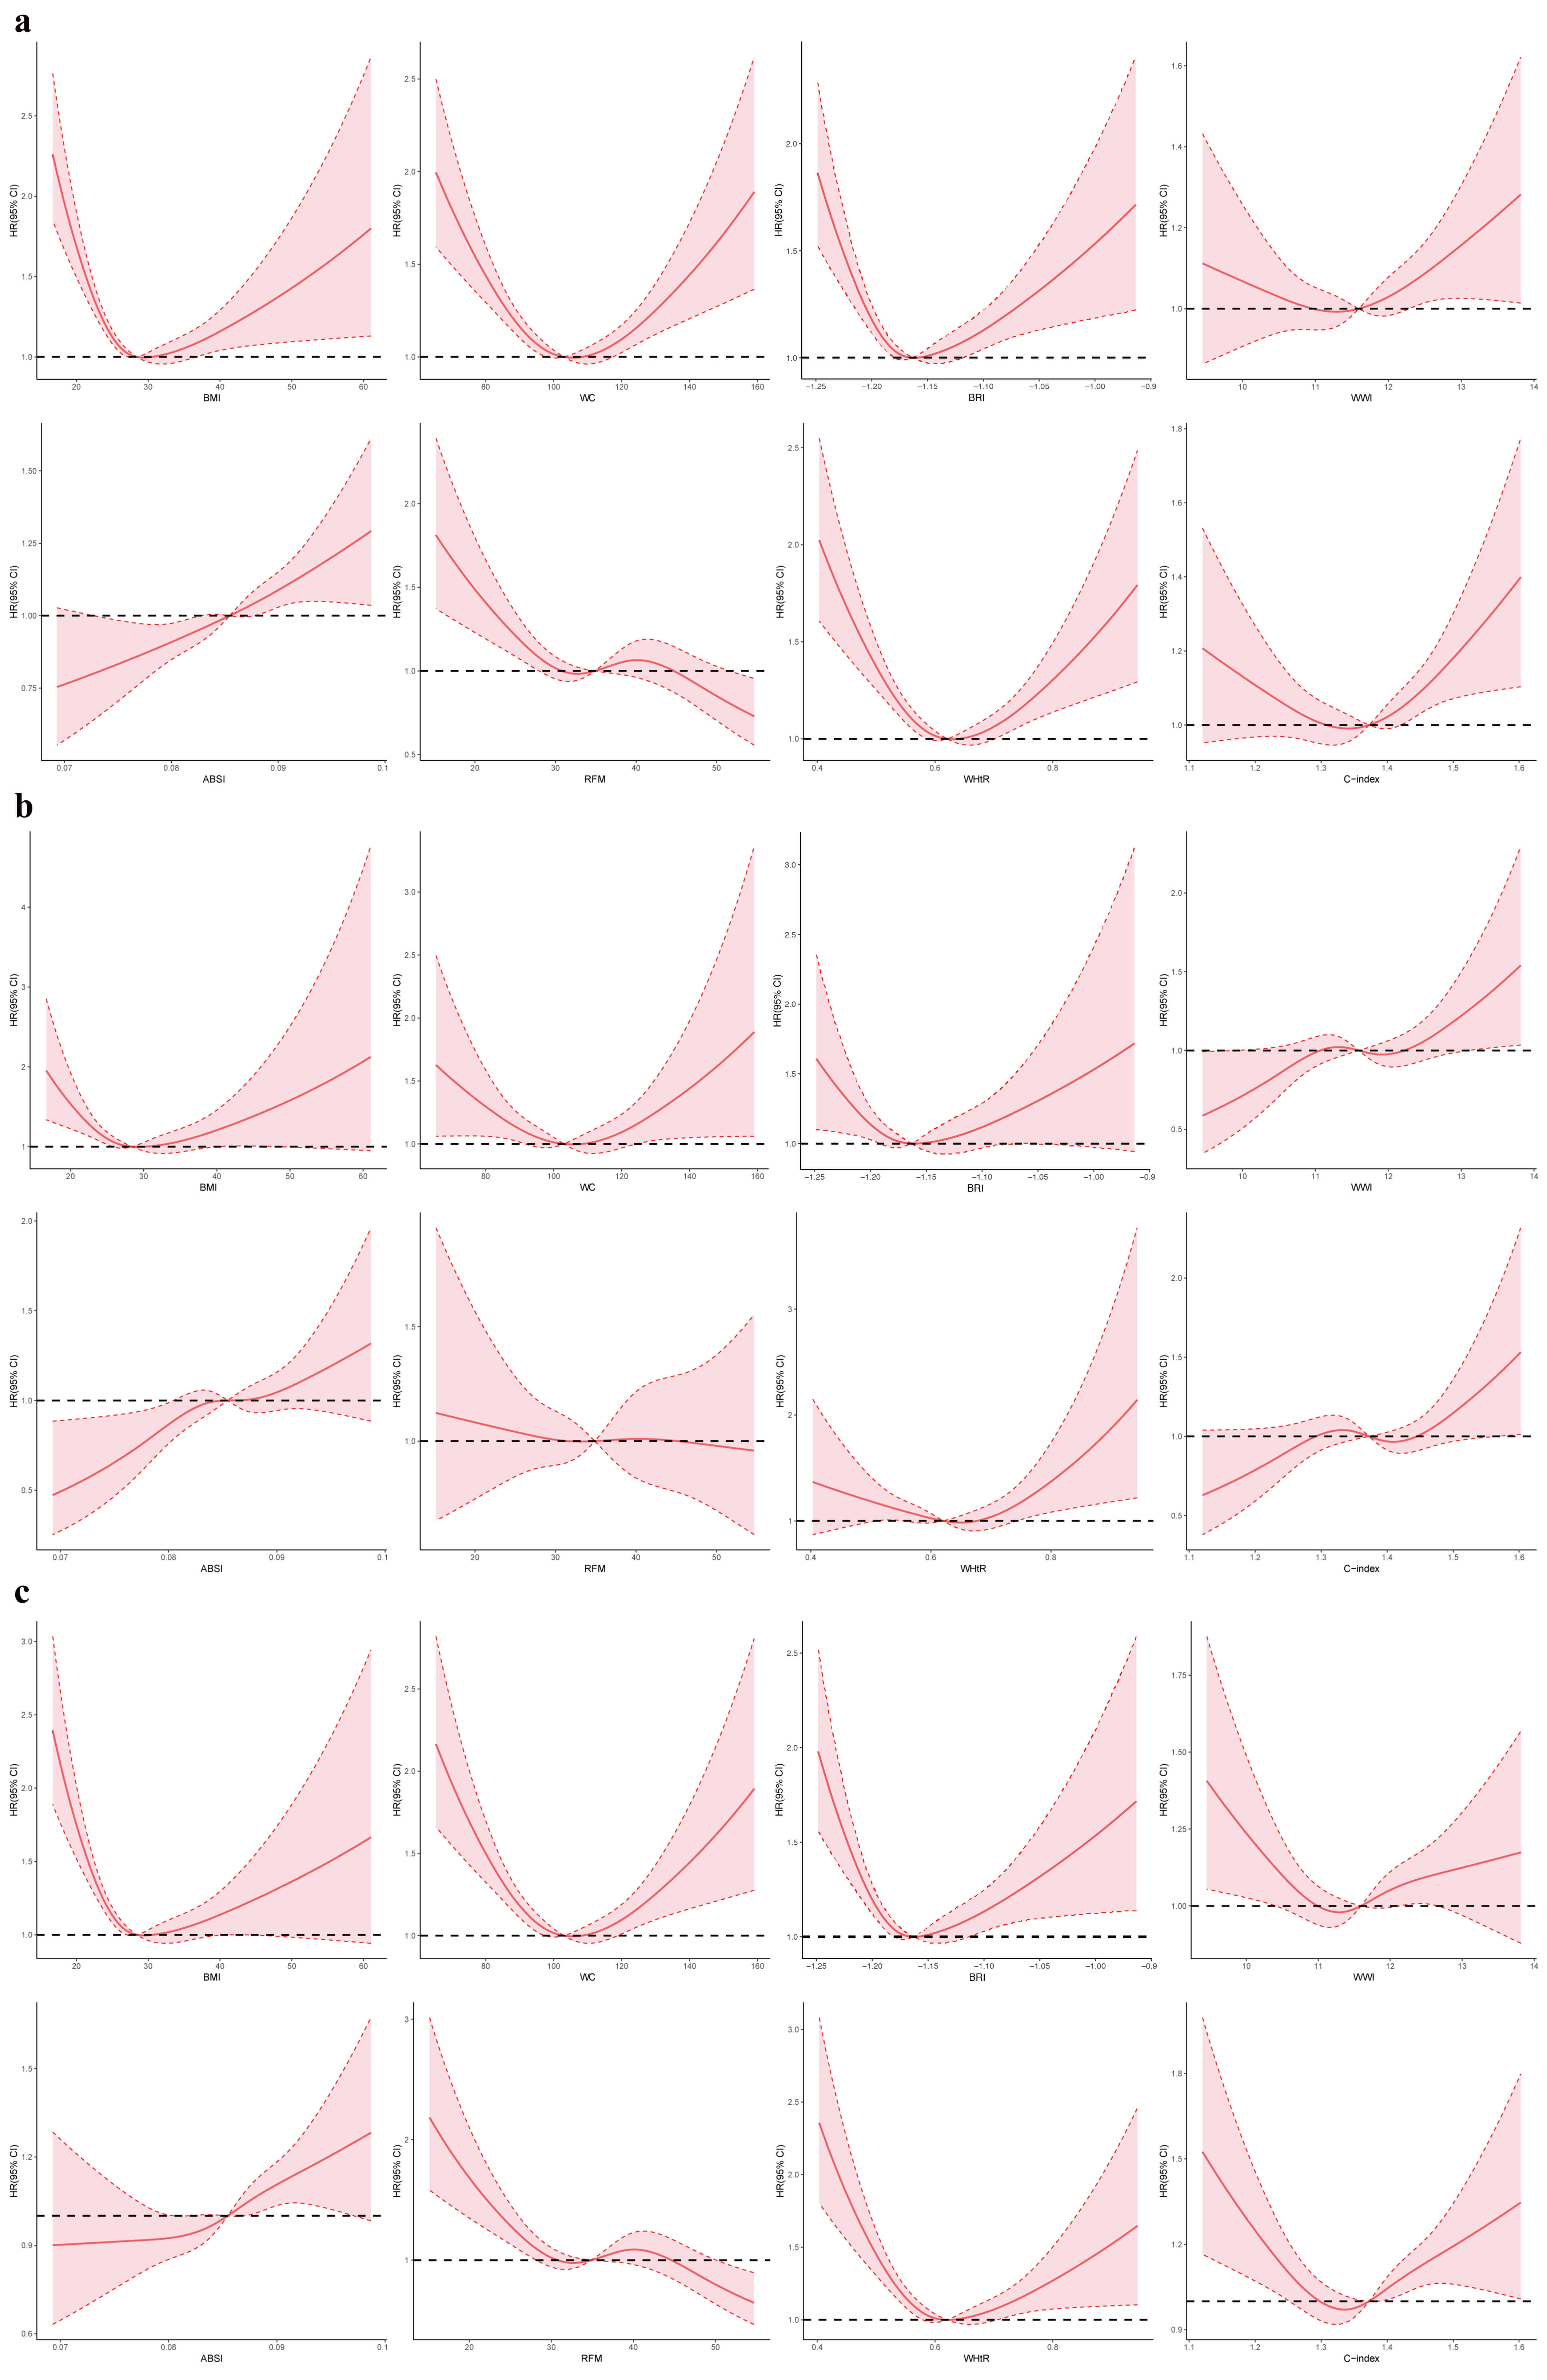 Fig. 2.
Restricted cubic spline modelling of the association between anthropometric indices and mortality among individuals with CKM stages 3–4. (a–c) correspond to all-cause, cardiovascular, and non-cardiovascular mortality, respectively. HR, hazard ratio; CI, confidence interval; CKM, cardiovascular-kidney-metabolic syndrome; ABSI, A Body Shape Index; BMI, body mass index; BRI, Body Roundness Index; C-index, Conicity Index; RFM, relative fat mass; WC, waist circumference; WHtR, waist-to-height ratio; WWI, Weight-adjusted Waist Index.
Several anthropometric indices were significantly associated with advanced CKM
stage. Participants in the highest quartile (Q4) of BMI, WC, WWI, RFM, WHtR, and
C-index had increased odds of advanced CKM (ORs: 1.19, 1.98, 1.34, 1.54, 1.35,
and 1.30, respectively; all p
RCS analysis revealed non-linear relationships between anthropometric indices and advanced CKM stage (Fig. 3). A J-shaped pattern was observed for BMI, WC, BRI, WWI, WHtR, and C-index, indicating progressively increased risk with higher central adiposity. ABSI and RFM displayed a U-shaped association.
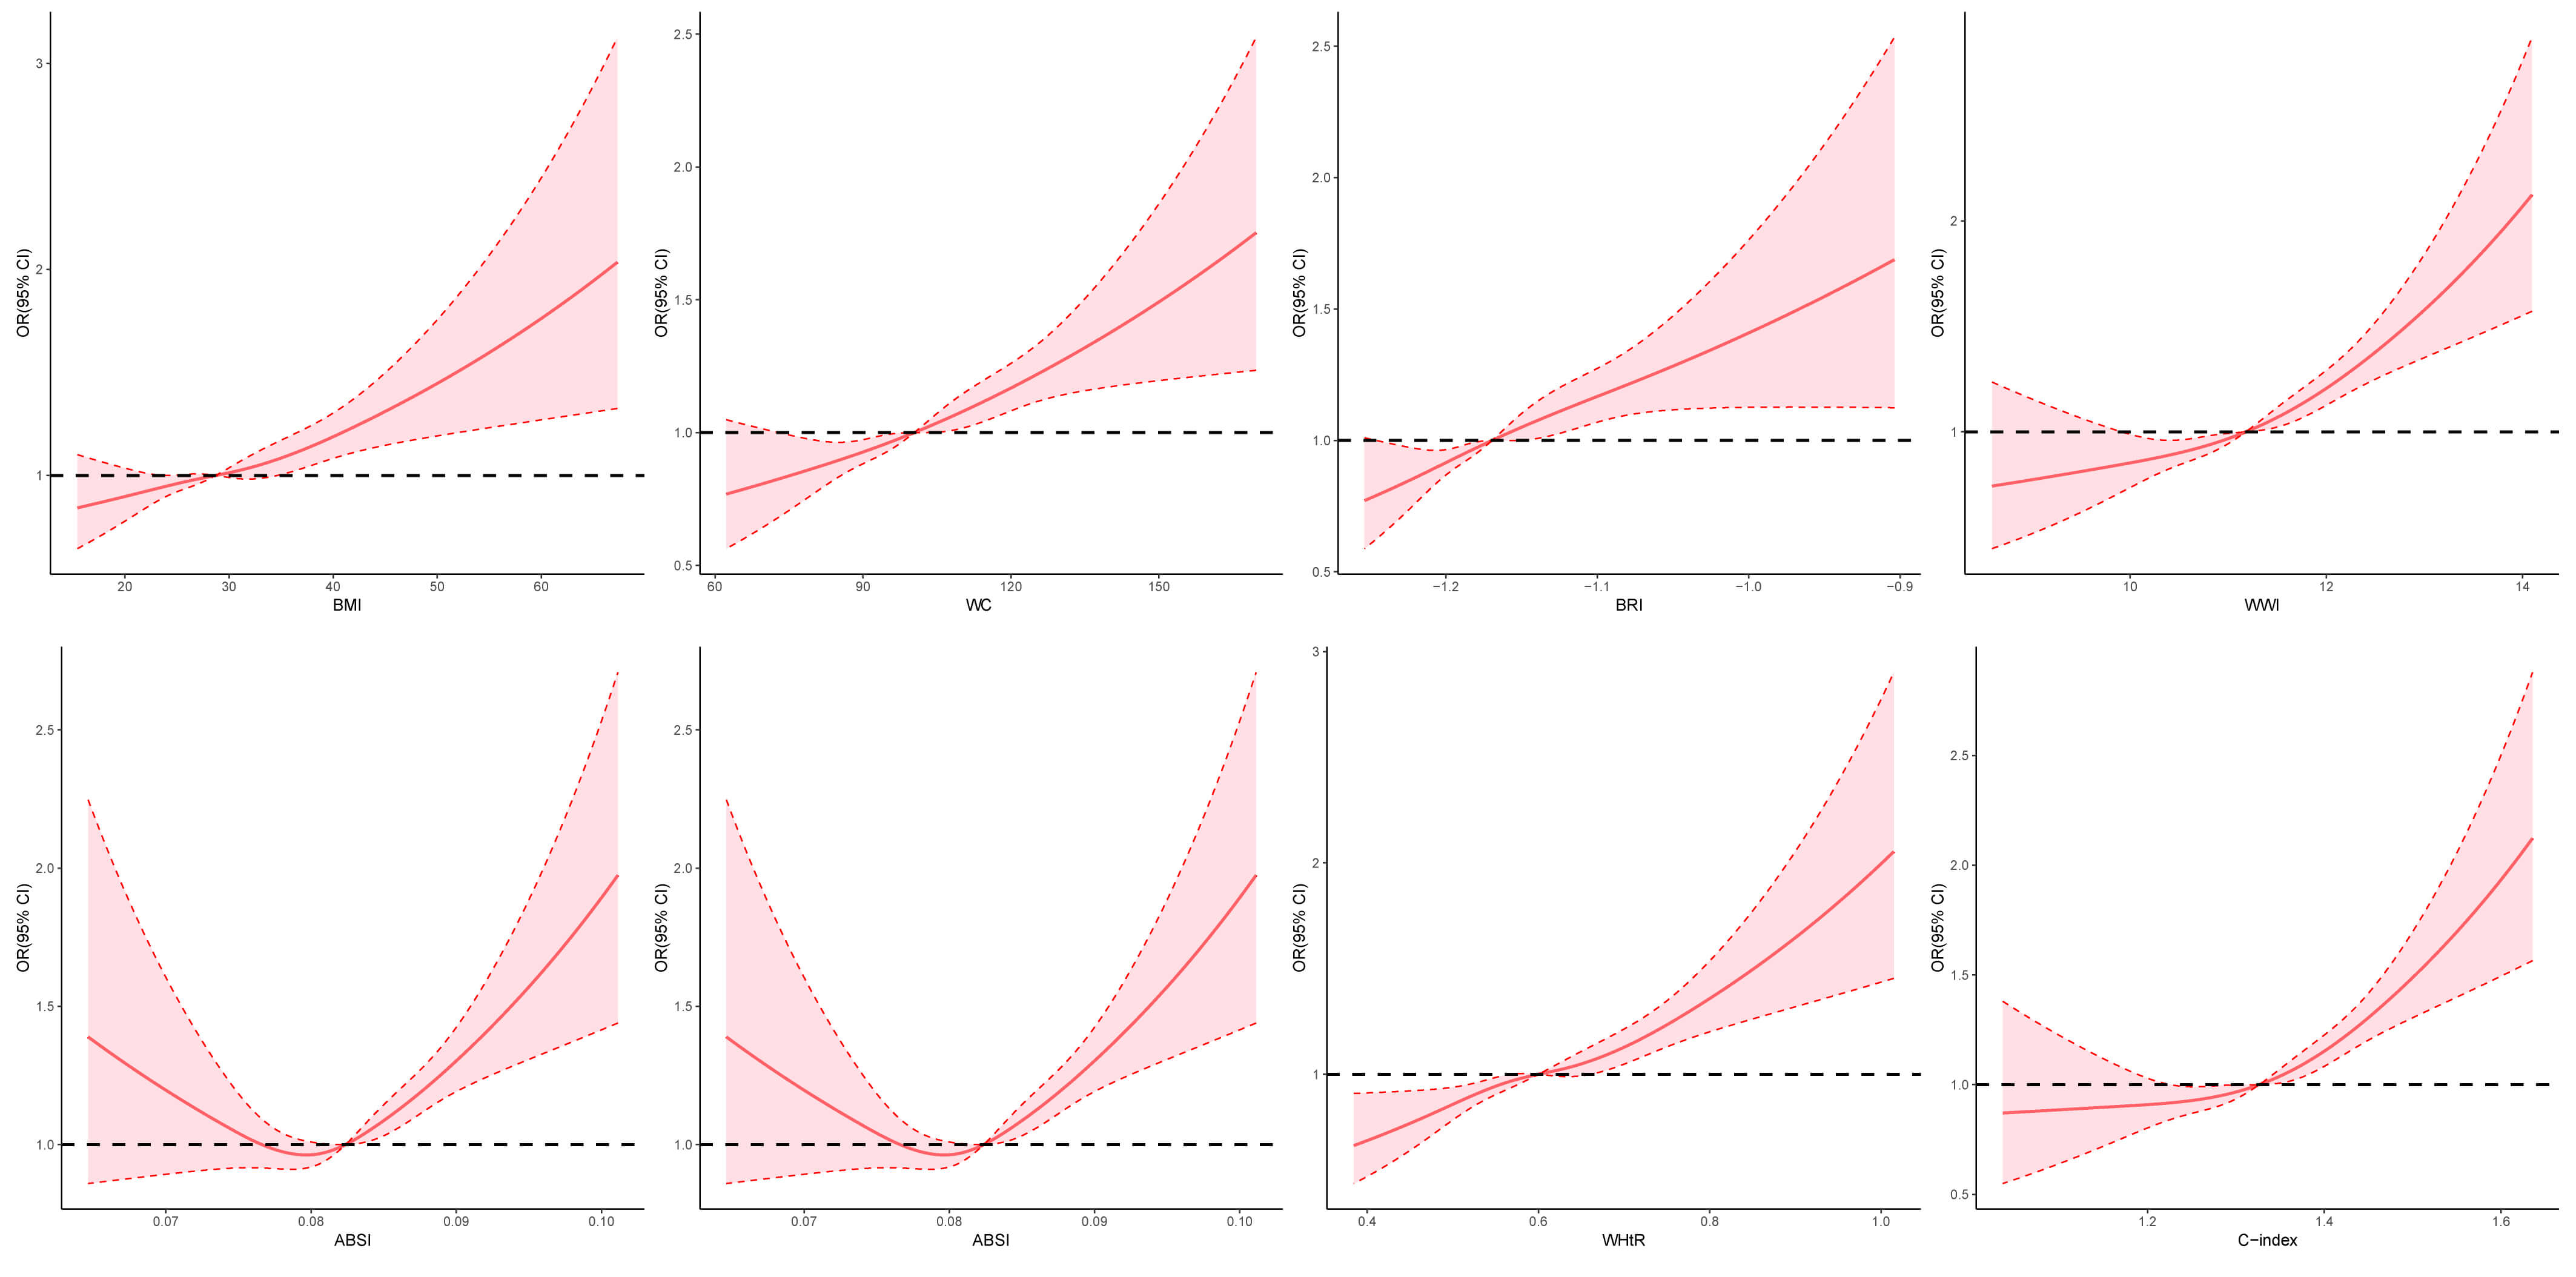 Fig. 3.
Restricted cubic spline modeling of the associations between anthropometric indices and CKM progression. ABSI, A Body Shape Index; BMI, body mass index; BRI, Body Roundness Index; C-index, Conicity Index; CI, confidence interval; CKM, cardiovascular-kidney-metabolic syndrome; OR, odds ratio; RFM, relative fat mass; WC, waist circumference; WHtR, waist-to-height ratio; WWI, Weight-adjusted Waist Index.
The predictive efficacy of various anthropometric indices for mortality outcomes in CKM stage 1–2 patients (Supplementary Table 8) showed that ABSI demonstrates the highest predictive power for all-cause, cardiovascular, and non-cardiovascular mortalities (AUC 0.65 vs. 0.64 vs. 0.65). While most of the other indices (BMI, WC, BRI, WWI, RFM, WHtR, C-index, VAI, LAP, WHR) are significantly associated with mortality outcomes, BAI and AVI showed no statistically significant relationship with mortality (Fig. 4, Supplementary Figs. 3,4).
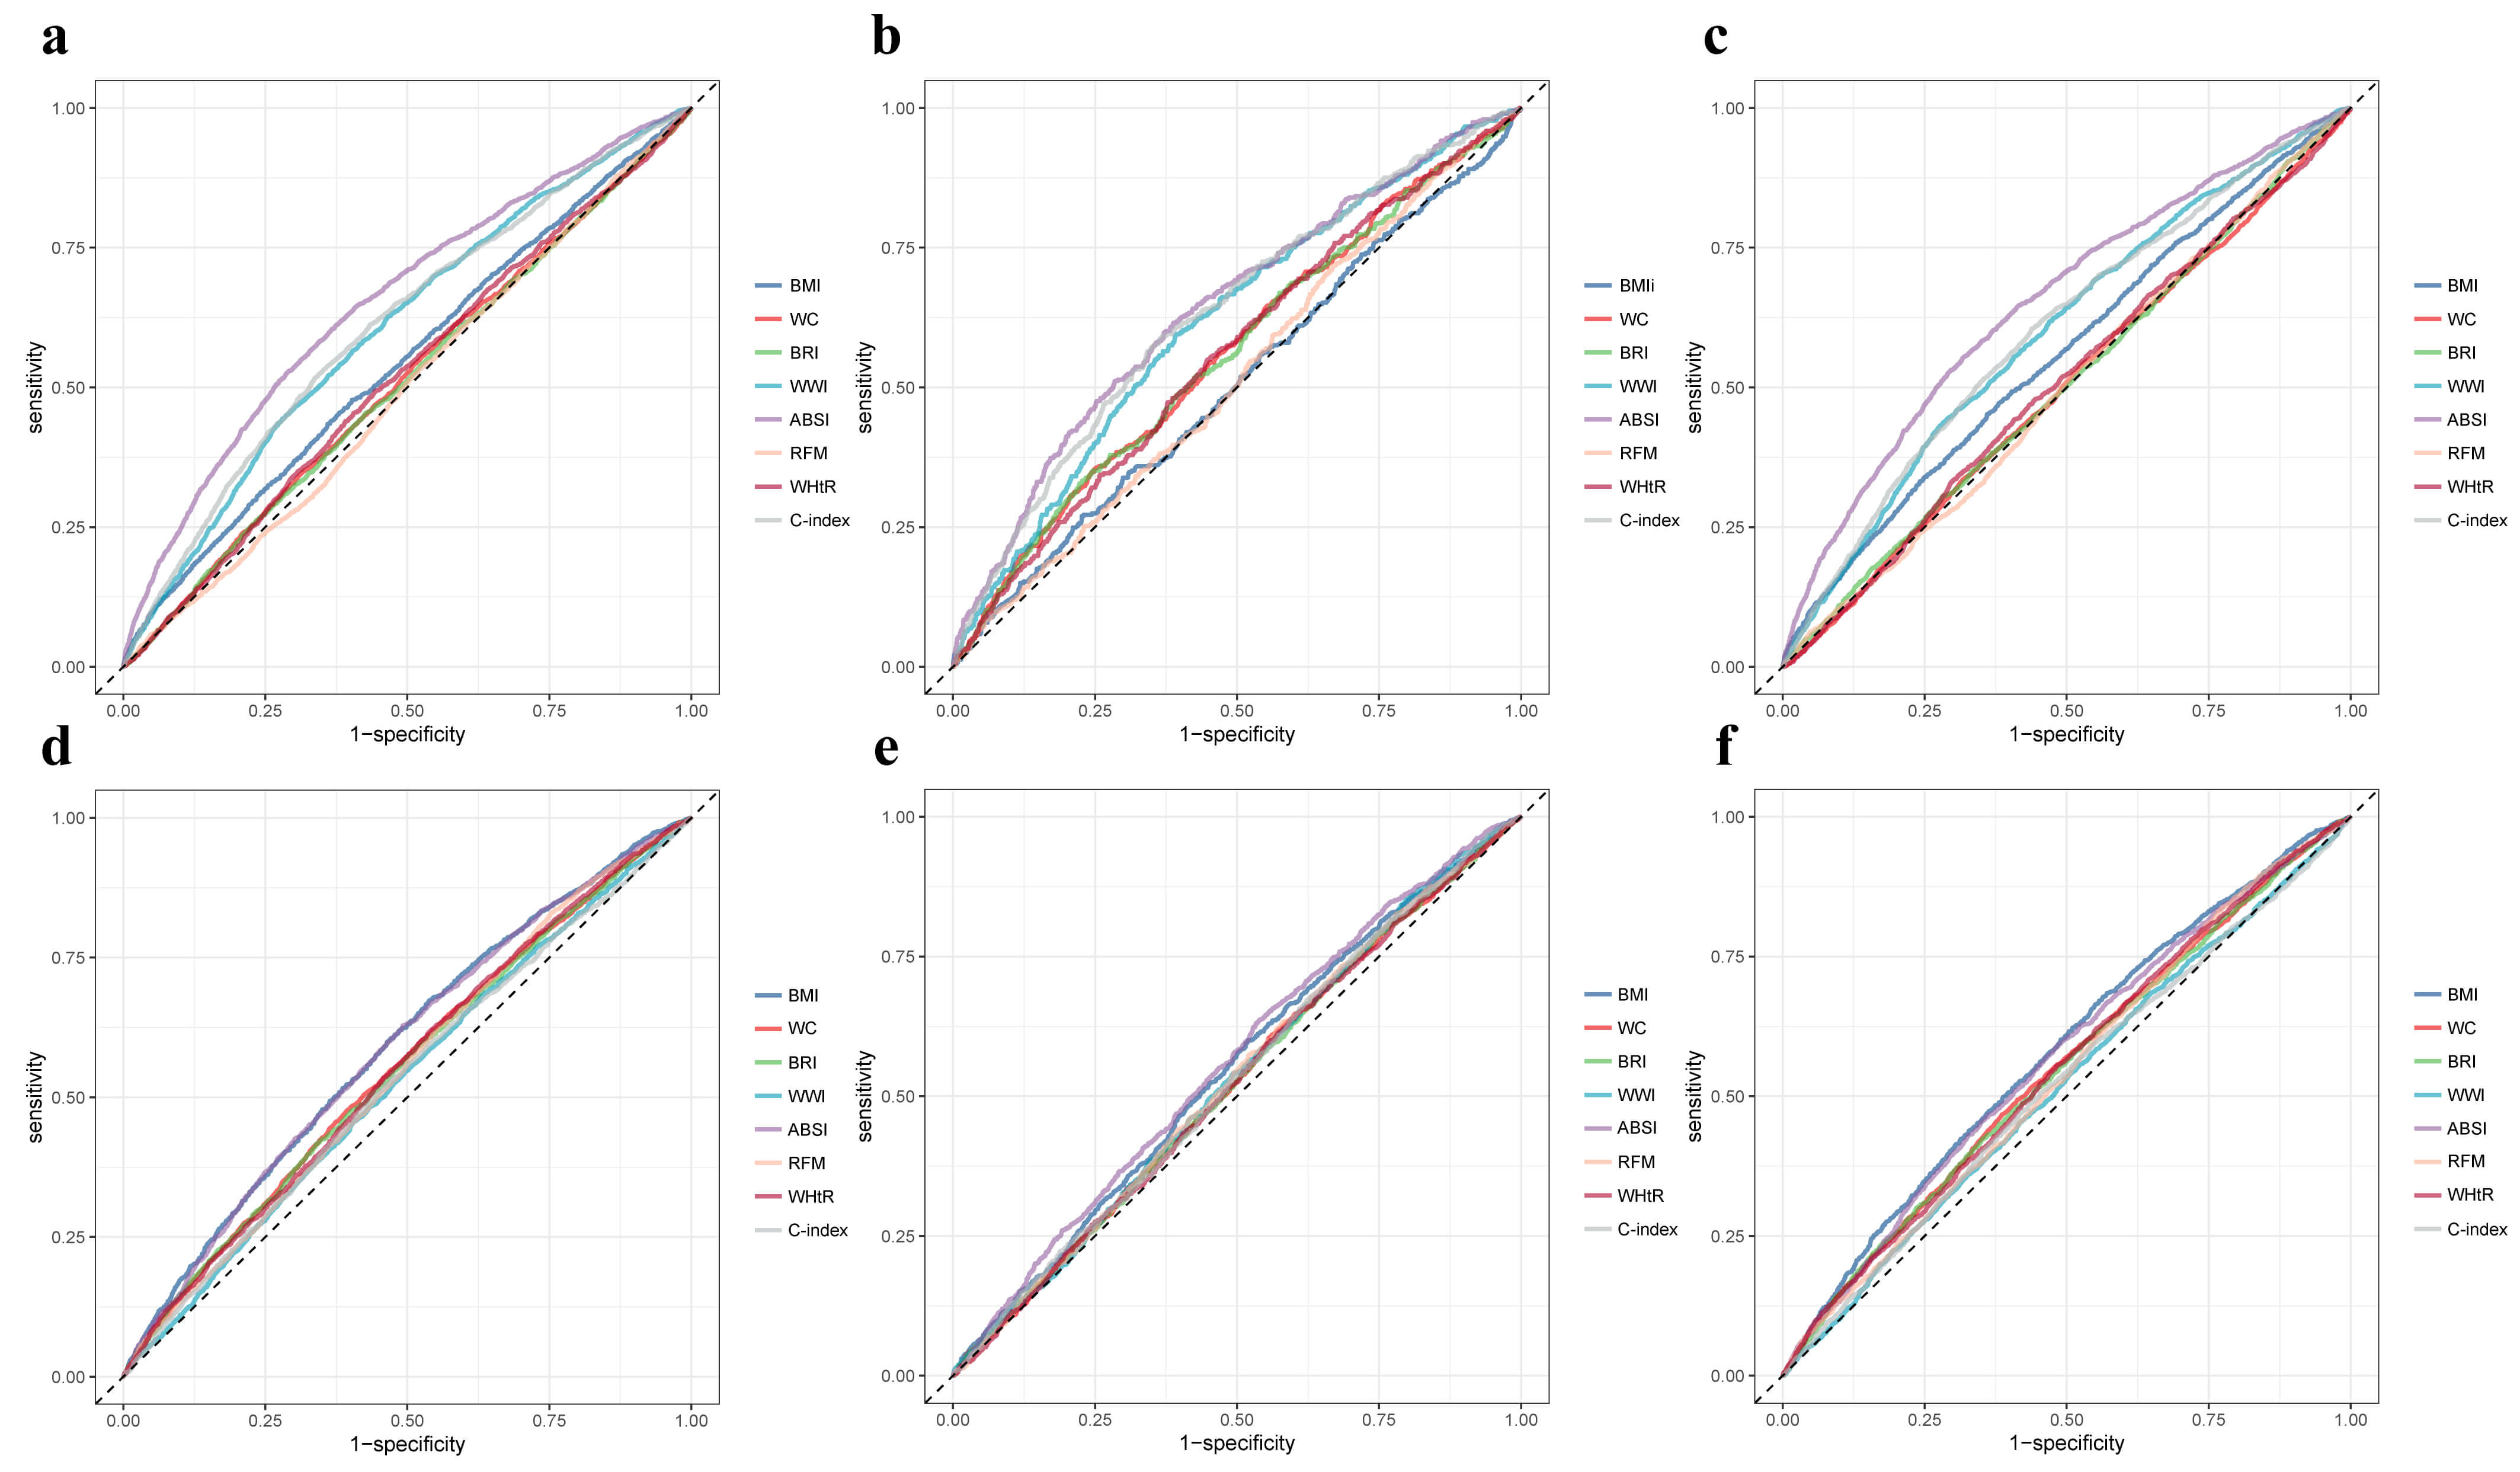 Fig. 4.
Receiver operating characteristic curves for associations between anthropometric indices and mortality outcomes in CKM stage 1–2 or 3–4 patients. (a–c) correspond to CKM stage 1–2, and (d–f) correspond to CKM stage 3–4, showing all-cause, cardiovascular, and non-cardiovascular mortality, respectively. ABSI, A Body Shape Index; BMI, body mass index; BRI, Body Roundness Index; C-index, Conicity Index; RFM, relative fat mass; WC, waist circumference; WWI, Weight-adjusted Waist Index; WHtR, waist-to-height ratio.
In patients with CKM stages 3–4, the predictive efficacy of various anthropometric indices for all-cause, cardiovascular, and non-cardiovascular mortality is generally low (Supplementary Table 9). Most indices show AUC values ranging from 0.52 to 0.55, and the majority are not statistically significant. This suggests that as CKM progresses to the middle and late stages, the predictive power of anthropometric indices for mortality declines (Fig. 4, Supplementary Figs. 3,4).
The discriminative performance of various anthropometric indices for identifying
advanced CKM (stage 3/4) is summarised in Supplementary Table 10. Among
them, ABSI demonstrated the highest discriminative ability (AUC = 0.73), followed
by WWI (AUC = 0.70), C-index (AUC = 0.69), and WHR (AUC = 0.64). While most other
indices (BMI, WC, BRI, WHtR, VAI, LAP) were significantly associated with
higher-stage CKM (p
After further adjusting for confounding factors (frailty score, antidiabetic
medication, antihypertensive medication, lipid-lowering medication), the
Supplementary Table 11 demonstrated the association between
obesity-related indicators and mortality in stage 1–2 CKM patients, revealing
that Q4 of BMI, WWI, and ABSI were linked to increased all-cause mortality (HR
0.80 vs. 1.18 vs. 1.41, all p
After excluding patients who died within the 2-year follow-up period, the
relationship between obesity-related indices and mortality rates in patients with
stage 3–4 CKM is shown in the Supplementary Table 13. Q4 of BMI, WC,
BRI, and ABSI were linked to increased all-cause mortality (HR 0.91 vs. 0.92 vs.
0.88 vs. 1.28, all p
Based on a large NHANES cohort (N = 28,911), this study is the first to systematically evaluate the associations between 13 anthropometric indices and both mortality and CKM staging status. Higher quartiles of BMI, WC, WWI, and ABSI were significantly associated with increased risks of all-cause, cardiovascular, and non-cardiovascular mortality among individuals with CKM stages 1–2. In participants with stages 3–4, the predictive utility of most indices declined. However, WWI, C-index, and WHtR remained significantly associated with advanced CKM stage, with ABSI demonstrating the highest discriminatory performance. Importantly, as CKM staging was assessed cross-sectionally, observed associations with advanced stage do not imply causality. These findings support the relevance of anthropometric indices for early risk stratification in CKM syndrome.
Composite anthropometric indices such as BMI, ABSI, and WWI integrate body weight, waist circumference, and height, accounting for their nonlinear relationships. These measures provide a more comprehensive representation of an individual’s overall adiposity burden and body shape composition. BMI is the most commonly used index; however, it cannot distinguish between fat and muscle mass and fails to capture fat distribution. ABSI incorporates body shape factors and has shown superior predictive power for mortality risk and cardio-renal-metabolic diseases compared to traditional BMI [34]. WWI, which combines weight and waist circumference, more sensitively detects central obesity and has gained increasing attention in recent years [35]. Simple anthropometric ratios such as WC, WHR, and WHtR utilize basic body measurements (e.g., waist, hip circumference, height) to reflect the relative distribution of body fat. WHR is used to assess whether fat is predominantly distributed in the abdominal region. WHtR is more suitable for screening visceral fat accumulation [36, 37]. These indicators are easy to obtain and offer practical value for preliminary risk assessment. Shape- and volume-related indices such as BRI, C-index, and AVI can indirectly assess abdominal fat accumulation. BRI reflects the trend of central obesity [38], C-index emphasizes the degree of abdominal fat concentration [39], and AVI estimates abdominal fat volume. These indices help identify fat redistribution and increased intra-abdominal pressure, which may indicate a heightened risk of structural organ damage [40]. Body fat estimation indices such as BAI and RFM are primarily used to estimate total body fat percentage. BAI is calculated from hip circumference and height, while RFM incorporates sex, height, and waist circumference, demonstrating more stable performance in large populations [41, 42]. These measures are suitable for health screening and epidemiological research but are limited in assessing fat distribution and organ-specific damage risk [43]. Visceral fat metabolism-related indices such as LAP and VAI directly reflect visceral fat functionality and are important markers of insulin resistance and lipotoxicity [44]. These indices are of critical importance for the early identification of CKM syndrome risk.
In CKM stages 1–2 (the metabolic risk accumulation phase), our findings are consistent with previous studies: central obesity is a strong driver of mortality risk [45]. Q4 of WC (HR 1.39), WHtR (HR 1.56), and BRI (HR 1.42) were significantly associated with increased cardiovascular mortality risk. Moreover, RCS curves displayed J-shaped patterns (e.g., for WC and WWI), supporting the mechanism by which visceral fat promotes atherosclerosis through inflammation and insulin resistance [46]. ABSI and WWI exhibited broad adverse effects in early CKM stages. The Q4 of ABSI and WWI were significantly associated with increased risks of all-cause mortality (HR 1.43 vs. 1.62), cardiovascular mortality (HR 1.62 vs. 1.38), and non-cardiovascular mortality (HR 1.38 vs. 1.16). These findings align with their focus on height- and weight-adjusted central obesity [47], suggesting that these indices may better capture the pathological effects of visceral fat. In CKM stages 3–4 (the organ damage phase), the associations between obesity indices and mortality shifted: the Q4 of general or abdominal obesity measures such as BMI, WC, and WHtR were associated with decreased risks of all-cause mortality (HRs: 0.87, 0.87, 0.86) and non-cardiovascular mortality (HRs: 0.84, 0.85, 0.81). The RCS curves exhibited a U-shaped pattern, with the lowest mortality risk observed in the overweight range-approximately BMI around 25–27 kg/m2 WC around 105 cm, and WHtR around 0.5. This “obesity paradox” has been previously reported in patients with advanced heart failure and CKD [48, 49]. Potential mechanisms include the dominance of muscle wasting (cachexia) as a primary mortality driver in late-stage disease, where moderate fat reserves may serve as an energy buffer [50]. Low BMI may reflect systemic wasting and inflammation, accelerating organ failure. Traditional obesity indices such as BMI cannot distinguish between fat and muscle mass [51]. However, in advanced CKM stages, higher quartiles of ABSI (HR 1.41) and WWI (HR 1.35) were significantly associated with increased cardiovascular mortality risk. This suggests that even in the context of the “obesity paradox”, visceral fat accumulation continues to exacerbate cardiovascular damage through mechanisms such as thrombogenesis and oxidative stress [52, 53]. The lasting link between ABSI/WWI and mortality in advanced CKM stages likely reflects their ability to capture central fat and body shape, indicating visceral fat, metabolic dysfunction, and inflammation-factors still important in later CKM [54]. In contrast, BMI and WC become less reliable as fluid retention, muscle loss, and illness distort body size, weakening their predictive power for mortality in CKM stages 3–4 [28]. From a clinical perspective, it is important to consider whether newer anthropometric indices such as ABSI and WWI offer meaningful advantages over conventional measures like BMI and WC. In contrast, BMI and WC are already routinely assessed in clinical and screening settings and are easily interpretable for patients and clinicians. Therefore, our findings suggest that ABSI and WWI may have the greatest near-term value as adjunct tools to refine risk stratification in individuals who are already considered at elevated CKM risk (e.g., patients with high WC but ‘normal’ BMI), rather than as immediate replacements for traditional anthropometric measures in general screening.
The most clinically relevant finding is the superior discriminatory ability of
ABSI (AUC = 0.73) for distinguishing advanced CKM stage (stages 3–4), clearly
outperforming traditional indices such as BMI (AUC = 0.64) and WC (AUC = 0.62).
Its advantage lies in its unique mathematical construction (ABSI = WC /
[BMI2/3
Given the growing global burden of obesity and the CKM syndrome, the findings of this study are of significant clinical and public health relevance. Validated anthropometric indices can help in the early identification of high-risk individuals, enabling timely interventions before the onset of irreversible organ damage. ABSI and WWI, in particular, may serve as valuable tools in clinical risk stratification algorithms due to their strong associations with both mortality and CKM progression. Moreover, the diminished predictive capacity of obesity indices in advanced CKM stages underscores the need to shift focus toward multimorbidity management and integrated care in late-stage disease. Highlighting the need for more nuanced obesity management strategies throughout the entire CKM disease continuum. Furthermore, building on previous medicine studies that have applied clustering and machine learning approaches for risk stratification and management [59, 60, 61], future research may consider integrating anthropometric indices into such frameworks to enhance primary and secondary prevention in CKM syndrome. These results have practical value for early intervention. People with higher waist or body fat measures should receive weight management support, including diet, exercise, and behavior guidance. Those at higher risk need closer monitoring of blood sugar, lipids, and blood pressure for timely treatment adjustments. When body measures exceed risk thresholds, clinicians may refer patients to nutrition, exercise, or health coaching programs to improve adherence. These steps complement existing cardiovascular and kidney risk management guidelines.
Our study has several limitations. First, as an observational study, it is difficult to establish a causal relationship between anthropometric indices and mortality risk in CKM patients. In addition, the discriminatory ability of these indices for advanced CKM stage was assessed using cross-sectional data, which limits inferences about temporal or causal associations. Further prospective studies are needed to validate and strengthen these findings. Second, some advanced indices (e.g., VAI and LAP) require laboratory parameters, and the substantial proportion of missing data for hip circumference reduced the sample size, potentially introducing bias or limiting the robustness of the results. Third, the study population was drawn from the NHANES CKM cohort. Data incompleteness and reliance on self-reported information may have led to misclassification of CKM stages, thereby affecting the accuracy of the findings. Fourth, although multiple potential confounders were adjusted for, residual confounding due to unmeasured variables (e.g., dietary patterns, medication use) cannot be ruled out and may have affected the reliability of the results. Fifth, we excluded participants with missing key covariates or incomplete follow-up. Although this improves model consistency, it may introduce selection bias if excluded individuals differ from those included in health status, access to care, or mortality risk. As a result, the observed associations may not fully reflect the true relationships in the broader population. Lastly, the findings may not be generalizable to populations outside the United States, which may limit the external applicability of the study. Further validation in diverse populations is needed to assess the generalizability of these findings, particularly in non-CKM populations and those with different racial or regional backgrounds. Additional prospective, multicenter studies and replication in external cohorts are necessary to supplement and refine these conclusions.
This study demonstrated that multiple anthropometric indices, particularly ABSI, WWI, WHtR, and C-index, are significantly associated with both mortality and advanced CKM stage. The findings highlight the potential clinical utility of incorporating such indices into risk stratification frameworks for earlier identification of high-risk individuals. While causal inference remains limited by the observational nature of the study, these results support the need for further prospective research to evaluate whether targeted interventions guided by anthropometric profiles can improve outcomes and inform precision prevention strategies for CKM syndrome.
Data from the National Health and Nutrition Examination Survey (NHANES) are publicly accessible. Interested researchers can obtain the data by making request through the NHANES website at https://www.cdc.gov/nchs/nhanes/index.html.
MZ: Writing—review & editing, Writing—original draft, Visualisation, Validation, Formal analysis, Data curation, Conceptualisation. CL: Writing—review & editing, Visualisation, Validation, Formal analysis, Data curation, Conceptualisation. YC: Conceptualisation, Methodology, Formal analysis, Validation, Writing—review & editing, Supervision. All authors read and approved the final manuscript. All authors have participated sufficiently in the work and agreed to be accountable for all aspects of the work.
This research was conducted using data from the National Health and Nutrition Examination Survey (NHANES), which are publicly accessible and fully anonymized. As such, this analysis does not meet the definition of human subject research and did not require institutional review board (IRB) approval. The NHANES protocol had already received ethical clearance from the National Center for Health Statistics (NCHS) Ethics Review Board, and all participants had provided written informed consent for the interview and examination components. Personally identifiable information is securely retained by the NCHS and is not publicly released. For this study, the use of de-identified, publicly available data did not necessitate additional consent. The analysis complies with ethical guidelines and institutional policies, as it poses no additional risk to participants.
We would like to extend our heartfelt gratitude to all the staff for their significant contributions and to all the participants who enrolled in the NHANES program.
This research received no external funding.
The authors declare no conflict of interest.
Supplementary material associated with this article can be found, in the online version, at https://doi.org/10.31083/RCM46650.
References
Publisher’s Note: IMR Press stays neutral with regard to jurisdictional claims in published maps and institutional affiliations.